Final report for LNC16-381
Project Information
Minimizing reliance on harvested feeds through grazing and extending the grazing season beyond that which is typical in western ND is a management strategy that enhances economic and environmental stability, especially when grazing is integrated into a diverse crop rotation. Systems integration in LNC11-335 identified that labor and inputs were reduced, soil fertility and crop yield improved, delayed feedlot entry of yearlings reduced days on feed and increased profitability, cow winter feed cost was reduced 2.8 times, and quality of life improved. Consumer demand for forage-finished beef is increasing by 25-30% per year and integrating forage-finished beef with fiber-based supplementation into the established crop rotation is a logical research succession, which needs to be continued to capture the long-term effect of integration on forage-finished beef grazing management, soil quality, nitrogen mineralization, carbon sparing, profitability, and farm family quality of life. The previous project established baseline soil bulk density, OM levels, seasonal soil nitrate-N fertility and end of season ammonium-N and nitrate-N levels. Since soil dynamics change slowly, extending the integrated research into years 7-9, is relevant to measure grazed and ungrazed soil quality dynamics in much greater detail. That is, maintenance of short and long-term carbon pools, water soluble soil organic nitrogen, seasonal soil NO3-N fertility, residual soil nitrogen pools, microbial CO2-C and soil C:N ratio change between crops within the rotation, soil GHG emissions, soil bulk density change, and soil water dynamics. Outreach programming will blend traditional extension and journal publication methods with yearly NCR SARE multi-state webinars, community café meetings, forage-finishing beef production workshops, field walks, high school student field days, exercise-health-service group presentations, YouTube (How-To) videos, DVD documentary, and social media outreach to schedule events, post links, inform, educate, and measure internet response.
Synergy between crop production, grazing, and soil health is complex and constantly evolving. A 10-year integrated crop and livestock study in the semi-arid region of western North Dakota was initiated in 2011 that compared No-Till hard red spring wheat grown continuously (HRSW-C) to hard red spring wheat grown in a No-Till five-crop rotation (HRSW-R). For the rotation, the sequence of crops consisted of HRSW-R, dual winter triticale-hairy vetch (THV) and spring seeded 13-specie cover crop (CC), forage corn (CN), field pea-forage barley mix (PBLY), and sunflower (SF). Beef cattle are integrated into the systems evaluation due to the importance of grazing to soil biological activity and soil health enhancement arising from integration with crop production. As such, the winter cover crop mix is put up as hay, and the other crops: post-hay harvest 13-specie CC, PBLY mix, and CN are grazing crops for yearling beef steers. This project encompasses systems’ response during the second five-year rotation.
Response during this period (2016-2020) has been vastly different and negatively affected by hail, wind, extreme drought, and ensuing soil microbial population fluctuations. Compared to the initial 2016 crop year, control spring wheat yields were 39.6, -3.14, 16.9, and 1.03%, and rotation spring wheat yields were -6.46, -18.7, 24.5, and -3.74% in 2017, 2018, 2019, and 2020, respectively. Rotation crop yields were similar to spring wheat yield declining sharply in 2017, but struggled to recover to pre-drought production levels in 2018; however, the 2019 crop would be considered near normal for most rotation crops, but not all. Compared to the 2016 crop, PBLY and the 13-specie cover crop were-38.8 and -76.0% less whereas THV and SF were 25.4 and 17.7% more. Corn (warm-season grass) dry matter forage yield was 2720 lbs. in 2017. But for 2016 before the drought and 2018 and 2019 after the drought, dry matter corn forage yield did not change appreciably averaging 7,534 lbs. (range: 7,580 -7,640 lbs.). Soil physical property evaluations for water infiltration, wind erodibility, and water stable aggregates for the integrated system compared to the control monoculture system show no significant difference between crops. Numerically higher values for water infiltration, wind erodible fraction, and water stable aggregates were identified for the rotation spring wheat system. This indicates the diverse crop rotation is having an impact on soil quality change such that there are more stable aggregates, indicating soil structure is improving. Nitrogen mineralization between the two spring wheat cropping systems has been evaluated and continues to be evaluated with increasing years and sampling. To date, the relationship between soil organic matter (SOM) and potential mineralized nitrogen (PMN) indicates that crop rotation is supportive for nitrogen mineralization such that approximately 8.4 mg (16.9 lbs.) PMN are mineralized for each 1.0% increase in SOM per kg of soil. nitrogen (PMN) indicates that crop rotation is supportive for nitrogen mineralization such that approximately 8.4 mg (16.9 lbs.) PMN are mineralized for each 1.0% increase in SOM per kg of soil.
Unfortunately, dry soil conditions impede microbial mineralization of soil OM. Haney and phospholipid fatty acid (PLFA) test were conducted in 2017, 2019, and 2020. Differences arising between extremely dry soil conditions and moist soil conditions are dramatic. Lack of sufficient soil water for nutrient solubilization and translocation disrupts a complex system of microbial activity. Across all crops soil pH declined 0.63 basis points and SOM decline to 3.29% in 2017, but recovered to 3.97% in 2019. However, reduced 2020 growing season precipitation contributed to an overall 16.9% microbial biomass decline compared to 2019. Most notably, cover crop following the winter THV mix had the greatest total microbial biomass decline of 37.9%; whereas collectively, SF, HRSW-C, HRSW-R, CN, and PBLY microbial biomass increase 3.9% in 2020 compared to 2019 levels. Although total microbial biomass and percent SOM declined, organism diversity index did not change between drought and moist soil in 2017 and 2019, but 2020 analysis indicates that soil conditions have negatively impacted microorganism diversity index, declining 28.4%. Soil minerals became more concentrated in the soil solution as soil dehydration continued with advancing season. Integrating systems’ molecular analysis of nitrogen cycling genes provides an opportunity to investigate soil nitrogen cycling communities at the molecular level. Quantitative real-time polymerase chain reaction (qPCR) is being used to estimate the quantity of microbes with enzymes capable of performing nitrogen transformations. Nitrogen is often the limiting soil nutrient in dry-land agricultural systems and is known to be converted into different forms by soil bacteria. Analysis for the presence and quantity of nitrogen cycling genes was performed on soil samples from the 2019 sampling period. Genes involved in nitrogen fixation (nifH), nitrification (amoA/B), and denitrification (nirS, nirK, and nosZ) were analyzed via qPCR (quantitative Polymerase Chain Reaction). Nitrogen fixation is the conversion of nitrogen gas from the atmosphere into NH4+, nitrification is the eventual conversion of ammonic (NH4+) to nitrate (NO3-), and denitrification is the conversion of NO3- to nitrogen gas (released back to the atmosphere). Although analysis is still ongoing, it appears that there is an increased abundance of genes involved in denitrification compared to both nitrogen fixation and nitrification. Suggesting that limited nitrogen nitrification and fixation were possible when soil sampling took place.
Yearling steers (n=144) of similar frame score (5.1) grazed either western North Dakota native range (NR) or a sequence of native range and annual forages in the diverse crop rotation (ANN: PBLY, CN, and CC) to evaluate grazing cover crop bales (12.8% CP, 59.0% TDN) as a management practice for extending the grazing season before feedlot entry or as forage finished steers for the GrassFed industry. For grazing muscling, ANN steer ribeye area (REA) and percent intramuscular fat were greater than NR steers and there was a tendency for ANN steers to have greater marbling score. At the end of bale grazing, ANN steers were heavier and ADG was greater. For the overall 221.5-day study from the start of grazing to the end of bale grazing, ANN steer ending gain weight was greater than NR. In the feedlot, steer ending weight did not differ between treatments, but the ANN steers started heavier and ended heavier than the NR steers. Thus, ANN steers had heavier hot carcass weight resulting in greater gross return for the ANN steers ($2,013.93 vs, $1,921.67). Combining the merits of bale grazing and delayed feedlot entry over three annual data collection periods has resulted in excellent net returns to both the ANN and NR systems. However, grazing systems net return after accounting for annual cow cost, steer pre-grazing wintering cost, grazing and mineral cost, bale grazing and protein supplement cost, and feedlot finishing expenses resulted in a $62.26/steer greater net return to the NR system (ANN: $482.92 vs. NR: $545.18). The final steer grazing investigation in this research is to further evaluate the merits of bale grazing and delayed feedlot entry finishing for marketing ANN and NR system steers as grass-fed beef and compare to similar steers finished in the feedlot. At the time of this final report, grass-fed steers have been marketed, but the feedlot steers remain on feed. Preliminary economic analysis of the grass-fed steers from ANN and NR system treatments show the ANN system steers with a net loss of -$88.25/steer compared to a greater return/steer of $62.70 for the NR system. Without going into detail until the feedlot steers have been closed out, preliminary factors contributing to the loss include, but are not limited to, price, farming cost, no choice quality grade premium, hauling shrink, and light weight carcasses.
At the 74th Soil and Water Conservation Society Annual Conference held at the Wyndham Grand Hotel in Pittsburgh, PA, July 28-31, the Integrated Crop-Grazing Research Team were awarded the 2019 Soil and water Conservation Society Merit Award for outstanding research. Clare Lindahl, CEO, said, “Their work will encourage producers within the Dakotas and beyond to adopt regenerative and integrated management practices that can both improve profitability and protect our valuable soil and water natural resources.” Crop and livestock producers in the semi-arid region of western North Dakota are listening to the research results and are adopting components of the practices evaluated in this SARE funded research and education project.
Added Objective:
Investigate soil nitrogen cycling communities at the molecular level to determine the quantity of microbes that posses the ability via enzymes to perform nitrogen transformations.
Cooperators
- (Educator and Researcher)
- (Educator)
- (Educator and Researcher)
- (Educator and Researcher)
- (Educator and Researcher)
Research
The research hypothesis for this SARE integrated systems project is that combining the effect of a multi-crop diverse rotation of cool- and warm-season grass and broadleaf annuals with yearling steer grazing will have a positive impact on crop production, soil health, carbon immobilization, forage finished beef production and systems profitability.
Objective 1: Using a long-term multi-crop rotation (6-10yr) compared to continuous HRSW-C, evaluate the effect of rotation, cover crops, and yearling steer grazing on soil fertility, soil nutrient cycling and carbon immobilization, greenhouse gas production, water infiltration, and net return per acre.
General Description: A continuation of the 10-year crop rotation that was established in 2011will be used in this project to evaluate the project objectives over a long period of cropping history (6 -10 crop years). The HRSW-C and HRSW grown in the 5-crop rotation (R) for crop years 2016 to 2019 is shown in Table 1.
Previous ICL research established baseline data for soil health parameters. In this project, each field crop is represented in each field block in Table 1. Field blocks were established due to the variability in major soil types in the study area. Thus, the soil type field block shown in Table 1 is replicated 3 times in a randomized complete block arrangement on the three different major soil types. Each field is 4.3 acres (1.74 ha). To measure the effect of grazing on HRSW grown in the rotation and compared to the HRSW-C, three sampling sites within each field will be affixed with 3 – 8 x 24” inch sections of aluminum irrigation pipe that will be pressed into the soil to a depth of 24”. Soil samples will be collected inside and outside of the enclosures at soil depths of 0-6” and 6-24”. Three soil core samples will be obtained at each sampling site and composited by depth into single samples for analysis. There will be 4 sampling dates: May 15, July 5, August 25, and October 15 during the years 1 and 3 of the project to measure soil health change over time. Soil core samples will be analyzed by the NDSU Soil Testing Laboratory.
Soil Fertility Analyses: Tests for soil pH, organic matter (OM), and electrical conductivity (soluble salts - EC) will be collected at the 1st sampling date mid-May only. Ammonium-nitrate (NH4-N) and nitrate-nitrogen (NO3-N) values will be obtained at each sampling date during the growing season to establish a long-term growing season fertility profile.
Physical Properties: Soil texture will be determined from a 0-6” soil sample taken the first year of the study only. Bulk density, aggregate stability, water infiltration rate, water holding capacity and moisture will be determined years 1 and 3 of the study. Bulk density will be determined by the core method (Grossman and Reinsch, 2002; or, alternatively by Blake and Hartge, 1986) with samples collected at 0-6” and 6-12”. Aggregate stability will be determined using the procedure outlined in Kemper and Rosenau (1986). Water infiltration and field moisture percentage will be determined using a 15.24 cm diameter aluminum single ring infiltrometer driven into the soil to a depth of 10 cm using the method of Bouwer (1986).
Soil Health Assessment: Two soil health tests (Phospholipid Fatty Acid and Haney Tests) provided by Ward Laboratories Inc., Kearney, Nebraska, will be used to evaluate soil health.
Phospholipid Fatty Acid (PLFA) – Provides a representation of the soil community living microbial biomass allowing identification of presence or absence of functional groups of interest using known PFLA bio-markers for comparison. Functional groups include actinomycetes, arbuscular mycorrhizal fungi, rhizobia, protozoa, etc. Soil cores for PFLA will be collected at the 0-6” depth mid-June from the 3 sites in each field and composited into a single sample for analysis years 1 and 3 of the project.
Haney Test - Soil cores will be collected at the 0-6” depth mid-June from the 3 sites in each field and composited into a single sample for analysis years 1 and 3 of the project. Haney Test soil analysis evaluates CO2-C mineralization (Solvita Test) and also tests for organic C, and organic N content, that are used to determine the C:N ratio as well as a cumulative soil health assessment.
Carbon Sequestration - Carbon sequestration will be determined by identifying a GPS reference point for sampling equidistant from the 3 sampling sites in each wheat field. Measuring out 5m from the GPS reference point, collect 5 (0-6” and 6-12”) soil core samples around the center point and composite into a single 0-6” and 6-12” sample for carbon analysis in each control and rotation field in September years 1 and 3 of the project.
Objective 2: Compare a perennial grass growing system to a perennial grass and annual forage grazing sequence growing system followed by bale-grazing finishing with non-starch supplementation to determine the effect of forage-based growing-finishing system on animal performance, carcass measurements, carcass value, consumer meat evaluation, and forage finishing economics.
To evaluate the effect of grazing summer perennial grass versus a sequence of perennial and annual forags, 48 yearling steers will be used/year (3-year study, 2 treatments, 8 steers/pen or pasture, 3 pen replicates/treatment; frame score range 4.5-5.5). At weaning, and prior to the start of the study, all steers will have been weighed, hip height measurement recorded, age recorded, and frame score determined (Guidelines (BIF) 2010). The last week of April each year, yearling steers (n=48) will be weighed and live animal ultrasound measurements taken for ribeye area (REA), fat depth (FD), and percent intramuscular fat (IMF) and randomly allotted to treatments. During the period from May 1 to August 15, the steers will graze native range as a common group for approximately 110 days and then move to Sec. 19 (Dunn County, ND) for the remainder of the study. On Sec. 19, 24 control steers will graze replicated native range pastures until approximately Dec 15 (forage availability dependent) and will be compared to an ICL treatment in which 24 yearling steers will graze a sequence of replicated annual forage crops beginning with a legume-barley cover crop (field pea 60#/a, soybean 5#/ac, crimson clover 2#/a, Berseem clover 2#/a, and forage barley 40#/a), followed by unharvested non-GMO MasterGraze BMR (var.) corn (19-20,000 plants/ac), and ending with a multi-species cover crop. At the end of grazing, both the native range pasture and annual forage treatments will be moved to replicated legume-sudan sorghum-barley fields (field pea 60#/ac, soybean 5#/ac, Crimson clover 2#/ac, Berseem clover 2#/ac, sorghum-sudan (BMR) 5#/ac, and Stockford forage barley 40#/ac; 4.3 ac/1.74 ha) on Sec. 19 previously swathed and baled (12-14% CP). The steers will bale-graze the forage and also receive approximately 5.0 lb/head/day of a non-starch supplement (beet pulp-soybean hull-canola meal) with 2.0% added fat until a pen group mean slaughter end-point (low to average Choice) is attained based on ultrasound %IMF determination. A record of steer weight and ultrasound live animal muscle and fat (REA, FD, and IMF) measurements will be recorded at the beginning of the study, when each annual forage crop change occurs, and at the end of the study. The steers will be marketed through a grass-fed/forage finishing program and carcass data, and meat removal will occur after a 48-hour chill.
Pasture and annual forage quality will be obtained from forage samples collected monthly. Forage samples will be obtained from three sample sites established along a diagonal transect across pastures and fields. Sites will be marked and GPS location recorded for multiple samplings. Samples from the multiple sites will be composited, and analyzed for dry matter (DM), crude protein (CP), ash, neutral detergent fiber (NDF), acid detergent fiber (ADF), fat (F), invitro dry matter disappearance (IVDMD), and invitro organic matter disappearance (IVOMD). The non-starch supplement will be prepared by a commercial feed manufacturer and will have been analyzed for the same nutrient content values as the forages prior to the start of the forage finishing phase of the study.
Steers in the study will not be implanted, fed or treated with antibiotics from birth to slaughter. Any animals that become sick require antibiotic treatment as prescribed by the DREC attending veterinarian will be removed from the study.
Economics - Net Return/Acre: Identifying strategies that promote profitability in the stocker-finisher business is challenging. Forage-based growing-finishing is an alternative approach to grain concentrate finishing. A detailed record of inputs and outputs will be kept from which an economic analysis will be conducted to identify profit potential forage-based growing-finishing. A record of all crop and livestock input costs, yield and value will be kept. All crop input costs will be used in computing overhead expenses for both crop and livestock grazing. Revenue returned to the systems for crop (grain and oilseed) and beef (finished carcass value) will be used to calculate enterprise budgets for the individual crop and beef produced and combined crop/livestock systems.
Statistics - The HRSW (Control vs Rotation) and forage-finishing (Grass vs Integrated) data will be analyzed as a randomized complete block (RCB) design using proc MIXED analysis of SAS (SAS, 2002-2008). A significant difference will be identified when P<0.05 and a trend will be identified when probability values are >0.05, but <1.0.
Objective 3: Farmer-Rancher Cooperators and Program Outreach – Engage farmer-rancher cooperator demonstration projects that includes outreach programming for producers on their farms and ranches as well as outreach programming for producers and extension agency personnel, and other interested stakeholders through focus group programming, community café needs-based presentations, field tour and discussion groups, short course training, YouTube educational video, and scientific publications.
Four farmer-rancher cooperators have signed letters of intent to conduct on farm projects and make their projects open to the public for tours, discussion groups, video interviews for YouTube posting, and DVD documentation. These producers will be paid for their direct consumable expenses. Funding has been budgeted for compensation in the amount of the $1,862/producer/year of the grant award; a total of $22,344. Cooperator projects include yearling steer graze-to-slaughter, extended cover crop and corn residue grazing to reduce cow wintering cost, non-traditional weaning and background grazing cover crops and corn, and stockpiling grass and corn grazing as a replacement for lost rented land.
Our research team is diverse and highly experienced consisting of animal, soil, agronomy, and environmental biosystems scientists, farmer-rancher cooperator professionals, as well as Extension livestock, agronomy, and economic specialists that will not only conduct the research, but also provide high quality extension outreach programming to a varied and interested platform of stakeholders. Social media will be an important role in reaching the general public concerning advances in alternative agriculture. Personnel training, field walks and tours, Extension bulletins, and peer reviewed journal publications will be included in the outreach programming.
UPDATE 2020
Cover crop bale grazing after annual forage grazing on yearling steer grazing and feedlot performance, muscling, carcass measurements and carcass value
Materials and Methods
The North Dakota State University Institutional Animal Care and Use Committee approved animal research procedures used in this study (A16015 and A19013).
Crossbred yearling steers (n=144) with average frame score of 5.12 grazed either western North Dakota native range (NR), or a forage sequence of native range and annual forages (ANN: field-pea barley mix, corn, and a 13-specie cover crop mix).
Initially, the steers grazed NR together as a common group and were separated July 16. The NR treatment continued to graze NR and the ANN forage group started grazing field pea-barley and subsequently unharvested corn, and cover crop. When grazing was completed on November 1, the steers bale grazed a five-specie (pea, barley, sorghum-sudan, crimson clover, and berseem clover) cover crop hay. The cover crop hay was grown and baled in early July to obtain cover crop hay with crude protein value ranging between 12.0 and 13.0% CP (Table 1).
Forage samples were collected using a 0.25 sq. m frame at the start and end of each forage grazing period. Forage samples were analyzed by the NDSU Nutrition Laboratory for crude protein (CP), neutral detergent fiber (NDF), acid detergent fiber (ADF), invitro dry matter disappearance (IVDMD), invitro organic matter disappearance (IVOMD), calcium (Ca), phosphorus (Phos), and total digestible nutrients (TDN = 81.38 + (CP % * 0.36) - (ADF % * 0.77).
Multiple blizzards, deep snow, and drifting made feeding cover crop bales difficult the first year of the study and the extreme drought of 2017 reduced the number of cover crop grazing days. Therefore, cover crop hay was fed 41-days (Yr. 1), 56 days (Yr. 2), and 34 days (Yr. 3) for an average of 43.66 days of bale grazing before the steers were shipped to the University of Wyoming, SAREC feedlot, Lingle, WY, for finishing.
Monitoring of steer growth occurred with each forge type change, and in the feedlot, end-point target was based on ultrasound backfat depth between 0.35 and 0.45 inch. Live animal ultrasound measurements occurred at the end of bale grazing before shipment to the Wyoming feedlot to determine the effect of grazing method on muscle and fat traits. Steers were slaughtered at the Cargill Meat Solutions Plant, Ft. Morgan, Colorado, and grid carcass measurements included hot carcass weight (HCW), fat depth (FD), ribeye area (REA), marbling score (MS), USDA yield grade (YG), quality grade (QG), and muscle to carcass weight ratio (REA: HCW), and gross carcass value were calculated.
Net return economics accounted for annual cow expense, winter backgrounding feed costs to carry steers used in the project over the winter to pasture turnout, native range grazing cost and farming cost for annual forage production, bale grazing hay and supplement cost, and finishing expenses (to include freight to feedlot and packing plant, veterinary, and brand inspection). Total yearling steer expense was deducted from gross carcass value to arrive at the system net return/steer.
Pasture and pen treatments were replicated three times. Mean separation determined using the MIXED procedure of SAS. Means with P ≤ 0.05 differ significantly.
Effect of Extreme Drought on Crop Rotation and Soil Physical and Microbial Property Changes for the period 2016-2020 in Western North Dakota
Materials and Methods
For a description of the methods used in this research project, the reader is directed to Landblom et al. (2017) for the project design, seeding and planting detail, plant population goals, weed control, growing season soil fertility, economic analysis, and a summary for the first five years of the study (2011-2015).
To evaluate crop yield solely on microbial nutrient mineralization, nitrogen fertilizer was discontinued after the 2013 crop year for the spring wheat-C and after the 2012 spring wheat-R crop year.
In addition to growing season soil fertility and soil physical property change, soil microbial analysis determined from two tests provided by Ward Laboratories, Inc., Kearney, NE, i.e. Phospholipid Fatty Acid (PLFA) microbial community analysis and the Haney Soil Health Test.
Soil samples were collected in the 0.0-6.0” rooting zone for the PLFA Microbial Community and Haney Soil Health Test. Thirteen soil samples were collected from each of the 18 field replicates in an “X” transect pattern (3 from each leg of the X and one in the center) and composited. The samples were immediately placed in plastic bags, air squeezed out, sealed, and stored in a cooler on ice. In the lab, the samples were frozen and subsequently shipped on ice to Ward Laboratories, Inc. for analysis. Samples were collected August 27, 2017 and August 29, 2019, and August 18, 2020. The PLFA analysis reports provide results for the following: total biomass and diversity index, total bacteria biomass, total Actinomycetes biomass, gram (-) biomass, gram (+) biomass, gram (+): gram (-) ratio, rhizobia biomass, total fungi biomass, Arbuscular mycorrhizal biomass, saprophytes biomass, protozoa biomass, undifferentiated biomass, fungi: bacteria ratio, and saturated: unsaturated fatty acid ratio.
The Haney test analysis provided results for the following tests: pH, soluble salt, soil organic matter, CO2-carbon, water soluble total N, water soluble organic N, water soluble total organic carbon, NO3-N, NH4-N, inorganic N, total phosphorus, inorganic phosphorus, organic phosphorus, potassium (K), calcium (Ca), aluminum (Al), iron (Fe), sulfur (S), zinc (Zn), manganese (Mn), copper (Cu), magnesium (Mg), sodium (Na), percent microbial active carbon, organic C: N ratio, organic N: inorganic N, organic N release, and soil health calculation. Included in the report are traditional N-P-K values, nutrient value (value of nutrients in the soil; $/Ac), traditional lbs. of NO3-N in the soil/Ac, Haney test available lbs. of N in the soil/Ac, N difference in lbs./Ac between traditional N and Haney microbial derived N in lbs./Ac, and N savings in $/Ac by accounting for microbial derived N/Ac.
Mineral N Cycling in an Integrated Crop-Grazing System
Materials and Methods
Soil were collected at six (6) points in time throughout the growing season in 2014 and four (4) points in time in 2016 to a depth of 0.6 m as recommended by NDSU for determining residual soil N (Table 1). We analyzed the surface 0-15 cm of the soil samples from the continuous and rotation HRSW plots that were collected in the season that HRSW was grown (either 2014 or 2016) for potentially mineralizable N (PMN) based on the methodology of Waring and Bremner (1964) and Keeney (1982). This utilizes an anaerobic incubation at 40°C for 7 days with determination of NH4+-N at the end of the incubation period. The NH4+-N produced indicates the availability of N from easily decomposable soil organic matter (SOM) during the growing season and is often used as an indicator of soil health. The mineralization for each soil was replicated four times. Data was statistically analyzed using SAS v9.4.
Integrated Systems Molecular Analysis of Soil Nitrogen Cycling Genes
In order to determine how nitrogen is cycling under the different crop rotations and integrated livestock grazing, we are using a molecular approach. This approach allows for the determination of the ability of the soil microorganisms to perform particular functions within the nitrogen cycle. Utilizing a sub-sample of soil collected for PLFA microbial community analysis collected during the growing season, DNA is extracted from each of the control spring wheat and crop rotation replicated field soil samples. The total DNA from each sample is being subjected to Quantitative Real Time Polymerase Chain Reaction (qPCR) analysis to determine the quantity of microbes that possess the ability (the enzyme) to perform nitrogen transformations. The transformations under study include: denitrification, ammonification, and nitrogen fixation. The abundance of these nitrogen transformation genes will be compared to the total number of soil bacteria allowing us to determine the relative capacity of the soils to perform the various nitrogen transformations.
During the first year of this project, extreme drought hampered growing-season soil fertility analysis and most other physical property measurements. Although a limited amount of soil data was collected and analyzed. Soil physical property measurements are during the 7th year of the multi-crop rotation that includes yearling steer grazing of the forage crops in the rotation. Measurements for soil water infiltration, wind erodible fraction, air-dry and field-moist aggregate stability were measured. In addition, seasonal N mineralization from the 2016 growing season were completed and an index of NH4-N mineralization potential (ppm) depict in the attached chart Index-of-mineralization-potential_Cihacek. During 2018 N mineralization in the semi-arid region of western North Dakota was again evaluated and from results it is estimated that 16.8 pounds of N is mineralized for each 1% increase in soil organic matter.
Soil Water Infiltration: Infiltration rate was measured after soil saturation. Infiltration rate between spring wheat (SW) grown continuously (Control) and spring wheat grown in the multi-crop rotation did not differ. However, rotation SW hand an average infiltration rate of 1.07 in/hr. compared to 0.75 in/ hr. for the continuous SW (27 mm/hr. vs. 19 mm/hr.). This was likely due to better aggregation (probably fine aggregation) for the rotation SW than the continuous SW. Under the dry conditions of the 2017 crop year, the rotation SW tended to have better structure due to the crop diversity.
Wind Erodible Fraction: Numerical differences were measured, but the differences were not significant. However, the rotation SW had a 40.5% wind erodible fraction compared to the continuous SW which had a 28.3% erodible fraction. Again, this is likely due to the dry conditions where the crop rotation had a massive structure compared to the rotation SW which had a lot of strong fine aggregates (<0.84 mm). Rotation promoted better aggregation due to the crop diversity.
Air-Dry and field-moist Aggregate Stability: No significant difference measured. The rotation SW had a slightly higher level of water stable aggregates (92.6%) compared to the continuous wheat (91.2%). Again, crop diversity in the rotation slightly promoted stronger aggregates and these observations are interrelated to the previously described observations.
2016 Soil N Mineralization: There is no N mineralization for the 2017 growing season due to the extremely dry conditions. A linear regression on soil OM vs. N mineralization resulted in the following linear equation: ppm NO3-N = 14.8X -45.3. Therefore, there is approximately 15 ppm N mineralized for every 1% OM over 3% soil OM in the experimental fields. In 2018, N-mineralization tests were conducted again and it was estimated on a pounds/acre basis that 16.7 pounds of N are mineralized for each 1% increase in soil organic matter.
Table 1. 2017 data for crop treatment effects on water infiltration, wind erodible soil fraction and air-dry and field-moist aggregate stability.
|
Crop |
Water Infiltration Rate |
Wind Erodible Soil Fraction |
Air-dry Aggregate Stability |
Field-moist Aggregate Stability |
|
|
in./hr. |
% |
% |
% |
|
Spring Wheat (C) |
0.74 a |
28.3 a |
91.2 a |
96.5 a |
|
Spring Wheat (R) |
1.07 a |
40.5 a |
92.6 a |
90.4 ab |
|
Sunflower |
1.05 a |
35.0 a |
89.5 a |
81.9 b |
|
Triticale-Hairy Vetch |
0.92 a |
23.6 a |
96.3 a |
91.5 ab |
|
Pea-Barley |
0.83 a |
32.5 a |
89.6 a |
89.8 a b |
|
Corn |
1.36 a |
30.6 a |
97.0 a |
96.2 a |
Crop Yield and Microbial Activity
A 10-year integrated crop and livestock study was initiated in 2011 that compared hard red spring wheat grown continuously (HRSW-C) to hard red spring wheat grown in a five-crop rotation (HRSW-R). For the rotation, the sequence of crops consisted of HRSW-R, dual winter and spring cover crops, silage corn, field pea-forage barley mix, and sunflower. Beef cattle are integrated into the systems evaluation due to the importance of grazing to soil biological activity and the potential economic advantages grazing annual forages in an integrated system. As such, the winter triticale-hairy vetch cover crop mix is put up as hay, and the other crops: post-hay harvest 13-specie cover crop, pea-barley mix, and corn are grazing crops for yearling beef steers (Senturklu et al., 2017, 2018, 2019).
A research summary for the first 5-year rotation (2011– 2015) of the 10-year study, provides a description of the research procedures and a brief summary of crop yields, soil organic matter, nitrogen fertility, nutrient cycling, fertilizer reduction, and economics (Landblom et al., 2017). The second 5-year rotation has been negatively affected by hail, wind, and drought resulting in low yields and fluctuating soil microbial properties. Crop yields spring wheat grown continuously (Control) and spring wheat grown in a five-crop rotation for crop years 2016 through 2020 of the 2nd 5-year crop rotation are shown in Table 2 and compared to the 1st 5-year rotation. Table 1 also shows the percent of yield of the 2nd 5-year compared to the 1st 5-years.
Table 2. 10-Year Cropping System Yields & Percent Difference
| 10-Year Cropping System Yields & Percent Difference | |||||||||
| Corn | Corn | Corn Grain | PBLY | PBLY | CVR-CROP | CVR-CROP | |||
| DM T/Ac | DM Llb/Ac | Bu/Ac | DM T/Ac |
DM Llb/Ac |
DM T/Ac | DM Llb/Ac | |||
| 2011 | 1.65 | 3300.00 | 2011 | 0 | 0 | 2011 | 0.00 | 0.00 | |
| 2012 | 3.66 | 7320.00 | 2012 | 3.11 | 6220 | 2012 | 4.25 | 8500.00 | |
| 2013 | 4.01 | 8020.00 | 2013 | 4.53 | 9060 | 2013 | 3.25 | 6500.00 | |
| 2014 | 3.5 | 7000.00 | 2014 | 3.75 | 7500 | 2014 | 0.62 | 1240.00 | |
| 2015 | 5.81 | 11620.00 | 2015 | 3.53 | 7060 | 2015 | 2.92 | 5840.00 | |
| 2016 | 3.79 | 7580.00 | 2016 | 2.76 | 5520 | 2016 | 5.34 | 10680.00 | |
| 2017 | 1.36 | 2720.00 | 2017 | 1.85 | 3700 | 2017 | 0.77 | 1540.00 | |
| 2018 | 3.73 | 7460.00 | 2018 | 2.07 | 4140.00 | 2018 | 0.49 | 980.00 | |
| 2019 | 3.69 | 7382.00 | 2019 | 1.69 | 3380.00 | 2019 | 1.28 | 2565.00 | |
| 2020 | 2.94 | 5880.00 | 2020 | 1.42 | 2840.00 | 2020 | 1.42 | 2840.00 | |
| 1st 5YrAvg | 3.73 | 7452.00 | 1st 5YrAvg | 2.98 | 5968.00 | 1st 5YrAvg | 2.21 | 4416.00 | |
| 2nd5YrAvg | 3.10 | 6204.00 | 2nd5YrAvg | 1.96 | 3916.00 | 2nd5YrAvg | 1.86 | 3721.00 | |
| 10 YR Avg | 3.41 | 6828 | 10 YR Avg | 2.47 | 4942.00 | 10 YR Avg | 2.03 | 4068.50 | |
| Pct 2020 vs 2016 | 0.78 | 0.78 | Pct 2020 vs 2016 | 0.51 | 0.51 | Pct 2020 vs 2016 | 0.27 | 0.27 | |
| Pct of 1st 5Yr | Pct of 1st 5Yr | Pct of 1st 5Yr | |||||||
| vs 2nd 5Yr | 83.25282 | vs 2nd 5Yr | 65.61662198 | vs 2nd 5Yr | 84.26178 | ||||
| SFLWR | SFLWR | HRSW-C | HRSW-C | HRSW-R | HRSW-R | ||||
| DM T/Ac | DM Llb/Ac | DM Bu/Ac | DM Llb/Ac | DM Bu/Ac | DM Llb/Ac | ||||
| 2011 | 0.45 | 891.00 | 2011 | 28.00 | 1726.60 | 2011 | 30.00 | 1845.00 | |
| 2012 | 0.80 | 1590.00 | 2012 | 56.00 | 3455.20 | 2012 | 45.00 | 2767.50 | |
| 2013 | 0.98 | 1959.00 | 2013 | 47.00 | 2899.90 | 2013 | 39.00 | 2398.50 | |
| 2014 | 0.53 | 1060.00 | 2014 | 44.00 | 2714.80 | 2014 | 48.00 | 2952.00 | |
| 2015 | 0.93 | 1856.00 | 2015 | 36.00 | 2221.20 | 2015 | 50.00 | 3075.00 | |
| 2016 | 0.57 | 1137.00 | 2016 | 25.50 | 1573.35 | 2016 | 29.40 | 1808.10 | |
| 2017 | 0.24 | 481.00 | 2017 | 35.60 | 2196.52 | 2017 | 27.50 | 1691.25 | |
| 2018 | 0.48 | 961.00 | 2018 | 24.70 | 1524.48 | 2018 | 23.90 | 1468.85 | |
| 2019 | 0.67 | 1338.00 | 2019 | 29.80 | 1838.53 | 2019 | 36.00 | 2213.86 | |
| 2020 | 0.58 | 1158.00 | 2020 | 26.30 | 1601.67 | 2020 | 28.30 | 1712.15 | |
| 1st 5YrAvg | 0.74 | 1471.20 | 1st 5YrAvg | 42.20 | 2532.00 | 1st 5YrAvg | 42.40 | 2544.00 | |
| 2nd5YrAvg | 0.51 | 1015.00 | 2nd5YrAvg | 28.38 | 1702.80 | 2nd5YrAvg | 29.02 | 1741.20 | |
| 10 YR Avg | 0.62 | 1243.1 | 10 YR Avg | 35.29 | 2117.4 | 10 YR Avg | 35.71 | 2142.6 | |
| Pct 2020 vs 2016 | 1.02 | 1.02 | Pct 2020 vs 2016 | 1.03 | 1.02 | Pct 2020 vs 2016 | 0.96 | 0.95 | |
| Pct of 1st 5Yr | Pct of 1st 5Yr | Pct of 1st 5Yr | |||||||
| vs 2nd 5Yr | 68.9913 | vs 2nd 5Yr | 67.25118483 | vs 2nd 5Yr | 68.4434 | ||||
| THV | CVR-CRP | TOTAL | THV | CVR-CRP | TOTAL | ||||
| DM T/AC | DM T/AC | DM T/AC | THV DM lb/AC | THV DM lb/AC | THV DM lb/AC | ||||
| 2011 | 2.71 | 0 | 2.71 | 5420 | 0 | 5420 | |||
| 2012 | 1.59 | 4.25 | 5.84 | 3180 | 8500 | 11680 | |||
| 2013 | 2.5 | 3.25 | 5.75 | 5000 | 6500 | 11500 | |||
| 2014 | 0.65 | 0.62 | 1.27 | 1300 | 1240 | 2540 | |||
| 2015 | 1.8 | 2.92 | 4.72 | 3600 | 5840 | 9440 | |||
| 2016 | 1.38 | 5.34 | 6.72 | 2760 | 10680 | 13440 | |||
| 2017 | 0.74 | 0.77 | 1.51 | 1480 | 1540 | 3020 | |||
| 2018 | 0.562 | 0.49 | 1.05 | 1124 | 980 | 2104 | |||
| 2019 | 1.73 | 1.15 | 2.88 | 3460 | 2300 | 5760 | |||
| 2020 | 1.17 | 0.94 | 2.11 | 2340 | 1880 | 4220 | |||
| 1st 5YrAvg | 1.85 | 2.208 | 4.058 | 3700 | 4416 | 8116 | |||
| 2nd5YrAvg | 1.23 | 1.94 | 3.17 | 2460.67 | 3870.00 | 6330.67 | |||
| 10 YRaAvg | 1.48 | 1.97 | 3.46 | 6912.4 | 3946.00 | 6912.40 | |||
| Pct 2020 vs 2016 | 0.85 | 0.18 | 0.31 | 0.85 | 0.18 | 0.31 | |||
| Pct of 1st 5Yr | |||||||||
| vs 2nd 5Yr | 66.5045 | 87.63587 | 78.0023 | 66.5045045 | 87.63586957 | 78.00229998 | |||
2020UPDATE
Cover crop bale grazing after annual forage grazing on yearling steer grazing and feedlot performance, muscling, carcass measurements and carcass value
Results and Discussion
Steer growth for NR and ANN steers, fluctuated during the 177.9-day grazing period. Over the three-year period of the study, hail, wind, exceptional drought, and early deep December snow combined had a negative impact on growing and grazing conditions. Steers that grazed ANN forages before bale grazing were 94.9 lbs. heavier (P = 0.001; Table 2) than NR at the end of bale grazing.
The NR steer gain declined in August and September as the native range forage community matured with advancing season (ADG: NR - 0.67 lbs./day vs Corn grazing – 1.95 lbs./day); however, fall rain stimulated range regrowth and steer gain recovered during Late-September and October. Grazing ANN forage sequence crops maintained ADG at approximately 1.85 lb/day throughout the average 177.9-day grazing season, which is due to annual forage nutrient quality that was consistently greater than NR forage (Table 1).
Cover crop bale grazing gain was greater for ANN steers compared to NR steers (P = 0.008). Gain among ANN compared to NR was 3.04 and 1.77 lb/day, respectively. Given the restricted growth nature commonly associated with extended grazing (NR and ANN), a compensating gain response, such as the responses reported by Senturklu et al. (2017, 2018) and Choat et al. (2003), was expected. Overall, for the entire 221.5-day grazing and bale-grazing period prior to feedlot entry, steer gain and ADG was 376.52 and 1.70; and 463.72 lb and 2.10 lb/day, for the NR and ANN steers, respectively.
Economically important muscle and fat tissues (ribeye muscle area (REA), percent intramuscular fat (IMF), and ending marbling score (MS)) were measured at the end of grazing with ultrasound (Table 2). Ending ribeye muscle area for ANN steers was greater (P=0.001) than the NR steers (12.05 inch vs. 10.99 inch). The muscle relationship between REA and steer ending live weight (REA: CWT) did not differ (P = 0.37). The percent IMF was greater for ANN steers (P = 0.05); however, marbling score was greater for the ANN steers (489 vs 470) but did not differ (P = 0.13).
Feedlot performance between the NR and ANN grazing treatments paralleled one another (Table 3). ANN steers entered the feedlot weighing 1255.06 lb and the NR steers weighed 1168.75 lb (P = 0.04), a margin of 86.31 lb, and ending weight was 1582.04 and 1508.0 lb for the NR and ANN steers, respectively. A difference of 74.0 lb (P = 0.19). For other finishing performance criteria, there were numerical differences; however, none differed significantly. Differences between steer grazing treatments for feedlot gain to feed (G:F) and feed cost/lb of gain were nearly identical ($0.60 vs. $0.59; P = 0.71). In research reported by others, delaying feedlot arrival grazing NR and/or improved tame grass pastures resulted in greater feedlot starting BW and ending slaughter weight compared to steers that did not graze before entering the feedlot (Winterholler et al., 2008; Reuter and Beck, 2013; Lancaster et al., 2014).
Hot carcass weight (P=0.03) and fat depth (P=0.04) were greater for the ANN steers. The ANN treatment steers consistently grazed higher quality forage and growth from cover crop hay increased the potential for fatter carcasses and more overweight carcass discounts. Carcasses from the NR steers had greater dressing percent (P = 0.01), USDA YG (P = 0.01), and REA:HCW ratio (P = 0.007) (Table 4). The muscling relationship identified for the NR steers at the end of grazing remained unchanged by the end of finishing.
Gross carcass value for ANN steers was greater ($2013.93 vs. $1921.67; P = 0.031). Weight margins between the NR and ANN forage groups entering the feedlot do not change appreciably by the end of the finishing period and gross carcass value based on HCW has routinely been greater; however, annual forage farming costs eroded ANN system net return resulting in a $62.26 advantage in favor of the NR system. Overall, comparatively, the two systems were similar and easily adaptable depending on the farm operator’s goals and farming systems. Integrating livestock grazing into cropping systems has many positive aspects and grazing integration is one of the five principles of soil health. Therefore, steer grazing, finishing, and carcass measurement performance are all favorable enhancements following an integrated crop-livestock system.
Literature Cited
Choat, W. T., C. R. Krehbiel, G. C. Duff, R. E. Kirksey, L. M. Lauriault, J. D. Rivera, B. M. Capitan, D. A. Walker, G. D. Donart, and C. L. Goad. 2003. Influence of grazing dormant native range or winter wheat pasture on subsequent finishing cattle performance, carcass characteristics, and ruminal metabolism. J. Anim. Sci. 81:3191-3201.
Lancaster, P. A., C. R. Krehbiel, and G. W. Horn. 2014. A meta-analysis of effects of nutrition and management during the stocker and backgrounding phase on subsequent finishing performance and carcass characteristics. Prof. Anim. Sci. 30:602-612. dx.doi.org/10.15232/ pas.2014-01330
Lewis, J. M., T. J. Klopfenstein, and R. A. Stock. 1990. Effects of rate of gain during winter on subsequent grazing and finishing performance. J. Anim. Sci. 68:2525-2529.
Shain, D. H., T. J. Klopfenstein, R. A. Stock, B. A. Vieselmeyer, and G. E. Erickson. 2005. Evaluation of grazing alternative summer and fall forages in extensive beef cattle production systems. Prof. Anim. Sci. 21:390-402.
Reuter, R. R., and P. A. Beck. 2013. Southern Section Interdisciplinary Beef Cattle Symposium: Carryover effects of stocker cattle systems on feedlot performance and carcass characteristics. J. Anim. Sci. 91:508-515. dx.doi.org/10.2527/jas2012-5527
Senturklu, S., D. G. Landblom, R. Maddock, T. Petry, and S. Paisley. 2017. Effect of retained ownership and vertical integration within an integrated cropping system among yearling steers of differing frame score on feedlot performance, carcass measurements, and systems economics following delayed feedlot entry. Proceedings, West. Sec., ASAS, Vol. 68:203-207. dx.doi.org/10.2527/asasws.2017.0061
Senturklu, S., D. G. Landblom, R. Maddock, T. Petry, C. Wachenheim, and S. Paisley. 2018. Effect of yearling steer sequence grazing of perennial and annual forages in an integrated crop and livestock system on grazing performance, delayed feedlot entry, finishing performance, carcass measurements, and systems economics. J. Anim. Sci. 96(6):2204-2218 https://dx.doi.org/10.1093/ jas/sky150
Winterholler, S. J., D. L. Lalman, M. D. Hudson, C. E. Ward, C. R. Krehbiel, and G. W. Horn. 2008. Performance, carcass characteristics, and economic analysis of calf-fed and wheat pasture yearling systems in the southern Great Plains. Prof. Anim. Sci. 24:232-238. dx.doi.org/10.1532/ 1080-7446(15)30845-7
Table 1. Nutrient analysis of grazed forages and cover crop bales.
|
|
CP, % |
NDF, % |
ADF, % |
IVOMD, % |
IVDMD, % |
Ca/Phos, % |
TDN, % |
|
Native Range |
|
|
|
|
|
|
|
|
Start |
9.7 |
64.7 |
35.4 |
57.5 |
58.7 |
0.27/0.13 |
55.5 |
|
End |
6.9 |
38.8 |
38.9 |
47.4 |
48.6 |
0.31/0.11 |
52.6 |
|
Pea-Barley |
|
|
|
|
|
|
|
|
Start |
11.0 |
55.0 |
30.2 |
69.6 |
68.5 |
0.50/0.23 |
59.7 |
|
End |
8.2 |
67.0 |
37.9 |
54.8 |
54.1 |
0.37/0.25 |
53.5 |
|
Corn |
|
|
|
|
|
|
|
|
Start |
7.7 |
56.6 |
29.5 |
78.0 |
77.6 |
0.32/0.24 |
60.1 |
|
End |
4.6 |
69.2 |
38.2 |
64.7 |
63.6 |
0.17/0.20 |
53.2 |
|
Cover Crop |
|
|
|
|
|
|
|
|
Start |
11.8 |
50.5 |
31.5 |
73.0 |
69.3 |
0.72/0.34 |
58.7 |
|
End |
12.3 |
52.8 |
34.5 |
64.3 |
61.9 |
0.83/0.31 |
56.4 |
|
|
|
|
|
|
|
|
|
|
Cover Crop Bale |
12.8 |
54.4 |
31.4 |
72.5 |
72.3 |
0.48/0.22 |
59.0 |
Table 2. Three-year effect of grazing system on yearling steer grazing performance
|
|
|
|
|
P-Value5 |
|||||
|
ITEM |
ANN1, 2 |
NR1, 2 |
SEM |
Trt4 |
|||||
|
Number steers |
72.00 |
72.00 |
|
|
|||||
|
Steer Frame Score |
5.11 |
5.13 |
0.16 |
0.92 |
|||||
|
Native Range, (73.3 d) |
|
|
|
|
|||||
|
Start Wt., lb |
856.76 |
849.10 |
12.15 |
0.66 |
|||||
|
End Wt., lb. |
993.04 |
988.46 |
15.92 |
0.84 |
|||||
|
Gain, lb |
136.28 |
139.36 |
9.40 |
0.82 |
|||||
|
ADG, lb |
1.86 |
1.90 |
0.17 |
0.87 |
|||||
|
Field Pea-Barley, (31.9 d) |
|
|
|
|
|
||||
|
Start Wt., lb |
994.27 |
989.45 |
15.94 |
0.83 |
|||||
|
End Wt., lb. |
1073.25 |
1072.02 |
20.85 |
0.97 |
|||||
|
Gain, lb |
78.98 |
82.57 |
18.24 |
0.89 |
|||||
|
ADG, lb |
2.48 |
2.58 |
0.58 |
0.84 |
|||||
|
Unharvested Corn, (57.33 d) |
|
|
|
|
|||||
|
Start Wt., lb |
1073.25 |
1072.02 |
20.86 |
0.97 |
|||||
|
End Wt., lb. |
1184.91 |
1110.53 |
21.04 |
0.02 |
|||||
|
Gain, lb |
111.66 |
38.53 |
11.55 |
0.001 |
|||||
|
ADG, lb |
1.95 |
0.67 |
0.33 |
0.001 |
|||||
|
Cover Crop (13 Spec.), (15.32 d) |
|
|
|
|
|||||
|
Start Wt., lb |
1183.45 |
1118.43 |
21.77 |
0.051 |
|||||
|
End Wt., lb. |
1187.92 |
1148.51 |
19.98 |
0.182 |
|||||
|
Gain, lb |
4.47 |
30.08 |
13.30 |
0.192 |
|||||
|
ADG, lb |
0.29 |
1.96 |
0.956 |
0.08 |
|||||
|
Bale Grazing, (43.66 d) 3 |
|
|
|
|
|||||
|
Start Wt., lb |
1187.92 |
1148.51 |
19.98 |
0.182 |
|||||
|
End Wt., lb. |
1320.49 |
1225.61 |
17.87 |
0.001 |
|||||
|
Gain, lb |
132.57 |
77.10 |
12.94 |
0.008 |
|||||
|
ADG, lb |
3.04 |
1.77 |
0.24 |
0.001 |
|||||
|
Combined Grazing Periods: |
|
|
|
|
|||||
|
ANN Grazing, (104.6 d) |
|
|
|
|
|||||
|
Gain, lb |
193.65 |
159.08 |
15.11 |
0.13 |
|||||
|
ADG, lb |
1.85 |
1.52 |
0.13 |
0.12 |
|||||
|
NR + ANN Grazing, (177.9 d) |
|
|
|
|
|||||
|
Gain, lb |
331.17 |
299.44 |
13.49 |
0.12 |
|||||
|
ADG, lb |
1.86 |
1.68 |
0.094 |
0.24 |
|||||
|
NR + ANN + Bale Grazing, (221.5 d) |
|
|
|
|
|||||
|
Gain, lb |
463.72 |
376.52 |
11.02 |
0.001 |
|||||
|
ADG, lb |
2.10 |
1.70 |
0.06 |
0.001 |
|||||
|
Grazing Muscle & Fat (Ultrasound) |
|
|
|
|
|||||
|
Start REA, sq. in. |
9.01 |
9.21 |
0.38 |
0.72 |
|||||
|
Start REA: CWT, sq. in. |
1.05 |
1.09 |
0.04 |
0.53 |
|||||
|
End REA, sq. in. |
12.05 |
10.99 |
0.25 |
0.002 |
|||||
|
End REA: CWT, sq. in. |
0.92 |
0.90 |
0.01 |
0.37 |
|||||
|
End Percent Intramuscular Fat |
4.17 |
3.84 |
0.11 |
0.05 |
|||||
|
End Marbling Score6 |
489.0 |
470.0 |
8.00 |
0.13 |
|||||
1 NR - Native Range; ANN – Grazing Sequence: Native Range, Field Pea-Barley, Unharvested Corn, Cover Crops, and
Cover Crop Bales.
2 Average grazing start date each year: NR May - 4, Pea-Barley - July 16, Unharvested Corn – August 17, Cover Crop – October 18, Bale Grazing – November 1, End grazing and transfer to feedlot – December 15.
3 NR and ANN steers were removed from the respective NR and ANN grazing treatments and fed baled cover crop hay for 43.66d.
4 Trt – Treatment
5 Means with P < 0.05 differ significantly.
6 Marbling score: 400 = small; 500 = modest; 600 moderate
Table 3. Systems Three-year feedlot finishing performance of steers placed into feedlot after bale grazing.
|
|
|
|
|
P-Value5 |
|
|
ITEM |
ANN1, 2, 3 |
NR1, 2, 3 |
SEM |
Trt4 |
|
|
Number steers3 |
72.00 |
72.00 |
- |
- |
|
|
Days on feed |
95.67 |
95.67 |
- |
- |
|
|
Feedlot start Wt., lb |
1255.06 |
1168.75 |
18.70 |
0.04 |
|
|
Feedlot end Wt., lb |
1582.04 |
1508.00 |
23.99 |
0.19 |
|
|
Feedlot gain, lb |
326.98 |
339.25 |
15.03 |
0.57 |
|
|
Feedlot ADG, lb |
3.48 |
3.60 |
0.17 |
0.60 |
|
|
DM Intake, lb |
27.17 |
27.82 |
1.03 |
0.66 |
|
|
Gain:feed, lb |
0.13 |
0.13 |
0.004 |
0.72 |
|
|
Feed cost/steer, $ |
194.58 |
198.57 |
6.64 |
0.68 |
|
|
Feed cost/steer/day, $ |
2.08 |
2.12 |
0.10 |
0.78 |
|
|
Feed cost/lb gain, $ |
0.60 |
0.59 |
0.017 |
0.71 |
|
|
Total feedlot cost/steer, $ |
310.57 |
313.67 |
10.84 |
0.84 |
|
|
Total feedlot cost/lb gain, $ |
0.95 |
0.93 |
0.02 |
0.50 |
|
1 NR - Native Range; ANN – Grazing sequence: Native Range, Field Pea-Barley, Unharvested Corn, Cover Crops, and Cover Crop Bales.
2 Average grazing start date each year: NR May - 4, Pea-Barley - July 16, Unharvested Corn – August 17, Cover Crop – October 18, Bale Grazing – November 1, End grazing and transfer to feedlot – December 15.
3 NR and ANN steers were removed from the respective NR and ANN grazing treatments and fed cover crop hay for 43.66 d before transfer to the University of Wyoming, SAREC feedlot, Lingle, Wyoming.
4 Trt – Treatment
5 Means with P < 0.05 differ significantly.
Table 4. Three-year effect of grazing system on closeout carcass characteristics.
|
|
|
|
|
P-Value5 |
|
ITEM |
ANN1, 2, 3 |
NR1, 2, 3 |
SEM |
Trt4 |
|
Number steers |
72.00 |
72.00 |
|
|
|
HCW, lb |
980.69 |
924.14 |
16.91 |
0.03 |
|
Dressing Percent, % |
61.83 |
62.48 |
0.12 |
0.01 |
|
Fat depth, in |
0.53 |
0.46 |
0.024 |
0.04 |
|
REA, sq. in |
14.64 |
14.34 |
0.33 |
0.33 |
|
REA : HCW ratio, sq. in |
1.50 |
1.56 |
0.02 |
0.007 |
|
Marbling score6 |
552.96 |
531.11 |
13.25 |
0.49 |
|
USDA YG |
2.85 |
2.56 |
0.088 |
0.01 |
|
QG Choice or better, % |
98.61 |
98.61 |
1.39 |
1.00 |
|
Grid Market Price/CWT, $ |
205.87 |
207.51 |
1.50 |
0.49 |
|
Gross carcass value, $ |
2013.93 |
1921.67 |
27.90 |
0.031 |
1 NR - Native Range; ANN – Grazing sequence of Native Range, Field Pea-Barley, Unharvested Corn, Cover Crops, Cover Crop Bales.
2 Average grazing start date each year: NR May - 4, Pea-Barley - July 16, Unharvested Corn – August 17, Cover Crop – October 18, Bale Grazing – November 1, End grazing and transfer to feedlot – December 15.
3 NR and ANN steers were removed from the respective NR and ANN grazing treatments and fed cover crop hay for 43.66 d before transfer to the University of Wyoming, SAREC feedlot, Lingle, Wyoming.
4 Trt – Treatment
Means with P < 0.05 differ significantly.
6 Marbling score: 400 = small; 500 = modest; 600 moderate.
Table 5. Effect of three-year grazing system and bale grazing on system net return.
|
|
|
|
|
P-Value5 |
|
ITEM |
ANN1, 2, 3 |
NR1, 2, 3 |
SEM |
Trt4 |
|
Number steers |
72.00 |
72.00 |
|
|
|
Cow/Calf & Calf Backgrounding: |
|
|
|
|
|
Annual cow cost, $6 |
642.00 |
642.00 |
|
|
|
Winter feed cost, $ |
110.00 |
110.00 |
|
|
|
Total, $ |
752.00 |
752.00 |
|
|
|
|
|
|
|
|
|
Grazing Cost: |
|
|
|
|
|
Native range pasture, $7 |
115.30 |
207.77 |
|
|
|
Pea-barley annual forage, $ |
74.98 |
|
|
|
|
Unharvested corn, $ |
108.87 |
|
|
|
|
Cover crop, $ |
58.82 |
|
|
|
|
Total, $ |
357.97 |
207.77 |
|
|
|
|
|
|
|
|
|
Grazing Bale & Protein Supplement: |
|
|
|
|
|
Cover crop baled hay cost/str/day, $8 |
75.40 |
68.63 |
|
|
|
Grazing supplement cost/str/day, $ |
21.52 |
20.87 |
|
|
|
Baled hay supplement cost/str/day, $ |
13.55 |
13.55 |
54.45 |
1.00 |
|
Total, $ |
110.47 |
103.05 |
|
|
|
|
|
|
|
|
|
Feedlot Finishing Expenses: |
|
|
|
|
|
Feedlot cost/steer, $9 |
310.57 |
313.67 |
|
|
|
Total, $ |
310.57 |
313.67 |
10.84 |
0.84 |
|
|
|
|
|
|
|
System Net Return: |
|
|
|
|
|
Total System Expense, $ |
1531.01 |
1376.49 |
|
|
|
Carcass value, $ |
2013.93 |
1921.67 |
27.90 |
0.031 |
|
Net return, $ |
482.92 |
545.18 |
|
|
|
Difference, $ |
|
+ 62.26 |
|
|
1 NR - Native Range; ANN – Grazing sequence of Native Range, Field Pea-Barley, Unharvested Corn, Cover Crops, Cover Crop Bales.
2 Average grazing start date each year: NR May - 4, Pea-Barley - July 16, Unharvested Corn – August 17, Cover Crop – October 18, Bale Grazing – November 1, End bale grazing and transfer to feedlot – December 15.
3 NR and ANN steers were removed from the respective NR and ANN grazing treatments and fed cover crop hay for 43.66 d before transfer to the University of Wyoming, SAREC feedlot, Lingle, Wyoming.
4 Trt – Treatment
5 Means with P < 0.05 differ significantly.
6 Adopted from the North Dakota Farm Business Management Program years 2016, 2017, and 2018.
7, Native range pasture cost: First half of grazing season, $ ; Second half of grazing season, $
8 Cover crop hay price: Year 1 - $65/Ton, Year 2 -$95/Ton, Year 3 - $80/Ton.
9 Feedlot cost per steer: From Table 3.
Effect of Extreme Drought on Crop Rotation and Soil Physical and Microbial Property Changes for the period 2016-2020 in Western North Dakota
Results and Discussion
Precipitation during the first five-year rotation was variable, although, generally production was very good. Production for the second five-year period, in which the first four years have been completed, has been very different from the first five years and plagued with multiple environmental insults. The 2016 production year precipitation was considered normal for western ND, however, hail reduced spring wheat yields. The 2017 crop year for the region was rated as an extreme to exceptional drought by the U.S. Drought Monitor (June 27 - Figure 1; August 29 - Figure 2). Regional growing-season precipitation for the 2018 crop improved as indicated by the U.S. Drought Monitor (June 26 - Figure 3; August 28 – Figure 4) and crop yields improved somewhat. The 2019 growing-season precipitation was normal as indicated by the U.S. Drought Monitor (June 25 - Figure 5; August 27 - Figure 6). Fall 2019 was one of unseasonal precipitation in which the total August-September-October rainfall was 13.56 inches. This compares to a more typical fall precipitation of 3.24 inches for the three-month period, or 418% above normal. Sub-soil 2019 moisture carried over into the 2020 cropping season and essentially supported the 2020 crop, because growing season precipitation was diminished as shown in the U.S. Drought Monitor map for June 23, 2020 (Figure 7). The Fall 2020 August precipitation alleviated dry conditions somewhat based on the U.S. Drought Monitor map (August 18 – Figure 8).
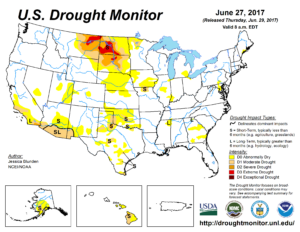
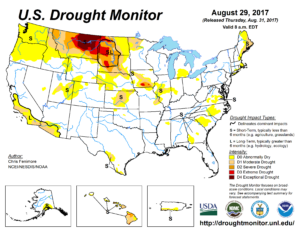


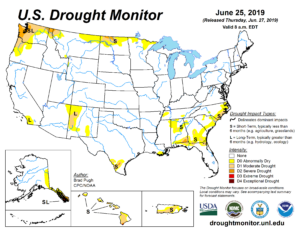
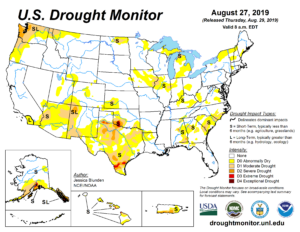
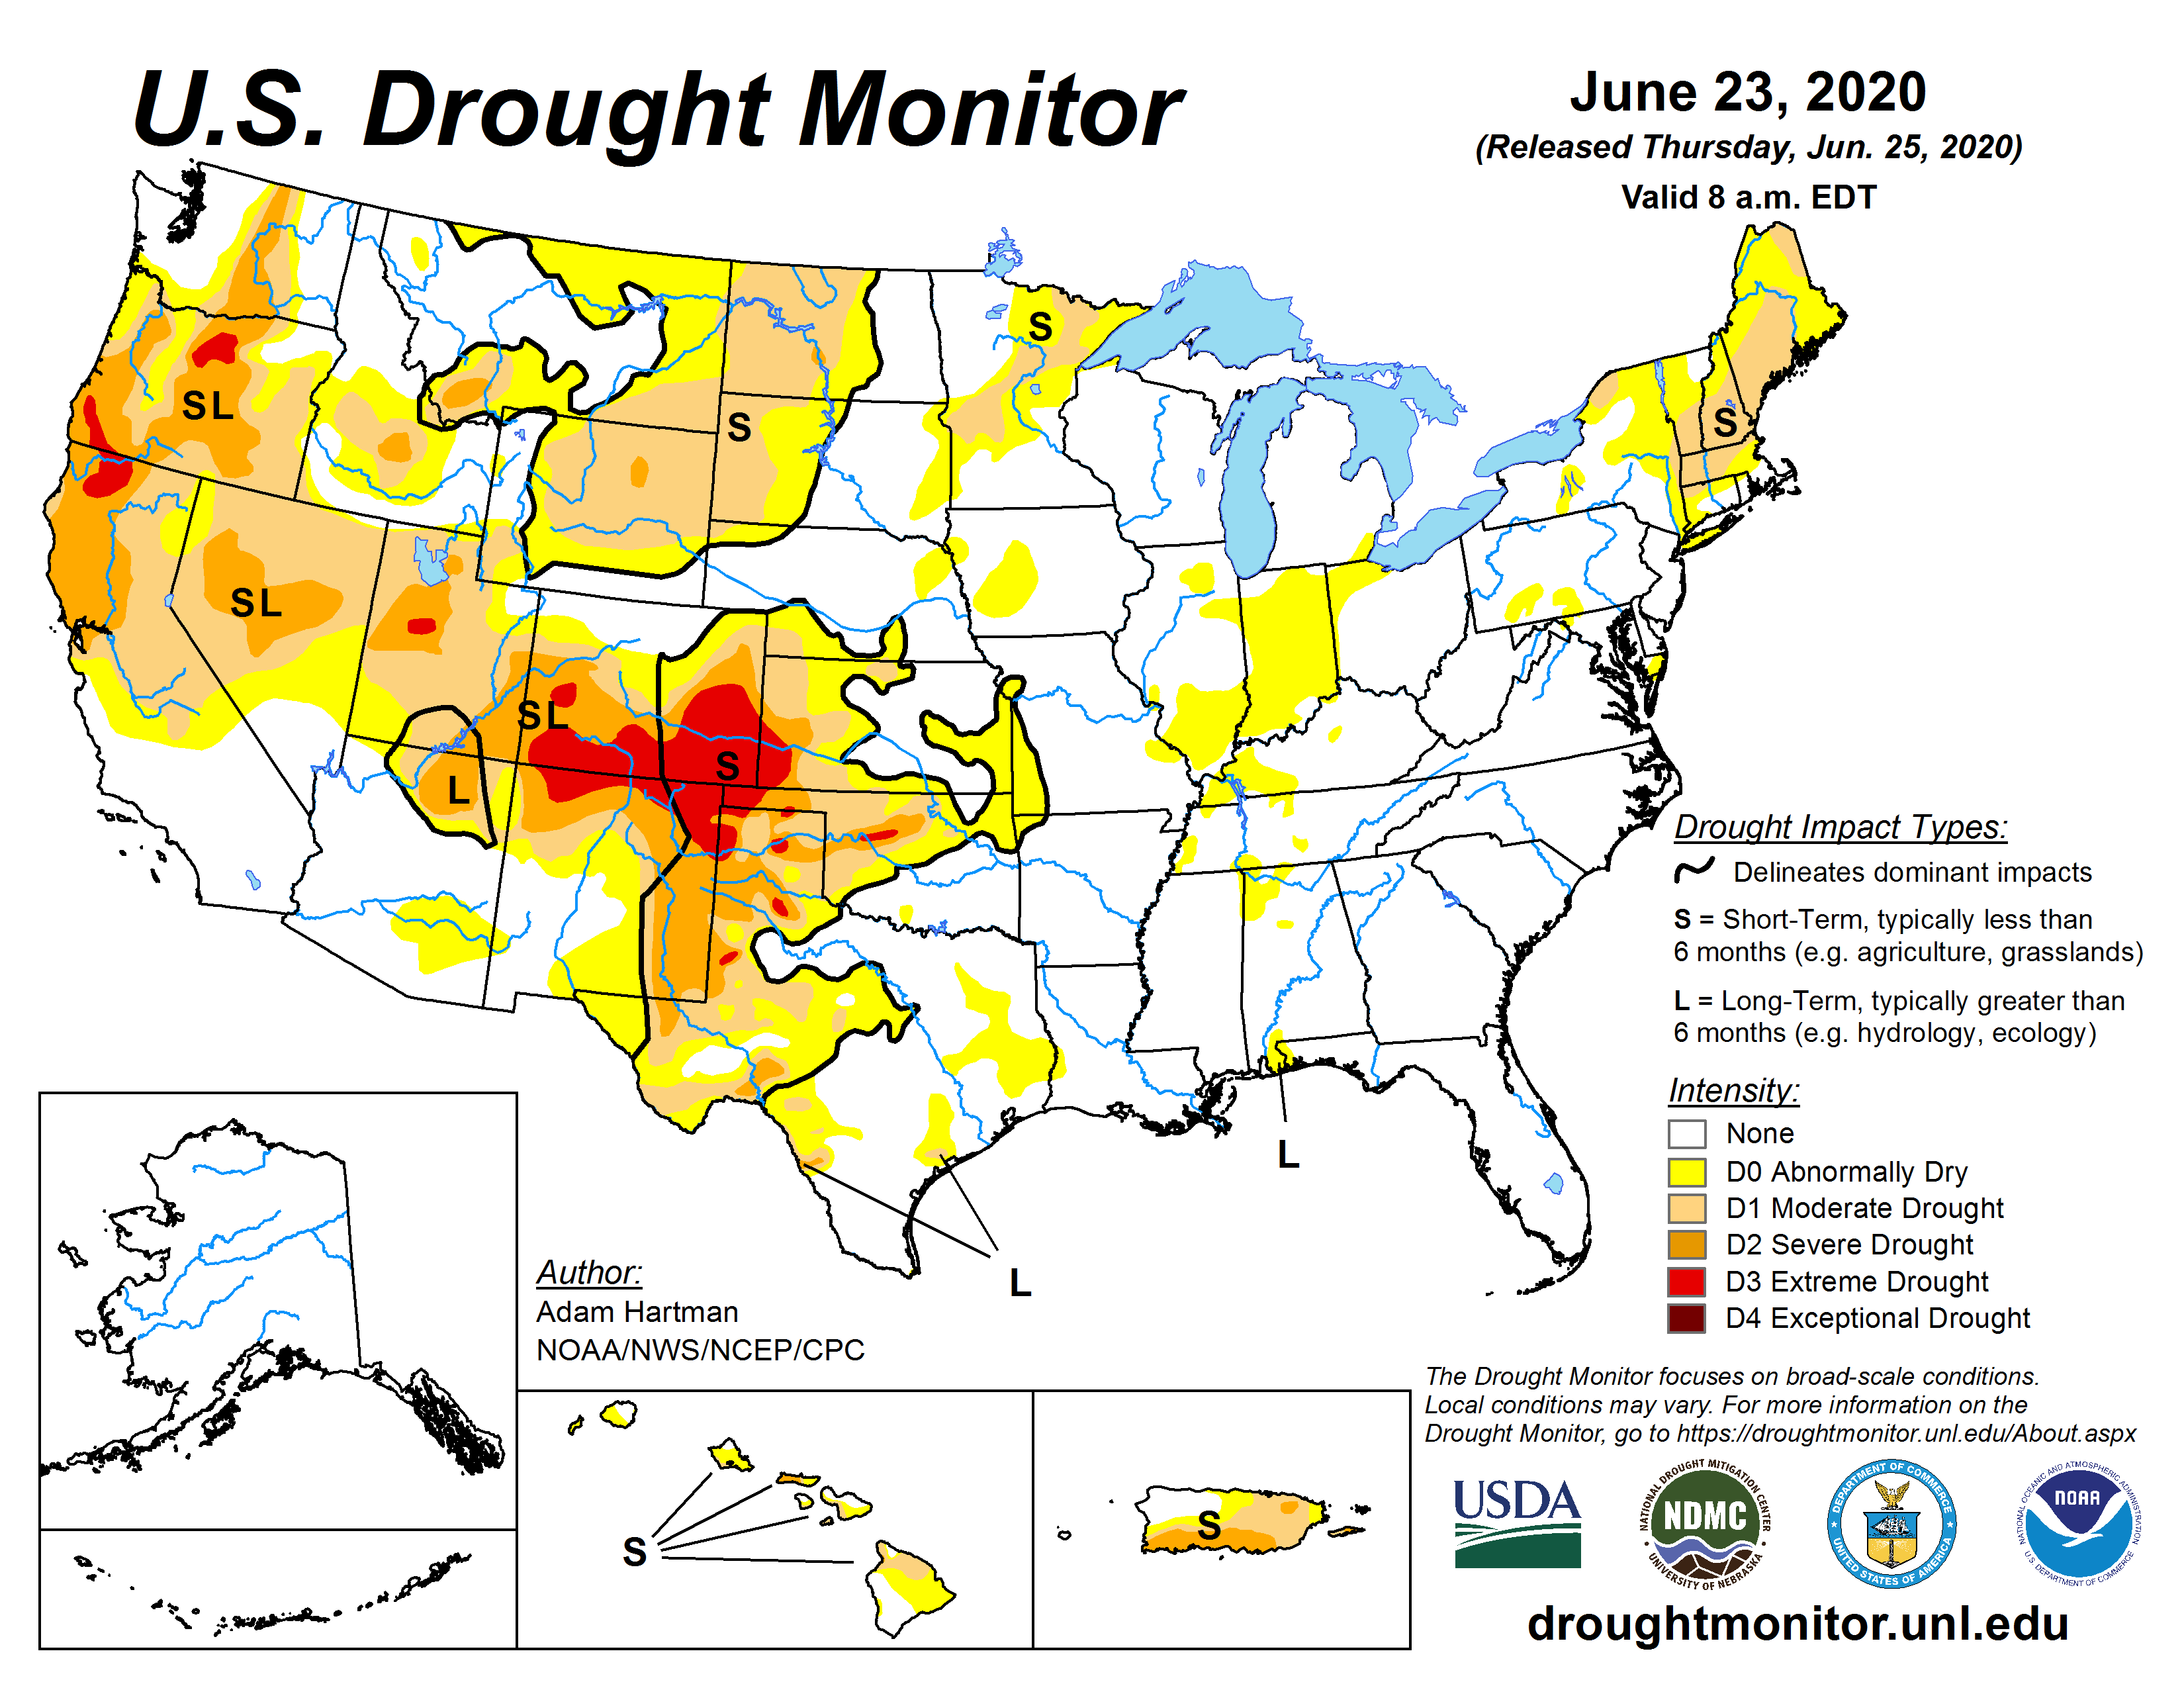
Figure 7

Figure 8
Control and rotation spring wheat yields for the period from 2016 through 2020 are shown in Figure 9. Compared to the initial 2016 crop year, control spring wheat yields were 39.6, -3.14, 16.9, and 1.03%, and rotation spring wheat yields were -6.46, -18.7, 24.5, and -3.74% in 2017, 2018, 2019, and 2020, respectively. Further, comparing the 1st five years of the study to the 2nd five years of the study, the effect of a drier cycle on spring wheat and rotation crops was evident. Compared to crop rotation yields for the first five-years (2011-2015), the second five-year yields (2016-2020) were 67.3, 68.4, 88.3, 66.6, 83.3, 69.0, and 66.5% of the first five-years for HRSW-C, HRSW-R, corn, pea-barley mix, cover crop mix, sunflower, and triticale hairy vetch, respectively.
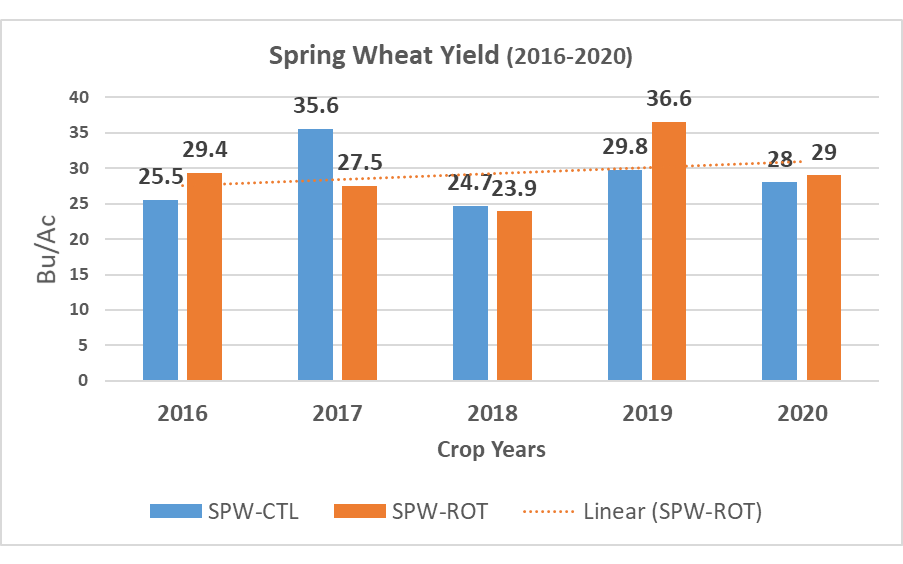
igure 9
Crop yields for rotation crops (triticale-hairy vetch, cover crop, corn, pea-barley, and sunflower) are shown in Figure 10. With the exception of sunflower, which was similar to 2016, other 2020 rotation crop yields were impacted negatively, i.e. pea-barley, corn, cover crop, triticale hair vetch mix yields declined 48.6, 22.4, 73.4, 15.2%, respectively.
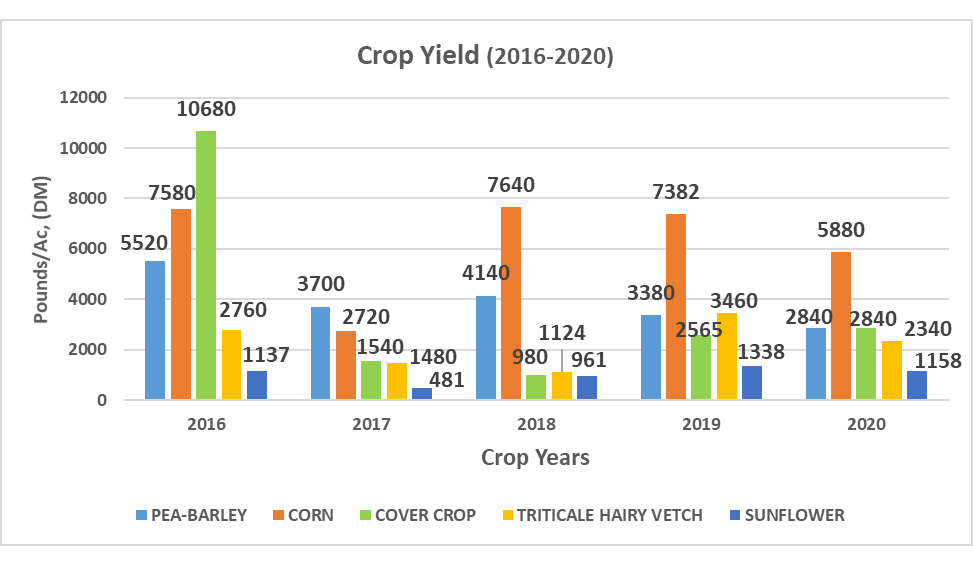
Figure 10
Haney test results comparing the 2017-2019-2020 cropping seasons are shown in Table 1. The 2017 drought year began with moist soils. The advancing growing season with significantly reduced precipitation dried soils and inhibited microbial activity. Microbes exist in soil in massive numbers and conform to the soil environment adapting to soil temperature, water content, soil type, and the amounts of available SOM substrate that supports them. Soil organic matter is subject to cropping system diversity ranging from monocultures to multi-crop rotations that supply root and residue substrates for decomposition and mineralization from organic to inorganic states utilized by growing plants. Lack of adequate soil water for soil nutrient solubilization and translocation negatively impacts a very complex biological system of microbial activity, nutrient translocation processes, and plant growth. Table 1 shows the extent of change comparing dry soil in 2017, moist soil in 2019, and somewhat drier soil in 2020 for pH, soluble salt, soil organic matter, CO2-C release, microbial active carbon percent, organic C: N ratio, organic N: inorganic N ratio, and organic N release. With drying, 2017 soluble salts became more concentrated resulting in a pH decline, more acidic soil conditions, and reduced root activity resulted in SOM decline across all treatments and crops. Microbial active carbon percent, organic C:N ratio, and organic N:inorganic N ratio also declined across treatments and crops except for the dual cover crop and sunflower. Under drought conditions, microbially active carbon was likely being lost and affected soil buffering reactions, and organic N release from soil in all treatments and crops was approximately 200% greater compared to moist conditions in 2019. The return of reduced precipitation in 2020 and effect on soil parameters is summarized in Table 1. Soil drying results in soluble salt concentration and soil pH decline. Soil pH declined among all crops except the pea-barley mixed crop in which pH increased toward neutrality. Drying conditions, for the most part, have negative effects on the soil criterion measured.
Table 1. Haney test microbial analysis for crop years 2017 – 2019 - 2020
|
CROP |
Year |
pH |
Soluble Salt |
SOM
|
CO2-C |
Microbial Active C |
Organic N:C |
Organic N: Inorganic N |
Organic N Release |
|
Units |
|
|
Mmho/ cm |
% |
ppm |
% |
Ratio |
Ratio |
ppm |
|
C-Crop |
2017 |
5.6 |
0.20 |
3.53 |
99.8 |
65.1 |
8.13 |
1.93 |
18.8 |
|
|
2019 |
6.9 |
0.10 |
3.80 |
103 |
99.8 |
11.43 |
1.37 |
9.23 |
|
|
2020 |
6.26 |
0.17 |
3.69 |
121.60 |
82.07 |
10.50 |
2.27 |
14.83 |
|
Sunflower |
2017 |
5.4 |
0.18 |
3.30 |
92.9 |
58.9 |
8.57 |
1.83 |
18.33 |
|
|
2019 |
6.5 |
0.09 |
4.23 |
72.5 |
62.2 |
13.17 |
1.53 |
8.9 |
|
|
2020 |
5.94 |
0.17 |
4.02 |
163.40 |
93.47 |
11.36 |
2.20 |
15.11 |
|
SPW-C |
2017 |
5.9 |
0.22 |
2.93 |
93.5 |
64.8 |
8.87 |
1.73 |
17.27 |
|
|
2019 |
6.0 |
0.07 |
3.37 |
83.4 |
74.6 |
13.2 |
2.00 |
8.37 |
|
|
2020 |
5.78 |
0.14 |
3.50 |
96.30 |
65.86 |
11.34 |
2.01 |
13.93 |
|
Corn |
2017 |
6.6 |
0.40 |
3.70 |
88.9 |
50.5 |
10.07 |
0.93 |
18.03 |
|
|
2019 |
6.8 |
0.09 |
3.73 |
78.9 |
75.8 |
12.13 |
1.20 |
8.77 |
|
|
2020 |
6.48 |
0.21 |
3.84 |
134.77 |
85.61 |
10.82 |
1.50 |
14.71 |
|
Pea-Bly |
2017 |
5.8 |
0.21 |
3.10 |
107.9 |
80.6 |
7.93 |
1.40 |
17.57 |
|
|
2019 |
6.3 |
0.08 |
4.80 |
78.5 |
66.6 |
13.13 |
2.10 |
9.03 |
|
|
2020 |
6.26 |
0.21 |
3.82 |
104.32 |
72.62 |
10.66 |
2.06 |
14.39 |
|
SPW-R |
2017 |
6.4 |
0.25 |
3.17 |
94.63 |
56.8 |
8.83 |
2.00 |
18.87 |
|
|
2019 |
7.0 |
0.08 |
3.87 |
132.1 |
112.9 |
12.43 |
2.23 |
9.37 |
|
|
2020 |
6.51 |
0.17 |
3.83 |
119.90 |
76.57 |
10.96 |
1.98 |
15.58 |
|
Combined |
2017 |
5.95 |
0.24 |
3.29 |
96.27 |
62.78 |
8.73 |
1.64 |
18.15 |
|
Crops |
2019 |
6.58 |
0.09 |
3.97 |
91.40 |
81.98 |
12.58 |
1.74 |
8.95 |
|
|
2020 |
6.19 |
0.18 |
3.80 |
123.74 |
78.82 |
11.03 |
1.95 |
14.74 |
While the Haney Test provided results of 24-hour microbial respiration, the PLFA microbial analysis provides measurements of the microbial community and organismal diversity. Microbial contrasts comparing crop years 2017-2019-2020 is shown in Table 2 and summarizes the effect of water stress on total biological biomass, diversity index, total bacterial biomass, total fungi biomass, and abruscular mycorrhizal fungi biomass. Total living microbial biomass expressed in nanograms/gram (ng/g) were rated as slightly above average in 2017 ranging from 1,466 to 2,021 ng/g and rebounded when adequate soil water conditions returned to amounts ranging from 4,462 to 5,325 ng/g that are rated as excellent for healthy soils. Mean difference, when all crops were averaged, shows the biomass resurgence resulting from adequate soil water. Although microbial population biomass declined with the ensuing drought, organism diversity remained largely unchanged ranging from an average 1.49 in 2017 to 1.51 in 2019 on a scale of 0.0 to 2.0. However, comparing 2020 soil microbial diversity to the previous years, there was 39.8% reduction in diversity resulting soil microbial diversity being downgraded from good/very good to average. Given the negative effect reduced soil water has on microbial populations, total bacterial biomass, total fungi biomass, and arbuscular mycorrhizal fungi biomass that rebounded after 2019 soil water increased was severely impacted negatively during the 2020 cropping season. Total fungi biomass was reduced and arbuscular mycorrhizal fungi (AMF) biomass could not detected in samples from cover crop, sunflower, corn, and HRSW-C. Slight quantities of AMF were detected from pea-barley mix fields and HRSW-R fields (Table 2).
Table 2. Phospholipid Fatty Acid (PLFA) microbial analysis results for 2017 – 2019 – 2020
|
Crop |
Year |
Total Biomass |
Diversity Index |
Total Bacterial Biomass |
Total Fungi Biomass |
Arbuscular Mycorrhizal Fungi Biomass |
|
Units |
|
ppm |
ppm |
ppm |
ppm |
Ppm |
|
C-Crop |
2017 |
2021 |
1.39 |
917 |
121 |
45 |
|
|
2019 |
4936 |
1.50 |
2255 |
643 |
172 |
|
|
2020 |
3083 |
1.08 |
953 |
39 |
0.00 |
|
S-Flower |
2017 |
1559 |
1.54 |
751 |
152 |
34 |
|
|
2019 |
5325 |
1.54 |
2298 |
870 |
187 |
|
|
2020 |
5177 |
1.10 |
2392 |
100 |
0.00 |
|
SPW-C |
2017 |
1466 |
1.61 |
796 |
155 |
45 |
|
|
2019 |
4485 |
1.49 |
1892 |
488 |
125 |
|
|
2020 |
5635 |
1.08 |
1943 |
102 |
0.00 |
|
Corn |
2017 |
1602 |
1.48 |
860 |
149 |
45 |
|
|
2019 |
4938 |
1.50 |
2111 |
615 |
172 |
|
|
2020 |
4940 |
1.05 |
1793 |
48 |
0.00 |
|
Pea-Bly |
2017 |
1644 |
1.39 |
832 |
132 |
33 |
|
|
2019 |
4679 |
1.49 |
2078 |
531 |
130 |
|
|
2020 |
5037 |
1.11 |
2052 |
96 |
6.43 |
|
SPW-R |
2017 |
1527 |
1.54 |
811 |
167 |
51 |
|
|
2019 |
4462 |
1.54 |
2137 |
422 |
117 |
|
|
2020 |
4072 |
1.06 |
1607 |
58 |
26 |
|
Combined |
2017 |
1637 |
1.49 |
828 |
146 |
42 |
|
Crops |
2019 |
4804 |
1.51 |
2129 |
595 |
151 |
|
|
2020 |
3992 |
1 |
1534 |
63 |
5 |
Soil minerals potassium (K), calcium (Ca), aluminum (Al), iron (Fe), sulfur (S), zinc (Zn), manganese (Mn), copper (Cu), magnesium (Mg), and sodium (Na) were similar to the concentration increases measured for the microbial soil characteristics as soil drying advanced resulting in mineral concentration during the 2017 crop year; however, soil mineral concentration declined in 2019 and 2020 compared to 2017 (Table 3) due to soil water dilution and plant utilization. For the 2020 cropping season, mineral concentrations fluctuated slightly, but were largely similar to 2019.
Table 3. Haney test microbial mineral analysis comparing 2017 - 2019 - 2020 crop years
|
Crop |
Year |
K |
Ca |
Al |
Fe |
S |
Zn |
Mn |
Cu |
Mg |
Na |
|
Units |
|
ppm |
ppm |
ppm |
ppm |
ppm |
ppm |
ppm |
ppm |
ppm |
ppm |
|
C-Crop |
2017 |
176 |
273 |
448 |
276 |
12.0 |
1.01 |
13.7 |
0.56 |
165 |
20 |
|
|
2019 |
135 |
583 |
234 |
114 |
6.5 |
0.68 |
16.0 |
0.17 |
159 |
16.3 |
|
|
2020 |
160.3 |
701.3 |
190.7 |
86.0 |
8.6 |
0.6 |
12.5 |
0.1 |
146.0 |
17.0 |
|
S-Flower |
2017 |
165 |
235 |
455 |
275 |
12.0 |
1.05 |
16.0 |
0.48 |
137 |
18.3 |
|
|
2019 |
187 |
635 |
212 |
126 |
5.7 |
0.81 |
10.5 |
0.18 |
188 |
21.0 |
|
|
2020 |
190.0 |
420.7 |
247.7 |
115.7 |
12.1 |
0.6 |
10.4 |
0.2 |
172.7 |
20.7 |
|
SPW-C |
2017 |
172 |
384 |
434 |
267 |
9.67 |
0.87 |
12.3 |
0.47 |
136 |
33.0 |
|
|
2019 |
139 |
522 |
253 |
135 |
4.23 |
0.53 |
13.5 |
0.20 |
146 |
15.0 |
|
|
2020 |
151.3 |
356.0 |
253.3 |
126.7 |
8.6 |
0.5 |
8.7 |
0.2 |
127.3 |
16.7 |
|
Corn |
2017 |
212 |
546 |
368 |
242 |
12.3 |
1.06 |
13.4 |
0.48 |
180 |
20.3 |
|
|
2019 |
141 |
510 |
259 |
141 |
5.1 |
0.83 |
17.1 |
0.18 |
138 |
16.7 |
|
|
2020 |
144.3 |
519.7 |
242.3 |
105.3 |
10.4 |
0.7 |
12.7 |
0.1 |
150.3 |
21.0 |
|
Pea-Bly |
2017 |
138 |
456 |
355 |
231 |
9.3 |
0.83 |
11.83 |
0.36 |
142 |
18.3 |
|
|
2019 |
172 |
426 |
247 |
127 |
5.2 |
0.72 |
12.73 |
0.19 |
181 |
18.7 |
|
|
2020 |
149.3 |
1232.0 |
161.3 |
81.7 |
9.3 |
0.6 |
9.7 |
0.1 |
154.3 |
16.7 |
|
SPW-R |
2017 |
137 |
844 |
312 |
207 |
10.0 |
0.86 |
15.8 |
0.29 |
140 |
15.0 |
|
|
2019 |
135 |
643 |
203 |
106 |
5.6 |
0.71 |
14.8 |
0.14 |
163 |
15.3 |
|
|
2020 |
168.7 |
939.3 |
189.7 |
93.7 |
10.9 |
1.0 |
9.4 |
0.1 |
164.3 |
21.3 |
|
Combined |
2017 |
167 |
456 |
395 |
250 |
10.9 |
0.95 |
13.84 |
0.44 |
150 |
20.8 |
|
Crops |
2019 |
152 |
553 |
235 |
125 |
5.4 |
0.71 |
14.11 |
0.18 |
163 |
17.2 |
|
|
2020 |
159.0 |
555.4 |
284.7 |
160.3 |
8.8 |
0.8 |
12.9 |
0.3 |
155.1 |
19.0 |
Mineral N Cycling in an Integrated Crop-Grazing System
Results and Discussion
Changes in mineral N cycling were observed as changes in PMN during the two seasons evaluated thus far in this study (Figures 1 and 2). Potentially mineralizable N is higher in the rotational HRSW (Figure 1) soils due to several factors:
- A continuous system of diverse crops is growing in the rotational system which then are available for animal forage. This is an ideal system to consider the effects of cover crops in maintaining soil health over a long-term period. Some of the plant species/crops included are normally seeded as grain or forage crops but fall seeded crops such as the triticale/vetch crop also act as cover crops.
- A diversity of crops that include legumes as forage crops enhance soil N because of the roots and crowns that remain in the soil after harvest/grazing.
- Animals grazing the crops also distribute dung and urine across the field as they graze which add to the N budget of the soil.
- These are not normally found in traditional systems similar to the continuous HRSW treatment.
- In this semi-arid environment, the no-till system also conserves precious soil moisture to be utilized more efficiently by crops and providing a favorable environment for microorganisms in cycling N.
Regression analysis between SOM and PMN thus far indicate that about 8.4 mg N/1% SOM/kg soil are being mineralized across this study (n = 148, R2 = 0.21***) Although the R2 value for this data is relatively low (0.21), it is highly significant (p > 0.001) due to the large number of data points we have been able to collect to establish a clear relationship of SOM with PMN Early season sampling dates give higher PMN values than later sampling dates because of the effect of the previous season’s crop residues that are decomposing while this season’s crops are still growing and not contributing to the SOM pool (Figure 2).
Summary
Our work continues to show the dynamic nature of N cycling in an integrated crop-grazing system in a semi-arid environment. We have and are continuing to evaluate the soil PMN dynamics for the 2017 and 2018 cropping seasons with mineralization studies that are currently ongoing
Table 1. Soil sampling dates for 2014 and 2016 growing seasons.
|
2014 Sampling Dates |
2016 Sampling Dates |
|
June 2 (6/2) |
June 2 (6/2) |
|
June 16 (6/16) |
July 27 (7/27) |
|
June 30 (6/30) |
August 31 (8/31) |
|
July 14 (7/14) |
October 13 (10/13) |
|
August 11 (8/11) |
|
|
September 14 (/14) |
|
Figure 1. Potentially mineralizable N as influenced by cropping treatment for the 2014 (A) and 2016 (B) cropping seasons. CSW – continuous spring wheat; RSW – rotation spring wheat; NAT – native grassland. Bars with the same small case letters are not significantly different at the P < 0.05 level.
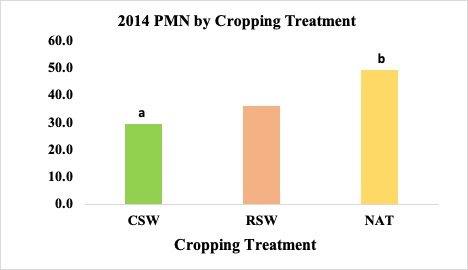
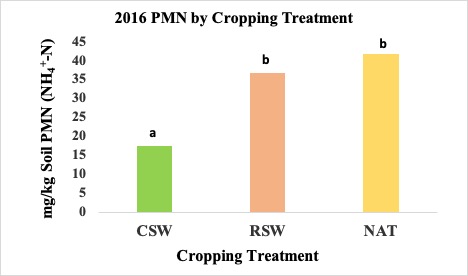
Figure 2. Potentially mineralizable N as influenced by sampling date for the 2014 (A) and 2016 (B) cropping seasons. Bars with the same small case letters are not significantly different at the P < 0.05 level. No significant differences between the 2014 sampling dates.
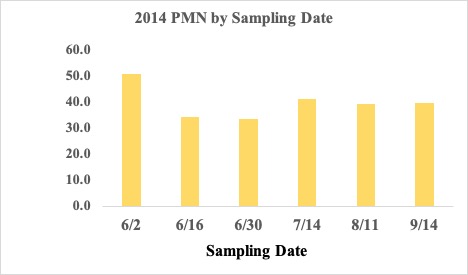
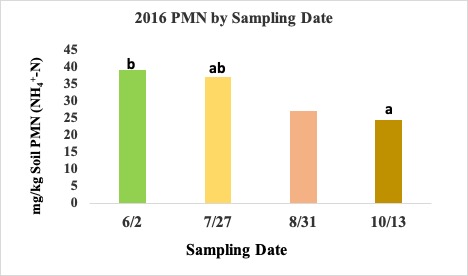
Integrated Systems Molecular Analysis of Soil Nitrogen Cycling Genes
After water, nitrogen is often the limiting soil nutrient in dry-land agricultural systems and is known to be converted into different forms in the soil by soil bacteria. Therefore, an analysis of the presence and quantity of nitrogen cycling genes was performed on soil samples from the 2019 sampling period. Genes involved in nitrogen fixation (nifH), nitrification (amoA/B), and denitrification (nirS, nirK, and nosZ) were analyzed via qPCR (quantitative Polymerase Chain Reaction). Nitrogen fixation is the conversion of nitrogen gas from the atmosphere into NH4+, nitrification is the eventual conversion of NH4+ to NO3-, and denitrification is the conversion of NO3- to nitrogen gas (released back to the atmosphere).
Samples for the presence of nitrogen cycling genes were collected on August 27, 2019, at which time spring wheat and rotation crops (pea-barley) had been harvested and corn was being grazed. Cover crops were growing, but not scheduled for grazing until after corn grazing was completed. Essentially, early Fall season. Although analysis is still ongoing, it appears that there is an increased abundance of genes involved in denitrification compared to both nitrogen fixation and nitrification. Suggesting that limited nitrogen nitrification and fixation were possible when soil sampling took place. Future research will look into how nitrogen cycling genes respond using repeated sampling during the full growing season spectrum from May through October.
Crop Production:
Results from the first five-year rotation showed improved yield of all crops compared to the second five-year rotation and residual soil nitrogen at the end of the growing season was considered to be high. Therefore, to document resultant events when nitrogen fertilizer was removed entirely, the second five-year crop rotation had no nitrogen fertilizer applied. Along with no nitrogen fertilizer, the five-year period was drier than normal. Cool-season crops grow very well in the climate of the northern Great Plains and warm-season crops do as well. Late-April, May, and Early-June soils are generally moist, but cool (40-50 F). As such, cool spring soils are not as conducive to stimulating soil microbial community activity as they are when soil temperatures range from 65-85 F. Depending on sub-soil moisture at the time of seeding, the recommendation from this research is that a starter application of 35-55% of soil test recommendation be applied with the seed at planting to provide required plant nutrients until soil microbial nutrient cycling reaches peak activity. The higher amount of the recommendation would be applied when stored soil moisture extends to 3.5 - 4.0 feet and the lower percentage when soil moisture only extends 1.0 - 2.0 feet.
Beef Cattle Production and Greenhouse Gas Emissions:
North Dakota as a beef cattle producing state is considered to be largely a cow-calf state in which producers expend tremendous energy and resources to produce some of the highest quality northern feeder cattle to be exported to Midwestern cattle feeding and finishing states. In doing so, cow-calf producers are not capitalizing, but exporting more than 50% of the genetic merit they have invested in.
This SARE funded research set out to investigate the complementarity available when yearling steers wintered for modest gain graze for an extended grazing season from the first week of May to mid-December grazing either native range or a combination of early-season native range followed by annual forages in a diverse cropping system that included spring wheat and sunflower as combined cash crops and cover crop, corn and a pea-barley mix for grazing. Then when grazing was exhausted, the steers continue to be fed cover crop baled hay put up in July that contained 12-13% CP.
Feeding baled hay in a free-ranging “bale grazing” environment extended the grazing season 41.5 days and withheld the steers out of the feedlot by that amount of time. Overall, steers grazing native range only gained 1.70 lb/day for the 221.5-day grazing period and grazing a combination of native range and annual forage supported ADG of 2.10 lb/day. Steers enter the feedlot heavier, gain at an accelerated rate due to compensating gain, and are more efficient than bawling 450-650 lb calves.
Steers grazing native range and annual forage were heavier and had greater ending ultrasound ribeye area and percent intramuscular fat, but marbling score did not differ. Suggesting that forage sequence grazing support improved meat quality compared to grazing native range only.
Retained ownership, long-term grazing period, and abbreviated finishing period translate into profitable net returns to the beef cattle component of the integrated system.
Integrating grazing in the cropping system supplies animal waste as an additional source of organic matter for soil nitrogen mineralization.
Integration also benefitted the system such that CO2 was reduced, N2O tended to be reduced, but CH4 was unchanged.
Soil Health:
Soil microbiology:
Extended dry conditions during the second five-year crop rotation stalled microbial activity beginning with the excessive drought of 2017. Microbial community analysis observations showed that the populations needed to be rejuvenated once soil was rewetted in 2018 and 2019. Drying concentrated soil soluble salts, reduced soil buffering capacity, and consequently soil pH declined. The 2020 crop year had significant sub-soil moisture from excessive 2019 fall rains, but limited amounts of spring precipitation dried the upper 3-6 inches of soil. Consequently, mycorrhizal fungi could not be found in cover crop, sunflower, spring wheat (control), and corn, and only small amounts were observed in the spring wheat (rotation) and pea-barley mix. This doesn’t diminish the many positive attributes that crop rotation and integrated beef cattle grazing have on soil health, but does show that drought can change dynamics until environmentally wet cycles return.
Soil physical properties:
Water infiltration, wind erodibility and water stable aggregates were evaluated during the 2017 growing season. No significant differences were observed between any of the crops evaluated. However, numerically higher infiltration, wind erodible fraction and water stable aggregate values for the rotation spring wheat may be indicating that the crop rotations are having an impact on the soil quality in that more stable aggregates, although likely smaller in diameter, are found in the rotational wheat. Continuous wheat aggregation appears to be more massive (or not aggregating at all) contributing to the results observed. In general, smaller stronger aggregates appear to be present in the rotational wheat as compared to the continuous wheat indicating the positive effect of the crop rotation on soil structure. However, due to the extremely dry weather during 2017, the smaller but stronger aggregates could increase wind erodibility, but also appear to enhance water infiltration.
Soil nitrogen mineralization:
Changes in mineral N cycling were observed due to several factors:
A continuous system of diverse crops growing in the rotational system are available for animal forage. This is an ideal system to consider the effects of cover crops in maintaining soil health over a long-term period. Some of the plant species/crops included are normally seeded as grain or forage crops, but fall seeded crops such as the triticale/vetch crop also act as cover crops in the system.
Roots and crowns that remain in the soil after mechanical harvest or grazing from legumes in cover crops and mixed forages enhance soil N.
Animals grazing in the diverse crop rotation distribute waste that adds to soil organic matter and to the soil N budget.
In this semi-arid environment, the No-Till system also conserves precious soil moisture to be utilized more efficiently by crops and providing a favorable environment for microorganisms in cycling N. Nonetheless, as previously stated, excessive drought can and does overwhelm the water holding capacity and even soils with 4-6% SOM become very dry and microbial activity stalls.
Regression analysis between SOM and potential mineralized nitrogen thus far indicate that about 8.4 mg N/1% SOM/kg (16.8 lbs. N for each 1% increase in SOM) soil are being mineralized across this study (n = 148, R2 = 0.21).
Education
Information for this section is posted in the project activities section for calendar years 2017, 2018, 2019, and 2020.
Project Activities
Educational & Outreach Activities
Participation summary:
Description for numerous education/activities/outreach are defined in the Project Activities section.
Learning Outcomes
- Cropping System for Integrated Beef Cattle Production
- Crop Sequence, C:N ratio effect on SOM decomposition and nutrient mineralization; rotation crop sequence placement
- Effect of Diverse Crop Rotation and Cover Crops on Soil Health and N-mineralization increase; potential of 16.9 lbs of N for each 1% increase on SOM. Nitrogen mineralization reduces dependance on exogenous N fertilizer input.
- Producer Introducction to Microbial Soil Analysis and effect of drought on microbial biomass, C and N processes, pH decline and mineral concentration
- Yearling Steer Retained Ownership Birth to Slaughter Concept and positive effect on system profitability
- Perennial and Annual Forage Grazing for Long-Term Extended Grazing Yearling Steer Growth
- Integrated Systems Profitability
- Using bale grazing after native range and annual forage grazing ends, but before feedlot entry, extends the period of time outside of the feedlot and can be profitable for both annual forage and native range grazing systems.
- Dry cycles of reduced precipitation over time reduce microbial activity and subsequent nitrogen mineralizaton. The long-term research in this project without the addition of nitrogen fertilizer resulted in reduced crop yields and in the case of spring wheat, both yield and grain protein values were reduced. In the semi-arid region of western North Dakota, applying 40-60% of the full soil test fertilizer recommendation is suggested for early spring plant growth before soil warms sufficiently for microbial nutrient cycling and mineralization.
Project Outcomes
Added season-long cover crops to their crop rotation. Some producers are using a relay crop concept in which cool season and warm season species are seeded at the same time. Cool season crops that grow in cooler soil temperatures are harvested leaving a somewhat taller stubble and leaf material on the warm season crops, which flourish after the cool season crop canopy is removed.
Used aerial seeding to apply cover crop seed to an established corn crop.
Retained ownership of a mix of steers and heifers for an extended grazing program from birth to slaughter employing native range, cover crops and unharvested corn as grazing crops prior to delayed feedlot entry.
Increased the number of crops in a crop rotation to add diversity, soil armor, nitrogen accumulation, and added livestock to the system.
Mixed grain and livestock producers in western North Dakota are interseeding cover crop mixes into their spring wheat; combining the spring wheat leaving taller stubble that allows the cover crop to continue growing and grazing the cover with cows after weaning.
Innovative cattlemen are planting a multi-specie cover that also includes sweetclover, a biennial legume crop, thereby producing a hay crop the next season. The practice yields two crops with a single seeding the first year.
Farmers that do not raise livestock, but have heard the soil health message want to have cattle grazing on their farms. However, grain and oilseed farms without the necessary basic infrastructure (fences, water, and wind protection) are challenged. Nonetheless, farmers are overcomers and are developing business arrangements with cattlemen to graze crop residue. When business arrangements for grazing crop residue, i.e. corn residue for example after harvest, is less expensive than feeding hay it is a win-win situation. Thus, leaving organic matter from animal waste in the field. Networking arrangements are definitely a work in progress, because infrastructure establishment is expensive. Temporary high tensile electric fence and portable frost-free watering systems have the potential to solve these hurdles.
A mixed crop and livestock producer in Stark County, ND, retained ownership on 25% of his bottom end heifer and steer calves, and carried them through to finish and slaughter using principles from the Birth to Slaughter Retained Ownership Program. The Birth to Slaughter Retained Ownership Program concept was developed in previously funded SARE research at the North Dakota State University, Dickinson Research Extension Center. After accounting for all expenses, the producer netted $617.70 per animal.
A large grain farmer from northcentral North Dakota has a history of trying new approaches with alternative crops in his rotation, intercropping crops of similar maturity (peas and canola for example) and separating after harvest, and established a cow/calf grazing area (320 ac.) that he rotates annually. Cow-calf pairs are provided by a neighbor in the business arrangement that both are pleased with.
A large cattle producer (1,500 cows) with significant crop acres also is utilizing cover crops, dual year cropping with sweetclover in the multi-specie cover mix, and underseeding 320 ac. of spring wheat with an adapted cover crop mix. Spring wheat yield was not affected by the cover crop, which could become a moisture and nutrient competition problem for the wheat. This on-farm experiment didn't produce enough grazing for 500 cows, however, but is expected to increase SOM combined with animal waste. Collectively, a win-win situation for soil health.
A reputation purebred Angus ranch that routinely sells 180 registered bulls and 800 commercial customer heifers also farms several thousand acres of crops in a diverse crop rotation. From a simple beginning planting 50 acres of cover crops, the ranch now includes upwards of 350 acres of multi-specie cover crops in their diversified crop rotation. The cover crop forage is used for hay or late fall grazing where water and fencing are established.