Final report for LNC17-388
Project Information
Tomatoes are a key crop for organic and diversified fresh market vegetable growers in the North Central Region (NCR). Growers face challenges with field tomato production, due to short seasons, increasingly erratic weather producing larger rainfall events, and high disease pressure. Many growers have begun using high tunnels as a partial solution to these problems, because this offers some protection from high rainfall events and foliar disease while extending the growing season. However, high tunnels come with challenges of their own, particularly stationary high tunnels that reduce growers' rotational options. Mobile high tunnels allow for rotation and soil building practices, but are more expensive than high tunnels. Caterpillar tunnels may provide some of the same benefits as mobile high tunnels with a much lower cost but this has not been tested in the NCR.
In addition, tomato varieties developed specifically for field and the high tunnel production would benefit growers in the NCR. This includes varieties bred for organic field environments, with better combinations of flavor, disease resistance, durability and resistance to cracking than current options, and varieties developed specifically for high tunnel production, with more concentrated fruit set and shorter production seasons, to allow for rotation to a cover or winter crop without sacrificing flavor, quality or overall yield.
This project is designed to address the challenge of producing high quality tomatoes organically for local markets in the NCR by comparing production, disease mitigation and cost in high tunnels, caterpillar tunnels and field production, so growers can base management decisions on reliable information about the benefits and drawbacks of each system and selecting early tomato varieties for high tunnels, with improved flavor and more concentrated fruit set to give growers more rotational options in high tunnels and selecting tomato varieties that are more robust for the field, with improved disease resistance and flavor. These build on our current work and respond to grower needs. We relied on participatory research with growers, including on-farm trials managed by growers and on-station trials advised by growers. This project involves farmers in both the management trials and in variety selection. Outcomes from this research will include information on the relative costs and benefits of different management systems, advanced tomato breeding populations developed for organic field and high tunnel production, and a stronger network of participatory research and farmer-focused cultivar development in the NCR.
For tomato production the high tunnel and caterpillar tunnel both had significantly higher marketable yields than the field production system in both locations. However, as there were system-specific differences in the prevalence of certain causes of unmarketability, such as blossom end rot, choosing varieties that are less susceptible to these particular problems for specific systems may be beneficial to growers. Both tunnel systems had higher ˚Brix levels compared to open field but there were no significant differences between tunnels. This may be explained by the higher temperatures and lower soil moisture levels in both tunnels compared to the open field. The tastings confirm what was found in the ˚Brix and CA, with higher perceived sweetness in the tunnels compared to the open field, and higher acidity in the open field compared to both tunnels, with no significant difference between tunnels. The high tunnel and caterpillar tunnel both showed a significantly higher overall flavor rating compared to the open field. Caterpillar tunnels require a significantly smaller initial investment compared to high tunnels, due to lower purchase and installation costs and produce similar benefits in terms of production and quality. A drawback of caterpillar tunnels is the significant time needed for ventilation, and innovations for less labor intensive ventilation systems would be welcome.
In the breeding component of the project we evaluated crosses between many parents chosen for performance in the high tunnel and the field. We selected based on production, disease resistance and fruit quality traits, resulting in lines from 7 different families being advanced. We evaluated 22 tomato breeding lines and commercial varieties in a replicated trial in 2020 and 2021. The breeding line had a significant effect on all the production traits, early blight and leaf mold and on all the fruit quality traits except for bitterness. The productivity of the breeding lines was lower than the check varieties, but the genetic variance for most traits of interest and heritability were both high. This indicates room for improvement in these traits, although with the caveat that these calculations are based on a single location and a single year. Their was a negative correlation between marketable weight and the fruit quality traits will be a limitation for future selections.We also had disappointing field performance in the face of severe disease pressure and are planning to also incorporate single-gene resistance in future breeding lines for early blight and septoria. Next steps for this project include trialing lines in more locations and farms to determine if they should be released. Promising lines could also become parental line material for future breeding programs.
This project developed new breeding populations of tomatoes with excellent quality and adaptation to organic diversified vegetable farming in the upper Midwest. We also provide recommendations on the use of lower-cost mobile alternatives to high tunnels. We aim to develop better variety options for high tunnel production and for field production, with traits specific to those systems. We have strengthened our current on-farm trial network to continue to support peer-to-peer information sharing among growers. This will help farmers meet market demand for high quality local produce.
The goals of this project were to improve options for sustainable and profitable direct-market tomato production in the Upper Midwest. We evaluated strategies that will give growers economical options for improving production, including: 1) evaluating lower-cost alternatives to high tunnel production such as caterpillar tunnels, 2) selecting varieties for shorter-season production in high tunnels, giving growers more rotational options before or after tomatoes, and 3) lowering the risk of field grown tomatoes through selecting disease resistant and dual purpose varieties, with both excellent fresh and processing characteristics. We conducted both on-farm participatory trials with organic farmers and organic trials on two research stations to ensure that results provide immediately relevant results to farmers.
High Tunnels are a common management strategy, and provide many benefits, but also present both management and financial difficulties to growers.
Tomatoes are one of the most profitable crops for organic and direct market growers in the NCR. An increasing number of diversified vegetable growers are using high tunnels to improve tomato production in the short growing season of the upper Midwest. High tunnels are one of the most widely adopted season extension techniques, and have become an extremely important technique for vegetable growers in the United States and worldwide (Hodge et al. 2018, Lamont, 2009, Zhao and Carey, 2009).
High tunnel management benefits tomato production, providing higher quality, higher yield and a longer harvest season (O’Connell et al. 2012, Hodge et al. 2018, Healy et al. 2016). High tunnels can achieve these benefits by modifying environmental conditions such as rainfall, significantly reducing disease pressure. This is particularly important as direct market growers often prioritize varieties with good quality over disease resistance if they must make a choice. Field-grown tomatoes, while still profitable, are more at risk for disease and splitting, and many growers report a much higher rate of loss from field grown than hoop house tomatoes (Healy et al., 2016). Our SARE-funded research (LNC14-357) compared 20 varieties in high tunnel and field management and found an increase in yield of 20% in 2014 (a low disease year for the field), 45% in 2015, and 200% in 2016 (a very high disease pressure yield for the field) in the high tunnel compared to field trials over the same set of cultivars (Healy et al. 2016). The increased yields were primarily due to reduced disease pressure in the high tunnel. Our main foliar diseases are early blight and septoria. Because of the reduction in spore deposition of these pathogens in the high tunnel and the reduction of rain splashing and continued moisture that allows pathogens to spread, high tunnel plants remain healthy during most of the growing season, while neighboring field production may collapse due to high foliar disease pressure.
However, after multiple years of cultivating tomatoes in the same location in a stationary high tunnel, many growers report a buildup of other diseases, such as grey mold and various types of mildew (Miller 2015). Also, because tomatoes are a full season crop, they leave little time to plant a cover crop after tomatoes are finished or before tomatoes are planted to be able to correct some of the issues including soil organic matter depletion, increasing the dependency of farmers on external inputs for fertilizer, therefore increasing the costs. This reliance on external fertilizer, combined with the lack of rainfall, may lead to nutrient imbalances and salt buildup as well as general depletion of soil organic matter. Many farmers are struggling to find sustainable rotations for high tunnel structures, because the value of tomatoes makes it difficult to take a hoop house out of tomato production for a season. To mitigate some of these issues, movable high tunnels allow farmers to follow rotations and maintain soil health.
Mobile high tunnels present a possible solution to the linked problems of inadequate rotation, disease buildup and declining soil fertility. The objective of a mobile tunnel is to allow growers to move the tunnel in the rotation with the high value crop that is grown in it, so that they are not always using the same spot for high tunnel production. With a mobile tunnel, growers can use rotations, cover cropping and other standard techniques for preventing pest, pathogen and soil problems without giving up a season of high tunnel production for their tomatoes. Moving the high tunnel also allows rainfall to flush salts back down into the soil profile. Mobile high tunnels however, have significantly greater costs than stationary tunnels, often up to twice the cost for materials. This is mostly because the frame must be built more solidly to withstand winds and other severe weather, as a mobile tunnel frame cannot transfer this force to the ground as a stationary tunnel does. Mobile tunnels on tracks also restrict equipment access to parts of the field and need to be maintained.
For these reasons, many growers are looking at caterpillar tunnels as a potentially lower cost structure to achieve the goals of mobile high tunnels with less capital cost up front and lower costs of yearly maintenance. However, there has not been much research done comparing the relative cost/benefit of these structure types in terms of tomato season extension, productivity, or disease mitigation. Caterpillar tunnels are certainly more affordable and provide a great degree of flexibility. Caterpillar tunnels are very customizable in terms of dimensions and are easy to assemble, allowing farmers to move them with tomatoes in extended rotations, avoiding soil imbalances or disease buildup. Given the importance of high tunnels and the potential benefits that caterpillar tunnels may bring, it was important to compare high tunnel, caterpillar tunnel and open field tomato production, disease incidence and quality.
Research has been done comparing open field and high tunnel production (O’Connell et al., 2012, Healy et al. 2016, Hodge et al. 2018), but has not included caterpillar tunnels, especially in the NCR. Several SARE projects have looked at high tunnel or caterpillar tunnel production, none have compared tomato production in the field, caterpillar tunnels and high tunnels for a representative set of varieties. Growers in the upper Midwest are experimenting with caterpillar tunnels and high tunnels on their own, but would like to see reliable numbers on expected production and labor for caterpillar tunnels compared to high tunnels so that they can weigh the costs and benefits when making decisions about where to invest on their farms.
High tunnels and caterpillar tunnels may also play a role in mitigating high rainfall events experienced in the North Central Region in recent years. While they may provide greater protection to the crop, high tunnels also increase the risk of loss due to storms or extreme weather events that may destroy high tunnel plastic and frames. Lower cost structures would present possibly less protection, but also much lower levels of financial risk if a structure or crop growing in the structure are destroyed.
In addition to providing information comparing management options, we need to develop cultivars specifically for high tunnel and field management to give growers the best options for each system.
Tomatoes have been repeatedly identified as a top priority for breeding work focused on organic systems (Lyon 2015, focus groups 2016). While a wide variety of tomato cultivars are available to organic direct-market growers, few have been bred or trialed for adaptation to organic systems, and even fewer have been developed with a focus on the upper Midwest and a commitment to farmer participation. Flavor is one of the top priorities for tomato growers in the Midwest, followed by disease resistance, crack resistance, and nutritional value (Hoagland et al. 2015). In terms of disease, 67% of the organic farmers find early blight (Alternaria solani) (EB) difficult to control, while 72% found Septoria leaf spot (S. lycopersici) hard to control. It has been established that conventional breeding objectives can differ from organic breeding objectives, and breeding for the specific needs of organic systems is essential to developing high-performing varieties for organic agriculture (Ceccarelli 1994, Lammerts Van Bueren et al. 2011). Decentralizing the breeding process and involving farmers with on-farm trials can result in improved organic breeding outcomes (Casals et al. 2019, Dawson et al. 2011).
Despite the growth in high tunnel usage, cultivar development focused on organic high tunnel systems remains rare. There are selection programs for greenhouse tomatoes, but the constraints of a greenhouse system are considerably different than those of a high tunnel, as high tunnels are used for main-season tomato production, in the existing soil, with different disease pressures and nutrient regimes than greenhouses. This project used results from prior SARE-funded work to develop breeding populations specifically for high tunnels. We also made crosses from varieties that were particularly robust under field conditions with good flavor to develop better lines for field production. For both high tunnel and field conditions, we identified varieties from the prior project with good performance that had very high acceptance with our group of participating chefs to use as parents for the breeding project (Healy et al. 2016, Hodge et al. 2018).
The lack of tomato cultivars specifically adapted to regional organic production systems reflects a global trend in cultivar availability for organic farms; an estimated 95% of organic production worldwide is dependent on crops that were bred for the conventional sector, rather than organic or low-input systems (Lammerts van Bueren et al. 2011). According to the State of Organic Seed report (Hubbard & Zystro 2016), as of 2016, 82% of the respondent vegetable growers still relied on conventional seed for some part of their production system, with an average of 70% of their acreage under production using organic seed. One of the reasons listed as to why they did not use organic seed was the lack of desirable traits available in an organic variety. Farmers in the NCR would benefit significantly from access to tomato varieties bred specifically for northern organic farm systems, with quality traits attractive to direct market customers and production characteristics suited to farmers’ management systems. Organic farmers’ ability to adapt to new weather patterns and market needs, will in part depend on how well adapted their crops are to regional climate trends and shifting priorities in organic management. This need for responsiveness creates an opportunity to build breeding programs committed to farmer participation, on-farm trialing and selection, and continued education about how farmers can build a seed system attuned to their needs.
Decentralized, participatory research designs have been shown to be an effective tool for yielding rigorous and immediately applicable research results, while developing stakeholder knowledge and increasing the effectiveness of extension and outreach education (Dawson et al. 2011, Soleri et al. 2002). Over 60 organic or low-input farmers in our region have already invested in participatory research by conducting on-farm variety trials as part of our Seed to Kitchen Collaborative seedtokitchen.horticulture.wisc.edu. Organic tomato breeding has also benefited by incorporating a participatory approach. In Collaserola, Spain, traditional tomato varieties have been displaced from commercial agriculture, and a collaboration between researchers and local farmers emerged to promote the local landraces by developing and trialing 5 experimental inbreds, the best line of which was further cultivated in the area of study (Casals et al. 2019). Tomato is also an important horticultural crop in Italy, and the increasing demand for organic tomatoes led a PPB program to develop varieties adapted for specific organic microclimates (Campanelli et al. 2015). Farmers visually evaluated F2 and F3 generations, and selected single plants for seed advancement. The selected plants differed significantly between farmers and researchers, but even so, they were able to develop an F4 that significantly outyielded the commercial F1 hybrid used as a comparison. They developed a wider range of varieties per breeding cycle, considered to be wider than conventional plant breeding, contributing positively to the genetic diversity.
This project emerged as an initial step towards wider collaborative organic breeding efforts that can meet the overall demand for reliable organic varieties while at the same time developing high-performing varieties that are specifically adapted for organic farming in the Upper Midwest. This project initiated cultivar development for tomatoes, a high value crop for sustainable and organic farmers in the region, with a focus on adaptation to both organic field and hoop house production. This project addressed not only the immediate need for productive, flavorful tomato cultivars adapted to organic production and season extension in the NCR, it also serves the broader need for more regional and participatory plant breeding and for more organic plant breeding students primed for careers in the public sector.
Research
We compared caterpillar tunnels with high tunnels and field production for yield, disease mitigation, earliness, and quality (flavor and percent fruit that are marketable). We hypothesize that caterpillar tunnels will provide similar benefits to high tunnels (increased yield, decreased disease pressure, increased earliness and increased quality). We quantified the benefit to determine if caterpillar tunnels are significantly different than field or high tunnel production for organic tomatoes. We verified our research station results with on-farm trials comparing the three systems.
We hypothesized that by making crosses and conducting selection in either organic high tunnels or organic field conditions, we can improve tomato populations for those management systems by addressing key issues in each system. We tested breeding lines in organic high tunnel and field production under organic conditions and worked with farmers to do on-farm selection of the most promising populations.
Detailed methods for each of the three components of this project follow:
- Comparing high tunnel, caterpillar tunnel and field production
The experiment consisted of a comparison of the performance of six varieties (Table 1) between three management systems: high tunnel, caterpillar tunnel, and open field in two locations; West Madison Agricultural Research Station (WMARS) in Madison, WI, and Spooner Agricultural Research Station in Spooner, WI, over three years (2018-2020). We planted the trials in a randomized complete block design (RCBD) with three replications of three-plant plots in each management system in each location and year. The three management systems were 30ft apart in Madison in all years and Spooner in 2020. Due to the location of the existing high tunnel Spooner 2018 and 2019 the high tunnel was about 200 m apart from the other two management systems. The high tunnel in Spooner was destroyed in a snow event in the winter of 2019-2020 and a new tunnel was constructed prior to the 2020 field season. The high tunnel dimensions were 9.1 m by 26.8 m in Madison. At Spooner the high tunnel dimensions were 8.5 m by 18.2 m in 2018 and 2019 and 9.7 m by 21.3 m in 2020. The caterpillar tunnels were all 3 m wide and at the length was 39.6 m in 2018 and 2019 and 35.9 m in 2020 in Madison and 39.6 m at Spooner. High tunnels end walls were oriented east-west and beds were parallel to the end walls. In Spooner in 2020, end walls and beds were oriented north-south. Caterpillar tunnels were oriented north-south in Madison and east-west at Spooner, all of them with a single row. For the open field, rows were oriented east west.
The six varieties we selected for this project include three slicers and three heirlooms (Table 1). They were selected because of good performance in previous trials in the field and high tunnels. Evaluation criteria included fruit quality, disease tolerance and productivity in organic systems. All six varieties are either check varieties in our current trials or have been selected as parents in the field or high tunnel breeding projects because they have had good performance in our field trials.
|
Table 1. Tomato varieties tested in the management component |
|||||
|
Variety |
Market Type |
Color |
Variety Type |
Growth habit |
Seed source |
|
Pruden’s Purple |
Heirloom |
Purple |
Open pollinated |
Indeterminate |
High Mowing Organic |
|
Japanese Black Trifele |
Heirloom |
Black |
Open pollinated |
Indeterminate |
Hudson Valley Seeds |
|
Paul Robeson |
Heirloom |
Black |
Open pollinated |
Indeterminate |
Seed Savers Exchange |
|
Damsel |
Slicer |
Pink |
F1 Hybrid |
Indeterminate |
Earthwork Seeds |
|
Big Beef |
Slicer |
Red |
F1 Hybrid |
Indeterminate |
Johnny’s Selected Seeds |
|
Defiant |
Slicer |
Red |
F1 Hybrid |
Semi-Determinate |
Johnny’s Selected Seeds |
We followed organic farming practices common to growers in Wisconsin such as the tilling in overwintering rye cover crop two weeks before the planting date for both locations along with an application of organic compost manure (4N-3P-2K) at Madison. For both locations soil samples were collected to perform nutrient analysis and then amended with sulfate potash (0N-0P-50K), feather meal (11N-0P-0K), soft rock (0N-3P-0K) and fish emulsion (4N-4P-1K) according to the soil tests taken at the field site and analyzed by the UW Madison Soil and Plant Analysis Lab (Marshfield, WI). The goal was to bring N levels in the soil to 140 kg/ha, P to 44.8 k/ha and K to 201 kg/ha at Madison and N to 156 kg/ha, P to 22.2 kg/ha and K to 280 kg/ha at Spooner according to recommendations (Colquhoun et al. 2020). We performed second tillage in order to incorporate the fertilizer and to prepare the soil for bed formation.
In the high tunnels beds were four feet apart on center across the tunnel, based on the high tunnel rib spacing, and installed drip tape was installed beneath the landscape fabric. In the caterpillar tunnels a single bed ran lengthwise down the center of the tunnel. In the open field, beds were five feet apart on center implemented due to tractor wheel spacing, and black plastic mulch was used, according to common farmer practices in areas with higher wind speeds. After the irrigation system was tested and working, all exposed soil surfaces were covered by organic winter rye straw mulch grown on-site. Holes in the plastic mulch or landscape fabric were made for transplanting every 0.8 meters in a single row.
Tomatoes were sown in 50 cell trays with a certified organic seed starting media from West Star Organics (Madison, WI). In 2018 and 2019 they were grown at the organic certified greenhouses at the Arlington Agricultural Research Station and in 2020 at the West Star Organics certified organic greenhouse due to ice damage to the roof at the research station greenhouse. Plants were seeded during the second week of April for the high tunnels and caterpillar tunnels and the last week of April for the open field for Madison. In Spooner, this process was replicated two weeks later for the tomatoes in each system. After four to five weeks in the greenhouses, plants were hardened off by putting them in cold frames for two to three days before transplanting. The target transplanting date was the third week of May for both tunnels and the first week of June for the open field at Madison. In Spooner, target dates were the first week of June for all tunnels, and third week of June for the open field.
For both caterpillar tunnel and high tunnels, plants were pruned to form two strong leaders, all auxiliary shoots were removed along with bottom leaves once a week until late in the season. There was only one semi-determinate variety, Defiant, which was not suckered after 3 weeks of pruning. For the field all varieties were pruned less intensively. Trellising the tunnels plants were trained with twine hanging from ceiling of tunnel and attached using tomato clips. For the open field Florida-basket weave systems was used with t-posts.
All three systems were irrigated using drip tape. Both tunnels were always irrigated at the same time. The typical amount of water applied was 2.2 liters per plant per day (equivalent of 1 inch per week of rain), divided in two times per week until two weeks before first harvest, after which plants were given the same amount of water but divided into three times per week. Irrigation was applied in the open field when there was insufficient rain to maintain adequate soil moisture. Irrigation was always done promptly after harvest and never within two days before harvest, in order to avoid cracking and splitting the fruit.
If the temperature was predicted to drop below 10 °C, the tunnels were closed in the evening and opened again early the next morning if it was sunny. If it was cloudy and temperatures were below 21 °C, then tunnels were kept closed. This is done to increase the temperature inside the tunnel during the day to stimulate plant growth and to prevent nighttime damage due to cold temperatures. Starting approximately in early to mid-June, temperatures during the day were consistently above 26.6 °C and night temperatures are above 10 °C (and generally above 18 °C), so tunnels remained open except during storms. Winds above 24 km/h can be a cause of concern and tunnels were closed until the storm passed.
Data collection
Environment
Data on environmental conditions in each system were collected using one Watch Dog weather stations per system from Spectrum Technologies, Aurora, IL (model 1650) for the data loggers and Water Scout soil probes from Spectrum Technologies (model SMEC 300). The data collected was air temperature, air relative humidity, soil temperature and soil water content. Data was collected starting when plants were transplanted in the field or tunnels, every 15 minutes. Growing degree days were calculated using degrees Fahrenheit for ease of comparison with other published studies. Temperature was capped at 86°F (30°C) and the base temperature was 50°F (10 °C) based on published studies for tomatoes (Pathak 2018). Tomatoes generally reach physiological maturity around 1214 GDD, and this means that the first harvest is expected to be around the time the system reaches this GDD (Pathak 2018).
Harvest
Harvest took place weekly after plots started fruiting to record data on yield and fruit quality. Data was collected for 8 to 12 harvests each year depending on environmental conditions. The first harvest was when at least 50% of the plots had at least one fruit at ‘pink stage’ when fruit shows pink or red color in 30% to 60% of the fruit. The production data collected was marketable fruit count, marketable fruit weight, average fruit weight, unmarketable fruit weight, percent unmarketable, and unmarketability causes. Last harvest of the season is decided for each system independently when plants stop maturing fruit, typically due either to disease or temperature.
Disease incidence
Disease scores were collected every two weeks, starting the week after the first harvest until for at least three data collection timepoints. Data was collected on a plot basis using a scale of 0% to 100%; 0% meaning completely healthy foliage and 100% meaning totally diseased foliage. Typically reported diseases were early blight (Alternaria linariae), septoria leaf spot (Septoria lycopersici), leaf mold (Passalora fulva), powdery mildew (Oidium neolycopersici), worm damage (Manduca quinquemaculata or M. sexta), etc. The results of the disease scores were collected and analyzed to calculate a quantitative measure of disease intensity over time called Area Under the Disease Progress Curve (AUDPC). The analysis was divided into one section for each disease, EBAUDPC for early blight, LMAUDPC for leaf mold, PMAUDPC for powdery mildew, SLSAUDPC for septoria leaf spot and finally TAUDPC for total area under disease progress curve, that was calculated by summing the individual AUDPC for each disease. There was insufficient disease presence for reliable data to be collected in 2018 and 2019 at Spooner, all plots remained healthy in all systems. In 2018 the Madison dataset does not contain EBAUDPC and SLSAUDPC as there were scored together and are included in the TAUDPC data. In 2019 and 2020 these diseases were scored separately. The analysis was done separately on two datasets: Madison only from 2018-2020, and data from 2020 at both locations.
Quality Components
Quality evaluation was done once per season on each plot in each system, when all plots in each system were producing fruit. Two fruit from each plot were collected and frozen for laboratory analysis. Soluble solids (˚Brix) were measured with a digital refractometer (Sper Scientific Pocket Digital Refractometer Brix 0 to 65% 300051), samples were thawed at room temperature and then filtered with cheesecloth to separate the solids from the juice, collecting ideally 50ml, a drop of the juice was used for the refractometer reader that was previously calibrated. Titrateable acidity was measured with an automatic titrator (Hanna Instruments model 902) by using juice from the same cylinder that was used by the refractometer, 20 ml of juice are enough to run the titration. Titrateable acidity was converted to citric acid (CA) equivalents as this is the primary organic acid in tomato fruit. Titrateable acidity is more closely linked to perception of acidity than pH (Tyl and Sadler 2017).
Flavor evaluation was done by the research team and summer field workers. The group participated in a calibration exercise at the beginning of the season. This exercise included recognition of the basic flavor components – sweet, acid, salty, bitter and umami – at varying concentrations in both water and tomato juice. Varieties were divided into heirloom and slicer tasting sets, and each variety from each management system was tasted at the same time (3 varieties x 3 management samples in each set). Only completely ripe fruit were used, and samples were prepared by slicing tomatoes into wedges so that each sample included both stem and blossom end. Fruit from each plot of each variety were bulked in a composite sample from each management system.
Tasters rated each sample on a 1-5 scale for sweetness, acidity, saltiness, bitterness and umami where 1 was very low perception and 5 was very high perception of that flavor component. Flavor intensity was also rated on a 1-5 scale with 1 being low and 5 being high intensity of ‘tomato’ flavor. Samples were rated from 1-5 for appearance and texture with 1 being not preferred and 5 being very preferred. Finally, after completing the tasting set, tasters were asked to return to each sample and rate it on an overall scale for flavor with 1 being very bad and 5 being excellent. The rating of sweetness and acidity along with intensity and preference allows a comparison between tasters’ perceptions and easily measurable components from flavor such as sugar and acidity.
Statistical analysis
All analyses were performed using the statistical software R (R Core Team 2019). Data were analyzed using a mixed model analysis of variance (ANOVA) with all terms fixed except for block, which was random, using the lme4 package (Bates et al. 2015). Significance tests of fixed effects were done using the package lmerTest (Kuznetsova et al. 2017) Independent variables in the model were management, location, variety, year and the interactions between them. Dependent variables included, marketable weight, marketable count, average weight, percent unmarketable, reasons for unmarketability, total and individual disease AUDPC, ˚Brix, citric acid, each flavor component individually, and overall flavor preference. For flavor components and overall flavor, the block was the taster.
The model used was as follows:
Dependent = μ + Vi +Yk + Ll + Mm + VYik + VLil + VMim + YLkl + YMkm +LMlm + VYMikm +VLMilm + VYLiml + YLMklm + VYLMiklm + blockj(YML) + εijklm
With μ = Grand Mean, V = variety main effect, i = Big Beef, Defiant, Damsel, Japanese Black Trifele, Paul Robeson, Pruden’s Purple, Y = year main effect, k=2018, 2019, 2020, M = management main effect, m = high tunnel, caterpillar tunnel, open field, and L = location main effect, l=Madison, Spooner. Interaction terms included all two-way, three way and four-way interactions of year, management, variety, and location. Block (j=1-3) was nested within management, location and year and ε = error. For disease scores, ˚Brix, CA and tastings where data from Spooner was not included, the terms involving location were dropped from the model. For disease scores, ˚Brix and CA where data from both locations from 2020 only were used, the terms involving year were dropped from the model.
Least Square Means (LS Means) were calculated for fixed effects using the emmeans package (Lenth 2019). Pairwise comparisons of least squares means was done with the emmeans package using the algorithm developed by Piepho (2004) using Tukey’s multiple comparison procedure. Graphs of least squares means and significance groupings were produced using the ggplot2 package in R (Wickham 2016).
Financial evaluation
Labor requirements were recorded for each system by task. Workers recorded hours spent on each task using a google form and the crew leader checked entries each week to ensure accuracy. Tasks recorded included weeding, field preparation, planting, opening and closing the tunnels, trellising, pruning, watering, harvesting, and field cleanup. Additionally, a comparison of costs to purchase, build and maintain each management system was collected. Included in the analysis were the high tunnel, open field, and the caterpillar tunnels, each of which were analyzed with two different variations. One variation was with one row in the tunnels, which is how it was carried out in the trials. The second option was added to the analysis with an estimation of hours required by a caterpillar tunnel with two rows, because some farmers in Wisconsin use two rows for tomatoes in caterpillar tunnels. The analysis was adjusted by plant numbers in the caterpillar tunnels and open field, because of the smaller trials in the open field, to match the plant numbers managed in the high tunnel. The adjustment was set to 294 plants, this resulted in six caterpillar tunnels of 37 meters-long for a single row and three 37 meters-long caterpillar tunnels of double rows to fit the 294 plants needed to match the high tunnel. For the open field, the original open field in 2020 had 144 plants which is 49% of the 294 plants. Simply modifying the dimensions of the field was enough to match the plant numbers. We developed a 10-year net income projection comparing the three management systems including the production numbers we obtained from our trials to see it caterpillar are a viable alternative compared to high tunnels and open field.
On- farm trials
Three farmers participated in the on-farm trials in 2019 and 2020 in three different locations in Wisconsin; central, south central and southeast. Each farmer chose at least two management systems between high tunnel, caterpillar tunnel and open field. In each management system, farmers planted two replicates of each of the three varieties per system, totaling 6 plots per management system. Each plot consists of 6 plants totaling 36 plants per management system. A spreadsheet with suggested plot maps was sent to farmers. Farmers had to choose between heirloom and slicer market classes. The slicer trial included varieties JTO-1021 (an experimental hybrid from Johnny’s Selected Seeds), Damsel and Caiman. The heirloom trial included Japanese Black Trifele, Pruden’s Purple and Paul Robeson. The slicer varieties differed from the varieties used on the research station due to farmers preferring Caiman to Big Beef and farmers in Northern Wisconsin not wanting to use Defiant. A spreadsheet with questions was sent to each farmer. Data collected is mostly qualitative, with questions like date of first and last harvest, and comparison of varieties between system of marketability, flavor, productivity disease resistance and an overall comparison.
- Selecting varieties for high tunnel or caterpillar production with excellent flavor and a sustained high fruit set early in the season and varieties with disease resistance, flavor and dual purpose use under field conditions.
Our prior SARE-funded high tunnel trials identified several indeterminate varieties with early fruit set and excellent flavor. From our current data, we see significant differences in earliness in the high tunnel as well as differences in the concentration of yield over time. Current extra early tomatoes with more concentrated fruit set are typically determinate, have lower overall yields and poorer flavor than their main season counterparts. We will combine earlier fruit set and more concentrated yields with good flavor, and then select for higher yielding plants, with mid-sized fruit.
For the high tunnel, particular standouts are the lines SGLL4 and 45L23 from independent breeder Keith Mueller of Kansas City and breeding lines in the P322 family from Jim Myers of Oregon State University. We are collaborating with them to expand the selection of these lines for high tunnels in more northern climates (see letter of support). These lines have early production and above average yields, but their production is spread across the entire high tunnel season (July – October). We will cross these lines to higher yielding, early varieties with more resistance to cracking, such as Perfect Flame from Ball Seeds (a heirloom by heirloom cross) and to some lines that have more concentrated yields, including some of the determinate early tomatoes. Selection methodology will follow the protocols outlined at the end of this section, with selection being conducted in an organic high tunnel environment at the West Madison Agricultural Research Station and on participating farms with high tunnel tomato production. The primary traits to be evaluated will be earliness, fruit size (to avoid only selecting smaller fruit), flavor, productivity per week and shorter duration of harvest.
For the field, growers often choose to use hybrids or paste tomatoes because of their durability, however these often do not have the flavor characteristics that command good prices in local markets. High quality dual-purpose (for fresh eating and processing) tomatoes would increase returns from field production. We have conducted three years of trials under field conditions and have identified varieties with above average yield and disease tolerance and good flavor. We had two seasons (2015 and 2016) with high disease pressure, including bacterial speck, early blight and septoria. While the top yielding varieties are predominantly hybrids, we have identified open pollinated varieties that have better than average yields with very good flavor and good resistance to cracking. We plan to use these lines as our starting parents, as well as two hybrid varieties with good flavor and yields (crossing to an F1 hybrid is called a top-cross, and produces a population that is 25% each of the parents of the hybrid and 50% the second parent). These varieties include an entries from the TOMI project, OSA404, heirloom varieties Crimson Sprinter and Japanese Black Trifele, and hybrids Garden Gem from the University of Florida and Defiant, from Johnny’s Selected Seeds. We also have identified paste tomatoes Quadro and Iraqi Heart, with good fresh flavor, and the higher solids content of paste tomatoes usually makes them more resistant to cracking and more robust in the field. These varieties are primarily from Adaptive Seeds in Oregon, which has specialized in finding and selecting open pollinated oxheart and dual purpose paste tomatoes for the Pacific Northwest. These varieties are not optimally adapted to the climate of the upper Midwest, but have good quality, and so we will cross them to some of the best performing lines in our trials and select for high yield, good flavor, high solids content and good disease tolerance.
Parental varieties:
We crossed several outstanding early tomatoes from independent and university breeders as well as a few heirlooms that had good performance in variety trials.
SGLL4 (small yellow), 45L23 (small orange-yellow), P322 (large yellow with purple), OSA404 (round red slicer), Crimson Sprinter (medium red slicer), Japanese Black Trifele (ox heart), Garden Gem (small read teardrop), Wisconsin 55 (medium red slicer), A6 (large pink slicer), Defiant (medium red slicer), Quadro (paste), Summer sunrise (large yellow), Tang (large orange), Perfect Flame (medium orange)
Crosses and self-pollination
Crosses and seed advances were primarily done in the greenhouse. Tomatoes were grown in 18.9 L pots using the PROMIX HP growing media. Pots were spaced 30 cm apart. Plants grown in pots were trellised using bamboo stakes and trellising tape to attach the branches to the stakes. The pots were fertilized once a week after transplant using a 10-20-10 fertigation solution and were hand-watered daily. Daytime temperature was kept between 73 F and 78 F, and the night temperature between 62 F and 64 F.
For crosses between different parents, we performed manual pollination following the guidelines published by the University of California – Davis (R. Chetelat & Peacock, 2013). Flowers of the parental lines used as females were emasculated in the lime green stage, early in the morning. The next day, pollen was harvested using the VegiBee sonic pollinator (Riverstone, Dover) and collected in a plastic spoon. The pollen was used to pollinate the flowers emasculated the day before. Each hand-pollinated flower was tagged with the date, parental lines name, and initials of the person pollinating. For seed advancement, flowers were left to self-pollinate without intervention in the greenhouse. In the open field and high tunnel systems, flowers were bagged using organza fabric bags (Nashville Wraps, Nashville). Even though the tomato self-pollinates, the presence of insects and wind can cause unintended cross-pollination, thus the need to use a physical barrier.
Seed harvest and cleaning
Seed harvest, cleaning, and storage was done following the protocol published by Seed Savers Exchange (Colley & Zystro, 2015). Selected fruits were harvested when fully ripe and ready to eat. After harvest, the fruits where immediately processed for seed extraction and cleaning. To extract the seeds, fruits where cut in quarters and squeezed into a jar, where the seeds and placenta gel fell. After this, the jars were covered with a cheese cloth and sealed with an elastic band and left in a warm location for 48 to 72 hours to let fermentation occur. Once fermentation is complete, the seeds where decanted, rinsed and dried. After this, the seeds were treated with Trisodium Phosphate (TSP), used to prevent the Tobacco Mosaic Virus (TSV). This was done following the protocol shared by Jim Myers (OSU) and Emily Haga (Johnny’s Selected Seeds) (direct communication, 2019).
Breeding line development and evaluation
We made crosses in 2017 and in 2018 we grew out F1 and F2 populations of crosses in the certified organic high tunnel and the field in Madison WI. The experiment was designed as a randomized block design. The experimental unit was comprised of three individual plants. The experimental units were replicated twice in the high tunnel. A total of six individual plants per breeding line were present in the high tunnel. The check varieties for this experiment were ‘Big Beef’, ‘Pruden’s Purple’, ‘Defiant’, ‘Caiman’, ‘Damsel’, ‘JTO-1021’, ‘Japanese Black Trifele’, and ‘Paul Robeson’. Field management and data collection followed the same protocols as described for the high tunnel and field systems in the comparison of high tunnels, caterpillar tunnels and field management experiment. Flavor evaluation specific to the breeding line advancement is described below.
Flavor evaluation
Flavor evaluation was done by the research team and summer field workers. The group participated in a calibration exercise at the beginning of the season. This exercise included recognition of the basic flavor components – sweet, acid, salty, bitter and umami – at varying concentrations in both water and tomato juice. Varieties were divided into different tasting groups depending on the parental and market similarities. For example, the breeding lines with Defiant as a parent were tasted the same day, when possible. When a breeding line did not have enough fruit for tasting in the designated group, it was tasted later in the season. Only completely ripe fruit were used, and samples were prepared by slicing tomatoes into wedges so that each sample included both stem and blossom end. Fruit from each plot of each variety were bulked in a composite sample from each management system.
Tasters rated each sample on a 1-5 scale for sweetness, acidity, saltiness, bitterness and umami where 1 was very low perception and 5 was very high perception of that flavor component. Flavor intensity was also rated on a 1-5 scale with 1 being low and 5 being high intensity of ‘tomato’ flavor. Samples were rated from 1-5 for appearance and texture with 1 being not preferred and 5 being very preferred. Finally, after completing the tasting set, tasters were asked to return to each sample and rate it on an overall scale for flavor with 1 being very bad and 5 being excellent. The rating of sweetness and acidity along with intensity and preference allows a comparison between tasters’ perceptions and easily measurable components from flavor such as sugar and acidity. Usually, farmers and chefs are invited to a field day in Madison to see the research and also to carry out tastings of the different breeding lines. However, due to COVID-19 we were not able to do field days in 2020 or 2021. We were not able to have flavor evaluations with chefs in 2020 due to the COVID pandemic but evaluated flavor as a research team. We had one chef tasting with the advanced lines in 2021. Participating Madison-area chefs evaluated selected lines, rating them for intensity and whether they would purchase that variety for their restaurant, followed by descriptors of the variety flavor and general preference.
Statistical analysis
The information collected was analyzed using a mixed model Analysis of Variance (ANOVA) and calculating least squares (LS) means for management, variety, and the interaction between management and variety. The variety model was defined as:
𝐷𝑖𝑗𝑘 =u+𝑀𝑖+𝑉𝑗 +𝑀𝑉𝑖𝑗+𝑒𝑖𝑗𝑘
Where U represents the grand mean, Mi represents the main effect management at the ith management, Vj represents the main effect variety at the jth variety, MVij represents the interaction effect and eij represents the error term. Dependent variables were marketable fruit count, average fruit weight, marketable yield, percent unmarketable yield.
The disease model was defined as:
𝐷𝑖𝑗𝑘𝑙 =u+𝑀𝑖 +C𝑗 +𝑉(𝐶)𝑗𝑘 +𝑀𝑉(𝐶)𝑖𝑗𝑘 +𝑒𝑖𝑗𝑘𝑙
Where u represents the grand mean, Mi represents the main effect management at the ith management, Cj represents the category effect, V(C)jk represents the main effect variety nested in the category effect, MV(C)ijk represents the interaction effect between management and variety, nested in category, and eijkl represents the error term.
Selection
After gathering all the traits data, the breeding lines were scored from 1 to 3, 1 being a high priority to advance a generation, and 3 a low priority to advance a generation. The scoring process considered all traits involved in productivity, earliness, disease resistance and flavor. After selection, the breeding lines with high priority were grown in the greenhouse facilities and self-pollinated to move forward with the advanced generations. Breeding lines with score 2 were included depending on the space limitations and the notes that were taken throughout the summer trial season. The selected breeding lines that are evaluated in this study are presented in Table 1.
We selected based on family mean performance rather than individual plants, as in the F2 generation individual plants will not breed true to type, and advanced selected families in the greenhouse over the winter. In 2019, we evaluated F3 and F4 populations of crosses in the certified organic high tunnel and field in Madison WI. We again made selections on family performance and advanced selected families in the greenhouse over the winter. We also selected individuals within families that had better performance than the family as a whole. In 2020 we evaluated F5 and F6 populations of crosses in the organic high tunnel and field in Madison WI and again made selections on family performance for productivity, disease resistance and flavor, and also selected individuals within families if there were individuals with better performance than the family as a whole.
On-farm trials
Six farmers participated in the advanced breeding evaluation. All of them have diversified vegetable organic systems, and shared similar needs in terms of variety traits, like improved flavor, disease resistance, and yields. All farms are certified organic and included an urban farm in Madison, WI, and farms in south central WI, central WI, southeastern WI, southeastern MI and eastern MN. Participating farmers received 6 breeding lines and the varieties were selected according to their fruit quality preferences, such as the color, shape, and flavor of the fruit. This way, each farmer received a distinct group of breeding lines. These farmers conducted selection on farm and sent observations and seed back to Madison for advancement in the greenhouse over the winter. The same farmers were sent seed for the 2020 growing season of F3 seed that they had selected and F4 selections from Madison and repeated the process of selecting, saving seed and sending it back to Madison for winter advancement in the greenhouse. On-farm trials were complicated in 2020 due to COVID related restrictions on travel, which made it impossible for the research team to do farm visits. After the harvest season ended, each farmer returned an evaluation form or communicated through e-mail or phone call to report on how the varieties performed in their system, including any insights on production approaches that worked for them during the season.
- Comparing high tunnel, caterpillar tunnel and field production
Complete results are available in the Horticulture Masters thesis of Juan Astroza, available from the University of Wisconsin Library System or by request.
Environmental Conditions
Figure 1 shows the maximum daily temperature for each system in Spooner. Madison results were very similar. In both Madison and Spooner, caterpillar tunnels and high tunnels had higher daily maximum temperatures compared with the open field, at times reaching a difference of 15 ˚C or more, particularly at the end of the season. Conversely, minimum daily temperatures were very similar for all systems and in both locations.
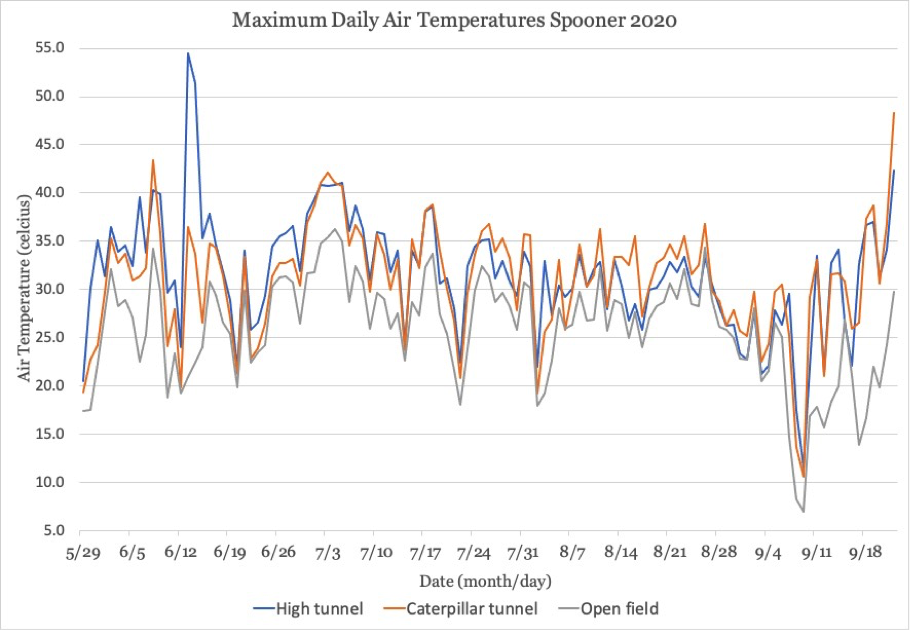
Table 2 shows the average maximum and minimum daily temperature, growing degree day accumulation and date of first harvest for the three management systems in each location. High tunnels and caterpillar tunnels had about 5˚C higher average maximum daily temperature compared to the open field, but there were not strikingly different average minimum temperatures between the tunnels and the open field.
To calculate the growing degree day accumulation, the maximum temperature for each day was capped at 30˚C as exceeding this temperature has detrimental effects on plant growth (Pathak, 2018). The base temperature used was 10˚C and if there was a negative result of daily GDD accumulation it was simply marked as zero. GDD started to accumulate when the plants were transplanted into the tunnels or field. As shown in Table 2, the first harvest from the high tunnel and caterpillar tunnel for Madison was July 17th. At that moment, the plants had accumulated 1204.1 and 1186 GDD respectively. The first harvest from the open field at Madison was August 20th with a GDD accumulation of 1283.9. The accumulation of GDD in Spooner at the moment of the first harvest was 1237 for the high tunnel, 1185 for the caterpillar tunnel and 1285 for the open field.
|
Table 2. Average daily maximum and minimum air temperatures 2020 (°C) |
||||||
|
SPHT |
SPCT |
SPFD |
WMHT |
WMCT |
WMFD |
|
|
Ave max air |
31.7 |
31.1 |
26.0 |
29.4 |
30 |
25.3 |
|
Ave min air |
10.2 |
9.8 |
9.9 |
10.8 |
10.6 |
11.2 |
|
GDD 1st harvest |
1237 |
1185 |
1285 |
1204 |
1186 |
1283 |
|
Date 1st harvest |
8/2 |
8/2 |
8/25 |
7/16 |
7/16 |
8/20 |
Production
Table 3 shows the means by trait for each management system and location for each of the traits of interest in the experiment. Significance groupings for pairwise comparisons between systems and locations are given. Tests were done separately for management system by location values for each trait, and for main effects of management and location for each trait.
|
Table 3. Least-squared means by trait for each management system and location. |
|||||
|
Variable |
Location |
High Tunnel |
Caterpillar Tunnel |
Open Field |
Overall |
|
Marketable weight (kg/plant) |
Madison |
5.04 b |
4.71 bc |
1.56 e |
4.35 a |
|
Spooner |
4.05 c |
6.07 a |
2.94 d |
3.77 b |
|
|
Overall |
4.55 b |
5.39 a |
2.25 c |
|
|
|
Marketable fruit count |
Madison |
26.99 a |
30.42 a |
9.48 d |
20.88 a |
|
Spooner |
26.16 a |
19.48 b |
14.77 c |
21.55 a |
|
|
Overall |
23.23 b |
28.29 a |
12.12 c |
|
|
|
Average fruit weight (gr/fruit) |
Madison |
218.3 b |
247.6 ab |
216.5 b |
227.4 b |
|
Spooner |
262.6 a |
254.8 a |
233.0 ab |
250.1 a |
|
|
Overall |
240.4 ab |
251.2 a |
224.8 b |
|
|
|
Proportion unmarketable by weight |
Madison |
0.519 c |
0.627 b |
0.726 a |
0.62 a |
|
Spooner |
0.328 d |
0.355 d |
0.464 c |
0.38 b |
|
|
Overall |
0.423 c |
0.491 b |
0.595 a |
|
|
Cells with the same font (regular, italicized or bold) were compared to each other within a trait and management systems that do not share a letter are significantly different at the p<0.05 level.
Marketable yields:
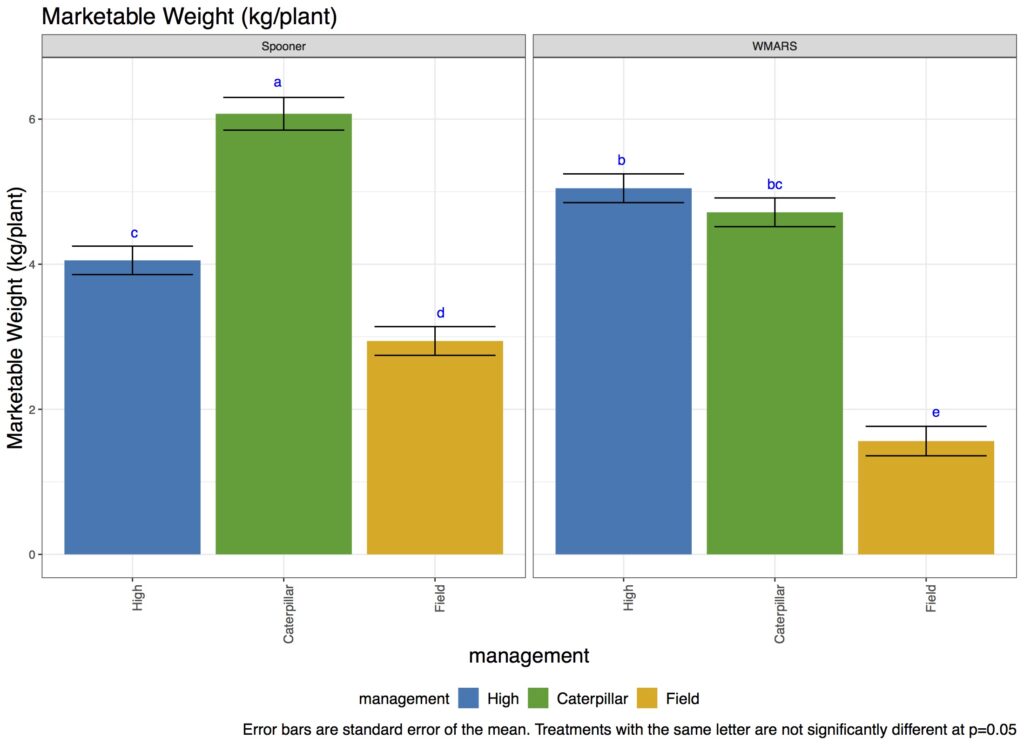
Management had a significant effect on marketable yields (p-value < 0.001). All management systems were significantly different from each other as seen in Table 3. Location was also significant (p-value 0.0014), with significant differences between Madison and Spooner recorded. There was a significant interaction between management and location (p-value <0.001). When comparing management systems between locations, the open field was significantly worse than the tunnels at both locations, but the reduction was greater at Madison and the relative performance of the tunnels also changed. The caterpillar tunnel was not significantly different from the high tunnel at Madison but did have significantly better marketable yield than the high tunnel at Spooner (Figure 2). There was evidence for a location and year interaction (p-value <0.001) but the ranking of the three management systems was relatively consistent within location across years. The caterpillar tunnel outperformed the high tunnel in Spooner in 2018, which drives the difference between the caterpillar tunnel and high tunnel in that location. There was also strong evidence for a management and year interaction (p-value <0.001). This was also influenced by the performance of the caterpillar tunnel in Spooner in 2018, which was significantly higher yielding than the high tunnel compared to the two subsequent years where the performance was more similar. The field was always the worst in terms of marketable yield. Across locations, there was not a clear trend between performance in the caterpillar tunnel and high tunnel, and the two systems were not usually significantly different from each other.
Variety had a significant effect on marketable yield (p-value < 0.001). The interactions between variety and management and variety by location were both significant (p-values < 0.001). However, this interaction was primarily scalar in nature, with very few changes in variety rankings. Figure 3 shows marketable yield by variety, system and location. There were no significant changes in ranking of varieties across the three systems within a location, and there was only one significant change in rank across locations, with Defiant as having the highest marketable yield in Madison and Big Beef having the highest marketable yield in Spooner. There was a significant interaction between variety, management and location (p-value: 0.0018), but consistency in variety rankings. Damsel and Defiant seem to have a larger increase in performance in the caterpillar tunnel than in the high tunnel or the field compared to other varieties in Madison, however the magnitude of crossover interactions is very small. Similarly, there was a significant interaction of variety by location by year by management (p-value 0.021), but there were very few crossover interactions within a location or within a management system, with the exception of JBT having significantly higher marketable weight in the field in Spooner in 2019.
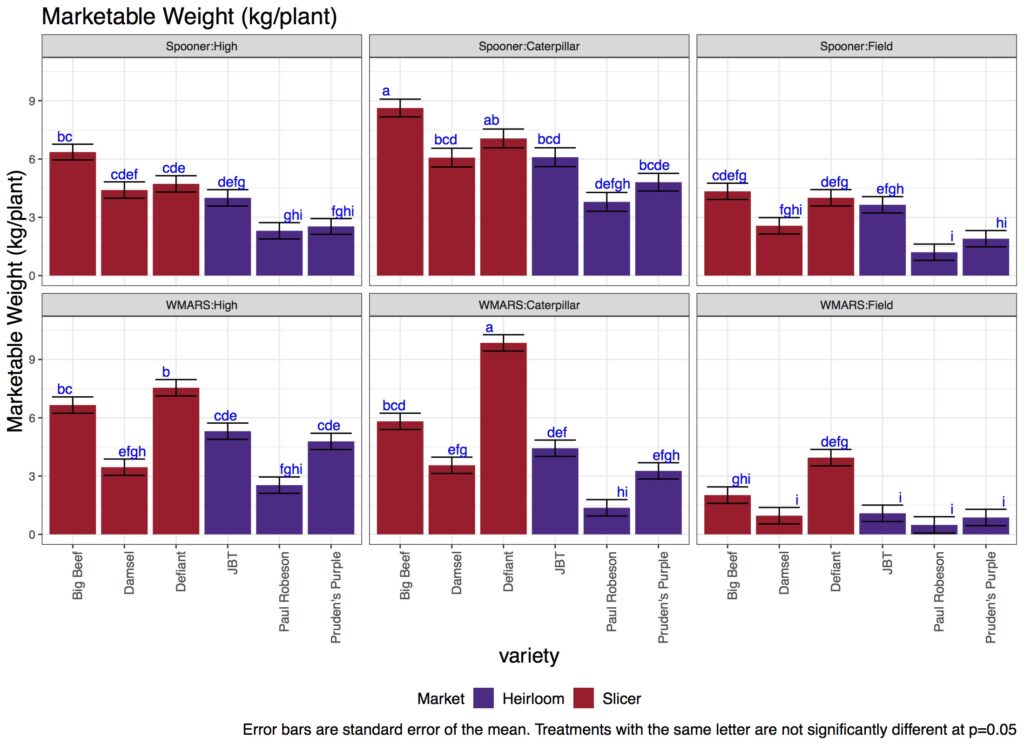
All varieties had higher performance in the tunnels and variety recommendations can be made for each location without having to make recommendations specific to management systems. Generally, marketable count followed the same patterns as marketable weight. Defiant had significantly higher marketable fruit count than the rest of the varieties and Paul Robeson and Pruden’s Purple had the lowest fruit count. For average fruit weight, the open field had smaller fruit than both tunnels, with no significant difference between the caterpillar tunnel and high tunnel. We also saw significant evidence for the location main effect (p-value <0.001), with Spooner having significantly higher average fruit weight than Madison. The interaction between management and location was significant (p-value 0.032) but there were no significant differences between management systems within a location.
Management system had a significant effect on the proportion unmarketable by weight (p-value <0.001). The open field had the highest proportion unmarketable, followed by the caterpillar tunnel and the high tunnel. There were also differences in causes of unmarketability. In the top causes recorded per harvest, blossom end rot as a specific problem was more prevalent in the high tunnel, while hornworm damage was more prevalent in both caterpillar tunnel and high tunnel than in the open field. For causes common to all systems including stem side crack, radial splitting, the frequency of the problem being listed in the top three was the same, but the field had more unmarketable as a proportion of total harvested. The main effect of location was significant and showed that Madison had a significantly higher proportion of unmarketable yield than Spooner. This was primarily due to higher levels of stem side cracking, blossom end rot and hornworm damage.
Variety also had a significant effect on the proportion unmarketable (p-value <0.001). Defiant had the lowest proportion of unmarketable weight across management, location and year. In terms of the causes of unmarketability, blossom end rot was highest in Damsel and Japanese Black Trifele and it was lowest in Paul Robeson and Defiant. Stem side cracking showed no difference between varieties except for Defiant, which was significantly lower than the rest. For radial splitting Defiant was also significantly lower than the rest, and Paul Robeson and Pruden’s Purple were significantly higher than the other varieties. The effects of the interactions between genotype and management were significant (p-value <0.001). All varieties had a consistently lower proportion of unmarketable weight in the high tunnel, then caterpillar tunnel, and the highest proportion of unmarketable weight in the open field, with the exception that Pruden’s Purple and Defiant both had no significant difference between management systems in Spooner. Rankings were consistent over years.
Disease incidence and severity:
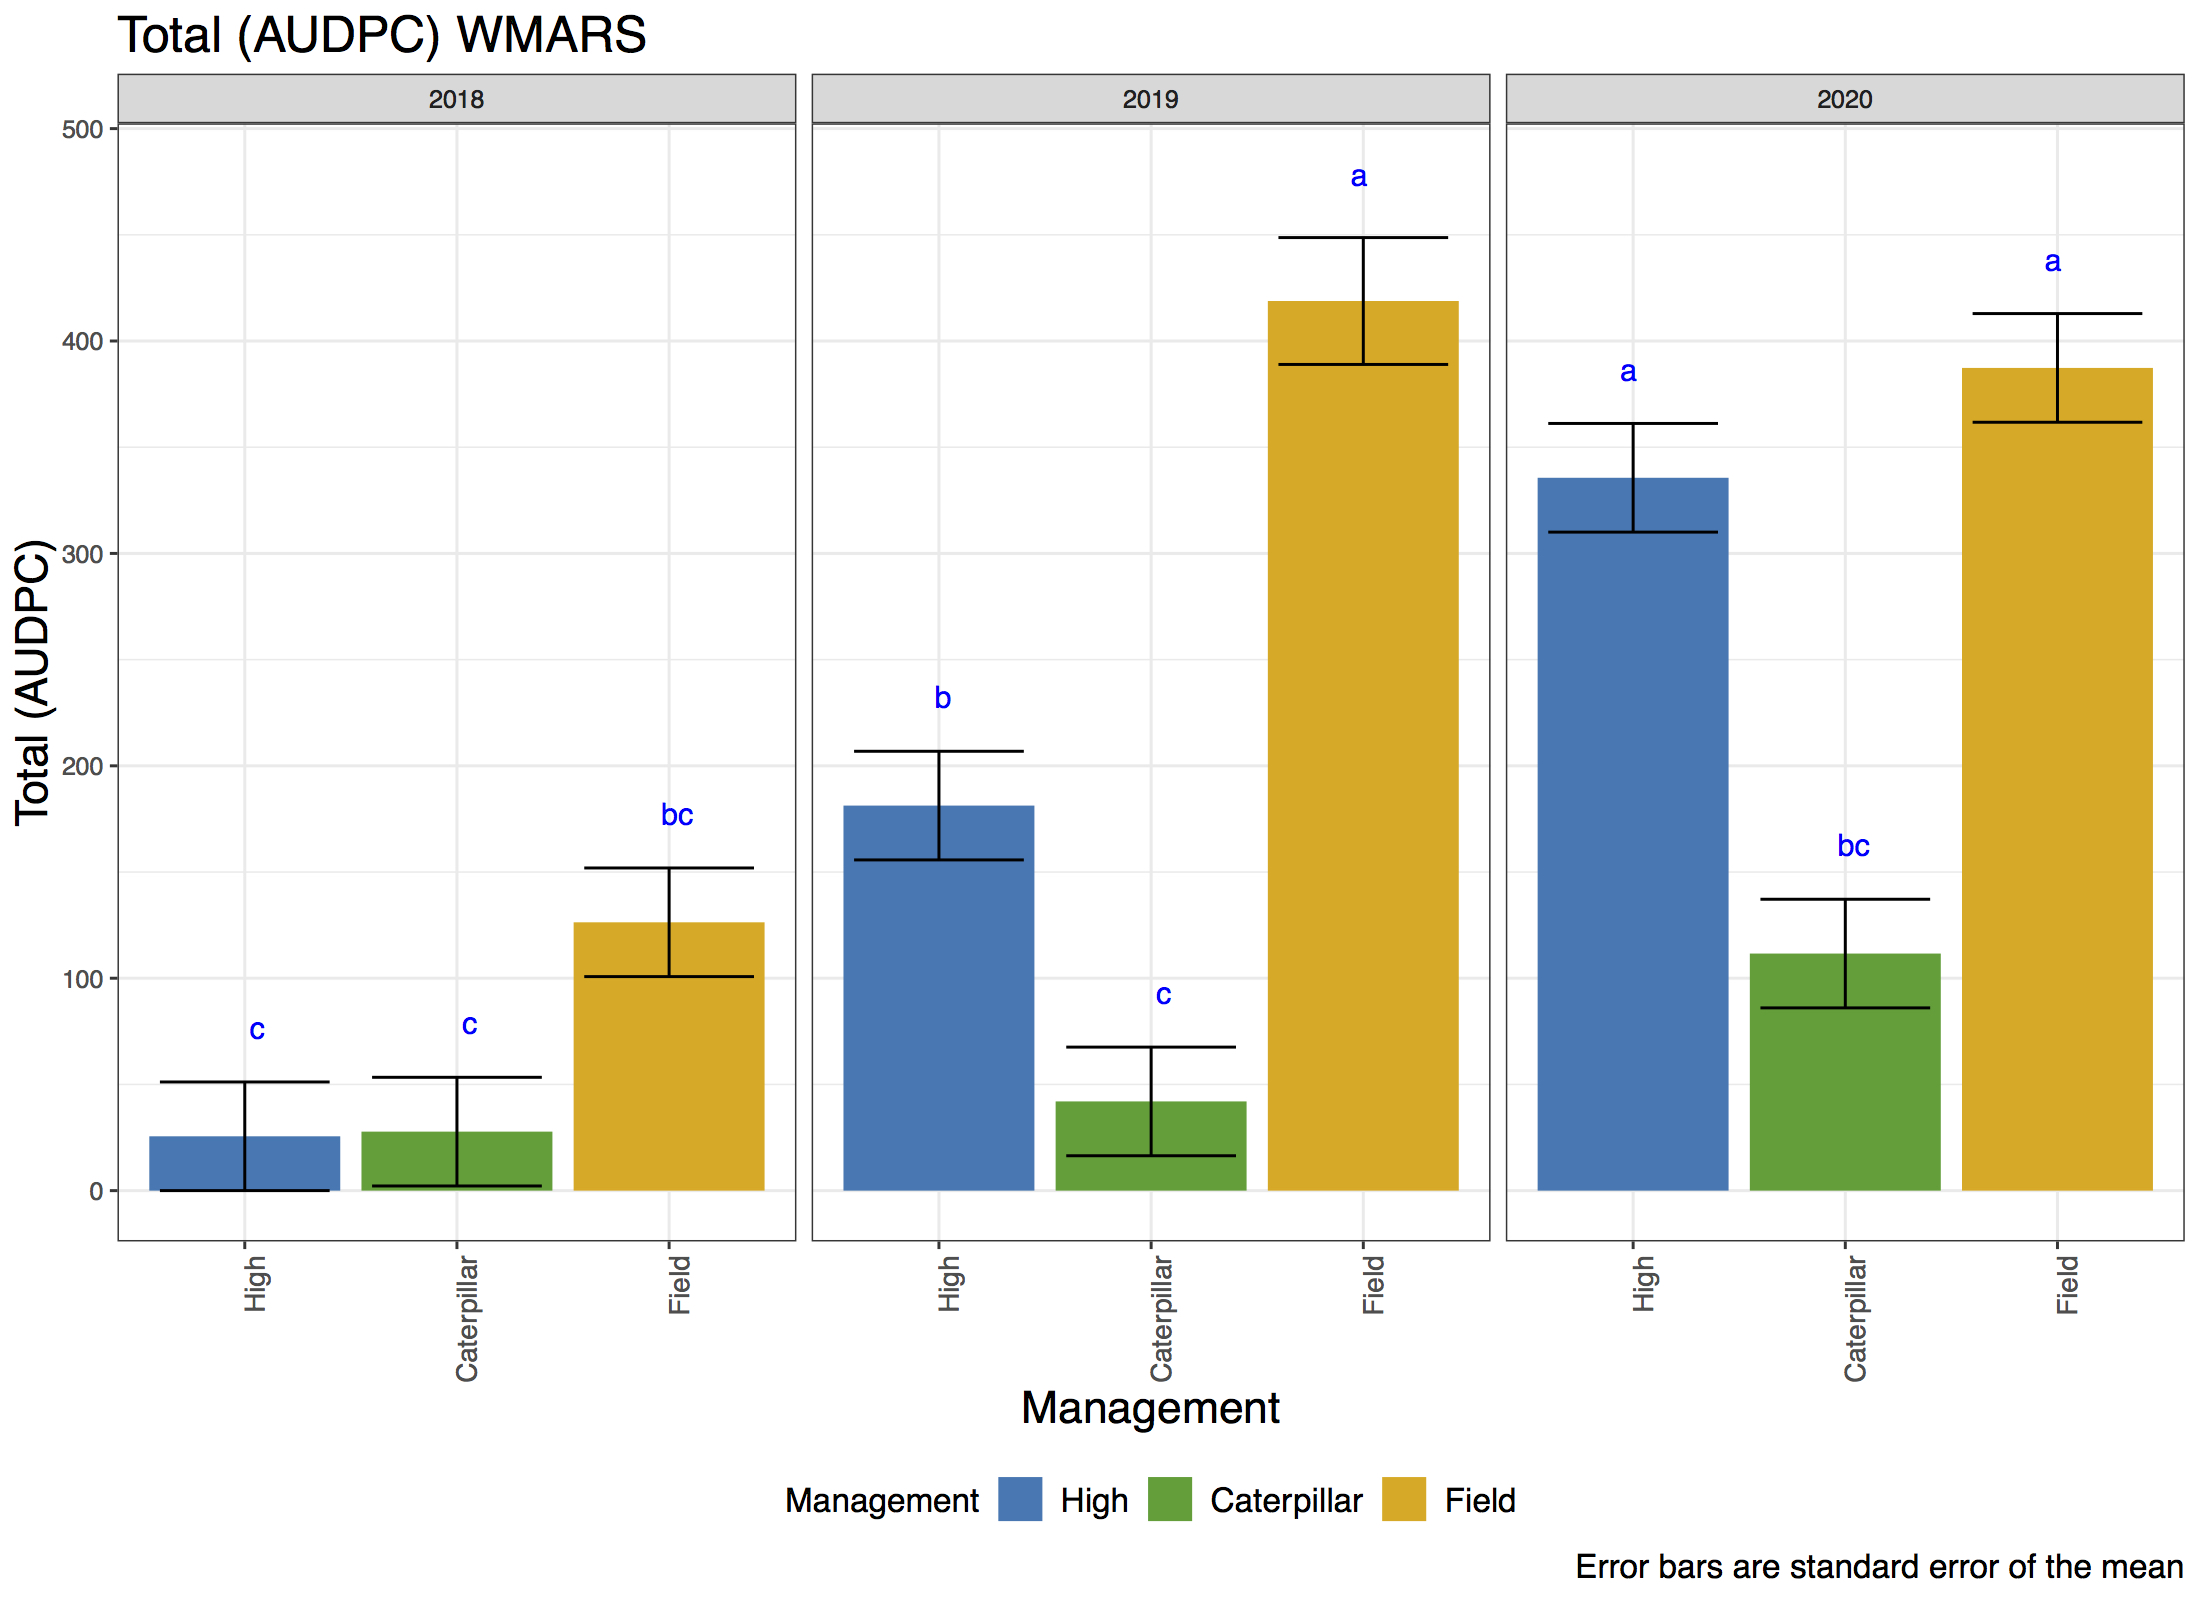
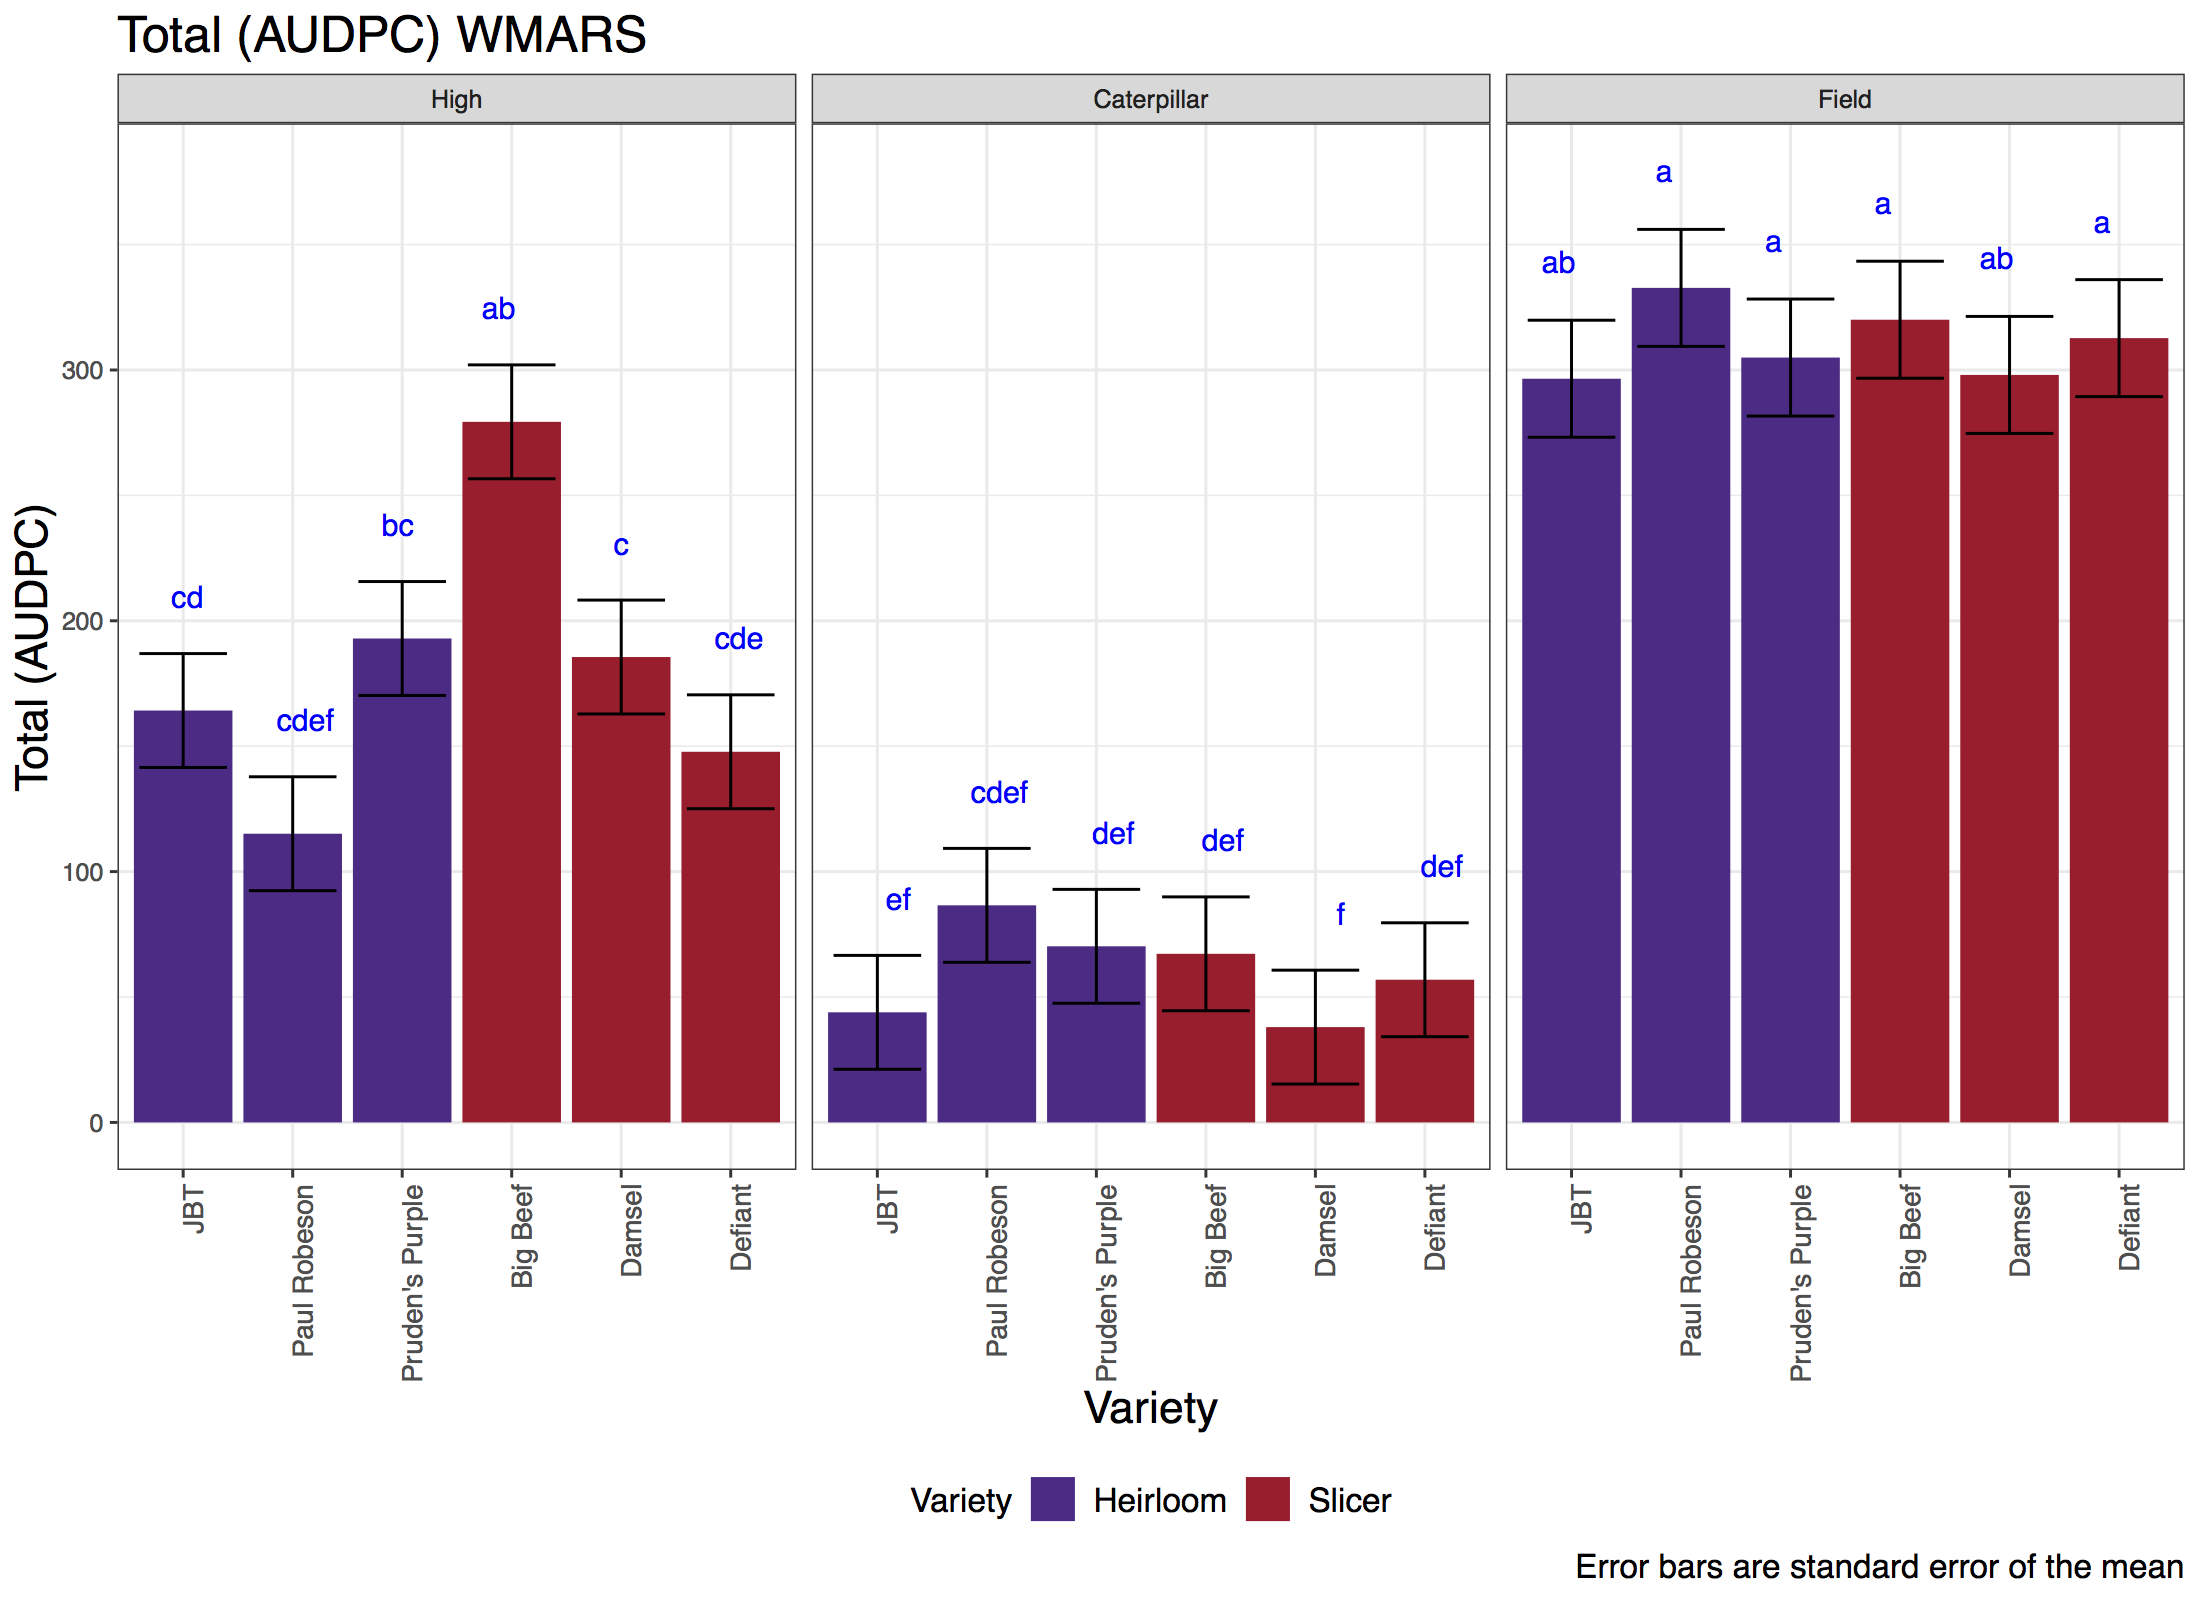
The open field had significantly higher total area under the disease progress curve (TAUDPC, all diseases combined) followed by the high tunnel, then the caterpillar tunnel. Figure 4 shows the TAUDPC in Madison across the three systems. The high tunnel may have had higher levels of humidity than the caterpillar tunnels, leading to higher levels of leaf mold in the high tunnel. Field disease pressure was primarily septoria leaf spot and early blight, and in the two tunnels disease pressure was primarily early blight and leaf mold. The reduction in septoria leaf spot in the two tunnel systems was particularly striking. Table 4 gives means by management systems for disease and quality traits. There did not seem to be a strong separation of varieties based on market classes. Big Beef in the high tunnel had a significantly higher TAUDPC than all other varieties except Pruden's Purple (Figure 5).
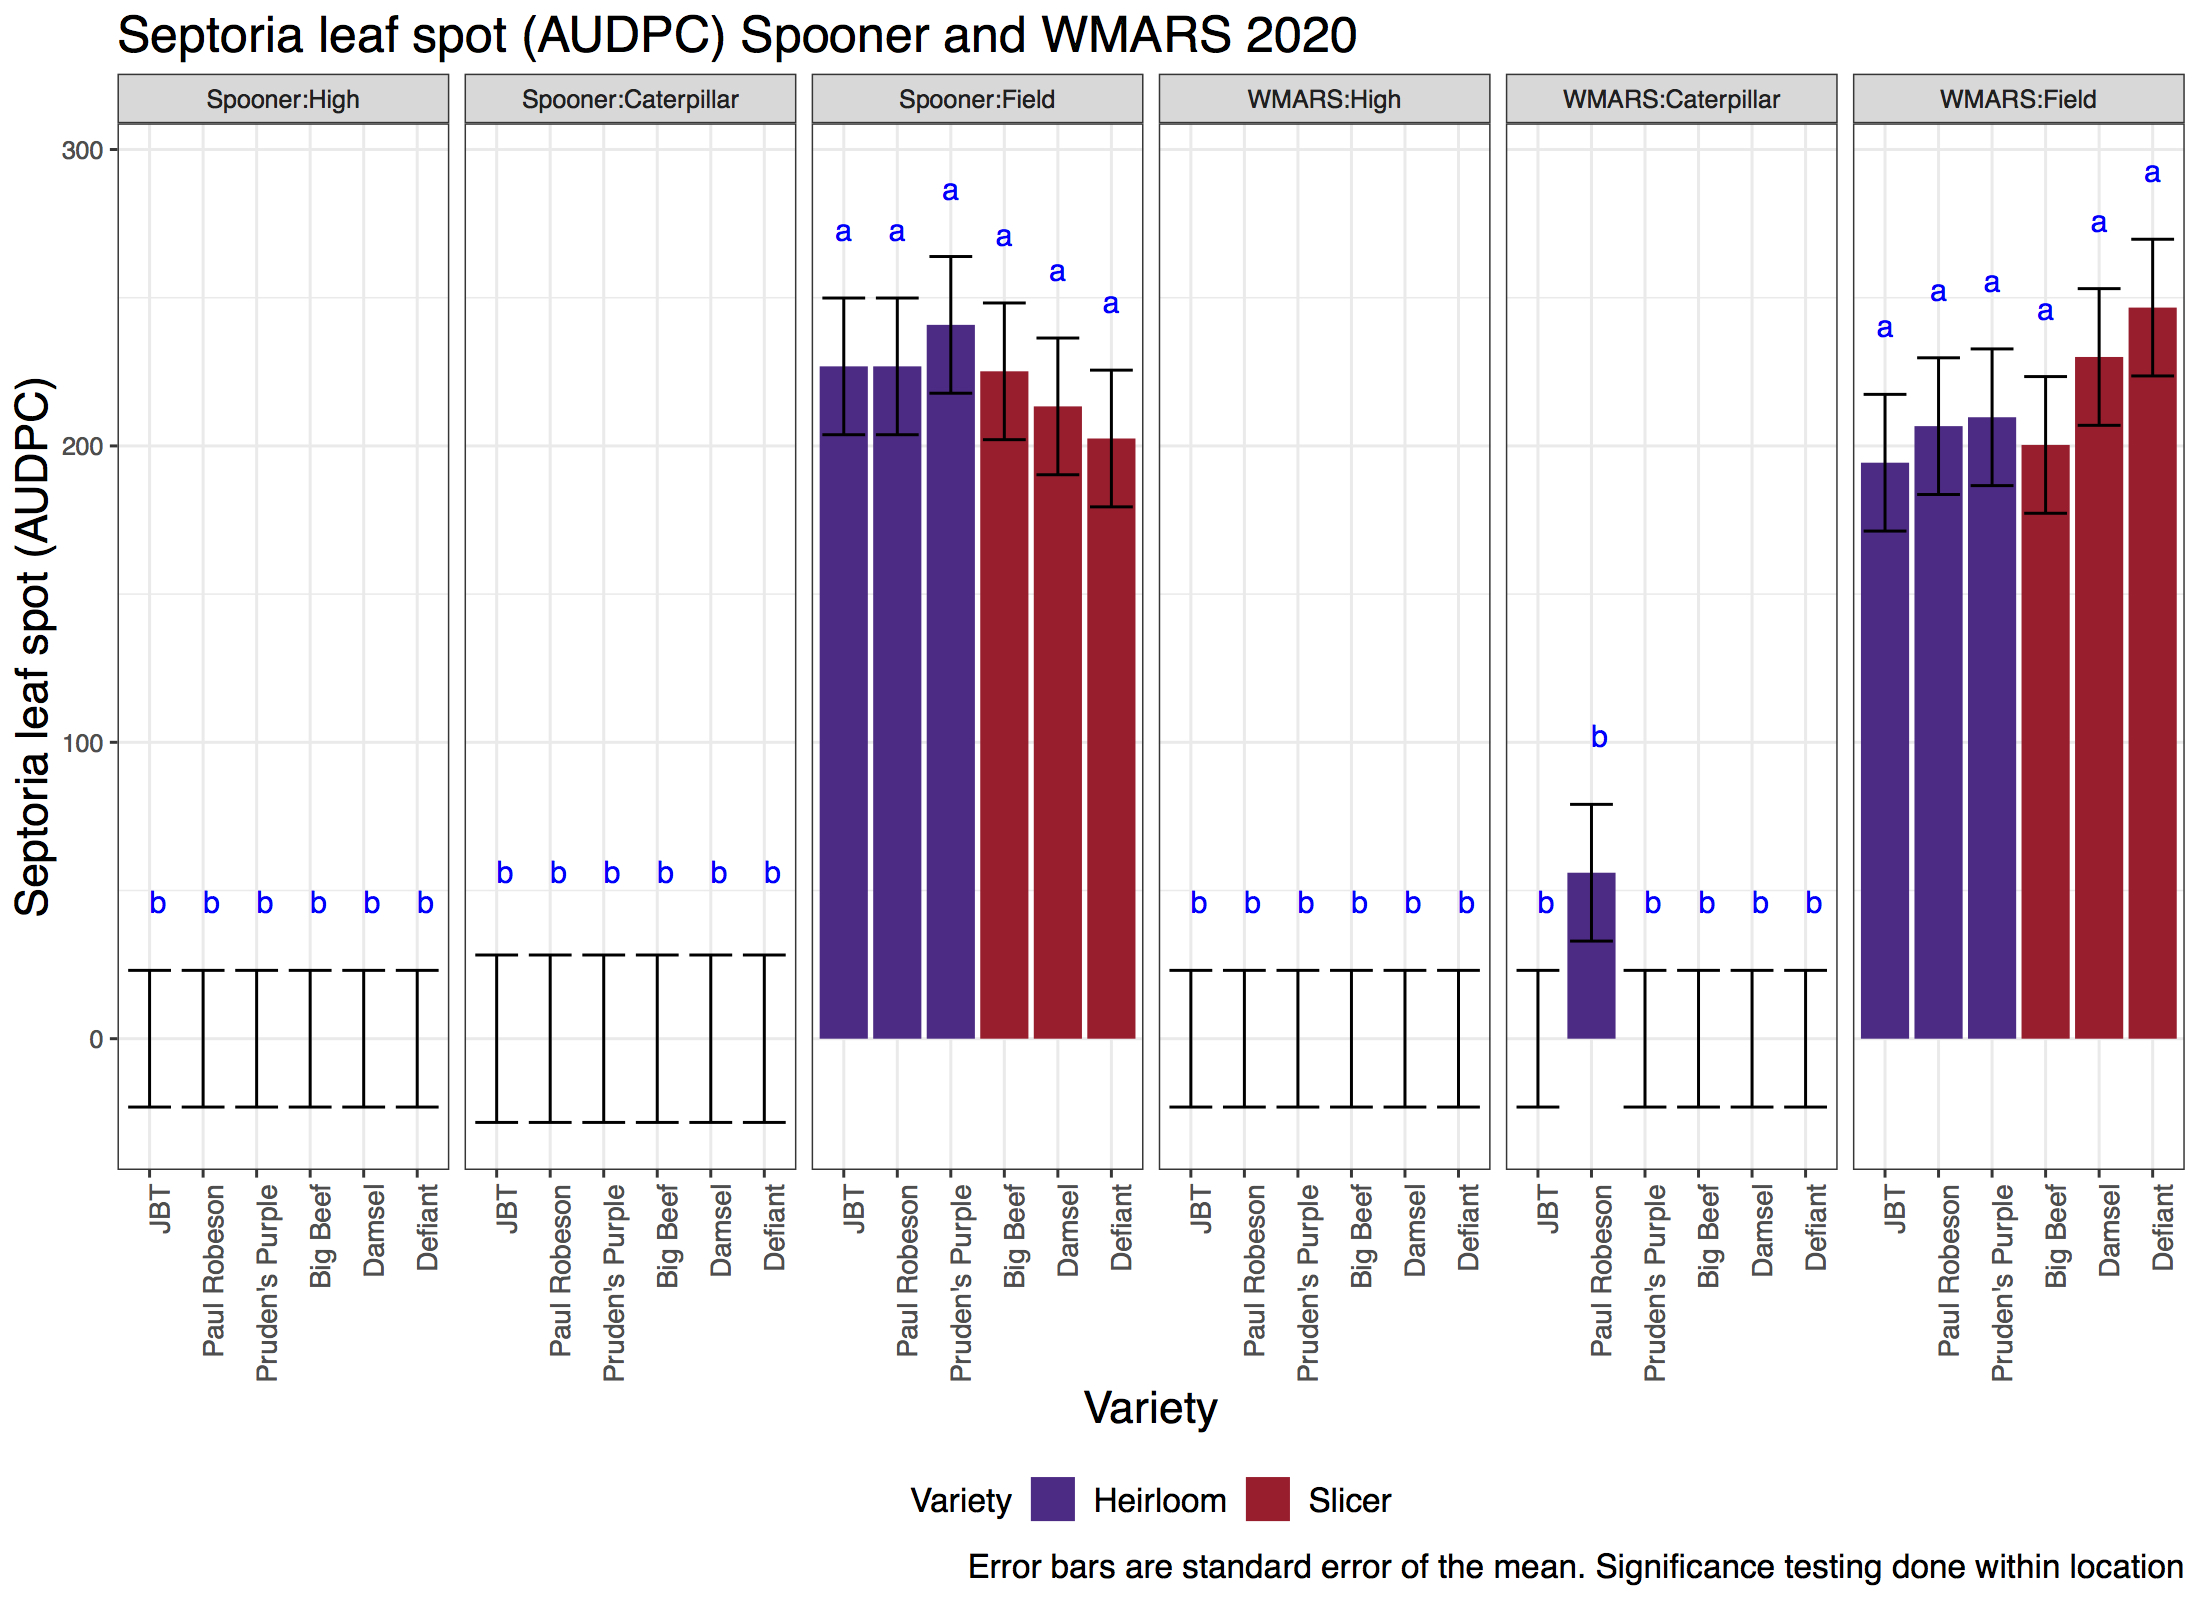
Septoria Leaf Spot is one of the most critical diseases for organic tomato production. In Madison, the main effects of year (p-value <0.05) and management (p-value <0.05) were significant. The interaction of year by management is also significant (p-value <0.05). When Spooner is added to the analysis and compared for 2020 only the management main effect is significant (p-value <0.05). There were no significant differences among varieties. The caterpillar tunnel and high tunnel have almost no disease, but the open field is significantly higher than both tunnel systems.
|
Table 4. Least-squared means by trait for each management system and location. Means with the same letter within an area of the same shading are not different at the p<0.05 level |
|||||
|
Variable |
Location |
High Tunnel |
Caterpillar Tunnel |
Open Field |
Overall* |
|
TAUDPC |
WMARS 2018-2020 |
180.82 b |
60.46 c |
310.83 a |
|
|
WMARS* |
335.61 ab |
77.74 cd |
387.33 a |
278.18 a |
|
|
Spooner* |
64.19 d |
111.61 cd |
222.58 bc |
121.50 b |
|
|
Overall* |
199.90 b |
94.68 c |
304.95 a |
|
|
|
EB AUDPC |
WMARS 2018-2020 |
57.83 ab |
32.88 b |
81.36 a |
|
|
WMARS* |
47.27 a |
36.05 ab |
41.05 ab |
41.46 a |
|
|
Spooner* |
<0.01 b |
8.33 ab |
<0.01 b |
2.77 b |
|
|
Overall* |
23.63 a |
22.19 a |
20.52 a |
|
|
|
LM AUDPC |
WMARS 2018-2020 |
93.58 a |
22.61 b |
1.55 c |
|
|
WMARS* |
170.88 a |
57.94 b |
4.66 c |
77.83 a |
|
|
Spooner* |
64.19 b |
69.41 b |
<0.01 c |
44.53 b |
|
|
Overall* |
117.54 a |
63.68 b |
2.33 c |
|
|
|
PM AUDPC |
WMARS 2018-2020 |
66.05 a |
12.08 a |
63.50 a |
|
|
WMARS* |
117.44 a |
8.27 a |
127 a |
84.24 a |
|
|
Spooner* |
<0.01 a |
<0.01 a |
<0.01 c |
5.58 b |
|
|
Overall* |
58.72 a |
4.13 a |
63.49 a |
|
|
|
SLS AUDPC |
WMARS 2018-2020 |
6.72 b |
7.02 b |
255.88 a |
|
|
WMARS* |
<0.01 b |
9.33 b |
214.61 a |
74.64 a |
|
|
Spooner* |
<0.01 b |
<0.01 b |
222.58 a |
74.19 a |
|
|
Overall* |
<0.01 b |
4.66 b |
218.59 a |
|
|
|
˚Brix |
WMARS 2018-2020 |
4.96 a |
5.14 a |
4.24 b |
|
|
WMARS * |
4.78 ab |
4.85 a |
4.35 abc |
4.66 a |
|
|
Spooner * |
4.28 bc |
4.5 abc |
4.12 c |
4.30 b |
|
|
Overall * |
4.53 ab |
4.67 a |
4.23 b |
|
|
|
CA % |
WMARS 2018-2020 |
0.35 b |
0.37 b |
0.41 a |
|
|
WMARS* |
0.34 a |
0.37 a |
0.38 a |
0.36 a |
|
|
Spooner* |
0.26 b |
0.33 a |
0.37 a |
0.32 b |
|
|
Overall* |
0.30 b |
0.35 a |
0.37 a |
|
|
|
Significance testing for WMARS 2018-2020 is across all three years, and significance testing in 2020 is across the two locations. * 2020 data only. Cells with the same font (regular, italicized or bold) were compared to each other within a trait and management systems that do not share a letter are significantly different at the p<0.05 level. |
|||||
Fruit Quality:
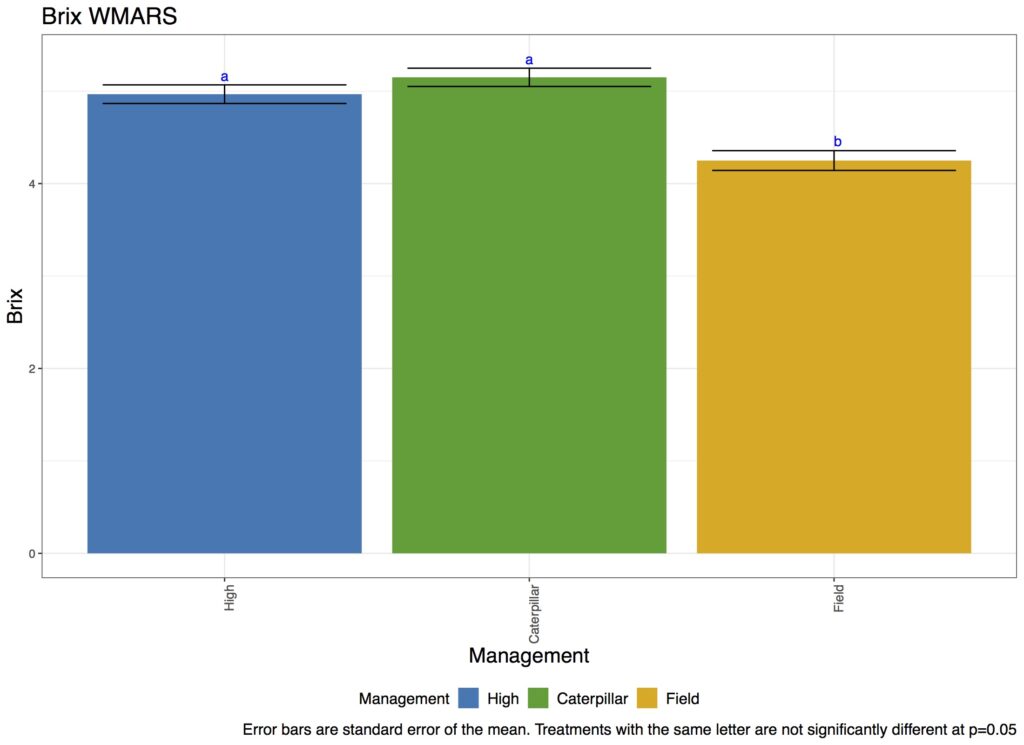
Management had a significant effect on ˚Brix levels (p-value < 0.05). The high tunnel was not significantly different than the open field and caterpillar tunnel, but the caterpillar tunnel had significantly higher ˚Brix levels than the open field in 2020 for both locations. In Madison across years, both tunnels had significantly higher ˚Brix than the open field but there was no difference between the tunnels (figure 7). The location had a significant effect on ˚Brix levels (p-value < 0.05) with Madison having significantly higher ˚Brix levels compared to Spooner in 2020. In Madison, there was strong evidence of the interaction effect of year by management on ˚Brix levels (p-value < 0.05). However, there were not crossover interactions among management systems at WMARS across years. There was no significant interaction between location and management in 2020.
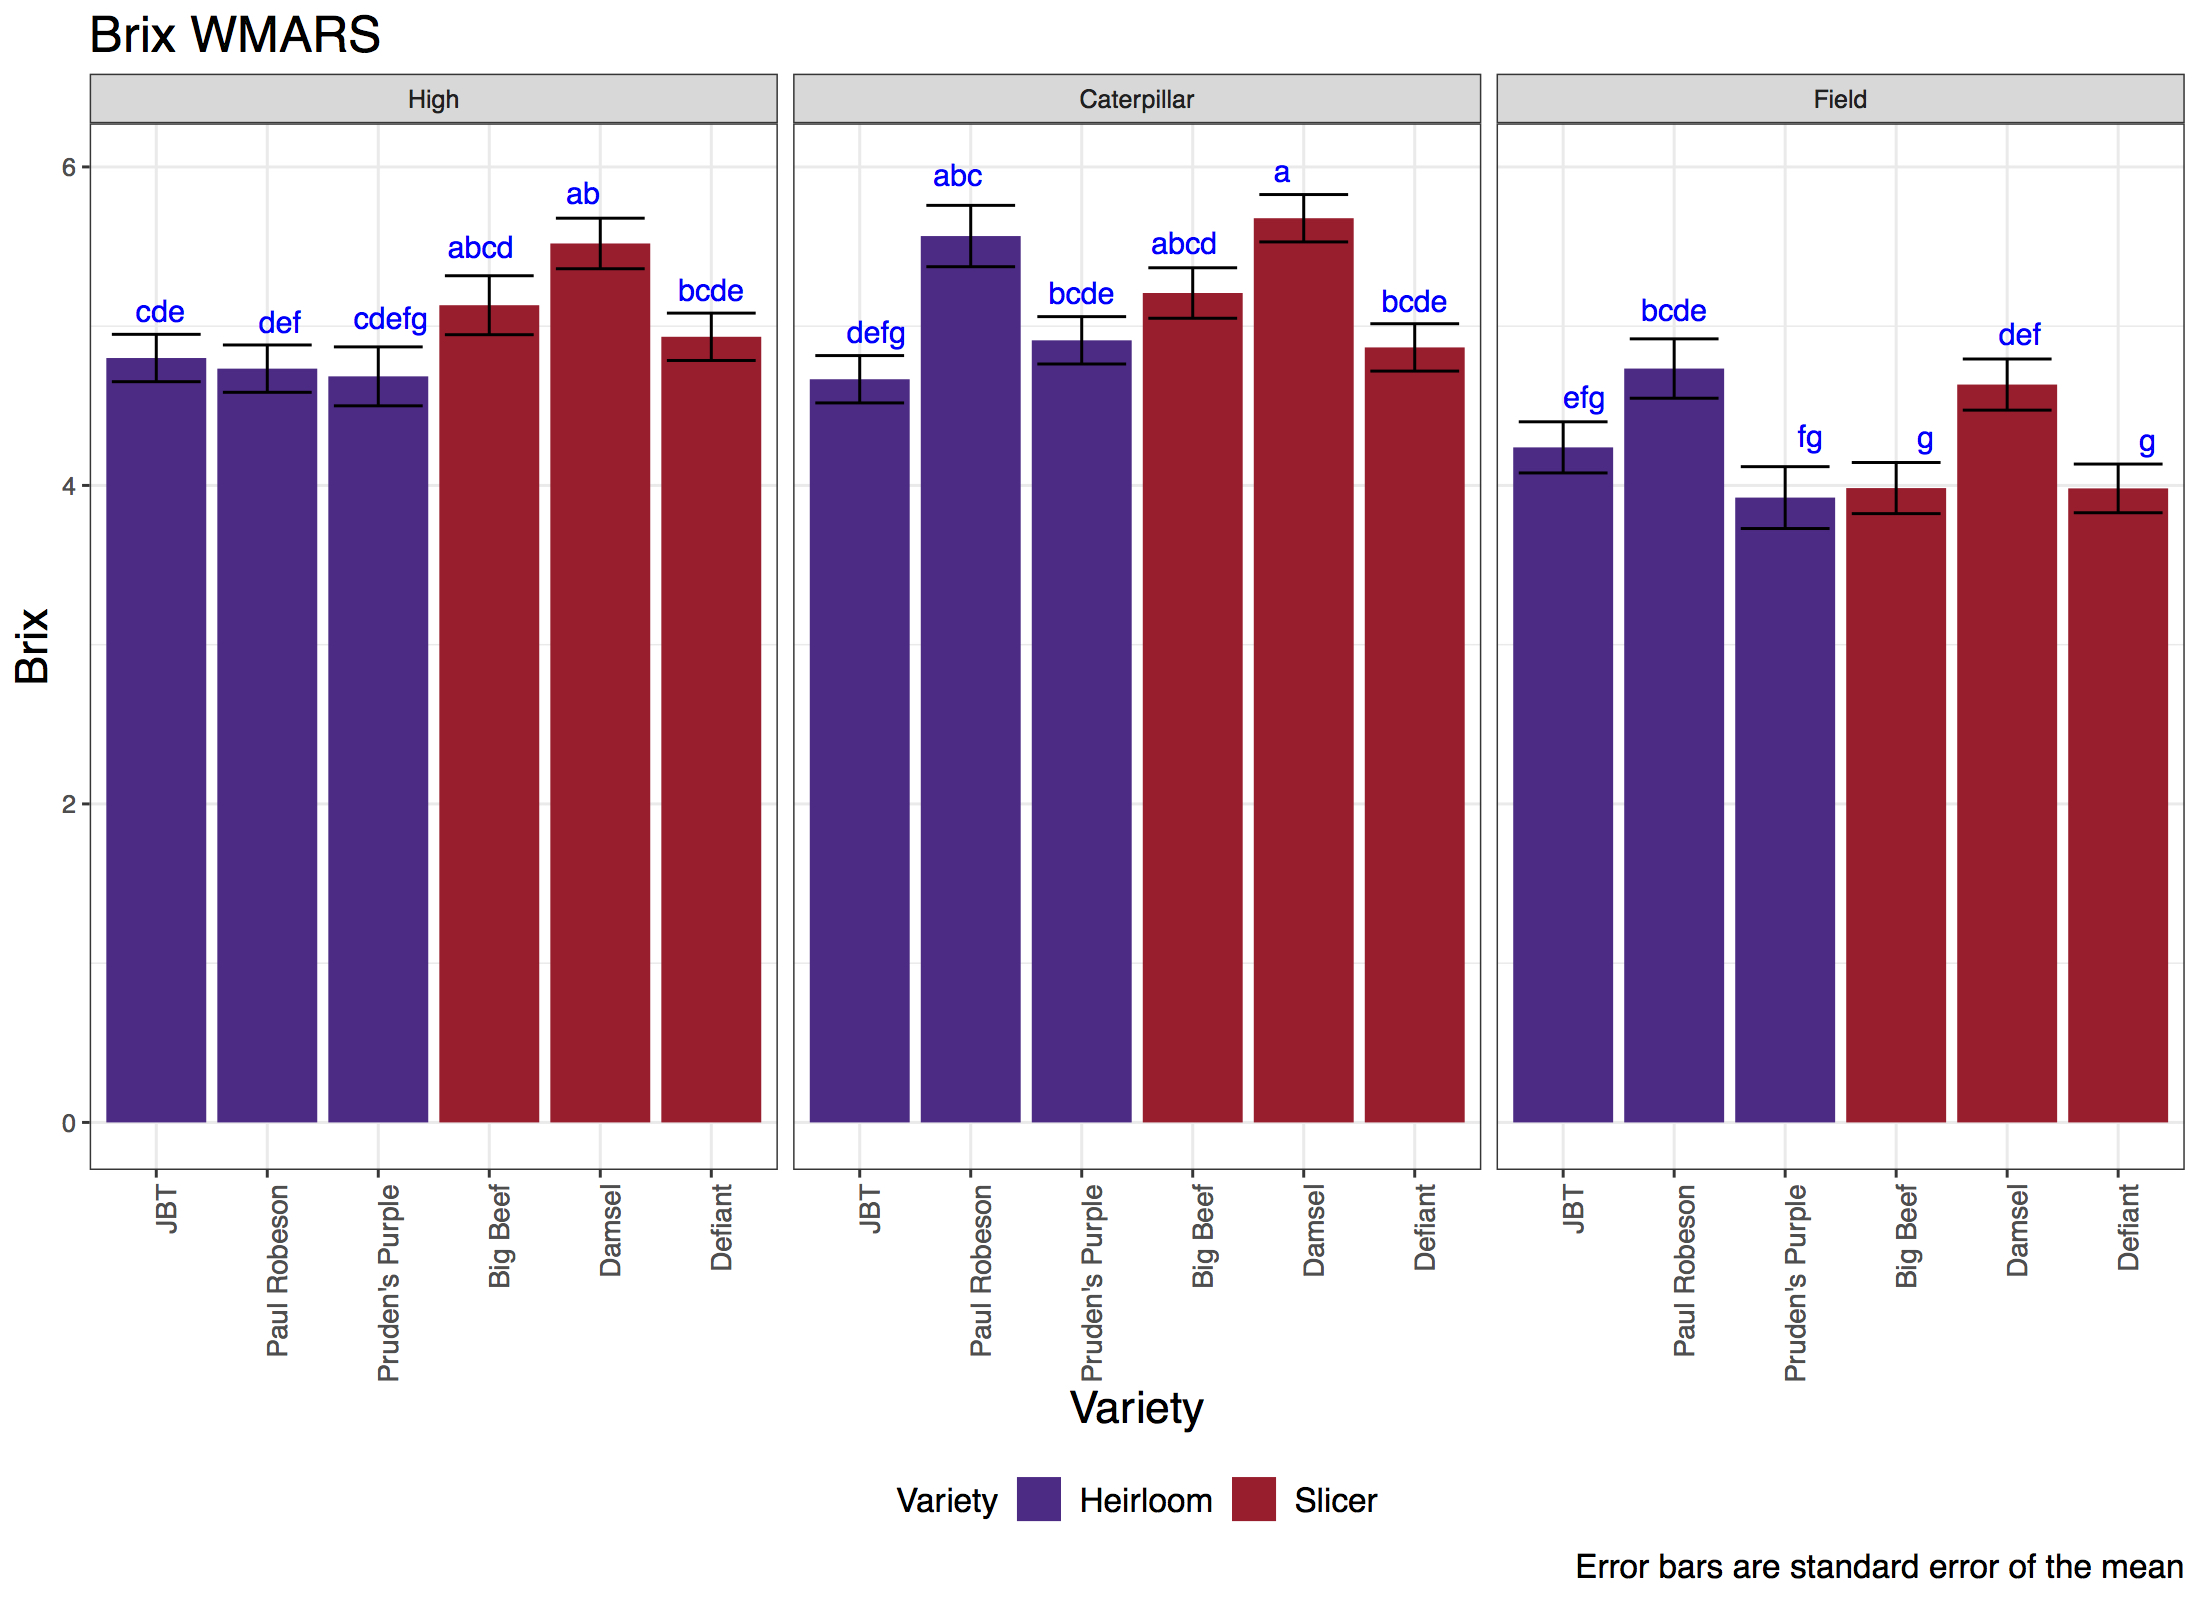
Variety also had an impact on ˚Brix levels (p-value <0.05) but pairwise comparisons did not show many significant differences between varieties (Figure 8). Damsel was consistently a top performer across all management systems, years and locations. Paul Robeson was also in the top performers for the caterpillar tunnel and open field but not for the high tunnel. Damsel performed exceptionally well in high tunnels for both locations in 2020. There was no clear worst performer. Big Beef, Defiant and Pruden’s Purple had a steep decline in the open field. Paul Robeson and Damsel also saw a decline in the open field compared to their performance in the caterpillar tunnel, and to the high tunnel for Damsel, but maintained reasonably high ˚Brix levels compared to other varieties.
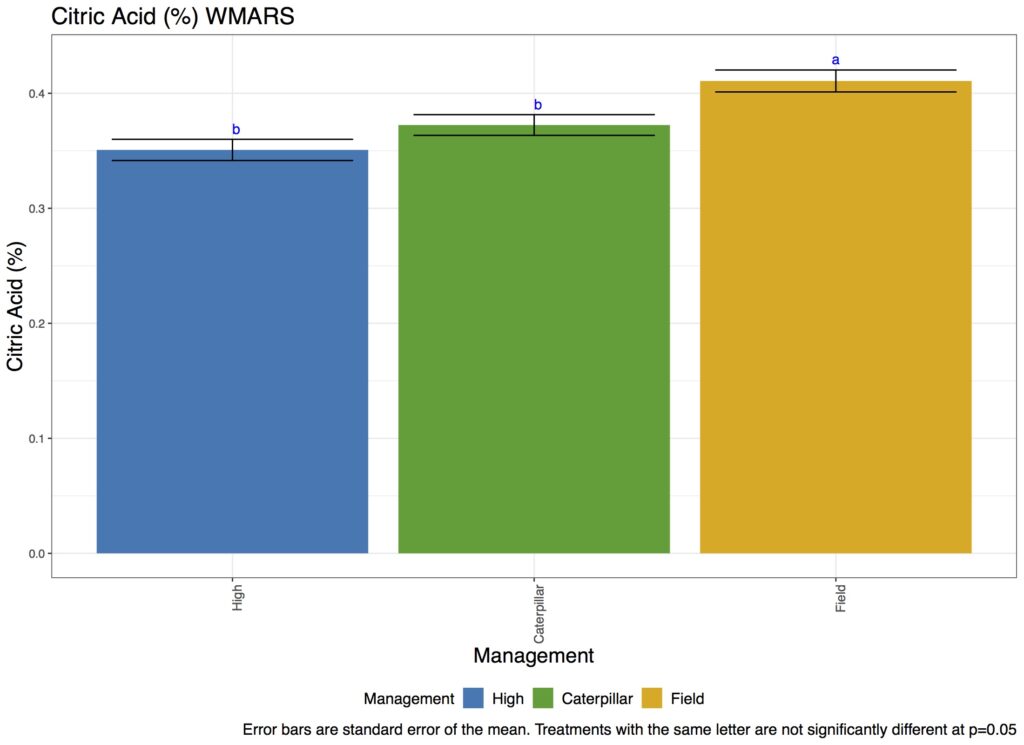
Management also had an effect on citric acid (CA) levels (p-value <0.05). Across locations and for year 2020, there was not a significant difference in CA levels between the caterpillar tunnel and open field, but the high tunnel had significantly lower levels than the other two systems. In Madison across three years, there was no difference between the tunnels, but they were both significantly lower than open field(Figure 9). Location had a significant effect on CA levels (p-value <0.05). For year 2020, WMARS had significantly higher levels of CA compared to Spooner. There was some evidence of the interaction effect of location by management on CA levels (p-value: 0.072), but no crossover interactions among management systems. Variety had a significant effect on CA levels (p-value <0.05). For year 2020, across both locations, there was a significant difference between varieties on CA levels. The interaction of variety by management was significant for year 2020 only (p-value < 0.05). There was a trend for almost all varieties except Defiant and Japanese Black Trifele of having higher CA levels in open field compared to both tunnels.
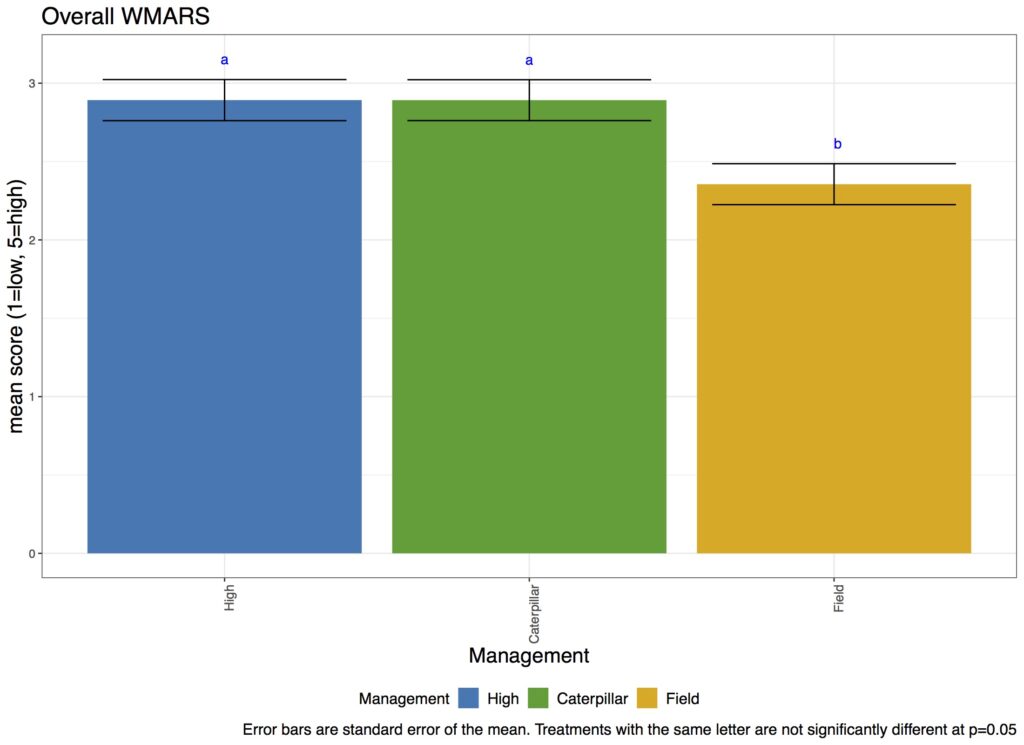
For the tasting data, management had a significant impact on on bitterness, acidity, sweetness, texture and overall flavor. When comparing the influence of management systems in acidity, the open field was significantly higher than both tunnels, and there was no significant difference between tunnels. Comparing sweetness, the tunnels were higher than the open field but not significantly different from each other. For overall flavor ratings, just like sweetness, fruit from both tunnels were rated with superior flavor compared to the open field and showed no difference between the tunnels (Figure 9).
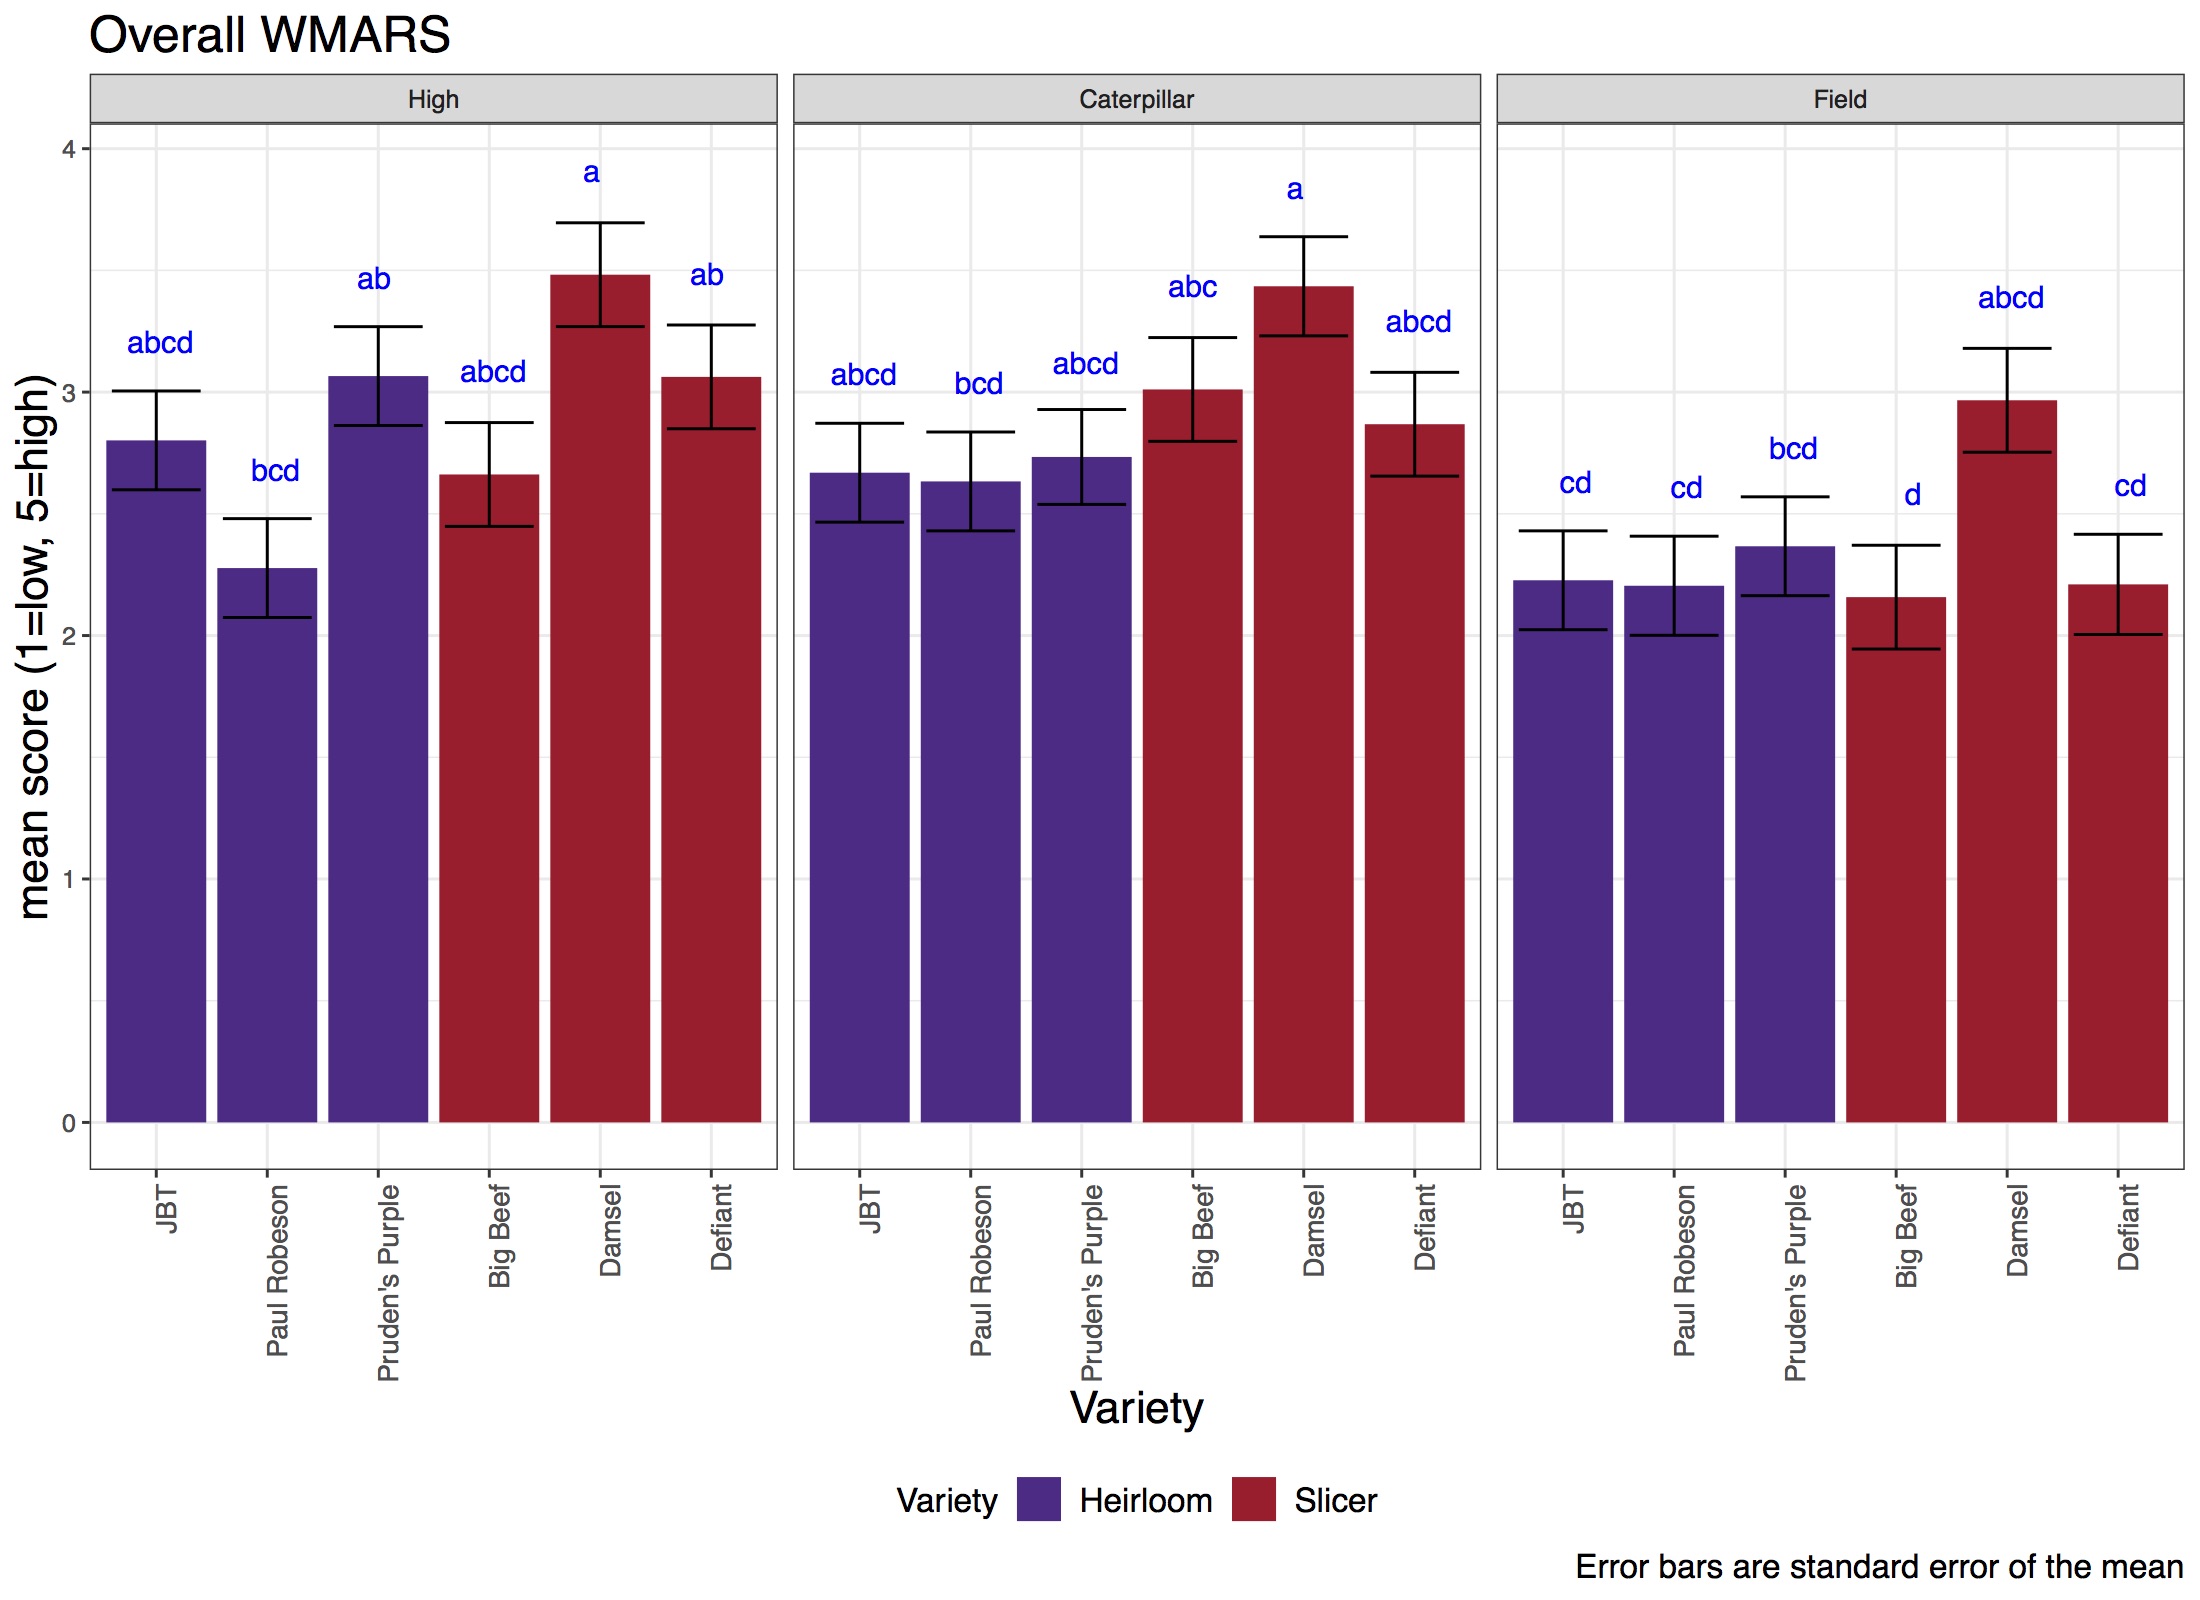
Variety had a significant impact on intensity, umami, acidity, sweetness, texture, appearance and overall flavor. Damsel showed the highest scores in overall flavor compared to other varieties and in specific scores like texture, intensity and sweetness was superior to all or most of the other varieties (figure 10). There was not a clear variety that performed worse than the rest. There was a consistent trend of all varieties showing lower overall flavor ratings in the open field compared to both tunnels.
On-farm trials
For both market classes, slicers and heirloom, there was a trend for better performance in terms of productivity and flavor in high tunnel and caterpillar tunnel than in the open field. There was not a clear difference between caterpillar tunnel and high tunnel in terms of performance. In some varieties and for some farmers the caterpillar tunnel had better performance and for other farmers and varieties the high tunnel was better.
Costs of production and revenue potential
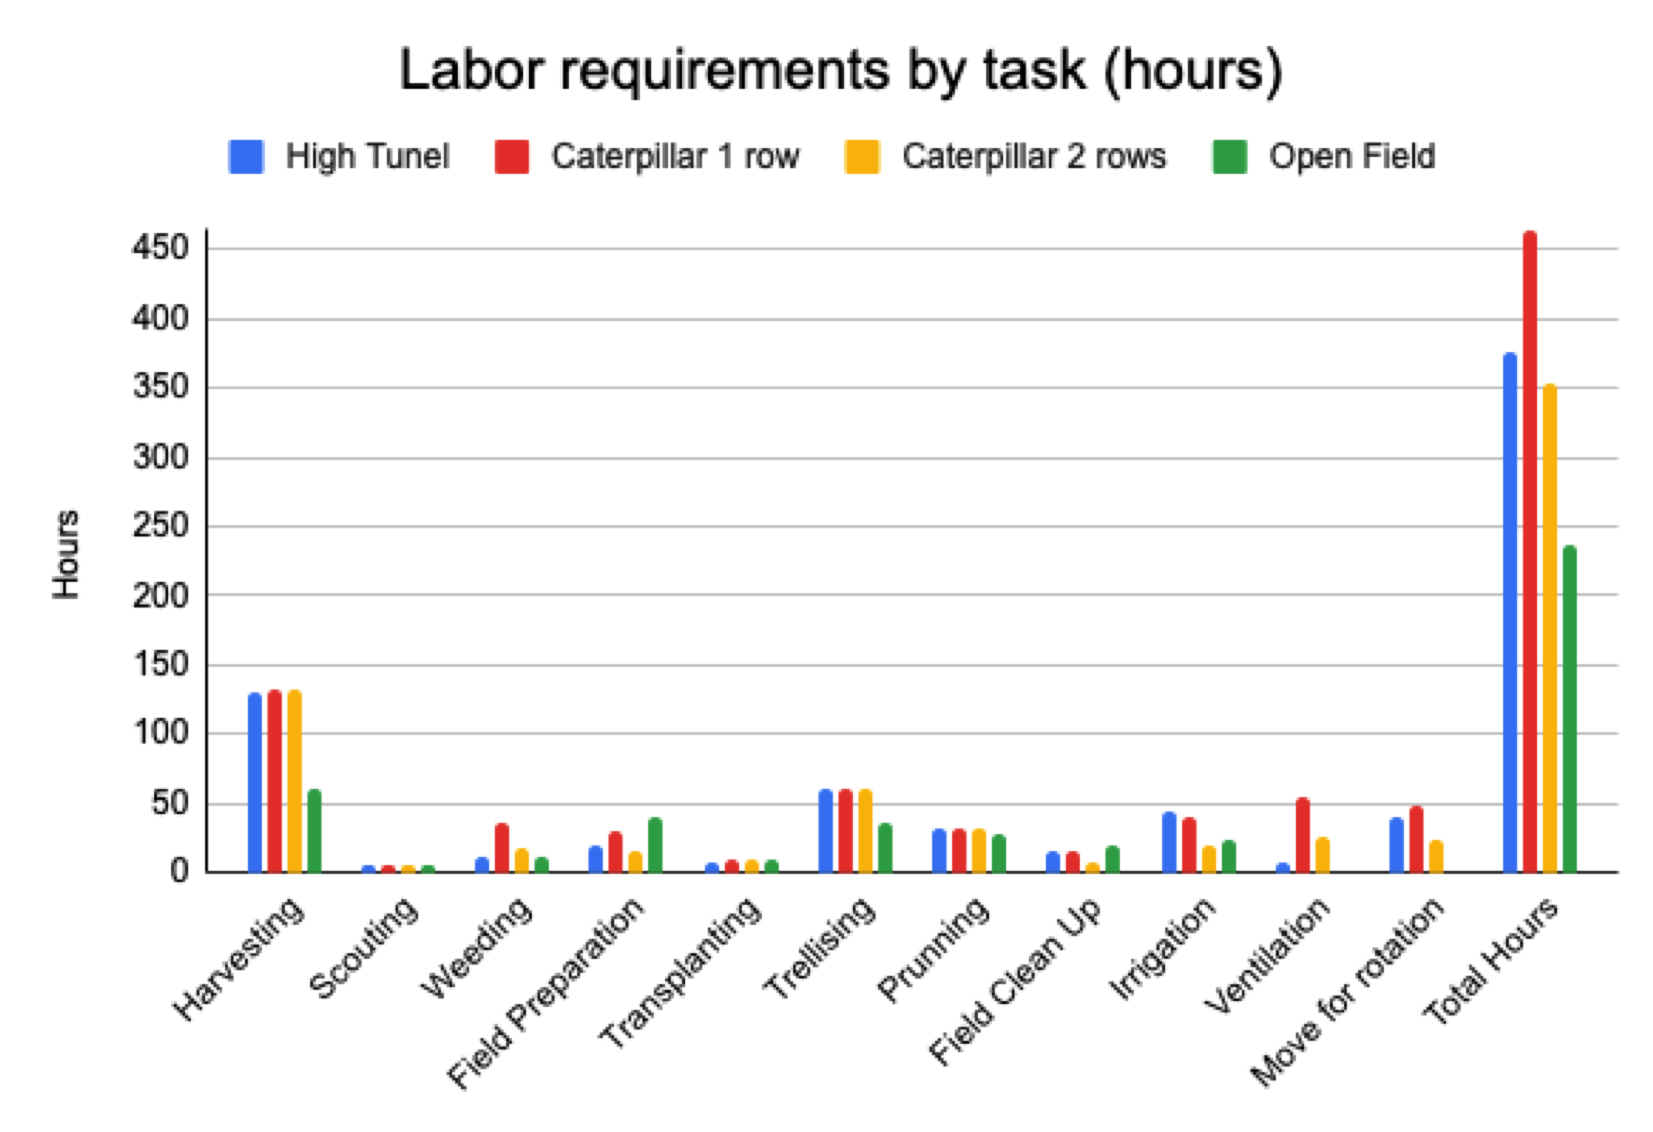
The breakdown by task showed that the primary activity by hours of labor requirement in each management system is harvesting with 130 hours for the high tunnel, 132.6 hours for caterpillar tunnels and 60 hours for the open field. The second most important task by hour requirement was trellising with 60 hours for the tunnels and 36 hours for the field. One of the tasks that showed big differences between systems was ventilation, with 7.2 hours for the high tunnel, 54 hours for the caterpillar tunnel with one row, an estimated 27 hours for the caterpillar tunnels with two rows and in the open field there was no ventilation needed. Tasks such as scouting, transplanting, and field cleanup did not show much difference between management systems, whereas pruning and trellising were slightly higher in the tunnels. For the total labor hours required by management system, the highest was the one row caterpillar tunnel with 464 hours; second was the high tunnel with 376 hours; third was the estimated amount for a two-rows caterpillar tunnel with 352.7 hours; and the lowest requirement was the open field with 236 hours.
A cost comparison of the three management systems, including both of the variations of the caterpillar tunnels (one and two rows) was performed (Table 5). These costs include management costs, purchase of the structure, maintenance expenses, and building costs. This was done for the equivalent of one high tunnel fitting 294 plants, and the number of caterpillar tunnels and field space for this number of plants was calculated. The costs of management were calculated with the data from the Madison trials that were recorded in the 2020 season, and US$10 per hour of labor cost was considered for the analysis. The management with the highest cost by season was the one row caterpillar tunnel, followed by the high tunnel and the two row caterpillar tunnel. The management with lowest cost was the open field. The purchase cost was calculated from different sources. For the high tunnels, prices were used from tunnels acquired from Zimmerman’s Welding LLC with a purchase cost of US$13,000 per tunnel including all materials. The caterpillar tunnels purchase costs were sourced from different companies depending on the material. For example, the greenhouse plastic was sourced from Nolts Produce Supplies, the PVC pipe from First Supply, the ground posts from Wiedenbeck, and the steel corkscrew anchor and rope from Farmtek, with a total cost of US$1,500 per tunnel. The open field costs are much lower due to the relatively few materials needed to implement this management system. The primary costs are the t-posts needed for the Florida weave trellis system that is commonly used in the NCR. T-posts can be found in most hardware stores and the cost is about US$3.5 each. The open field of a size that will fit 294 plants will need 112 t-posts, which translates to a total expense of purchase in infrastructure of US$392. Common materials, such as plastic mulch, drip tape, mainline, emitters, and trellising string, among others, for the three systems were not included in the calculations.
|
Table 5 Estimated costs and revenue for each management systems at an equivalent number of plants (calculated at 294 plants in each system). |
||||
|
Management |
High tunnel |
Caterpillar tunnel (1 row) |
Caterpillar tunnel (2 row) |
Field |
|
Estimated Total hours per season |
376 |
464 |
353 |
236 |
|
Estimated Yearly Cost |
$3,762 |
$4,644 |
$3,527 |
$2,360 |
|
Estimated Installation Costs |
$20,762 |
$14,124 |
$8,267 |
$2,752 |
|
Estimated Net Revenue 10 years |
$56,281 |
$46,954 |
$64,852 |
$6,092 |
For the building costs, person-hours needed for construction were gathered from the Madison estimating a 400 person-hours requirement for the high tunnel, eight person-hours for each caterpillar tunnel and zero building hours for the open field because they are included in the management segment for the moving task each year. Considering US$10 of labor cost, the high tunnel has a building cost of US$4,000. Each caterpillar tunnel of US$80, translating into US$480 for the six tunnels needed for one row caterpillar tunnels and US$240 for the two rows caterpillar tunnels. Adding up management, purchase and building costs, the highest management system cost is predictably the high tunnel, followed by the one row caterpillar tunnel and then the two-row caterpillar tunnel. The cheapest management system is the open field.
A 10-year cumulative net income projection was developed to help farmers understand the differences between management systems over time (Figures 26-29). The projection was calculated by adding up the difference between sales and total expenses for each year. The sales were calculated from the total marketable yield data from each management system for Madison in the years 2018, 2019 and 2020. The average sale price of US$7.7 per kilogram was used as per Hodge et al. (2018) and it was assumed that 100% of the marketable yield was sold at this price. The total marketable weight for the season for each system used for the calculations were the following: 1,480 kilograms for the high tunnel, 1,384 kilograms for caterpillar tunnels and 458 kilograms for the open field. The total expenses for each year included in year 1 were the purchase of the tunnels, building expenses and management costs. Year 4 and year 8 included maintenance costs that consist of the purchase and installation of polyethylene plastic film replacements. All other years included only management costs. The net revenue of each year was added to the previous one, thereby creating a projection of cumulative net revenue. The only management system that started with a negative net revenue in year 1 was the high tunnel, but all three systems had a positive net revenue every year starting in year 2.
The management system with the best performance over the ten years was the two rows caterpillar tunnel recovering the investment on year 1, with year 1 at a cumulative net revenue of US$2,418 and $64,852 cumulative net revenue after ten years, averaging $6,485 yearly net revenue. Caterpillar tunnels with one row had negative net revenue in year one of $3,439 and started accruing a positive cumulative net revenue at year 2 with $2,602. The cumulative net revenue over the ten-year period was calculated at $46,954 and averaged a yearly net revenue of $4,695. The high tunnel had two years of negative cumulative net revenue with -$9,332 and -$1,663 but started having positive cumulative net income at year 3 with $6,005. The total cumulative net income over the ten-year period was $56,281 and the average yearly net income was $5,628. The open field never had a negative yearly net income, but its average yearly net income is $1,140 and totaling a cumulative net income over the ten-year period of $6,092, significantly lower than other management systems.
Discussion
Environmental conditions
One considerable benefit of high tunnel production is the accumulation of more growing degree days that can result in earlier maturity, which confirms previous studies (Both et al. 2007 Waterer and Bantle 2000). Temperature has a direct impact on tomato development and calculating GDD is a useful tool to predict or explain different situations that might help farmers make better decisions. GDD requirements for tomatoes are well studied, although requirements vary slightly between different varieties. High tunnels do this by increasing higher temperatures during the morning until the evening, extending the time plants are in the optimum growth temperature range. Prior research had not yet compared the temperature and degree day benefits of caterpillar tunnels to high tunnels.
Important differences in air temperature were recorded between the three management systems in both locations for the year 2020. Daily maximum air temperature was consistently higher in both tunnels compared to the open field, especially when tunnels were closed, which is mostly early and late in the season. Temperatures remained higher, but with more limited variation in both tunnels in the middle of the summer when tunnels were open. This can be beneficial for tomatoes because a higher temperature will stimulate plant growth and fruit maturity (Both et al. 2007, Waterer and Bantle 2000) but can at the same time be disadvantageous when temperatures rise above 30˚C. Depending on the variety, this high temperature could start inducing flower abortion and this worsens as temperatures increase (Mefferd 2017). In both locations, Spooner and WMARS, and in both tunnels, daily maximum air temperature was recorded above 35˚C several times, compared to the open field that never went above 35˚C, except for the weekend of 4th of July, which was an exceptionally warm day. It reached 36.2˚C in the open field, 40.5˚C in the caterpillar tunnel, and 40.7˚C in the high tunnel. Research has shown that respiration outpaces photosynthesis at temperatures above 35˚C, which means that the plant is using more energy than it is capable of producing. This process could begin with a decrease in growth. If conditions persist or temperatures go higher, it can lead to serious damage in the plant (Wolfe et al. 1988).
On the other side of the temperature spectrum, minimum daily air temperatures were very similar across management systems in both locations. Surprisingly, temperatures in the open field overnight were slightly higher compared to the tunnels on some nights. This is in agreement with what Zhao and Carey (2009), Rogers and Wszelaki (2012), and Biernbaum (2013). The primary manner that high tunnels with closed sides loose energy during clear nights is by radiation to the cold sky. When tunnels are properly sealed, however, radiant heat from the soil and plants is trapped inside when moisture condenses upon touching the plastic film, just as moisture in atmosphere in cloudy nights reflects the radiant heat from soil back to soil (Biernbaum 2013). However, most high tunnels and caterpillar tunnels are not perfectly sealed loosing moisture and, therefore, are prone to heat loss. Another reason contributing to the slightly lower minimum temperatures in the high tunnels and caterpillar tunnels compared to open fields, and likely the most important one, is that soil temperature in both tunnels was consistently lower compared to open field. This was probably caused by several factors. One factor is that plants in both tunnels were much bigger because they were planted earlier and gave more shade to the soil, keeping the temperature lower. Also, in both tunnel systems, following farmer practices, landscape fabric was used instead of plastic mulch, which may have been another factor that contributed to the lower temperatures given that landscape fabric is permeable and therefore traps less heat during the day.
Similar results can be observed (Table 2) when daily average maximum and minimum air temperature are calculated. Maximum daily average temperatures were about 5˚C higher in caterpillar tunnels and high tunnels compared to the open field in both locations, but average daily minimum temperatures are almost the same between systems and even slightly higher in the open field. This shows that most of the benefits that both caterpillar tunnels and high tunnels bring with respect of temperature is through the elevated temperatures during the day and a slower cooling of temperatures by night, extending the window that the plant is in the optimal growth temperature range, which is usually between 25˚C and 30˚C (Csizinszky 2005). Tomatoes are known for compensating growth when night temperatures are below optimum if temperatures during the day are in the optimum range (Calvert 1964).
Comparing the GDD that plants accumulated in all management systems and locations shows that both tunnels and open field reached physiological maturity at similar GDD to what was expected from Pathak (2018). Although GDD accumulation at first harvest was similar between systems, the dates when that level of GDD was reached differed greatly. At WMARS, the first harvest was July 16th in both tunnels and August 20th in the field meaning a 35-day difference between both systems. A smaller difference was observed at Spooner, with the first harvest happening August 2nd in both tunnels and August 25th for the open field, with a difference of 23 days. We know that both tunnels were transplanted 34 days before the open field at WMARS and 18 days before at Spooner, and the first harvest in the tunnels was also 35 days before at WMARS and 23 days before at Spooner compared to the open field. Or when looked in days from transplanting to harvest, tunnels at WMARS needed 65 days, versus 66 days for the field. And in Spooner needed 66 days in the tunnels and 71 days in the open field. These results do not show a large difference in days needed between tunnels and open field, but what is important is that the tunnels were planted 34 and 18 days earlier in WMARS and Spooner with lower temperatures from earlier in the season they were still able to produce fruit in 1 day fewer for WMARS and 5 days fewer for Spooner between transplanting and first harvest. In other words, the tunnels were able to accumulate GDD in about the same amount of time or less when outside temperatures were lower. Later in the season, the caterpillar tunnels and high tunnel were mostly closed to increase air temperature. In September, maximum daily temperatures in both tunnels were significantly higher compared to the open field, allowing the plant to be more time in the optimum temperature range of 25-30˚C, keeping the plant producing more, fruit ripening, improving fruit quality and extending the harvest season. The temperature benefit from tunnels will combine with the disease mitigation benefit from tunnels, allowing to keep healthy plants for longer in the tunnels, that will produce more and better fruit quality. There did not seem to be a large difference between the high tunnel and caterpillar tunnel, showing that caterpillar tunnels provide temperature and GDD benefits more similar to high tunnels than the field.
Production traits
Our results show that tomato yields in caterpillar tunnels can be equal to or sometimes even higher than in high tunnels. While there was evidence of an interaction between location and management system, this was consistent over the years in the study, with no significant changes in the rank of management system within location over years. The caterpillar tunnel performed better than the high tunnel in Spooner, largely due to exceptional performance in 2018, and was equivalent to the high tunnel at WMARS for marketable weight. Both systems were higher yielding than the open field, this goes in line with the study performed by O’Connell et al. (2012) that suggests that up to a 33% increase in high tunnel production compared to open field can be achieved if proper management techniques are implemented. Also, Rogers and Wszelaki (2012) found that growers can increase marketable yield by using a high tunnel when compared with open field production. WMARS had a higher marketable weight than Spooner, which might be due to the higher temperatures and the longer season. This is in agreement with previous work we have done comparing high tunnel and open field management (Healy et al. 2016, Hodge et al. 2018). As we do not have fully replicated management systems in each location (there is only one high tunnel in Spooner and one at WMARS), the years serve as our replication of the systems within location and the lack of crossover interaction shows that the results of the tests of management system effects within locations are reliable. This shows that the caterpillar tunnel is a viable alternative to high tunnels at a lower cost for vegetable farmers.
In addition to their being a consistent effect of management systems within locations, there was a consistent performance of the different genotype between management and location. There were no significant changes in ranking of varieties across the three systems within a location, and there was only one significant change in rank across locations, with Defiant being the best variety in WMARS and Big Beef being the best variety in Spooner for marketable weight. Marketable count followed the same pattern as marketable weight, although as Defiant had smaller fruit it has a consistently higher marketable count. This shows that all varieties had higher performance in the tunnels and variety recommendations can be made for each location without having to make recommendations specific to management systems, this is in agreement with Jett and Read (2002) who found that almost every cultivar that performs well in the open field will perform better in the high tunnel. It is also in agreement with our previous results (Healy et al. 2016, Hodge et al. 2018). However, as there were system-specific differences in the prevalence of certain causes of unmarketability, such as blossom end rot, choosing varieties that are less susceptible to these particular problems for specific systems may be beneficial to growers. By using a representative group of tomato varieties, we hope our results are generalizable to other varieties that may be grown in tunnels in the NCR.
Between management systems, the open field had much higher levels of unmarketable yield compared to both tunnels. The open field is not protected from rain, causing more unmarketable fruit due to fluctuation in the soil moisture that can lead to fruit cracking and splitting (Peet and Willits 1995, Rogers and Wszelaki 2012). It also has higher disease pressure (Blomgren and Frisch 2007, Wells and Loy 1993), which is also a factor that may increase the unmarketable fruit proportion. Hornworms are more prevalent in the tunnels compared to the open field; this may be because they are protected from predation and for higher temperatures in the tunnels. Blossom end rot seems to be higher in the high tunnel compared to caterpillar tunnels and open field. This might be due to multiple factors such as soil nutrient imbalances, uneven moisture, higher temperatures or even faster vegetative growth (Rogers and Wszelaki 2012). This might be due to more moisture reaching the soil under the plants in the caterpillar tunnel from the edges, due to its narrower width, decreasing the chance of extremely low moisture levels in comparison with high tunnel.
Disease
There were significant differences in disease incidence due to management. The open field had significantly higher TAUDPC followed by the high tunnel, then the caterpillar tunnel. The high tunnel may have had higher levels of humidity than the caterpillar tunnels, leading to higher levels of leaf mold in the high tunnel. This is in line with our previous trials that found significantly higher levels of TAUDPC in the open field compared to the high tunnel (Healy et al. 2016, Hodge et al. 2018), there were not caterpillar tunnels included in those studies. Where we could test the effects of location and year, these were also significant sources of variation, with Spooner showing lower TAUDPC than WMARS and with a trend towards higher TAUDPC over years. In the open field, the TAUDPC was mostly SLS+EB, while in the caterpillar tunnel and high tunnel it was mostly EB+LM. For PM there was no difference between management systems. This composition is important because comparing between the tunnels and open field, LM in the tunnels seems to trade off with SLS in the field. However, LM seems to progress much slower and affects fruit production less severely than SLS. In terms of yield reductions, it seems like SLS has a larger impact than LM in our study. While EB seemed less prevalent in the field, this may have been partly due to the preponderance of SLS which made scoring EB separately much more difficult in the field than in the tunnels. EB also showed more yearly variation in disease pressure than other diseases.
The open field is the least affected by LM, which was almost absent every year. This is consistent with the literature that show that leaf mold progresses faster in environments with high relative humidity and temperatures (Warren 2015). This type of environment is exactly what caterpillar tunnels and high tunnel provide. In addition, the high tunnel had higher temperatures, humidity and lower ventilation than the caterpillar tunnel which may explain the higher levels of LM present there. This is consistent across years and location. SLS is a disease that thrives when there is a prolonged leaf wetness and when there is splash when rain hits the soil or mulch, because the spore that is in the soil needs the moisture in the foliage to infect it. Therefore, with the open field being unprotected from rain, it has the ideal conditions for SLS to thrive.
Overall, the management system had a more pronounced effect on disease than the variety, but there were a few differences in varieites for particulary diseases and overall TAUDPC. In the high tunnel, Big Beef had significantly higher TAUDPC compared to all varieties except Pruden’s Purple. Damsel and Defiant performed significantly better than Pruden’s Purple for EBAUDPC. For LMAUDPC, Japanese Black Trifele and Paul Robeson were significantly lower than Big Beef in the high tunnel for years 2019 and 2020 where LMAUDPC levels were high enough to see significant differences.
Quality
Generally, both tunnels had higher ˚Brix levels compared to open field but there were no significant differences between tunnels. This may be explained by the higher temperatures in both tunnels compared to the open field and also that there were no significant differences in temperature between caterpillar tunnel and high tunnel. Another factor that might affect ˚Brix levels is that generally, both tunnels had lower soil moisture levels compared to the open field, increasing the ˚Brix levels (Aguyoh et al. 2015). The healthier foliage in the tunnels may also have been able to produce more sugars as fruit ripened due to higher sustained levels of photosynthesis. The higher levels at WMARS compared to Spooner can most likely be explained by the higher temperatures in that location (Gautier et al. 2008). Results show that CA levels increased in the open field compared to both tunnels, which confirms we saw in prior studies by Healy et al. (2016) and by Hodge et al. (2018). These studies also reported higher ˚Brix levels in the high tunnel compared to the open field. The tastings confirm what was found in the ˚Brix and CA, with higher perceived sweetness in the tunnels compared to the open field, and higher acidity in the open field compared to both tunnels, with no significant difference between tunnels. The high tunnel and caterpillar tunnel both showed a significantly higher overall flavor rating compared to the open field. This is most likely due to the higher sweetness/˚Brix and the lower acidity/CA levels. This goes in line with previous work from Healy et al. (2016) and by Hodge et al. (2018).
Significant differences between varieties were seen, supporting the strong effect on genotype on sugar accumulation. Damsel performed best across management systems, which may be due to the fact that this variety was bred specifically for flavor. Damsel also had generally higher levels of CA compared to other varieties, which may also be due to selection specifically for flavor. The results with Damsel were borne out in taste evaluations and farmer preferences for the variety. Damsel had the highest mean value for overall flavor although it was not significantly different than most other varieties in each system. Most varieties showed improved flavor in both tunnels compared to the open field, however, there was some variation in whether varieties had better overall flavor in the high tunnel or in the caterpillar tunnel.
On-farm trials
The qualitative results from on-farm trials align with our on-station trials, with the open field generally performing worse than both tunnels and no clear differences between the high tunnel and caterpillar tunnel. For the slicer market class, Damsel seemed to be the preferred variety due to its good performance and excellent flavor. The best variety in the open field on farm surprisingly was Paul Robeson for the heirlooms and Damsel for the slicers. For the tunnels, the best slicer was again Damsel and Japanese Black Trifele seemed to be the best heirloom.
Costs of production and revenue potential
The caterpillar tunnel with one row required the greatest number of person-hours of management, followed by the high tunnel, the estimated caterpillar tunnel with two rows and the lowest was the open field. The difference between tunnels and open field can be explained in large part because of the 13 harvests in the tunnels and higher yields versus only 6 harvests in the open field and the lower yields. Additionally, irrigation, ventilation, pruning, trellising and moving for rotation contribute to the differences in the labor requirements between all tunnels and open field.
Harvesting was the principal task requirement by person-hours between all management systems, with very similar amounts of time required for the caterpillar tunnel and high tunnel systems. Pruning and trellising person-hour requirements are very similar between caterpillar tunnels and high tunnel as same system was used in each management system. Second, the plants also had the same number of trellising and pruning work days. On the other hand, the open field used a Florida weave system that is a less intensive system in terms of person-hour for trellising and had fewer trellising workdays because of later planting and the different trellising system. This way of management also requires less intense pruning.
Differences in ventilation are evident in that both tunnels were either opened or closed 36 times during the 2020 season. The high tunnel requirements for ventilation were much lower due to its quick and efficient handle system used to open and close. On the other hand, opening a caterpillar tunnel is a completely manual procedure consisting of rolling the plastic inwards and the reverse for closing. This is a slow process requiring a moderate amount of effort.
The differences between caterpillar tunnels with one and two rows are notable when comparing the total hour requirements and thus it may be worth it to farmers to trial two rows of tomatoes in the caterpillar tunnels. However, two row caterpillar tunnels might have more disease pressure due to lower ventilation and also due to more rain reaching the plants because are closer to the edges of the tunnel or simple due to more competition for resources from the plants like water, light and nutrients. They might result in a decrease in marketable yield and overall plant health, making the potential profit smaller. More studies need to be done in the future regarding this.
There are also differences between systems in terms of initial costs. This can be divided into the cost of purchase and the cost of labor to build each system. The purchase of a high tunnel is the most expensive at around $13,000 compared to $1,500 for a caterpillar tunnel. The cost of a caterpillar tunnel appears to be much lower, but a high tunnel has enough area for about 300 plants compared to about 55 plants in a single row in a caterpillar tunnel. Therefore, if one row caterpillar tunnels are used, six of them are needed in order to grow the same number of plants as a high tunnel, and three two rows caterpillar tunnels are needed to hold about 300 plants. This bring the cost of purchase to about $9,000 for a single row caterpillar tunnel and $4,500 for a double row, which is still considerably lower than the $13,000 cost of a high tunnel. Some of the reasons that caterpillar tunnels have lower costs is the cheaper materials used. Caterpillar tunnels are made mostly out of PVC bows, plastic film, rope, and anchors. On the other hand, high tunnels use large amounts of galvanized steel, wood boards, screws, bolts, wiggle wires, plastic films, and anchors, among many others raising the cost of materials.
The costs of building the different management systems also vary greatly. As expected, the higher complexity of high tunnels is translated into more hours of construction. A high tunnel needs about 400 hours of labor to be constructed due to the multi-step process. Some of these steps, such as installation of the plastic film or assembling the frame, require at least four people at a time to complete the task. Also, some of these tasks might require tractors, trucks and other equipment to make the job more efficient. Furthermore, the end walls and side-walls need to be installed as well as ensuring functional opening and closing mechanisms. The installation of a caterpillar tunnel is significantly easier and faster. A crew of two people can install a caterpillar tunnel in a morning or eight person hours, totaling 48 person hours for the single row systems and 24 person hours for the double row caterpillar tunnel.
A cumulative net revenue projection for the first 10 years is possible given the purchase cost, building costs and yearly management. The results reveal initial costs being much higher in all tunnels, but due to the significantly higher marketable yield in these systems, the revenue that tunnels bring is enough to increase the net income compared to the open field. At year one, the systems with negative net income are the high tunnel and one row caterpillar tunnel due to their high initial purchase and the high tunnel’s considerable building cost. However, these systems recover rapidly, with the one row caterpillar tunnel achieving a positive cumulative net income at year 2 and the high tunnel attaining positive net income at year 3. The open field falls behind the other management systems for a different reason; the factor most prominent in the lower yearly net income is the low productivity, therefore bringing low revenue to the farm.
It is encouraging to see that caterpillar tunnels are a financially viable alternative that require less initial investment compared to the considerable investment that high tunnels bring. This sizable investment can be a challenge for small vegetable farmers who may experience difficulty accessing credit. Another factor to consider is that the investment for the high tunnel needs to be done all in year one, but caterpillar tunnels can be purchased one at a time. Also, there is a higher risk for the farmer with the high tunnel in the case of destruction of the tunnel by a storm or a crop failure. This risk can be partially mitigated by the smaller investment of caterpillar tunnels.
- Selecting varieties for high tunnel or caterpillar production with excellent flavor and a sustained high fruit set early in the season and varieties with disease resistance, flavor and dual purpose use under field conditions.
At the end of the F5 generation, we have the lines listed in Table 6 remaining. In the end we were left with progeny from 7 of the original parents, with other families dropping out due to poor performance. The parents remaining in the crosses evaluated are described below, and the quality and production results in the high tunnel of the lines in Table 6 are presented in Table 7.
Defiant: F1 hybrid that has high resistance to late blight (resistance genes Ph-2 and Ph-3) and intermediate resistance to early blight. It also has high resistance to Fusarium wilt races 1, 2, late blight, and Verticillium wilt (Johnny’s Selected Seed, 2021)
OSA404: a cross between WI 55 and a disease-resistant North Carolina State inbred, selected by the Organic Seed Alliance for disease tolerance and flavor over several years. Received in 2014 as an advanced line and maintained by selfing.
A6: an Amish heirloom selected for Midwest adaptation by Craig Grau, a retired plant pathologist at UW Madison.
Japanese Black Trifele (JBT): crack-resistance heirloom with a smoky flavor maintained by Ken Greene at the Hudson Valley Seed Company
Crimson Sprinter: an heirloom from Ontario, CA with partial Septoria leaf spot resistance, earliness and good flavor.
Summer Sunrise: a cross between ‘Golden Dwarf Champion’ and ‘Green Giant’ in 2005 by Patrina Nuske Small. Released from the "Dwarf Tomato Project" in 2012 as a selection made by David, Susan, Neil Lockhart and Justin Morse, with additional help from Ted Maiden and Craig LeHoullier. Tart, sweet, intense flavor.
P321: breeding line from Jim Myers at Oregon State University as a cross between Indigo Rose and Ananas Noir, selected for larger size and excellent flavor. Contains the anthocyanin trait from Indigo Rose giving purple shoulders.
|
Table 6. Parental, market, and generation information of the breeding lines evaluated in this project. |
||||
|
Family name |
Female parental line |
Male parental line |
Generation |
Market |
|
A6JB-F5-34 |
A6 |
Japanese Black Trifele |
F5 |
Slicer |
|
A6JB-F5-35 |
A6 |
Japanese Black Trifele |
F5 |
Slicer |
|
JBDE-F5-28 |
Japanese Black Trifele |
Defiant |
F5 |
Slicer |
|
JBDE-F5-31 |
Japanese Black Trifele |
Defiant |
F5 |
Slicer |
|
JBDE-F5-32 |
Japanese Black Trifele |
Defiant |
F5 |
Slicer |
|
O4JB-F5-MV1-115 |
OSA 404 |
Japanese Black Trifele |
F5 |
Heirloom |
|
O4JB-F5-MV1-116 |
OSA 404 |
Japanese Black Trifele |
F5 |
Heirloom |
|
O4JB-F6-5 |
OSA 404 |
Japanese Black Trifele |
F6 |
Slicer |
|
CSDE-F6-46 |
Crimson Sprinter |
Defiant |
F6 |
Slicer |
|
CSDE-F6-47 |
Crimson Sprinter |
Defiant |
F6 |
Slicer |
|
O4DE-F5-43 3 |
OSA 404 |
Defiant |
F5 |
Slicer |
|
O4DE-F5-44 3 |
OSA 404 |
Defiant |
F5 |
Slicer |
|
P3SS-F4-61 |
P321 |
Summer Sunrise |
F4 |
Slicer |
|
O4A6-F4-MV1-109 |
OSA 404 |
A6 |
F4 |
Slicer |
Production traits
Marketable Weight
Breeding line had an effect on marketable weight (p-value < 0.001). Overall, the check varieties had a higher marketable yield than the breeding lines. There was strong evidence for interaction between variety and management (p-value < 0.001). The nature of the interaction was scalar. For the high tunnel, Caiman was the variety with the highest marketable yield, followed by the rest of the check varieties (Table 4). The best performing breeding line was CSDE-F6-46. For the open field management, Defiant had the highest marketable yield, followed by the JBDE-F5-28 breeding line. The highest yielding breeding lines in the high tunnel were, in decreasing order, CSDE-F6-46 (7.4 kg/plant), O4DE-F5-44 (7.1 kg/plant), and O4DE-F5-43 (7.0 kg/plant). The lowest yielding breeding lines in the high tunnel were, in increasing order, O4JB-F5-MV1-115 (1.6 kg/plant), P3SS-F4-61 (3.2 kg/plant), and O4JB-F5-MV1-116 (3.5 kg/plant). Interestingly, the top three varieties are descendants of Defiant, and two of the crosses are with OSA404. At the same time, two of the lowest yielding varieties are descendants of OSA404.
Marketable Count
Breeding line also had an effect on marketable count (p-value < 0.001). Overall, the check varieties had a higher marketable count than the breeding lines. There was strong evidence for interaction between variety and management (p-value < 0.001). However, the nature of the interaction was primarily scalar rather than crossover. The breeding lines with the highest marketable count in the high tunnel, in descending order, were JBDE-F5-31 (61 fruits/plant), and Defiant descendants CSDE-F6-46 (53 fruits/plant), and JBDE-F5-28 (49 fruits/plant). The breeding lines with the lowest marketable count in the high tunnel were O4JB-F5-MV1-115 (4 fruits/plant), O4JB-F5-MV1-116 (15 fruits/plant), and A6JB-F5-34 (15 fruits/plant).
Average weight
Breeding line had a significant effect on average weight (p-value < 0.001). There was strong evidence for interaction between variety and management (p-value <0.05). Average fruit weight ranged from 87g/fruit (JBDE-F5-31) to 365g/fruit (O4DE-F5-43). Both are descendants of Defiant, the first being a cross with the smaller-fruited Japanese Black Trifele, and the second with larger-fruited OSA 404. The breeding lines with the highest average fruit weight in the high tunnel were O4DE-F5-44 (381 g/fruit), O4DE-F5-43 (372 g/fruit), and O4JB-F6-5 (321 g/fruit). The breeding lines with the lowest fruit weight in the high tunnel were JBDE-F5-31 (87 g/fruit), P3SS-F4-61 (99 g/fruit), and JBDE-F5-28 (110 g/fruit).
Proportion unmarketable
The effect of breeding line on the proportion of unmarketable weight was significant (p-value <0.001). There was strong evidence of interaction between management and genotype for the unmarketable proportion (p-value <0.001). For the high tunnel, stem side cracking was the main reason for the primary cause of fruit unmarketability (47%), followed by radial splitting (16%), and hornworm damage (6%). Similarly for the field, stem side cracking accounted for 64% of the counts, followed by radial splitting (10%), and rodent damage (10%). Blossom end rot accounted for 1% of the unmarketable causes in the field, and 5% in the high tunnel. In the high tunnel, Defiant had the lowest proportion of unmarketable weight, followed by the breeding lines JBDE-F5-28, JBDE-F5-31, CSDE-F6-46, and CSDE-F6-47. The first two are a cross of Defiant with JBT and the last two a cross of Defiant with Crimson Sprinter. The primary causes of unmarketability in the high tunnel were blossom end rot (28%) and interior blemish (28%) for JBDE-F5-28, side stem crack (36%) and insect (27%) for JBDE-F5-31, stem crack (38%) and insect (19%) for CSDE-F6-46, and radial splitting (32%) and side stem crack (16%) for CSDE-F6-47.
|
Table 7. Least squared means of 22 tomato breeding lines and checks for each production trait for the high tunnel management system. |
|||||
|
Category |
Variety |
Marketable count (fruits/plant) |
Marketable weight (kg/plant) |
Fruit average weight (g/fruit) |
Proportional unmarketable weight |
|
Crosses |
A6JB-F5-34 |
15.4 |
5 |
313.5 |
0.4 |
|
|
A6JB-F5-35 |
17.2 |
4.6 |
298.7 |
0.4 |
|
|
JBDE-F5-28 |
48.9 |
5.3 |
109.9 |
0.1 |
|
|
JBDE-F5-31 |
60.9 |
5.3 |
87 |
0.1 |
|
|
JBDE-F5-32 |
21.2 |
5.3 |
263.6 |
0.4 |
|
|
O4JB-F5-MV1-115 |
4.2 |
1.6 |
143.7 |
0.7 |
|
|
O4JB-F5-MV1-116 |
14.9 |
3.5 |
241 |
0.6 |
|
|
O4JB-F6-5 |
20 |
6.5 |
320.7 |
0.3 |
|
|
CSDE-F6-46 |
53.4 |
7.4 |
139.2 |
0.1 |
|
|
CSDE-F6-47 |
46.4 |
6.3 |
136.1 |
0.2 |
|
|
O4DE-F5-43 |
20.2 |
7 |
372.3 |
0.4 |
|
|
O4DE-F5-44 |
19.5 |
7.1 |
380.8 |
0.3 |
|
|
P3SS-F4-61 |
33.7 |
3.2 |
99 |
0.6 |
|
|
O4A6-F4-MV1-109 |
28.5 |
5.6 |
197.7 |
0.4 |
|
Check varieties |
Big Beef |
40.6 |
10.7 |
257.7 |
0.2 |
|
|
Caiman |
46.4 |
11.4 |
245.5 |
0.1 |
|
|
Damsel |
30.4 |
6.8 |
218.9 |
0.3 |
|
|
Defiant |
76.8 |
8.6 |
107.9 |
0.1 |
|
|
Japanese Black Trifele |
50.7 |
8.1 |
150.9 |
0.3 |
|
|
JTO-1021 |
32.8 |
11.3 |
342.7 |
0.2 |
|
|
Paul Robeson |
13.4 |
3.4 |
249.5 |
0.6 |
|
|
Pruden's Purple |
22.7 |
7.7 |
333.9 |
0.4 |
|
Fishers LSD |
|
25 |
12.0635 |
38.86 |
30.35 |
|
Test of significance for main effect of genotype |
p-value |
<0.001 |
<0.001 |
<0.001 |
<0.001
|
Disease
In general we did not see substantial differences between breeding lines for disease incidence. This is likely due to extreme pressure in the field and low pressure in the high tunnel. For specific diseases, we did see some differentiation among lines. The lowest EBAUDPC scores were Defiant in the field and Paul Robeson in the high tunnel. Defiant's low Early blight score in the field is consistent with its history of breeding for intermediate EB resistance and high late blight resistance (Johnny’s Selected Seed, 2021). The breeding lines with the lowest EB scores in the high tunnel were JBDE-F5-28 O4DE-F5-43, and O4DE-F5-44. For the field, O4JB-F6-5, P3SS-F4-61, and JBDE-F5-31 had the lowest scores. The breeding lines with the lowest leaf mold score in the high tunnel were O4DE-F5-43, O4DE-F5-44, and JBDE F5-31. The severity of leaf mold was significantly higher in the high tunnel than in the field throughout the season.
Table 8 shows the means for each breeding family for each production and disease trait of the plants grown under the high tunnel management system. A6JB corresponds to the A6 by Japanese Black Trifele cross, CSDE to Crimson Sprinter by Defiant, JBDE to Japanese Black Trifele by Defiant, O4DE to OSA 404 by Defiant, O4JB to OSA 4040 by Japanese Black Trifele, and P3SS to P321 by Summer Sunrise.
|
Table 8. Family means of the production and disease traits of 22 tomato lines grown in 2020 under high tunnel management system at the West Madison Research Station. |
|||||||
|
Trait |
A6JB |
CSDE |
JBDE |
O4A6 |
O4DE |
O4JB |
P3SS |
|
Marketable weight |
4.83 |
6.86 |
5.31 |
5.58 |
7.05 |
3.85 |
3.17 |
|
Marketable count |
16 |
50 |
44 |
29 |
20 |
13 |
34 |
|
Average fruit count |
306 |
138 |
153 |
198 |
377 |
235 |
99 |
|
Prop Unmarketable weight |
0.37 |
0.13 |
0.16 |
0.40 |
0.30 |
0.52 |
0.57 |
|
Brix |
4.55 |
5.05 |
5.02 |
4.40 |
4.40 |
5.33 |
7.15 |
|
CA |
0.30 |
0.40 |
0.42 |
0.32 |
0.26 |
0.38 |
0.51 |
|
Early blight AUDPC |
614 |
751 |
553 |
700 |
516 |
973 |
641 |
|
Leaf mold AUDPC |
490 |
739 |
463 |
364 |
298 |
525 |
455 |
|
Powdery mildew AUDPC |
158 |
690 |
272 |
140 |
105 |
506 |
70 |
|
Septoria leaf mold AUDPC |
79 |
79 |
42 |
0 |
53 |
96 |
0 |
|
Total AUDPC |
1341 |
2258 |
1330 |
1204 |
971 |
2100 |
1166 |
|
AUDPC= Area Under the Disease Curve |
|||||||
Fruit quality
°Brix and Citric acid
In the fruit quality analysis, both °Brix and Citric Acid (%) showed significant evidence for the genotype effect (p-value <0.05). The breeding line P3SS-F4-61 had the highest °Brix value (7.15), and the highest CA% (0.51). Pruden’s Purple had the lowest °Brix value (4.13) and A6JB-F5-35 had the lowest CA% (0.23).
Sensory Analysis
Within the breeding lines, P3SS-F4-61 and O4JB-F5-MV1-115 stood out for particular attributes, and for the overall evaluation, P3SS-F4-61 had the highest score, followed by Damsel, and CSDE-F6-47 (Table 9)
|
Table 9. Least squared means for each Tasting attribute of the 22 tomato varieties grown under high tunnel management system. Scores range from 1 to 5 (See Appendix A for more details). |
||||||||
|
Variety |
Appearance |
Texture |
Sweetness |
Acidity |
Bitterness |
Umami |
Intensity |
Overall |
|
A6JB-F5-34 |
3.2 |
3.5 |
2.6 |
2.9 |
1.6 |
2.8 |
3 |
2.9 |
|
A6JB-F5-35 |
3.3 |
2.9 |
2.6 |
2.2 |
1.7 |
2.5 |
2.4 |
2.7 |
|
Big Beef |
4.3 |
3.2 |
3.3 |
2.8 |
1.7 |
2.6 |
3 |
3 |
|
Caiman |
3.8 |
3.8 |
2.9 |
3.1 |
1.7 |
2.6 |
3 |
3.2 |
|
CSDE-F6-46 |
4.1 |
3.5 |
2.3 |
2.1 |
1.8 |
2.2 |
2.4 |
2.6 |
|
CSDE-F6-47 |
4.1 |
3.8 |
3.2 |
3.2 |
1.7 |
2.9 |
3.4 |
3.4 |
|
Damsel |
4.4 |
3.9 |
3.6 |
3.1 |
1.8 |
3.3 |
3.9 |
3.9 |
|
Defiant |
3.8 |
3.3 |
2.6 |
4.2 |
1.6 |
2.7 |
4 |
3.2 |
|
Japanese Black T. |
3 |
3.4 |
2.9 |
2.6 |
1.6 |
2.8 |
3 |
3.6 |
|
JBDE-F5-28 |
3.5 |
3.3 |
3.1 |
2.4 |
1.8 |
2.7 |
2.9 |
3.2 |
|
JBDE-F5-31 |
3.9 |
3.3 |
2.7 |
2.8 |
1.8 |
2.7 |
3.1 |
2.9 |
|
JBDE-F5-32 |
3.1 |
3.3 |
3 |
2.5 |
1.6 |
2.7 |
2.8 |
2.9 |
|
JTO-1021 |
3.6 |
3.1 |
2.9 |
2.8 |
1.6 |
2.6 |
3.1 |
3.3 |
|
O4A6-F4-MV1-109 |
2.8 |
3 |
2.8 |
2.6 |
1.7 |
2.7 |
3 |
3 |
|
O4DE-F5-44` |
3 |
2.4 |
2.2 |
2 |
1.7 |
1.9 |
2 |
2.5 |
|
O4JB-F5-MV1-115 |
3.6 |
3 |
3.1 |
3.3 |
1.8 |
3.4 |
3.5 |
3.2 |
|
O4JB-F5-MV1-116 |
3.6 |
2.2 |
2.3 |
2.7 |
1.9 |
2.7 |
2.8 |
2.4 |
|
O4JB-F6-5 |
4.2 |
2.8 |
3 |
2.5 |
1.5 |
2.6 |
2.7 |
3.1 |
|
P3SS-F4-61 |
4.2 |
3.8 |
3.5 |
2.8 |
1.5 |
3.2 |
3.6 |
4.2 |
|
Paul Robeson |
3 |
2.7 |
2.8 |
2.7 |
1.8 |
2.8 |
3 |
2.8 |
|
Pruden's Purple |
3 |
3 |
3 |
3.4 |
1.5 |
3 |
3.4 |
3.3 |
|
All traits have a range from 1 to 5. |
||||||||
Correlation among traits
Table 10 shows the phenotypic correlations among 4 production traits and 5 disease traits for the breeding lines. Marketable weight shows a strong positive correlation with the marketable count, resistance to early blight and proportion unmarketable.
|
Table 10. Pearson’s correlation of production traits of 22 tomato varieties grown in a high tunnel system in 2020. |
||||||||
|
Trait |
Marketable weight |
Marketable count |
Average weight |
Proportional unmarketable |
Early blight |
Leaf mold |
Powdery mildew |
Septoria leaf spot |
|
Marketable count |
0.58+ |
|
|
|
|
|
|
|
|
Average weight |
0.24 |
-0.59* |
|
|
|
|
|
|
|
propUMwt |
-0.88*** |
-0.85*** |
0.18 |
|
|
|
|
|
|
Early blight |
-0.67** |
-0.5+ |
-0.11 |
0.67* |
|
|
|
|
|
Leaf mold |
0.18 |
0.03 |
-0.07 |
-0.15 |
0.19 |
|
|
|
|
Powdery mildew |
-0.19 |
-0.04 |
-0.26 |
0.02 |
0.37 |
0.25 |
|
|
|
Septoria leaf spot |
0.25 |
0.02 |
0.26 |
-0.13 |
0.02 |
0.24 |
-0.32 |
|
|
Total disease |
-0.37 |
-0.28 |
-0.18 |
0.31 |
0.79 |
0.58 |
0.74*** |
0.07 |
|
propUMwt, proportional unmarketable weight P-value≤ 0.10=+, *P-value≤ 0.05, **P-value≤ 0.01, ***P-value≤ 0.001. |
||||||||
Table 11 shows the phenotypic correlations between the fruit quality traits and marketable weight. Marketable weight shows a high negative correlation with fruit acidity, umami, and intensity. Titratable acidity is positively correlated with fruit acidity (tasting), and °Brix is also highly positively correlated with the sweetness perceived by the tasters. CA and °Brix have a high positive correlation (0.87). CA is also positively correlated to Texture, Sweetness, Acidity, Umami, Intensity, and Overall. Marketable weight has a negative correlation with all the flavor components.
|
Table 11. Pearson’s correlation for marketable weight and fruit quality of tomato varieties grown in a high tunnel system. |
||||||||||
|
Trait |
Mkt wt |
CA |
°Brix |
Appearance |
Texture |
Sweetness |
Acidity |
Bitterness |
Umami |
Intensity |
|
CA |
-0.36 |
|
|
|
|
|
|
|
|
|
|
°Brix |
-0.59* |
0.87*** |
|
|
|
|
|
|
|
|
|
Appearance1 |
0.06 |
0.60* |
0.55+ |
|
|
|
|
|
|
|
|
Texture1 |
0.11 |
0.59* |
0.38 |
0.40 |
|
|
|
|
|
|
|
Sweetness1 |
-0.37 |
0.66* |
0.68* |
0.38 |
0.56+ |
|
|
|
|
|
|
Acidity1 |
-0.63* |
0.72** |
0.59* |
0.28 |
0.43 |
0.63* |
|
|
|
|
|
Bitterness1 |
-0.02 |
-0.09 |
-0.26 |
-0.16 |
-0.27 |
-0.41 |
-0.05 |
|
|
|
|
Umami1 |
-0.8*** |
0.66* |
0.68** |
0.18 |
0.39 |
0.75*** |
0.88*** |
-0.13 |
|
|
|
Intensity1 |
-0.6* |
0.83*** |
0.72** |
0.33 |
0.57** |
0.80*** |
0.92*** |
-0.14 |
0.93*** |
|
|
Overall1 |
-0.35 |
0.71** |
0.78*** |
0.42 |
0.66** |
0.93*** |
0.55*** |
-0.55+ |
0.70** |
0.76*** |
|
Mkt wt, marketable weight. Appear, appearance. 1Traits evaluated through tastings. P-value≤ 0.10=+, *P-value≤ 0.05, **P-value≤ 0.01, ***P-value≤ 0.001. |
||||||||||
On-farm evaluation
Participating farms received 6 breeding lines from different families to try in their farming systems. All the varieties evaluated on-farm were grown in high tunnels. At the end of the season, each farmer submitted a qualitative evaluation form that indicated which varieties they preferred with respect to productivity and flavor along with any other relevant observations. Table 12 presents a summary of all the evaluations received from 2019 and 2020. Is important to note that not all participants received the same breeding families, and overall, the summary includes the evaluations of 2 or 3 farms per cross.
The CSDE family had high productivity with good flavor, for some farmers it was the “winner” in terms of flavor compared to the rest of the lines. One farmer mentioned that ripening started late compared to their commercial varieties but did not specify how late (days or weeks). O4JB had high yields and great flavor and was categorized as the best overall. In terms of earliness, it was between Damsel (earliest) and Caiman (a little later than Damsel). JBDE had great flavor, and productivity varied from medium to high. A6JB was identified as a typical heirloom with a very sweet and good flavor. It had low disease resistance and low productivity. O4A6 had medium disease resistance, good flavor, and productivity ranged from low to high. Farmers also indicated that higher amounts of radial splitting and cracking, and it must be sold soon after harvesting due to its soft skin.
|
Table 12. Summary of on-farm evaluations of breeding lines grown in a hoop house or high tunnel during 2019 and 2020. JBT: Japanese Black Trifele. |
|||||
|
Family |
General characteristics |
Flavor |
Productivity |
Fruit size |
Other comments |
|
Crimson Sprinter x Defiant (CSDE) |
Competitive with weeds, healthy |
Good acid/sweet balance, tough skin. Best of all. |
High - moderate |
Medium |
Late |
|
OSA404 x JBT (O4JB) |
Not as big as CSDE, but still a good size. Great disease resistance to Early blight. Later than Damsel and later than Caiman. |
Good, sweet flavor. Heirloom look. Nice and tasty. |
High - good |
Some medium, some Big Beef size |
Short harvest. Best overall. Yields higher at the beginning of the season |
|
JBT x Defiant (JBDE) |
Healthy plants |
Very tasty, sweet flavor. Tough skin. |
Moderate, not a lot. Very productive for another farm. |
Medium |
|
|
A6 x JBT (A6JB) |
Typical heirloom. Not good disease resistance. Prone to rot. |
Sweet, good flavor |
Not a lot of fruit |
Big, heirloom type |
A lot of variability in fruits, some nice purples. Soft fruit. |
|
OSA404 x A6 (O4A6) |
Decent leaf disease resistance. |
Very sweet |
Low – high (varied from farm to farm and year) |
Medium |
Took a long time to ripen. Soft fruit. Radial cracking and green shoulders. |
Discussion
Performance of field selections was disappointing in terms of disease resistance, and we do not expect to release varieties from this particular set of crosses, but we are using the populations created to study field disease resistance as part of two successful grant applications which were funded. It is likely that with the severe septoria and early blight pressure in the midwest, we will need to incorporate stronger qualitative resistance alleles in addition to the quantitative resistance we were hoping to select for. We are continuing this work as part of an OREI-funded project led by Purdue University and a Wisconsin Organic Initiative grant that will fund a PhD student.
In the high tunnel results are much more promising. The best lines are nearly stable and will be tested for on-farm performance as part of our Wisconsin Organic Initiative grant and a different OREI-funded project led by Oregon State University. In addition, we will be working with independent plant breeders in the Upper Midwest to build on this work as part of a third OREI-funded project that we are leading in collaboration with SeedLinked and Organic Seed Alliance.
Promising breeding lines
Based on the results of our evaluations for production, disease, and fruit quality traits, we have chosen several breeding lines for further field evaluation.
CSDE-F6-46 had the highest marketable weight (7.4 kg/plant) of all the breeding lines. The average weight of the medium-sized, round fruit was 139g. It had a low proportion of unmarketable weight (0.1), and the primary cause of unmarketability was stem side crack. Its early blight AUDPC was close to the overall mean of only the breeding lines in the high tunnel (791 and 751 respectively). It was not particularly affected by any of the rest of the diseases evaluated. In terms of the sensory evaluation, it had a low Overall score (2.6), low Intensity (2.4), and high Appearance (4.1).
In the same breeding family, the line CSDE-F6-46 had a lower marketable weight (6.3 kg/plant), a slightly higher unmarketable proportional weight (0.18). It had a similar Total disease AUDPC to CSDE-F6-46 (no significant difference). On the other hand, this variety did well in the sensory evaluation. It had the second-best score in the Overall category (3.4), a high intensity (3.4), and high Acidity and Sweetness (3.2 both). It also had high CA (%) (0.45), and intermediate °Brix (5.4). This line could be further selected, considering that the expected response to selection increases yields to 1.45 kg/plant keeping close attention to the flavor evolution, since yield and flavor are negatively correlated. It is also important to note that farmers liked this family and found it to be productive with good flavor.
JBDE-F5-31 and JBDE-F5-28 both had intermediate marketable weight (5.3 kg/plant for both, no significant difference). The average fruit weight was low (87 and 108 g/fruit respectively), resulting in a medium-sized fruit. Both had a low unmarketable proportion (0.08 and 0.09), with the primary cause for unmarketability being stem side cracking, which is common in Japanese Black Trifele, one of the parental lines. In terms of flavor, JBDE-F5-28 did better Overall (3.2), with high Intensity (3.1), Sweetness (3.1), and low Acidity (2.4). This family was liked by farmers because of the medium to high yields, the sweet flavor, and the overall good health of the plants. However, testers commented that the skin of both lines was too thick.
P3SS-F4-61 had the best Overall flavor score, with high acidity, sweetness, intensity, and umami. In terms of production, it had a low marketable weight in the high tunnel (3.1 kg/plant) compared to the rest of the slicer breeding lines (overall mean 5.3 kg/plant). The marketable weight variance was high, and this trait also had a high heritability, so there is room for yield increase when selecting future generations. Average fruit weight had a high variability within plants, with a confidence interval from 58 to 140 g. Because this is an F4, uniformity has not yet been achieved, and that has been made clear with fruit size variation. The proportion of unmarketable weight was high (0.58), and the primary cause of unmarketability was radial splitting (85%). Better irrigation management at the time of fruit ripening could help decrease the amount of unmarketable fruit, and at the same time increase the marketable weight. In terms of disease, it had scores close to the mean in all the diseases evaluated and did not show high susceptibility or resistance to any of them.
Comparing high tunnel, caterpillar tunnel and field production
After three years of on-station trials at Spooner and West Madison, results showed that caterpillar tunnel and high tunnel had overall better productivity compared to the open field, due to having higher marketable fruit weight, and smaller proportion of unmarketable fruit. There were no significant differences between the caterpillar tunnel and the high tunnel in terms of productivity. These results were consistent across locations and years. Both tunnels showed a lower incidence in diseases compared to the open field and difference in the kind of diseases present but the composition of diseases was different. While leaf mold was higher in the tunnels, SLS was higher in the open field.
Quality evaluations showed that fruit in both tunnels had higher ˚Brix levels and lower citric acid levels, indicating that tomatoes in the tunnels have in general better flavor compared to the open field. These results were aligned with the results from the flavor evaluation we performed with multiple tastings. These results were very similar to the information we obtained from our on-farm trials in terms of productivity, disease resistance and quality.
With comparable productivity between caterpillar tunnel and high tunnel, caterpillar tunnels require a significantly smaller initial investment compared to high tunnels, due to lower purchase and installation costs. This allows farmers to lower the risks due to smaller initial investments. Also, caterpillar tunnels can be purchased gradually, with a partial investment over the years. Another benefits of caterpillar tunnels are that they are mobile, easier and faster to assemble, allowing farmers to follow rotations and move them every year, permitting to grow tomatoes every season.
Future research on the effectiveness of caterpillar tunnels could include more detailed environmental monitoring to more accurately describe the differences in temperatures between high tunnels and caterpillar tunnels. In addition, testing should be done of the two-row production system in caterpillar tunnels to determine if there are any effects of increasing plant density on production or disease incidence of the system. As this study worked with a limited number of varieties, it would be helpful to test a broader range of varieties which have been selected for resistance to the important diseases in each system. This would help establish whether varieties selected for these specific disease resistance traits might show crossover interactions in performance between systems. Further on-farm research with varieties chosen by farmers for performance in their location and markets would help determine whether the results we have seen here can be generalized to a broader geographic region.
Selecting varieties for high tunnel or caterpillar production with excellent flavor and a sustained high fruit set early in the season and varieties with disease resistance, flavor and dual purpose use under field conditions.
The objective of this project is to develop tomato varieties that produce high-yielding varieties with excellent flavor, good disease resistance, and that are suitable for organic farming systems. We evaluated production, disease, and fruit quality traits in 22 tomato breeding lines and commercial varieties. The genotype component had a significant effect on all the production traits, early blight and leaf mold. It was also significant in all the fruit quality traits besides bitterness, including CA and °Brix. The productivity (marketable weight, fruit count, average fruit weight) of the breeding lines was lower than the check varieties, but the genetic variance and heritability were both high. This indicates room for improvement in these traits, although with the caveat that these calculations are based on a single location and a single year.
The negative correlation between marketable weight and the fruit quality traits will be a limitation for future selections. Selecting for higher yields could cause a decrease in fruit quality because the correlated response for Acidity and °Brix were negative. Similarly, the correlated response for Overall flavor, Intensity, Sweetness, and Acidity, are all negative. °Brix and CA (%) can be good predictors of flavor since both traits are highly correlated with Intensity and the Overall perception of the fruit.
P3SS-F4-61 shows great promise, with great flavor, medium yields, and low disease incidence. The fruit size variation between plants made it clear that uniformity has not been achieved, so future selections should consider optimal size, individual productivity, unmarketable proportion, and actual marketability (likelihood of the farmer selling harvest). Yield could be improved, though not at the expense of fruit quality.
The CSDE family was also promising. It has high yields and low unmarketable proportion yet did not have an outstanding flavor. Further selection could evaluate the yield effects of fruit quality improvements.
Next steps for this project include trialing lines with in more locations to determine if they should be released. Promising lines could also become parental line material for future breeding programs. We are also pursuing new crosses to breeding lines with stronger single-gene resistance to early blight and septoria. While some sources of these resistance genes have very poor flavor, newer sources have been developed more recently that incorporate stronger resistance and better flavor and may be promising additions to the breeding program. Because on-farm trials will play an essential role in adapting these breeding lines to organic systems, we will expand our network of on-farm collaborations while working more closely with currently participating farms to further refine the participatory process.
Project Activities
Educational & Outreach Activities
Participation summary:
Our outreach program consists of two to three annual field days, three winter workshops, presentations at 4 to 6 regional conferences and one extension bulletin presenting trial results. Our largest field day will be held annually at the West Madison Agricultural Research Station, the primary site of our trialing and breeding work. Farmers will be invited to walk the fields with local chefs, seed company representatives, and project personnel, learning about how potential varieties perform in hoop house, field and low-cost mobile season extension systems. These field days will involve presentations from project personnel and hoop house/ caterpillar tunnel experts, tasting breeding lines and trial varieties, and well is time for participants to network and share experiences with each other. Additional field days will be held on participating farms in Northern, WI and Milwaukee (at a different farm each year). Though the public will be welcome to attend these field days, the target audience will be local direct-market farmers and programming will be tailored accordingly.
In each year of the project we will host a winter workshop in Madison, WI. We already host annual winter meetings as part of the Seed to Kitchen Collaborative, and would expand these meetings into educational events allowing farmers to reflect on trials collaboratively, learn about the previous season’s trial results, and participate in shaping plans for the future.
In addition to hosting field days and winter workshops, we will publish an extension bulletin in the final year of the project, summarizing trial results and translating findings into useable information for direct-market tomato growers. Final results will also be presented at fresh market and organic vegetable grower conferences in the North Central Region after the third growing season
Learning Outcomes
- Tomato season extension techniques
- Tomato breeding
Project Outcomes
Adoption of caterpillar tunnels
Participation in tomato breeding