Final report for LNC18-411
Project Information
Integrating cover crops (CC) into dryland crop production in the semiarid central Great Plains (CGP) can provide several benefits. This includes reduced soil erosion, improved nutrient cycling, suppression of herbicide resistant (HR) weeds, enhanced crop profitability and improved soil health. Despite these benefits and grower interest in using CC to improved soil health and suppress HR weeds, CC adoption is slow and not widely popular in the CGP because CC utilizes water that otherwise would be available to the subsequent cash crop. Grazing or haying CC can provide economic benefits to offset revenue loss associated with decreased crop yields when CC are grown ahead of a cash crop. This approach could provide an opportunity for dryland producers to build soil health and produce harvestable forage for the region’s livestock. Limited information exists on impacts of utilizing CC for forage on soil health and crop yields in semiarid dryland (non-irrigated) systems. This research and education project was conducted to the fill the critical knowledge gap and provided immediate information needed to address producer questions on sustainable use of CC for forage while maintaining soil health in our semi-arid dryland environment. Field experiments were conducted both on-farm and Kansas State University experimental farms (near Brownell and Garden City) from 2018 to 2022 to investigate forage production potential, water use, weed suppression and cash crop yield penalties associated with growing CC in place of chem-fallow. Treatments at university farms consisted of oats (Avena sativa L.)/triticale (×Triticosecale Wittm.) CCs grown in place of fallow, which were hayed, grazed by yearling heifers, or left standing. Additionally, a flex-cover crop treatment was included where a CC was planted only when soil water content was adequate, and the precipitation outlook was favorable. The on-farm study evaluated effects of grazing CCs on soil bulk density, aggregate stability, and soil chemical properties on three producer fields with paired grazed and non-grazed CCs from 2018 to 2021. Results showed CC productivity varied from year to year. For example, at K-State HB ranch near Brownell, KS, non-grazed CC biomass ranged from 1900 lb/a in 2020 to 3280 lb/a in 2018. Averaged across the study years (2018 to 2022), hayed and grazed CCs removed 63 and 32% of available CC biomass. Across seven on-farm site-years, CC residue after grazing averaged 2210 lb/a compared to 3475 lb/for the non-grazed CCs, representing a 36% decrease in CC biomass with grazing. Grazing days across farms ranged from 25 to 54 days with an average daily gain of 1.2 to 3.11 lb per day. Cover biomass after grazing were not different from biomass measured before grazing, suggesting significant regrowth from the cool season CCs species used in the study. Growing a CC decreased weed biomass by 70 to 98% compared to fallow. Cover crops reduced winter wheat yields compared to fallow in 2- out of 5-years. However, wheat yields were not different among treatments when averaged across the 5-yrs at Brownell, KS. Bulk density, penetration resistance, aggregate size distribution, and mean weight diameter (MWD) of water stable aggregates were not different between grazed and non-graze CCs. Soil pH, soil organic carbon (SOC), nitrate, and phosphorus concentrations did not differ between grazed and non-grazed CCs. Cover crops tended to increase SOC concentration compared to fallow or initial SOC concentration in some site-years. For example, SOC measured at the surface 0 to 2-inch depth near Hays, KS in spring 2019 was 1.4%, which was significantly less than 2.1% SOC measured in 2021 after two cycles of grazing CCs at this location. Penetration resistance measured after grazing in 2021 averaged 0.36 and 0.34 MPa for the grazed and non-grazed CCs at Marquette, KS. Similarly, penetration resistance averaged 0.52 MPa with grazed and non-grazed CCs at Alexander, KS. The penetration resistance measured across locations and CC management strategies was below the threshold of 2 MPa that will limit root growth. Furthermore, flex-hayed CCs maintained winter wheat yields and significantly increased residue cover and MWD of water stable aggregates compared to fallow. Findings of this research showed CCs can be grazed or hayed in no-tillage (NT) dryland cropping systems with no negative effects on soil properties, wheat and grain sorghum yields compared to standing CCs or fallow. Therefore, grazing of CCs enrolled in National Resource Conservation Service (NRCS) cost-share programs may be a management strategy for farmers to integrate CCs in dryland cropping systems to balance profitability, increase CC adoption and improve soil health in water-limited production systems. Results of this project provided timely information to western Kansas farmers integrating CCs to grain-based production systems to increase profitability and soil health. Results were shared through four field days at near Brownell and Garden City, KS (> 350 participants), at two on-farm field days (>150 participants). Results were also shared through ten media interviews and 20 research and extension reports (> 3500 downloads New Prairie Press).
- Determine forage production potential of cover crops in dryland systems.
- Quantify impacts of removing cover crops for forage on weed suppression, crop yields and soil health
- Conduct on-farm research to quantify the impacts of grazing cover crops on weeds, crop yields, soil health and profitability in dryland systems.
Dryland (non-irrigated) crop production in semiarid environments in the CGP is limited by soil water availability. Due to water limitations, winter wheat-fallow or winter wheat-summer crop (corn, grain sorghum, or sunflower)-fallow are dominant crop production systems in the region (Peterson et al., 1998; Nielsen and Vigil, 2018). The 12 to 14-month fallow period within the rotation was introduced to store soil water for the subsequent crop (Nielsen and Vigil, 2010). Fallow stabilize cash crop yields and prevent crop failure, particularly in drier years. However, precipitation storage during fallow is very inefficient, ranging from 17 to 45% in the region (Peterson and Westfall, 2004). Limited soil cover during fallow can contribute to wind erosion even in fields under long-term no-till (NT) management. This situation causes depletion in soil organic matter (SOM), declining soil fertility, soil erosion and inefficient water storage. Intensifying cropping systems in the CGP offers great potential to improve soil health, precipitation use efficiency, and enhance the productivity and profitability of dryland farming operations.
Growing CCs in place of summer-fallow has potential to improve soil health and also diversify dryland crop production in CGP. The ability of CCs to reduce wind erosion is particularly important in semiarid dryland crop production systems because residue levels are very low, predisposing fallow fields to wind erosion. Producer interest in using CC to improve soil health (improvements in SOM, water infiltration, microbial activity, and nutrient availability) have increased in the semiarid CGP regions. Grower enthusiasm of CCs and soil health in dryland NT crop production was captured in a recently held soil health workshop (http://soilhealthu.net/) organized by the High Plains Journal in Salina, KS. The topmost reasons for growing CCs among western Kansas producers are 1) improving soil health, 2) grazing opportunities for cattle, and 3) the economic cost of managing HR weeds in NT. Despite this interest, information is limited on best management options for CCs in dryland systems and producers are asking questions on best CC mixtures and planting windows for integrating CCs into cropping systems in our climate.
Several CC crop projects funded by SARE showed CC provides readily available carbon and N sources that improve soil microbial communities, accumulation of SOM and nutrient cycling (Salzer et al., 2014; Flesch, 2016; Wick et al, 2015; Narayanan et al., 2018). The increased biological activity associated with CC carbon inputs and rooting activity can improve soil aggregation and enhance water infiltration. However, most of these studies we conducted in relatively wetter regions compared to the semiarid climate of the CGP. Our research efforts in southwest Kansas showed replacing fallow with a CC increased SOM content, increase wet aggregate stability, and reduced runoff and wind erodible soil fraction (Blanco-Canqui et al., 2013). This results indicates CCs in semiarid regions can achieve soil health improvements similar to those reported in more humid regions despite limited water availability coupled with greater evaporative demand.
Cover crops in dryland crop rotations can suppress weeds and provide a significant weed management option for HR weeds in NT systems. Currently, the use of CC to suppress weeds is gaining popularity among dryland producers because of HR weeds. Eight out of ten growers attending our CC extension events expressed interest in learning more about utilizing CC to manage weeds. This is expected because repeated glyphosate applications has resulted in the development of glyphosate resistance in several weed species in dryland NT fields across Kansas. For instance, glyphosate-resistant (GR) kochia (Kochia scoparia L.), Palmer amaranth (Amarathus palmeri S. Watson), horseweed [Conyza canadensis (L.)], and Russian-thistle (Salsola tragus) biotypes have recently been reported from NT fallow production systems across the US Great Plains (Heap, 2018). The severity of these weed problems in dryland production systems of the CGP is exacerbated by the widespread occurrence of HR weed biotypes, presenting a great challenge to NT crop production in this region. Using CC to control these weeds instead of tillage would preserve the gains made in conservation tillage over the past two decades. Growing CCs will reduce herbicide application rates and frequencies (Derksen et al., 2002), decreasing weed selection pressure and the chances of weeds developing resistance to different herbicide modes of action.
Notwithstanding these benefits, CC adoption in dryland crop production in the CGP has been slow and few producers have included CCs in their production systems. A major reason is because CC utilize soil water and tend to reduce yields of subsequent crops compared to chem-fallow. Previous studies conducted in the CGP reported increase water use and decreases in wheat yields when fallow is replaced with a CC (Schlegel and Havlin, 1997; Nielson and Vigil, 2005; Holman et al, 2018). In southwest Kansas (annual precipitation of 450 mm), growing annual forage or CC during the fallow period reduced subsequent wheat yields in dry years, but had little effect on wheat yields in wet years (Holman et al, 2018). The authors reported every 125 kg ha−1 of CC or forage biomass grown, plant available water at winter wheat planting was reduced by 1 mm, which decreased the subsequent wheat crop yield by 5.5 kg ha−1. Similarly, studies in northeastern Colorado (400 mm annual precipitation) have shown a direct negative relationship between CC water use during the fallow period and the subsequent wheat yields (Nielson et al., 2015). These findings are in contrast to other studies that demonstrated growing CC had no impacts on soil water depletions and yield benefits to subsequent crops (Lenssen et al., 2013; Baxter and West, 2015; Herbert et al., 2016). This disparity is mostly due to low precipitation amounts and greater evaporative demand in the CGP region.
Developing climate-specific CC management options for dryland farmers will improve adoption and CC use in the CGP. We investigated a flex- cover cropping option where CCs are grown only in years when there is adequate soil moisture or using CC for forage to reduce the negative impact of CC on cash crop yields. Flex-fallow is the concept of only planting forage or CC when soil moisture levels are adequate and the precipitation outlook is favorable. Under drought conditions, implementing flex-fallow should help minimize negative impacts in dry years. Our approach of utilizing CCs for forage (either haying or grazing) can provide economic benefits to offset revenue loss associated with decreased crop yields when CC are grown ahead of a cash crop. Our previous research showed most of the plant species planted as CC have excellent forage attributes in terms of dry matter (DM) production and forage nutritive value (Obour and Holman, 2016; Holman, et al. 2018). Due to significant regrowth potential of grass CC species, hayed or grazed CC can be allowed to regrow to provide increased residue cover compared to fallow. Opportunity exist for dual-purpose use of CCs in dryland cropping systems to provide forage and residue cover to reduce erosion and build soil health. Such cropping systems can take advantage of any additional moisture received during wet years to provide supplemental forage for the region’s livestock industry.
Producers experimenting with CCs in semiarid environments in the CGP sometimes graze CCs to maintain profitability and also justify the use of valuable soil water utilized by CC in place of chem-fallow. Very limited information regarding the effects of grazing on the soil health benefits of CC and the best practices for integrating CC in the CGP. Our study will complement recent SARE funded projects (Walker and Miller, 2016; Ragen and Benson, 2017) investigating livestock grazing of CC impacts on soil properties in Montana. Grazing CC could provide additional tool for managing HR weed populations. Many annual weeds, including kochia, are palatable and nutritious for livestock (Moyer and Hironaka,1993) and will be readily grazed with a forage CC. Grazing animals can consume HR weeds directly reducing the weed seed bank. Few studies have quantified the effect of managed CC grazing on weed communities within a cropping system, and most research has focused on grazing for weed control in regions that are warmer and wetter than the CGP (Hilimire, 2011). Results for dryland cropping systems have been mixed. For instance, integrating sheep grazing into annual hay crop-fallow-spring wheat rotation system in southwestern Montana resulted in a significant increase in weed pressure and accompanying yield reductions of 51% compared to conventional management with herbicides and tillage (Miller et al. 2015). More research is therefore needed to effectively manage weeds in these integrated crop-livestock systems, quantify grazing effects of CC on weed suppression, crop yields, and soil health in dryland systems. This producer driven project is aimed at providing critical and immediate information needed to address producer questions on when and what CC species to plant for maximum weed suppression and soil health benefits. There is also potential that grazing CC can increase soil compaction and degrade soil structure, a common constrain to grazing as an option for CCs in dryland systems. However, there is paucity of data to support this concern. It is plausible that alternate freeze and thawing events in the CGP could eliminate soil surface compaction due to CC grazing. Successful completion of this project will fill these knowledge gaps by rigorously assessing the soil health impacts of grazed and non-grazed CCs on producer fields and identify strategies for increasing the adoption of CCs as conservation practice on dryland production acreage in the CGP region.
References
Baxter, L., and C. West. 2015. SARE GS15-152.
Blanco-Canqui, H., J.D. Holman, A.J. Schlegel, J. Tatarko, and T.M. Shaver. 2013. Soil Science Society of America Journal 77:1026-1034.
Derksen, D.A., R.L. Anderson, R.E. Blackshaw, and B. Maxwell. 2002. Agronomy journal 94:174-185.
Flesch, V.D. 2016. SARE FNC16-1063.
Heap, I. 2018. http://www.weedscience.com.
Herbert, S., W. Beiser, T. Cotter, M. Ditterson, M. Elsen, C. Hansen. 2016. SARE ONC16-015.
Hilimire, K. 2011. Journal of Sustainable Agriculture 35:376-393.
Holman, J.D., K. Arnet, J. Dille, S. Maxwell, A.K. Obour, T. Roberts, K. Roozeboom, and A. Schlegel. 2017. Crop Science 58:1–13.
Lenssen, A., S. Carlson, M. Wiedenhoeft. 2013. SARE LNC13-352.
Mailapalli, D.R., W.R. Horwath, W.W Wallender, and M. Burger. 2011. Journal of Irrigation and Drainage Engineering 138:35-42.
Miller, Z.J., F.D. Menalled, U.M. Sainju, A.W. Lenssen, P.G. Hatfield. 2015. Agronomy. Journal 107:104-112.
Moyer, J., and R. Hironaka. 1993. Canadian journal of Plant Science 73:1305-1308.
Narayanan, S., G. Zehnder, N. Tharayil, D. Millam, and C. Talley. 2018. SARE OS18-118.
Nielsen, D.C., and M.F. Vigil. 2018. Agronomy journal 110:1–8.
Nielsen, D.C., D.J. Lyon, G.W. Hergert, R.K. Higgins, F.J. Calderón, and M.F. Vigil. 2015. Agronomy journal 107: 1025-1038.
Nielsen, D.C., and M.F. Vigil. 2010. Agronomy journal 102:537-543.
Nielsen, D.C., and M.F. Vigil. 2005. Agronomy journal 97:684-689.
Obour, A.K., and J.D. Holman. 2016. ASA-CSSA-SSSA International Annual Meeting, Nov. 6 9, 2016. Phoenix, AZ. In ASA-CSSA-SSSA Abstracts 2016 [CD-ROM]. ASA, CSSA, and SSSA, Madison, WI.
Peterson, G.A, A.D. Halvorson, J.L. Havlin, O.R. Jones, D.G. Lyon, and D.L. Tanaka. 1998. Soil &Tillage Research 47:207-218.
Peterson, G.A., and D.G. Westfall. 2004. Annals of Appl. Biol. 144:127-138
Ragen, D., and T. Benson. 2017. SARE report SW17-080.
Salzer, T., A. Mach, C. Anderson, S. Peterson. 2014. SARE FNC14-974.
Schlegel, A.J., and J.L. Havlin. 1997. Green fallow for the central Great Plains. Agronomy journal 89:762-767.
Walker, R, and P. Miller, 2016. SARE GW16-053.
Wich, A., D. Toussaint, T. Wehlander, D. Mueller. 2015. SARE ONC15-012
Cooperators
- (Educator and Researcher)
- (Researcher)
- (Researcher)
- (Educator and Researcher)
Research
Research hypotheses
- Integrating livestock by grazing cover crops will increase profitability of dryland crop production systems.
- Growing cover crops will reduce soil susceptibility to wind and water erosion, increase soil organic matter and improved soil physical properties compared to summer fallow.
- Utilizing cover crops for forage will not lead to sustained soil compaction due to trampling, but could lead to improved nutrient cycling and soil health compared to summer fallow systems.
- Growing cover crops could reduce herbicide resistant weed population in dryland crop production.
- On-farm research to quantify the impacts of grazing cover crops on weeds, crop yields, soil health and profitability in dryland systems
Producer cooperators and principal investigators held a meeting at Kansas State University Agricultural Research center near Hays, KS on February 7, 2019 to discuss on farm project design and cover crop specie selection. The group agreed that CCs be planted in the fallow phase after wheat or grain sorghum in a wheat-sorghum (corn)-fallow rotation sequence. Producers had the option to plant a spring CC and graze in the summer or plant a post-wheat CC grazing in the fall through winter. The on-farm study compared two treatments, grazed and non-grazed CCs.
Experiment at Alexander, KS (2019 to 2021):
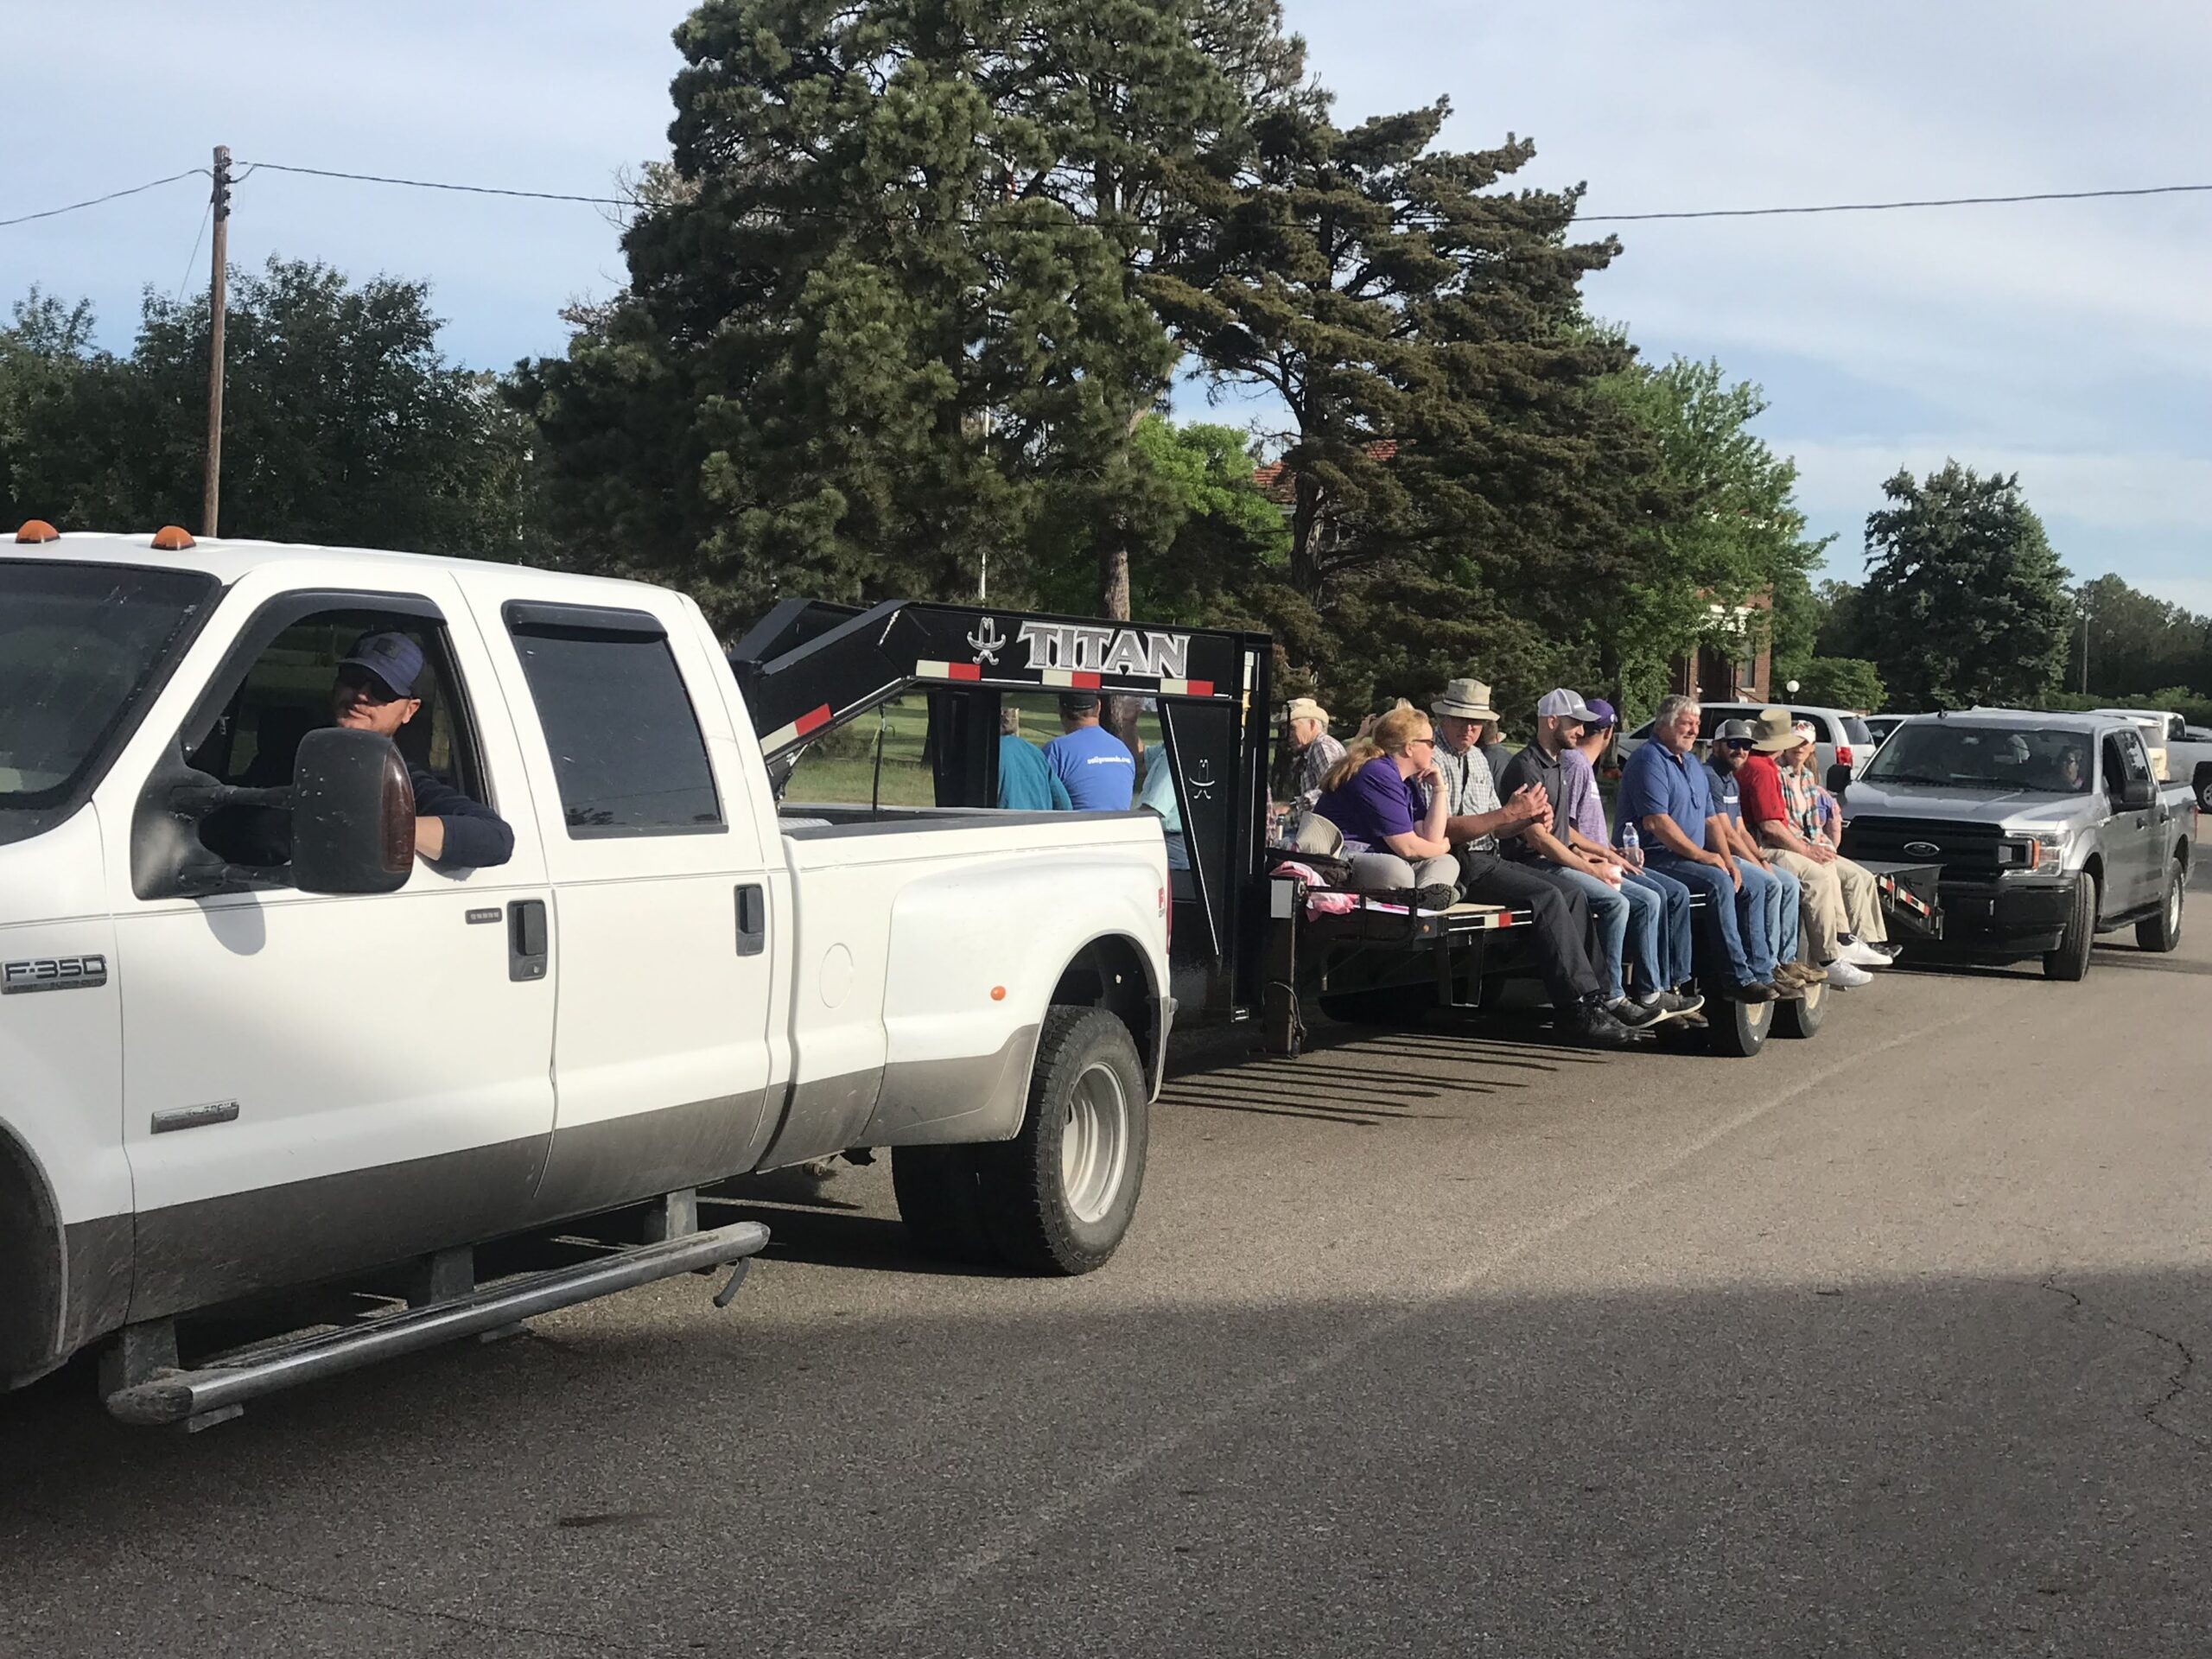
An 80-acre field under wheat-corn-fallow cropping system was split into four replicated blocks to test grazing and non-grazed CC effects on soil properties and crop yield. The CCs were planted into corn stubble or after wheat harvest. Spring-planted cover mixture of barley/oat/triticale/pea/sunflower/rapeseed was planted into corn stubble in April 2019. The total cover crop area was 80 acres and was split into four equal replicated strips or blocks for grazed or non-grazed CC treatments. Within each strip, a 90 ft by 750 ft area was fenced and excluded from cattle grazing (non-grazed treatment) using an electric wire fence. Within each strip, a 90 ft by 750 ft area was fenced and excluded from cattle grazing (non-grazed treatment) using electric wire. Each block was grazed 7-8 days with 46 heifers from 5/14/2019 to 6/14/2019 (Fig 1). A small fallow strip was included in each non-grazed plot area for weed biomass measurements in 2019. Cover crop biomass was measured by harvesting above ground biomass within eight 0.5 m2 quadrats from each block before and after grazing of the CCs. The CCs were terminated after heifers were removed from the field. Cattle weight gain was measured by weighing cattle before and after grazing using a portable livestock scale. In addition, weed density and weed biomass (primarily kochia and field bindweed species) were measured from grazed, non-grazed treatments, and chemical fallow plot using eight 0.5 m2 quadrats after cattle were removed. Cover crops were terminated in late June and the field was planted to winter wheat in October 2019 and harvested in late-June 2020.
The entire filed was planted again to summer cover crop mixture of sudan grass/millet/sun hemp/sunflower/radish on July 1, 2020, after winter wheat harvest. Summer cover crops were grazed by heifers from August 7, 2020 to September 18, 2020, at a stocking rate of 575 lb/a for a total of 41 days of grazing. Before and post-grazed cover crop biomass was measured as described previously. Soil samples were collected from the plots in spring 2019 before CC planting (initial soil samples) and in spring 2021 (final soil samples), after two cycles of CCs to determine grazing effects on bulk density, SOC, wet and dry aggregate stability.

Experiment at Hays, KS (2019 to 2021)
A 50-acre field at Hays was managed under a NT winter wheat or triticale-grain sorghum-fallow rotation. In 2019, summer CC mixture of sudan grass/millet/sun hemp/sunflower/radish was planted in the first week in June into triticale stubble. Treatments were grazed CCs and non-grazed CCs in four replicated strips, similar to the study in Alexander. The non-grazed CC treatments were fenced using electric wire fencing material to prevent access to cattle during CC grazing. The area of the four replicates of the non-grazed CC strips was approximately 3 acres. Cattle were allowed access to graze the rest of the field outside of the exclusion areas. The CC was grazed from 8/24/2019 to 10/10/2019 using 85 cow-calf pair which were turned out in groups as they calved. Cover crop biomass from the grazed and non-grazed strips were determined as described previously. The CCs were frost terminated and the field planted to grain sorghum the first week in June 2020 and harvested in October.
In spring 2021, a CC mixture of barley/oat/triticale/pea/sunflower/rapeseed was planted into the sorghum stubble in April 2021. The cover crops were grazed from 06/30/2021 to 07/20/2021 at a stocking rate of 450 lb/a. Soil samples were taken in 2019 (initial samples), spring 2020 and in 2021 as described below to determine grazing impacts on soil properties.
Experiment in Marquette, KS (2018 through 2021)
Two 90 acres fields wereplanted to CC after winter wheat harvest. The CCs comprised of triticale/radish/rapeseed and a summer mixture of sundan grass/millet/sun hemp/sunflower/radish (only in 2019). The summer CC was planted in August after volunteer wheat had been controlled whiles the fall mixture was seeded in September. The summer CC field was not grazed because of limited growth. Because of the poor performance and concerns of volunteer wheat, the farmer discontinued the summer CC options and only fall CCs were evaluated in subsequent years at this site. The fall CC mixture was grazed from 12/17/2018 to 02/10/2019 at a stocking rate of 550 lb/ac by moving cattle daily. Cover crop biomass prior to grazing and after grazing were measured as described above. The non-grazed CC treatments were fenced using electric wire to prevent access to cattle during CC grazing. The area of the four replicates of the non-grazed CC strips in Marquette was approximately 10.4 acres. Four locations within the grazed area, directly adjacent to each replicate of the fenced non-grazed CCs, were marked and used as four replicates (pseudoreplicates) for the grazed CC treatments. These pseudoreplicates were then used to determine grazing impacts on CC biomass, soil bulk density, aggregate stability, and available soil nutrients.
In 2019-2020, CC mixture of triticale/radish/rapeseed was planted to a different field approximately 100 acres next to the field used in 2019. Treatment arrangement and grazing was done like the previous year. The CCs were grazed by yearlings (575 lb each) from 01/09/2020 to 02/17/2020 at a stocking rate of about 550 lb/ac. In 2020-2021 growing season, the CC mixture was planted to the same 90-acre field used for the 2018-2019 study. In 2020-2021, [heifers (560 lbs)] grazed from 1/2/2021 to 2/14/2021 at a stocking rate of 550 lb/ac. Cover crop biomass before and after grazing was determined as previously described. Soil samples were taken in 2018, 2019, 2020 and again in spring 2021 as described below for determination of soil bulk density, SOC, aggregate stability, and available soil phosphorus and nitrogen.
Soil sampling and analysis
Soil samples were collected in fall 2018 at Marquette and spring 2019 in Alexander and Hays before CC planting (initial soil samples), again in spring 2020 and 2021 (final soil samples), when the fields have had two cycles of CCs. At each sampling time, two intact soil cores of 0 to 6-inch depth were collected from each plot using an AMS bulk density sampler (AMS, Inc., American Falls, ID) and split into increments of 0 to 2-inch and 2 to 6-inch. Samples were dried at 100 °C for a minimum of 48 hours and bulk density was computed as mass of oven-dried soil divided by volume of the core. Additional soil samples were collected for each CC treatment from the 0- to 2- and 2- to 6-inch depths in ten random locations within each replicate and composited by depth. Samples were air-dried, crushed, and sieved to pass through a 2-mm stainless steel screen, and analyzed SOC and nutrient concentration.
Additionally, three intact soil samples were taken with a flat shovel from 0 to 2 inches and used for determination of wet and dry aggregate stability. The samples were air-dried in the greenhouse for 24-hr and the partially air-dried samples were gently passed through an 8-mm mesh sieve and then allowed to fully air-dry. Two sub-samples from each plot were used to determine WSA by the wet-sieving method (Nimmo and Perkins, 2002) by placing a 50 g sample on top of a stack of nested sieves of 2- and 0.25-mm sized openings in a water column. Samples were allowed to wet by capillarity for 5 minutes. Subsequently, sieve stacks were oscillated a vertical distance of 3.7 cm at 30 oscillations minute-1 for 5 minutes. Aggregate fractions were transferred into glass beakers, dried at 105°C, and weighed to determine the proportion of aggregates within each size fraction. Each dry sample was then corrected for coarse sand by mixing the oven-dried aggregates with 30 ml of 5g L-1 sodium hexametaphosphate solution to disperse soil particles. Samples were allowed to soak for a minimum of four hours and were then swirled on an orbital shaker for an additional four hours. Each sample was then poured back though individual sieves with the same sized openings. The recovered sand was oven-dried and weighed to correct for coarse particles. Sand-corrected values were then used to compute the MWD and aggregate size distribution. Dry aggregate stability was determined using a system of nested rotary sieves having 19-, 6.3-, 2-, 0.84-, and 0.42-mm diameter openings (Chepil, 1962). Samples were shaken for 5 minutes using a portable sieve shaker (W.S. Tyler Model RX-812, Mentor, OH). The soil particles remaining on each sieve was weighed and the data was used to compute dry aggregate size distribution as well as wind-erodible fraction (WEF) which is the fraction of soil particles with a diameter less than 0.84 mm (Blanco-Canqui et al., 2013).
In 2021 at Alexander and Marquette site #1 (the site with two cycles of CC from 2018 through 2021), penetration resistance was measured at 10 random points within each plot using a hand cone penetrometer (Eijkelkamp Co., Giesbeek, The Netherlands) and readings were divided by the area of the cone (2 cm2). Values of penetration resistance were adjusted to a field capacity gravimetric water content of 0.35 (g/g). Statistical analyses were completed using PROC GLIMMIX of SAS v. 9.3 (SAS Institute, Cary, NC) with year, treatment, and their interactions considered fixed when appropriate for each study, and replication was always considered random. Treatment differences were considered significant at P ≤ 0.05.
2. Research at Kansas State University experiment farms to investigate forage production potential of cover crops and quantify impacts of removing cover crops for forage on weed suppression, crop yields and soil health
This component of the project was incorporated into ongoing CC research experiments at the Kansas State University Agricultural Research Centers near Garden City and HB ranch near Brownell, KS investigating fallow replacement CC species and management options for dryland crop production systems. The original fallow replacement CC treatments included peas (Pisum sativum L.) for grain as well as one-, three-, and six-species CC mixtures compared with summer-fallow in a wheat-sorghum-fallow rotation system. The experiment was modified in 2018-2019 growing season to evaluate CC management options including grazing, haying and flex-cover cropping. The flex-cover crop treatment was planted only when a minimum of 30 cm of plant available water was determined at spring planting using a Paul Brown soil moisture probe, and when the National Weather Service Seasonal Outlook for the fallow period was neutral or favorable. Treatments at each location are described below:
a). Cover crop treatments at Southwest Research Center near Garden City, KS
Control, Year 1: winter wheat; Year 2: grain sorghum; Year 3: fallow (common practice)
Year 1: winter wheat; Year 2: grain sorghum; Year 3: spring cover crop hayed
Year 1: winter wheat; Year 2: grain sorghum; Year 3: spring cover crop standing
Year 1: winter wheat; Year 2: grain sorghum; Year 3: flex spring cover crop hayed
Year 1: winter wheat; Year 2: grain sorghum; Year 3: flex spring cover crop standing
Year 1: winter wheat; Year 2: grain sorghum; Year 3: 6 species cocktail mix hayed
Year 1: winter wheat; Year 2: grain sorghum; Year 3: 6 species cocktail mix standing
*6 species mixture has included oat/triticale/barley/sunflower/rapeseed/radish
b). Cover crop treatments at Kansas State University HB Ranch near Brownell, KS
Control, Year 1: winter wheat; Year 2: grain sorghum; Year 3: fallow (common practice)
Year 1: winter wheat; Year 2: grain sorghum; Year 3: spring cover crop hayed
Year 1: winter wheat; Year 2: grain sorghum; Year 3: spring cover crop grazed
Year 1: winter wheat; Year 2: grain sorghum; Year 3: spring cover crop standing
Year 1: winter wheat; Year 2: grain sorghum; Year 3: flex spring cover crop hayed
The cocktail and flex-standing treatments were dropped at Brownell,KS to provide more plot space to evaluate CC grazing effects on soil properties.
Data collection 2019 to 2022
Field experiments were established in 2018-2019 growing season at Kansas State University Agricultural Research farms near Garden City and at HB Ranch near Brownell, KS to determined forage mass, nutritive value of spring-planted CCs and effects of dual-purpose CCs (grazing or haying CCs) on soil properties in a no-till winter wheat –grain sorghum–fallow cropping system. This study compared spring planted CCs to fallow before winter wheat. The CCs used were a mixture of oats and triticale or cocktail mixture of oat/triticale/barley/sunflower/rapeseed/radish. The CCs were planted by the third week of March each year and terminated the first week of June.
Grazing and cover crop biomass
Grazing of CCs at Brownell and haying of CCs at Brownell and Garden City coincided with grass CC species heading. Grazed CCs were stocked with yearling heifers (weighing about 1000 lb each) at a stocking rate that remove about 30 to 40% of the available CC biomass (forage). Prior to grazing, CC biomass was sampled by taking two clippings of 0.5 m2 quadrats from each plot grazed. Fresh weights of samples were recorded, and oven dried at 50°C for at least 48 hours in a forced-air oven for DM determination. Residue left post-grazing was determined as described above. Hayed treatments were harvested at heading to determine forage DM production and nutritive value. During each harvest, a 3-ft × 100-ft forage strip was harvested from each plot using a Carter plot forage harvester (Carter Manufacturing Company, Inc.) to a 6-inch stubble height. Whole plots samples weights were recorded, sub-samples were weighed, and oven dried for DM. Oven-dried samples from both grazing and hayed treatments were ground to pass through a 1-mm mesh screen in a Wiley Mill (Thomas Scientific, Swedesboro, NJ). The ground samples were then analyzed for forage nutritive value [crude protein (CP), acid detergent fiber (ADF), neutral detergent fiber (NDF), in vitro dry matter digestibility (IVDMD)], and tissue nutrient concentrations (Ward Laboratories, Inc., Kearney, NE) using Foss 6500 near infrared spectroscopy (NIRS).
Some regrowth of CCs following grazing or haying before termination occurred occasionally but was usually limited in these studies. Following fallow or spring CCs, winter wheat was planted the first week of October at a seeding rate of 60 lb/ac with 7.5-inch row spacing and harvested near the last week of June using a Massey-Ferguson 8XP plot combine (Kincaid Equipment Manufacturing, Haven, KS). Eleven months after wheat harvest and following fallow or summer CCs, grain sorghum was planted near the first week of June at a rate of 35,000 seeds/ac with 15-inch row. Grain sorghum was harvested near the third week of October using the same harvesting equipment as used for wheat.
Crop yields, soil sampling and analysis
Soil samples were taken to determine bulk density and soil water content at winter wheat planting in each year. Two soil cores were collected from each plot and data averaged for a single soil bulk density or water content measurement. Soil samples were collected in 2015 when initial study was established, again in the fall of 2019, 2020 and 2021 from individual plots following the termination of CCs but before subsequent winter wheat planting. Sampling in each year took place in different whole plots that represented the CC phase of the crop rotation to determine the effect on soil properties as influenced by previous CC management history. Plots where CCs were produced in 2016 and 2019 were sampled for soil properties in fall 2019, plots which had CCs in 2017 and 2020 were sampled in fall 2020, and plots that had CCs in 2018 and 2021 were sampled in fall 2021. The plots sampling times represent two cycles of CCs in the wheat-sorghum-fallow rotation at HB Ranch. At each sampling time, ten soil cores (1-inch diameter) were randomly taken at 0 to 2 inches and 2 to 6 inches to determine SOC concentration. Additional three samples were collected from the 0- to 2.5 inches soil depth with a flat shovel for the determination of water stable aggregates (WSA).
In 2021 and 2022, we collected additional crop residue and soil samples to determine the effect of flexible fallow replacement with hayed CCs on soil properties in no-till winter wheat-grain sorghum-fallow cropping system at Brownell and Garden City, KS. In this study, the flex-CCs were planted in the rotation if adequate soil water was available at planting and if the climate outlook for the growing season indicated normal or above average precipitation. In response to growing conditions over the study period, flex-CCs were implemented in 2018 and 2022 growing seasons at Brownell, and flex-CC treatment was implemented in 2018 and the 2021 growing seasons at Garden City.
Winter wheat and sorghum grain yields were determined by harvesting a 5-ft × 100-ft area from the center of each plot using a small plot combine. Statistical analysis was conducted with the PROC MIXED procedure of SAS (version 9.4, SAS Inst., Cary, NC) to examine forage production, soil bulk density, SOC, and winter wheat and grain sorghum yields as a function of cover crop management options.
On-farm field study results
Cover crop production and grazing days
In general, the grass species in the mixture dominated CC biomass at each location. Total CC biomass after grazing at Alexander, KS, (spring planted) and Marquette, KS (fall planted) were not different from biomass measured before grazing (Table 1). Suggesting significant regrowth from the cool season CCs. However, the post-grazed biomass was less than that of non-grazed CC in most cases. In 2019 at Hays, KS, forage mass at the time of grazing the summer CC was similar to non-grazed CC treatment because there was no regrowth between grazing and the first killing frost in October that terminated CC growth. The total forage mass of the summer CC (2019 in Hays and 2020 at Alexander) were two to five-fold greater than the spring or fall planted CCs. For example, spring CC biomass in 2021 at Hays averaged 1400 lb/a compared to average biomass of 6900 lb for summer CCs planted in 2019 in the same field.
Table 1. Cover crop biomass (grazed and non-grazed) at Alexander, Hays and Marquette, KS from 2019 to 2021.
|
Cover crop treatment |
Alexander, KS |
Hays, KS |
Marquette, KS |
||||
|
|
2019 |
2020 |
2019 |
2021 |
2019 |
2020 |
2021 |
|
|
Cover crop biomass (lb/ac) |
||||||
|
Pre-graze |
1337 ab |
3948 b |
6158 a† |
1063 b |
1262 b |
955 b |
2136 b |
|
Post-grazing |
1000 b |
3734 b |
4744 b |
429 c |
1292 b |
2068 a |
2207 b |
|
Non-grazed |
2304 a |
5189 a |
6908 a |
1436 a |
2740 a |
2653 a |
3100 a |
†Means in a row followed by different letters indicate significant differences among cover crop management at α < 0.05.
Spring CCs in Alexander, KS were grazed from May 14, 2019 to mid-June (6/14/2019) for 31 grazing days. Stocking rate was 354 lb/ac with an average daily gain of 3.1 lb/day. Similarly, summer CCs were grazed from August 7 to September 18, 2020 (41 grazing days). Stocking rate was 576 lb/ac with an average daily gain of 1.6 lb/day. Similarly, in Marquette, stocking rate averaged 550 lb/a and average daily gain was 1.2 lb/day for > 40 grazing days from 2019 through 2021 (Table 2). Grazing days and stocking rate varied at Hays because of the difference is calving time and when were turn. Notwithstanding, the lactating cows maintained their body weight by grazing on the summer CC in 2019 (Table 2). Because of dry conditions and little forage production, cattle grazed for only 25 grazing days in 2021 at Hays.
Table 2. Grazing days and animal performance of cattle grazing cover crops in western Kansas.
|
Location |
Starting |
Ending |
Class |
Grazing days |
Stocking rate, lb/acre |
ADG Ib/day |
Avg. Wt lb |
|
Alexander, KS |
5/14/19 |
6/14/19 |
calves |
31 |
354 |
3.11 |
587 |
|
Alexander, KS |
8/7/20 |
9/18/20 |
calves |
41 |
576 |
1.6 |
754 |
|
Marquette, KS |
12/17/18 |
02/10/19 |
Calves |
54 |
550 |
1.4 |
560 |
|
Marquette, KS |
1/9/20 |
2/17/20 |
calves |
39 |
552 |
1.2 |
565 |
|
Marquette, KS |
1/02/21 |
2/14/21 |
Calves |
43 |
550 |
- |
560 |
|
Hays, KS |
8/24/19 |
10/10/19 |
pairs |
48 |
274 |
-0.3 |
1246 |
|
|
9/15/19 |
10/10/19 |
pairs |
25 |
372 |
-1.0 |
1400 |
|
|
9/28/19 |
10/10/19 |
pairs |
12 |
403 |
2.7 |
1518 |
|
Avg Hays† (2019) |
|
|
|
28 |
350 |
0.46 |
1388 |
|
Hays, KS |
6/30/21 |
07/25/2021 |
Calves |
25 |
450 |
1.3 |
650 |
†Fall calving pairs were turned out in groups as they calved.
Grazing effects on soil properties
At Hays and Alexander, soil bulk density, SOC, nutrient concentrations and mean weight diameter (MWD) of water stable aggregates were not different between grazed and non-graze CCs (Table 3 & 4). However, compared to the initial measurements, grazed and non-grazed CCs had significantly greater SOC and NO3-N concentration particularly at Hays (Table 4). The SOC measured in the spring 2019 at surface 0 to 2-inch depth was 1.4%, less than 2.1% SOC measured in 2021 following two cycles of grazing CCs at this location (Table 4). The MWD of water stable aggregates at Hays in 2021, averaged 1.45 mm with grazed and 1.96 mm for non-grazed CCs. Similarly, at Alexander, MWD measured in 2021 was unaffected by grazing CCs (Table 3). Wind-erodible fraction was not different between CC treatments. Penetration resistance at the 0- to 6-inch soil depth with grazed CCs was not different compared to non-grazed CCs and averaged 0.52 and 0.52 MPa with grazed and non-grazed CCs, respectively.
At Marquette, measured soil properties were not different between grazed and non-grazed CCs. Soil bulk density measured within the top 0 to 2-inch in grazed plots averaged 1.23 g/cm3 compared to 1.43 g/cm3 for the non-grazed treatment at the Marquette in 2019 (Table 3). The bulk density measured on this same field in 2021 averaged 1.38 g/cm3 for grazed and 1.36 g/cm3 for the non-grazed treatment in the 0–2-inch depth. The bulk density measured at 2–6-inch depth was 1.53 g/cm3 for grazed and 1.49 g/cm3 for non-grazed treatment. The penetration resistance measurements taking following grazing in 2021 averaged 0.36 and 0.34 MPa with grazed and non-grazed CCs, respectively, at Marquette. The measured penetration resistance across locations and CC management strategies was below the threshold of 2 MPa that will limit root growth. The SOC concentration after two cycles of CC measured in the top 0–2-inch depth in 2021 averaged 1.74% with grazed CCs and 1.62% for non-grazed. The SOC at 2-6 depth was unaffected by CC management and averaged 1.22 % and 0.97% for grazed and non-grazed CCs, respectively (Table 4).
Table 3. Cover crop grazing effects on soil bulk density (BD), mean weight diameter (MWD) of aggregates, wind erodible fraction (WEF), and penetration resistance (PR) at Alexander, Hays, and Marquette, KS.
|
Location |
Depth |
Treatment |
BD |
WEF |
MWD |
PR |
|
g/cm3 |
% |
mm |
MPa |
|||
|
Alexander, KS |
0- 2 inch |
2019 Initial |
1.02b† |
|
1.21a |
|
|
|
|
2021 Grazed |
1.36a |
11.9a |
1.41a |
0.52a |
|
|
|
2021 Non-grazed |
1.36a |
14.1a |
1.61a |
0.52a |
|
|
2-6 inch |
2019 Initial |
1.29a |
|
|
|
|
|
|
2021 Grazed |
1.41a |
11.1a |
1.05a |
0.52a |
|
|
|
2021 Non-grazed |
1.44a |
18.4a |
1016a |
0.52a |
|
|
|
|
|
|
|
|
|
Hays, KS |
0-2 inch |
2019 Initial |
1.24a |
|
1.86a |
|
|
|
|
2020 Grazed |
1.32a |
|
1.46a |
|
|
|
|
2020 Non-grazed |
1.20ab |
|
1.96a |
|
|
|
|
2021 Grazed |
1.09b |
16.4a |
2.00a |
|
|
|
|
2021 Non-grazed |
1.04b |
20.9a |
1.40b |
|
|
|
2-6 inch |
2019 Initial |
1.43a |
|
|
|
|
|
|
2020 Grazed |
1.41ab |
|
|
|
|
|
|
2020 Non-grazed |
1.38b |
|
|
|
|
|
|
2021 Grazed |
1.13c |
13.1a |
1.57a |
|
|
|
|
2021 Non-grazed |
1.13c |
11.9a |
2.06a |
|
|
|
|
|
|
|
|
|
|
Marquette, KS Field# 1 |
0-2 inch |
2018 Initial |
1.42a |
|
|
|
|
|
|
2019 Grazed |
1.23b |
|
1.00a |
|
|
|
|
2019 Non-grazed |
1.43a |
|
1.53a |
|
|
|
|
2021 Grazed |
1.38ab |
15.3a |
1.37a |
0.36a |
|
|
|
2021 Non-grazed |
1.36ab |
12.4a |
0.89a |
0.34a |
|
|
2-6 inch |
2018 Initial |
1.52a |
|
|
|
|
|
|
2019 Grazed |
1.49a |
|
|
|
|
|
|
2019 Non-grazed |
1.54a |
|
|
|
|
|
|
2021 Grazed |
1.53a |
4.5a |
0.75a |
0.36a |
|
|
|
2021 Non-grazed |
1.49a |
5.5a |
0.68a |
0.34a |
|
|
|
|
|
|
|
|
|
Marquette, KS Field # 2 |
0-2 inch |
2019 Initial |
1.28a |
|
|
|
|
|
|
2020 Grazed |
1.32a |
|
1.10a |
|
|
|
|
2020 Non-grazed |
1.28a |
|
1.12a |
|
|
|
2-6 inch |
2019 Initial |
1.44a |
|
|
|
|
|
|
2020 Grazed |
1.51a |
|
|
|
|
|
|
2020 Non-grazed |
1.48a |
|
|
|
†Means in a row followed by different letters indicate significant differences among cover crop management at α < 0.05.
Table 4. Cover crop grazing effects on soil organic carbon (SOC), nitrate-N, and phosphorus concentrations at Alexander, Hays, and Marquette, KS.
|
Location |
Depth |
Treatment |
SOC |
NO3-N |
P |
||
|
% |
ppm |
ppm |
|||||
|
Alexander, KS |
0- 2 inch |
2019 Initial |
0.98a |
1.1b |
39a |
||
|
|
|
2021 Grazed |
1.11a |
7.0a |
42a |
||
|
|
|
2021 Non-grazed |
1.10a |
9.7a |
34a |
||
|
|
2-6 inch |
2019 Initial |
1.12a |
1.3a |
13a |
||
|
|
|
2021 Grazed |
1.22a |
3.6a |
8a |
||
|
|
|
2021 Non-grazed |
1.03a |
3.5a |
15a |
||
|
|
|
|
|
|
|
||
|
Hays, KS |
0-2 inch |
2019 Initial |
1.38c |
3.2c |
45.9a |
||
|
|
|
2020 Grazed |
1.89b |
16.4a |
45.2a |
||
|
|
|
2020 Non-grazed |
2.05ab |
14.4a |
48.3a |
||
|
|
|
2021 Grazed |
2.05a |
3.6c |
53.0a |
||
|
|
|
2021 Non-grazed |
1.95ab |
7.5b |
48.0a |
||
|
|
2-6 inch |
2019 Initial |
1.35c |
1.1c |
16.2a |
||
|
|
|
2020 Grazed |
1.58a |
8.7a |
23.8a |
||
|
|
|
2020 Non-grazed |
1.53ab |
5.3b |
24.6a |
||
|
|
|
2021 Grazed |
1.52ab |
1.3c |
29.0a |
||
|
|
|
2021 Non-grazed |
1.39bc |
2.0c |
19.0a |
||
|
|
|
|
|
|
|
||
|
Marquette, KS Field # 1 |
0-2 inch |
2018 Initial |
1.45 |
1.3 b |
87.0b |
||
|
|
|
2019 Grazed |
1.48 |
2.0 b |
81.8b |
||
|
|
|
2019 Non-grazed |
1.70 |
1.7 b |
84.8b |
||
|
|
|
2021 Grazed |
1.74a |
44.3a |
55.7a |
||
|
|
|
2021 Non-grazed |
1.62a |
43.8a |
61.4a |
||
|
|
2-6 inch |
2018 Initial |
1.20 |
1.2b |
42b |
||
|
|
|
2019 Grazed |
1.21 |
1.2b |
38.8b |
||
|
|
|
2019 Non-grazed |
1.40 |
1.8b |
41.0b |
||
|
|
|
2021 Grazed |
1.22a |
4.85a |
21.4a |
||
|
|
|
2021 Non-grazed |
0.97b |
5.15a |
18.5a |
||
|
|
|
|
|
|
|
||
|
Marquette, KS Field # 2 |
0-2 inch |
2019 Initial |
1.54a |
3.40a |
64.5a |
||
|
|
|
2020 Grazed |
1.56a |
2.48a |
68.3a |
||
|
|
|
2020 Non-grazed |
1.94a |
3.15a |
51.0a |
||
|
|
2-6 inch |
2019 Initial |
1.06 a |
2.10 a |
27.4a |
||
|
|
|
2020 Grazed |
1.12a |
1.13a |
31.5a |
||
|
|
|
2020 Non-grazed |
1.08a |
1.88a |
30.0a |
||
†Means in a row followed by different letters indicate significant differences among cover crop management at α < 0.05.
Results at Kansas State University HB Ranch near Brownell, KS
Forage production and nutritive value
Forage mass produced varied over the study period because of variations in soil water availability and air temperature in the spring. Average forage mass was greatest in 2018 and least in 2020 (Table 5). The lower CC forage mass production in 2020 was due to drier than normal spring conditions that delayed cover crop growth. Similarly, wet soils in March 2021 delayed planting which decreased forage production. The hay treatment was harvested at a greater height (6 inches) and therefore had relatively lower yields than cover treatments (clipped at 2 inches). In 2019 and 2021 when there was time for regrowth before CC termination, biomass left after grazing was similar to that measured pre-grazing. Residue left post-grazing ranged from 69 to 84% of that biomass of the non-grazed CC treatment across years. Therefore, careful grazing of CCs can leave adequate amount of residue to protect the soil to achieve soil health goals while providing a forage resource for livestock.
In general, grazed CC treatments had more CP, and IVDMD concentrations than CC hayed treatments. Similarly, the hayed treatment had significantly greater ADF and NDF concentrations compared to the grazed treatments (Table 5). This was expected because grazed treatments were usually sampled 7 to 10 days earlier than the hayed treatments. Delaying harvest resulted in more mature plants reducing forage digestibility and nutritive value. Nonetheless, in a production setting, grazing of forage would likely begin at a more immature stage of forage growth and the quality would match the needs of stocker cattle.
Table 5. Spring planted cover crop forage mass and nutritive content at heading, before grain fill over four years at the Kansas State University experiment fields at HB Ranch near Brownell, KS from 2018 to 2022.
|
Year |
Treatment |
Forage mass |
CP1 |
ADF |
NDF |
IVDMD |
|
2018 |
Standing |
3276 a† |
|
|
|
|
|
|
Pre-grazed |
3365 a |
9.6 a |
37 a |
54 a |
68 a |
|
|
Post-grazed |
2520 c |
|
|
|
|
|
|
Hayed |
2792 b |
10.1 a |
36 a |
62 a |
68 a |
|
2019 |
Standing |
2622 a |
|
|
|
|
|
|
Pre-grazed |
1806 c |
10.8 a |
31 b |
53 b |
83 a |
|
|
Post-grazed |
2214 b |
|
|
|
|
|
|
Hayed |
779 d |
9.8 a |
40 a |
62 a |
77 b |
|
2020 |
Standing |
2138 a |
|
|
|
|
|
|
Pre-grazed |
2133 a |
12.6 a |
34 b |
60 b |
78 a |
|
|
Post-grazed |
1482 b |
|
|
|
|
|
|
Hayed |
1398 b |
10.5 b |
41 a |
68 a |
69 b |
|
2021 |
Standing |
2454 a |
|
|
|
|
|
|
Pre-grazed |
2454 a |
9.8 a |
36 a |
61 a |
74 a |
|
|
Post-grazed |
1916 ab |
|
|
|
|
|
|
Hayed |
1435 b |
9.3 a |
38 a |
63 a |
75 a |
|
2022 |
Standing |
2354a |
|
|
|
|
|
|
Pre-grazed |
1414 b |
|
|
|
|
|
|
Post-grazed |
891 c |
|
|
|
|
|
|
Hayed |
1635 b |
|
|
|
|
1CP = crude protein. ADF = acid detergent fiber (higher values reflect lower digestibility). NDF = neutral detergent fiber (higher values reflect lower animal intake). IVDMD = in vitro dry matter digestibility (reflects relative energy differences).†Means in a row followed by different letters indicate significant differences among cover crop management at α < 0.05.
Wheat yields
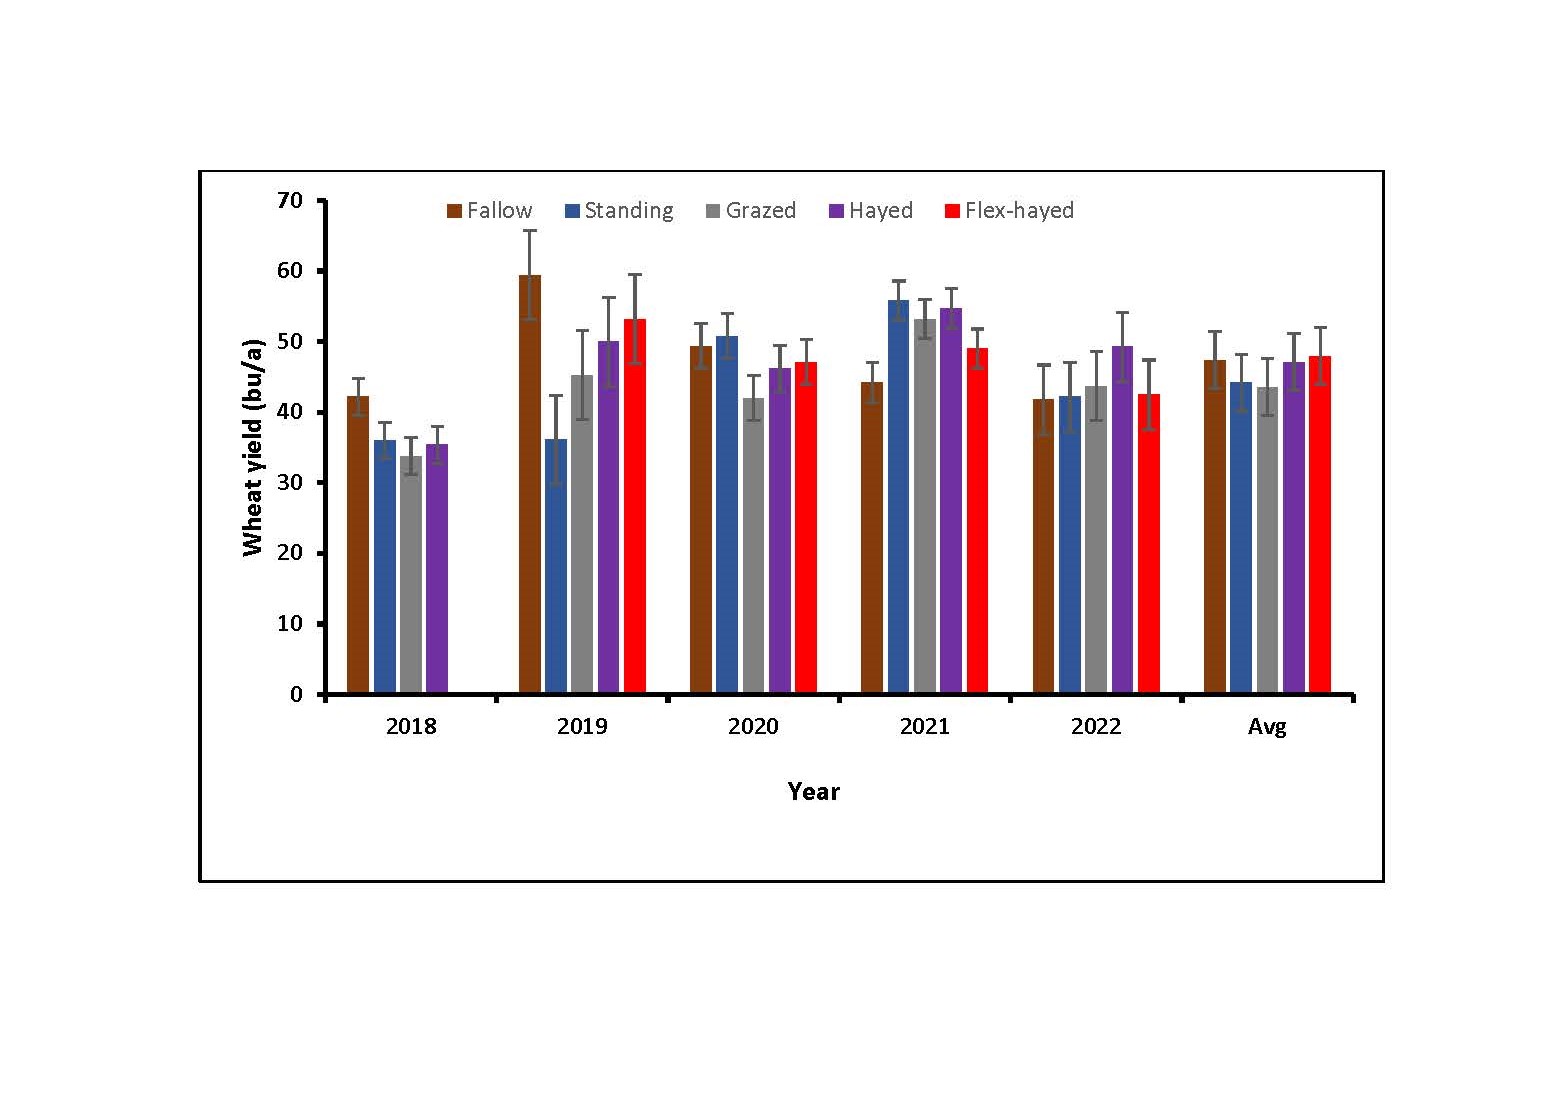
Spring CCs reduced winter wheat yields between 25 and 31% compared to fallow in two out of five years with no yield differences between CC management strategies. However, when average across the 5-years (2018 to 2022), wheat yield were not different among treatments. Yields averaged 47 bu/for fallow compared with 44 bu/a for standing or grazed CCs, 47 bu/ac when hayed, and 48 bu/a for flex-hayed CCs (Fig.2). Yields of grain sorghum grown one year following CCs in the crop rotation were unaffected by CC treatments. Grain sorghum yields averaged 75 bu/for fallow, 77 bu/a for grazed CCs, 71 bu/ac when hayed, and 74 bu/a for standing CCs. These resul ts showed CCs can be grazed or hayed in NT dryland cropping systems with no negative effects on wheat and grain sorghum yields compared to standing CCs. Grazing or haying of CCs enrolled in NRCS cost-share programs can be effective strategies to offset losses when grain yields are reduced and could potentially increase CC adoption and overall dryland cropping system profitability.
Weed suppression
Alexander in 2019
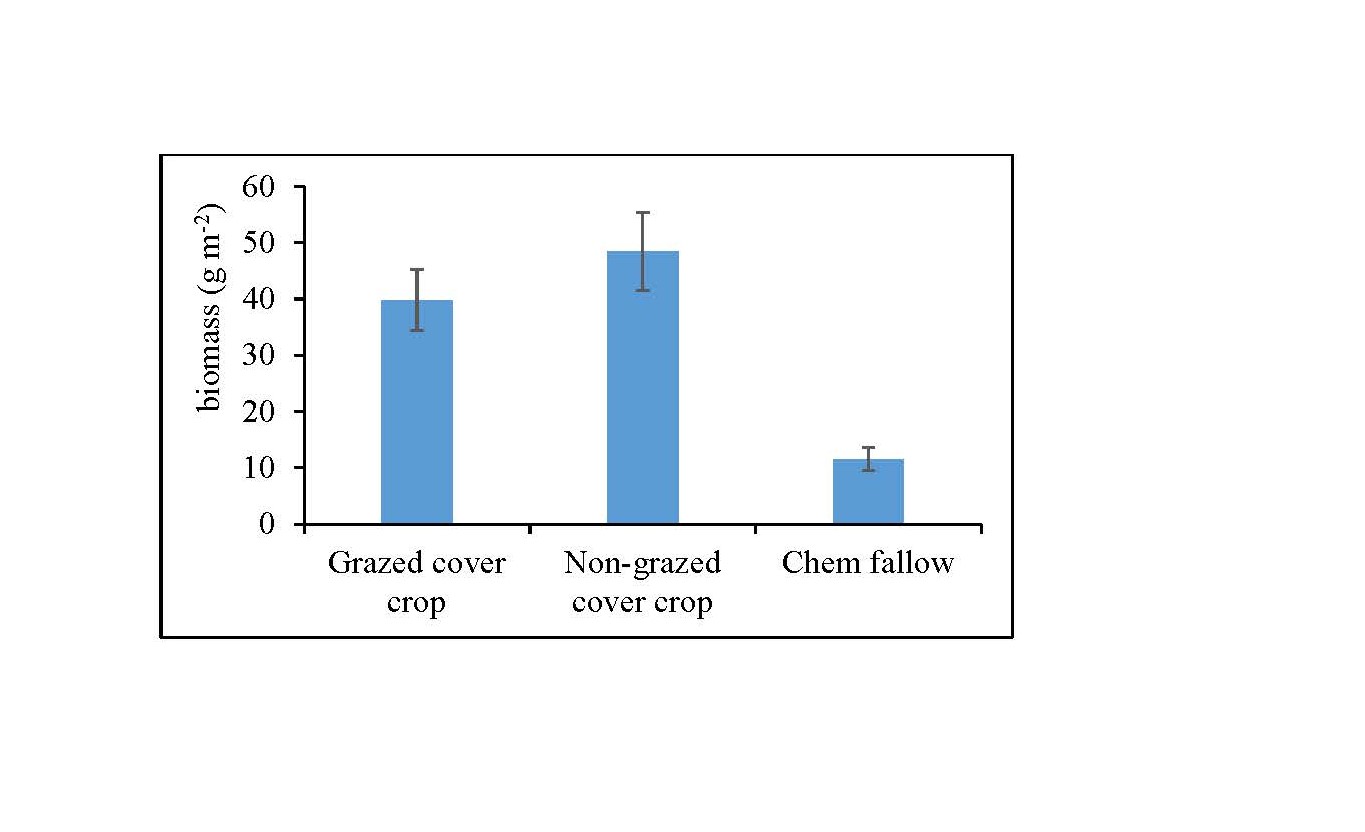
In 2019, weed density was compared in chemical fallow plots with grazed and non-grazed CCs after grazing in Alexander. Data on total weed density and weed biomass (primarily kochia and field bindweed species) were collected from each plot using eight 1-m2 quadrats. Results indicated no differences in total weed biomass (40 to 48 g m-2) in grazed vs. non-grazed plots (Fig. 3). The use of herbicide in fallow plots resulted in significant reduction of total weed biomass (11 g m-2).
HB Ranch Study (2020 through 2022 at HB Ranch)
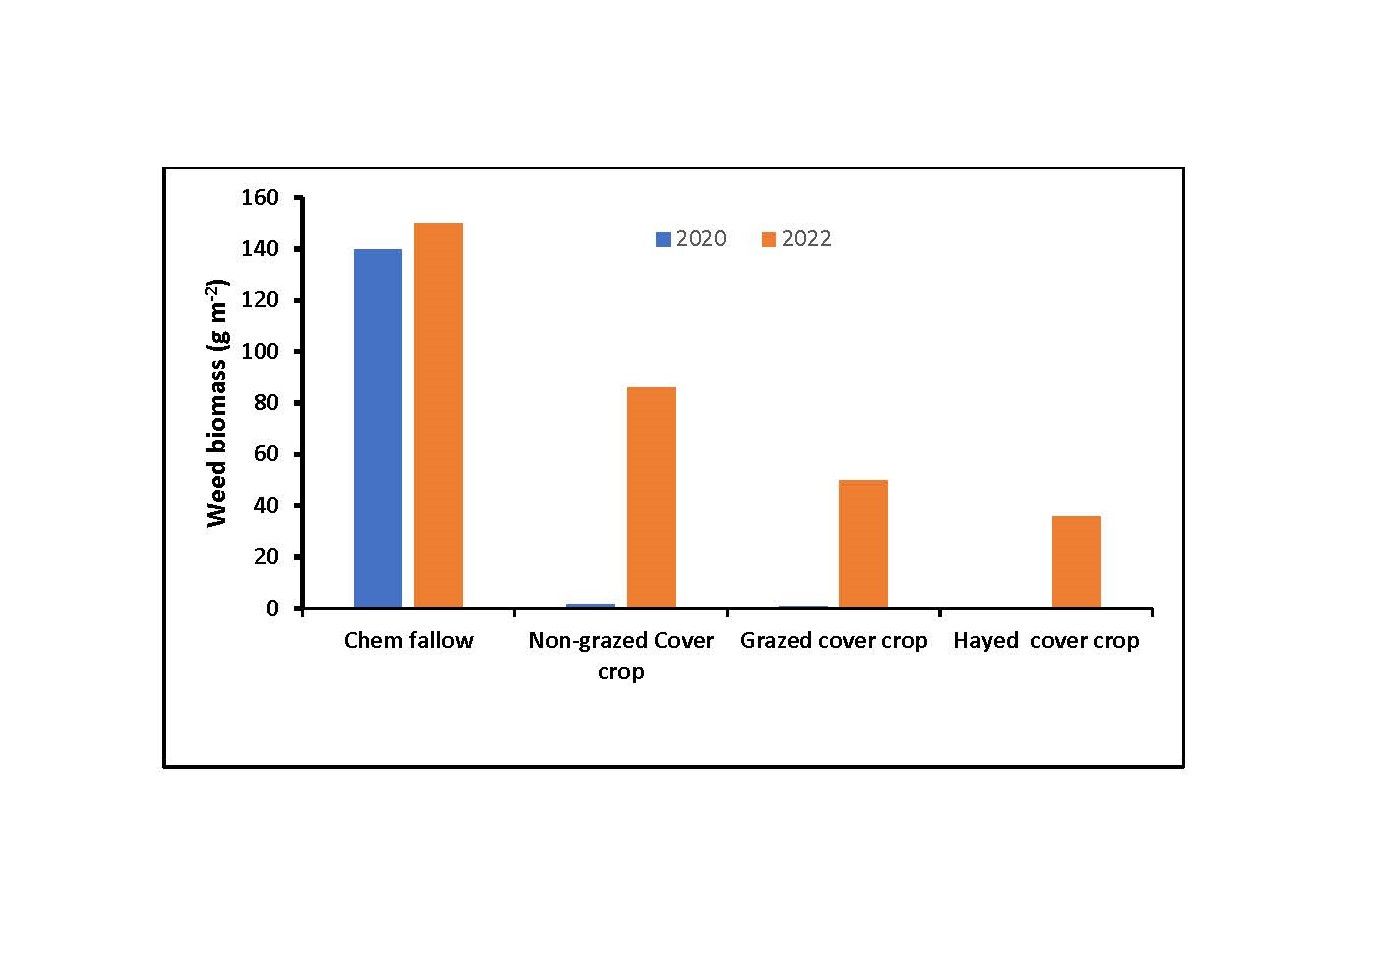
The on-going spring-planted CC grazing study at Kansas State University HB Ranch was monitored for weed suppression in 2020, 2021 and 2022. The treatments were oat/triticale CC which were either hayed, grazed by yearling heifers, or left standing compared to chemical fallow. Approximately four herbicide applications were made at the recommended use rate to control weeds in the chemical fallow plots. Application of dicamba with glyphosate in March, and paraquat in May. Two more sequential burndown applications of glyphosate were made in July and September to control weeds prior to winter wheat planting in October. Weed density measurements were done in mid-June at termination of CCs. In 2020, total weed density and weed biomass (primarily glyphosate-resistant kochia) were collected from each plot using six 1-m2 quadrats before CC termination. Results showed no differences in total weed biomass accumulation (0.8 to 1.7 g m-2) in grazed and non-grazed CC plots (Fig. 4). The fallow plots had significant higher total weed biomass accumulation (140 g m-2). Dry conditions prevented weed regrowth in fallow plots after herbicide application in May 2021. Similarly, significant weed suppression from CC resulted in no measurable weed biomass in CC grazed and non-grazed at termination. In 2022, growing a CC either grazed, hayed or non-grazed significantly reduce weed biomass compared to chem-fallow (Fig. 4).
Hays, KS 2021 and 2022
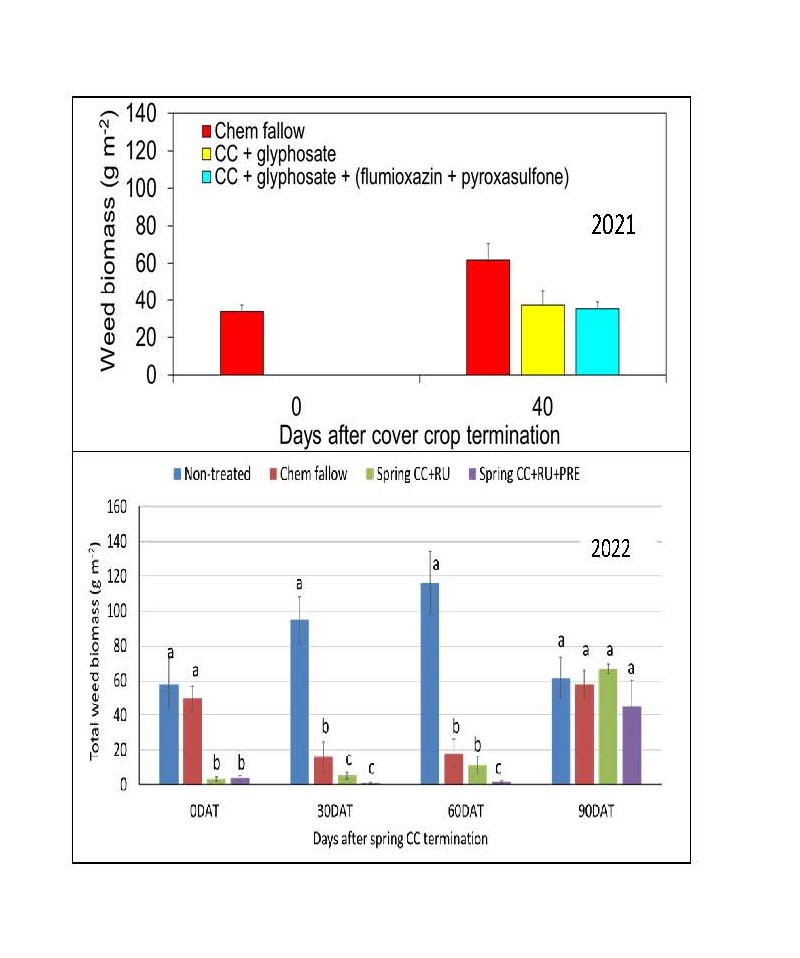
Another spring-planted CC (spring oats/barley/spring peas mixture) study in sorghum stubble was conducted at Kansas State University Agricultural Research Center in Hays to evaluate CC herbicide termination strategies on weed suppression. Cover crop was terminated with two different herbicide programs: (1) glyphosate only or (2) glyphosate plus soil residual herbicide (flumioxazine + pyroxasulfone) on June 26, 2021. Chemical fallow plots (where herbicides were applied to keep them weed free) were also maintained for treatment comparison. Data on total weed density and weed biomass (primarily glyphosate and dicamba-resistant kochia and Palmer amaranth) were collected from each plot using two 1-m2 quadrats at CC termination and 40 days after termination. Results showed CC treatments reduced weed biomass more than 98% compared to chem-fallow at the time of cover crop termination (Fig. 5). Furthermore, CC plots terminated with glyphosate or glyphosate plus soil residual herbicide resulted in significant weed biomass reduction at 40 days after termination in comparison to chem-fallow plots (62 g m-2) (Fig. 5). Similarly in 2022, CCs terminated with glyphosate or glyphosate plus soil residual herbicide provided more than 95% suppression at 60-day after termination compared to non-treated fallow (Fig.5).
Soil bulk density, organic matter and aggregate stability
Grazing or haying CCs had no significant effect on bulk density from 2018 through 2021. Averaged across the four years, fallow, non-grazed CCs, and grazed CCs had soil bulk densities of 1.11, 1.15, and 1.15 g/cm3 at the 0- to 2-inch soil depth and 1.39, 1.40, and 1.37 g/cm3 at the 2- to 6-inch soil depth, respectively. However, a significant precipitation event ( > 76 mm) that occurred during grazing in earlier years of the study in 2015 (before the current study), resulted in a significant increase in soil bulk density at 0 to 2 inch depth . No difference in bulk density was observed beyond the top 2 inches over the study period. The SOC stocks measured in 2019 with standing and hayed CCs were greater than fallow (24.79 Mg ha-1) which was similar to grazed CCs. However, in 2020, stocks were less with hayed CCs (21.80 Mg ha-1) compared to grazed or standing CCs (24.27 Mg ha-1) and all were similar to fallow.
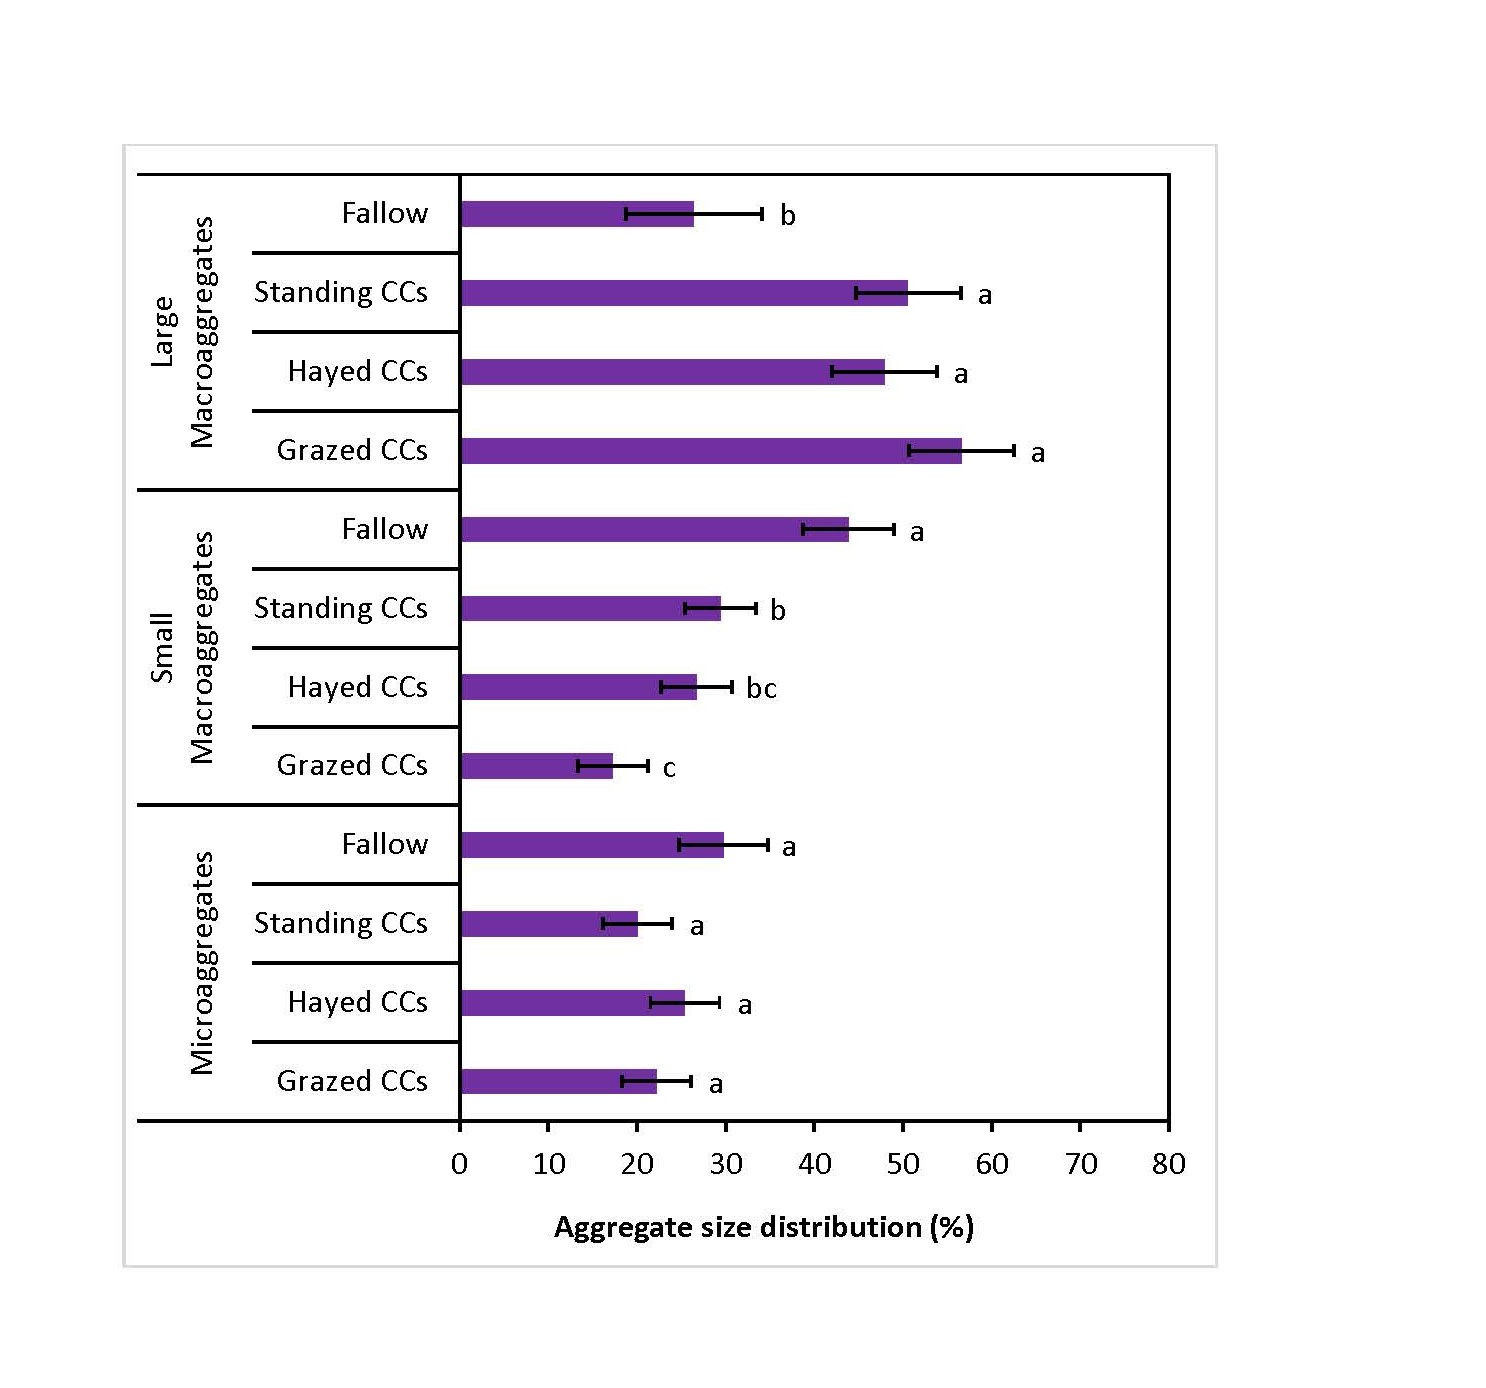
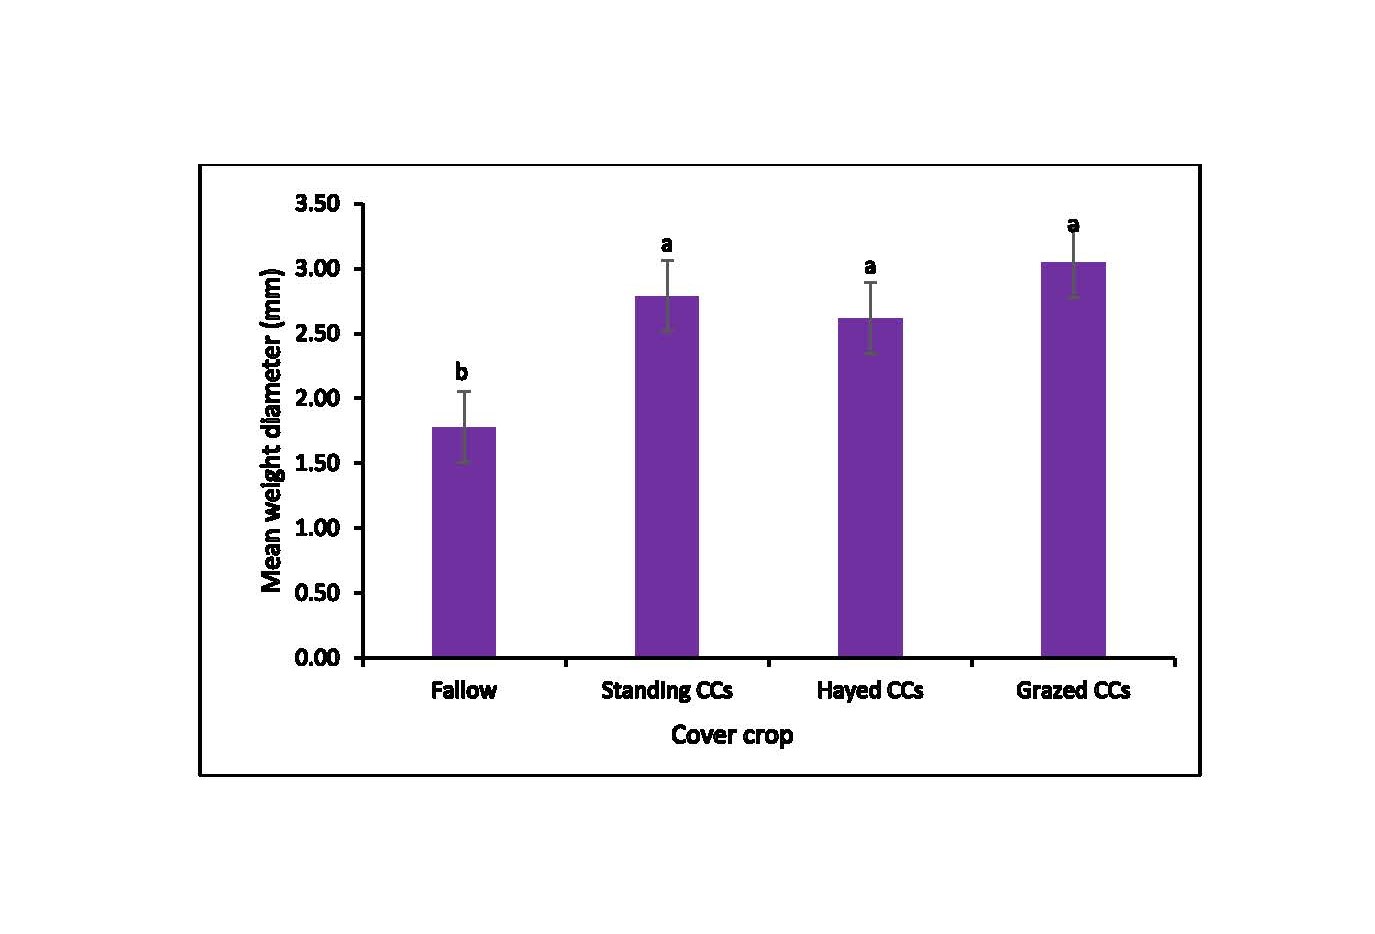
Mean weight diameter of water stable aggregates in the 0 to 5 cm soil depth in 2019 and 2020 was greater with all CCs (standing, grazing, or hayed) compared to fallow (Fig. 6). Mean weight diameter was 2.79-mm for the standing CCs, 2.54-mm for the hayed CCs, 3.05-mm for the grazed CCs, and 1.78-mm for fallow. This indicates that CCs have the ability to increase soil aggregation similarly when standing, hayed, or grazed. Additionally, all CCs were found to increase the proportion of large macroaggregates (> 2-mm) compared to fallow (Fig. 7).
Garden City, KS: 2019 to 2021 growing season.
Crop data: In Garden City, forage productivity varied over the study period. Forage mass of the cocktail treatment was 1700 lb/a, 620 lb/ac and 908 lb/a in 2019, 2020 and 2021, respectively. Similarly, oat/triticale CC biomass were 2500, 617, and 1395 lb/ac in 2019, 2020, and 2021, respectively. The productivity of the flex-cover crop was like the oat/triticale treatment when it was planted in 2019 and 2020.
Wheat yields following CCs were not different from fallow in 2019. Yields averaged 90 bu/ac for fallow compared to 89 bu/ac for oat/triticale hayed or 86 bu/ac for oat/triticale standing and 91 bu/for the cocktail. Dry conditions in 2020 significantly reduced wheat yields, which averaged 23 bu/a with fallow and 19 bu/a with oat/triticale hayed or standing.
Soil samples were also collected from the Garden City study in fall 2018 and summer 2019 before modifying the experiment to examined long-term CC management effects on soil properties in a no-till (NT) winter wheat- grain sorghum-fallow cropping system in southwest Kansas. Treatments were all spring-planted and included one-, three-, and six-species CC mixtures compared with chemically controlled NT fallow. Half of each CC treatment was harvested for forage. Soil organic carbon (SOC) stocks within the 0- to 15-cm soil depth were greater with CCs compared to fallow in 2012 after three cycles of CCs in the initial wheat-fallow rotation. In 2018 and 2019 after two cycles of the WSF rotation, SOC stocks were similar across all treatments including fallow likely, because CC residue inputs declined due to a succession of drought years. The significant residue contribution from grain sorghum in the WSF rotation increased SOC in 2018 and 2019 in all treatments compared to 2012. Soil aggregation was greater with CCs compared to the fallow treatment and was unaffected by CC diversity. Mean weight diameter (MWD) of water stable aggregates
was 1.11 mm with standing CCs compared with 0.77 mm for pea. The MWD of dry aggregates with standing (3.55 mm) and hayed CCs (3.62 mm) were greater compared to fallow (2.75 mm). Water infiltration rates and saturated infiltrability measured in summer 2019 were greater with CCs compared. These findings suggest simple CC mixtures and CCs managed for annual forage provide similar soil benefits as diverse CCs mixtures and CCs left standing.
Results of Flex-Cover Crop Study at Brownell and Garden City, KS
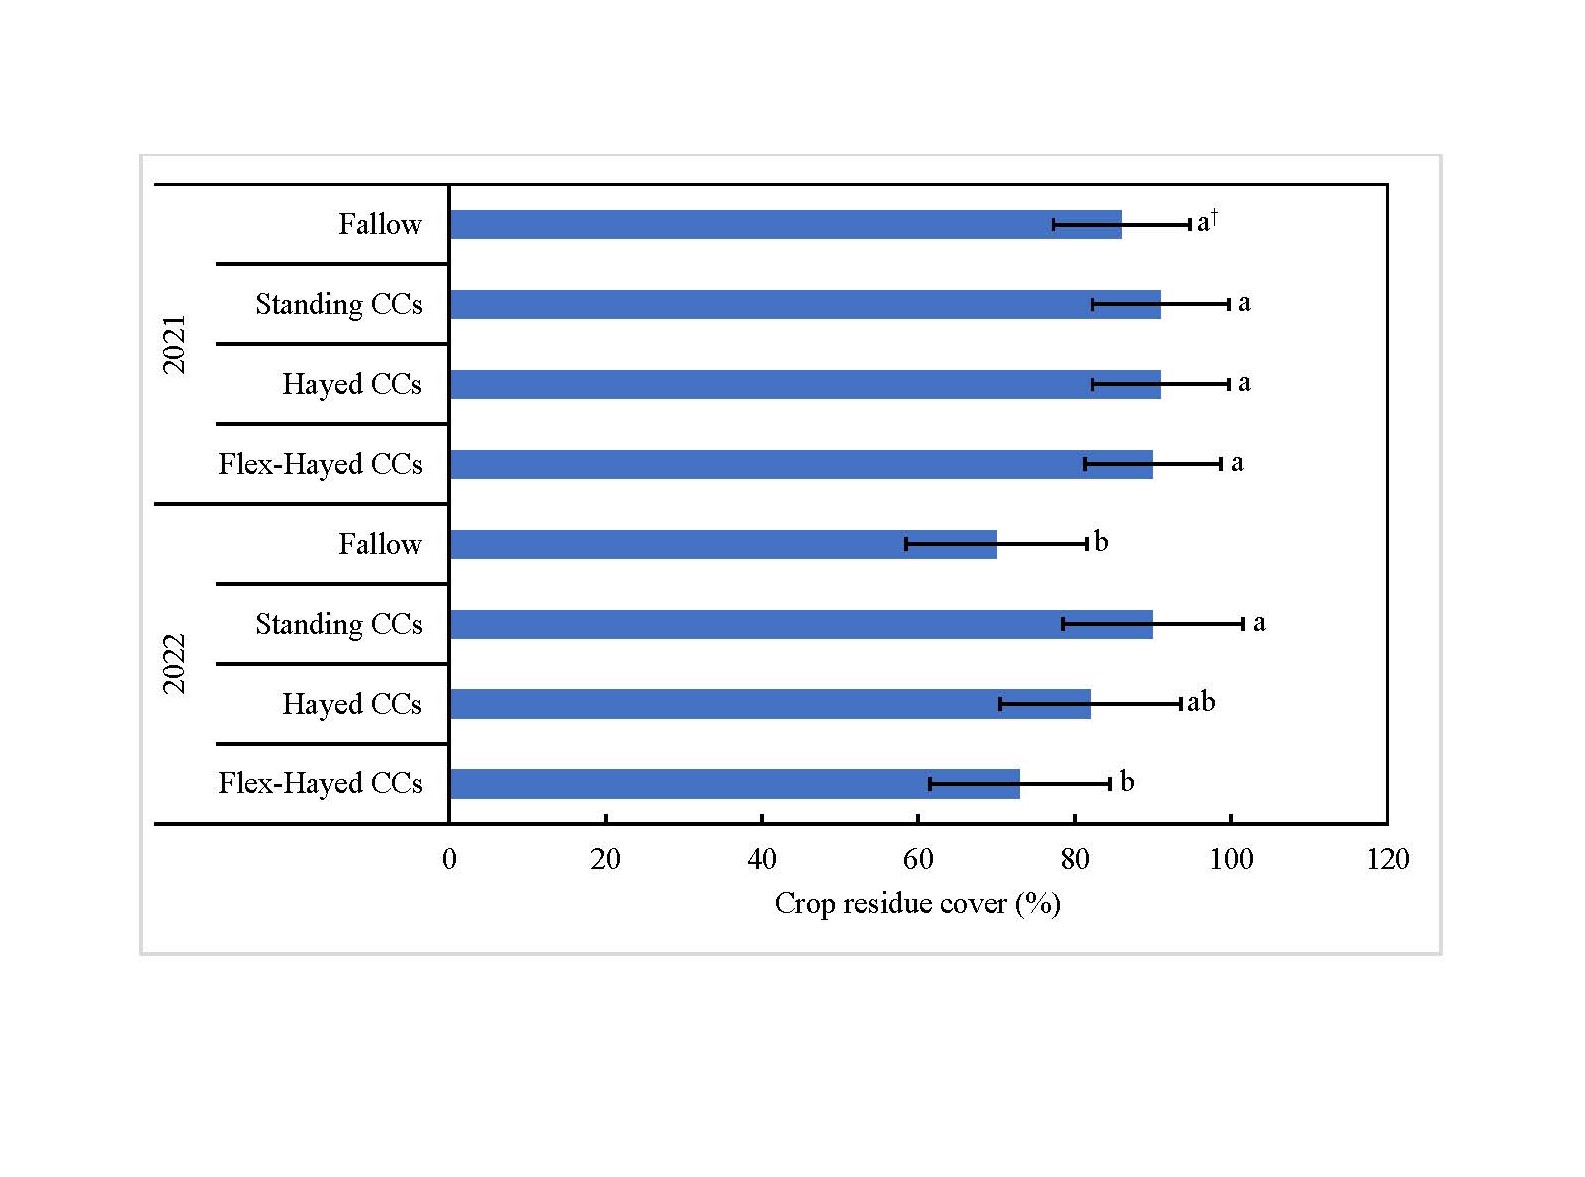
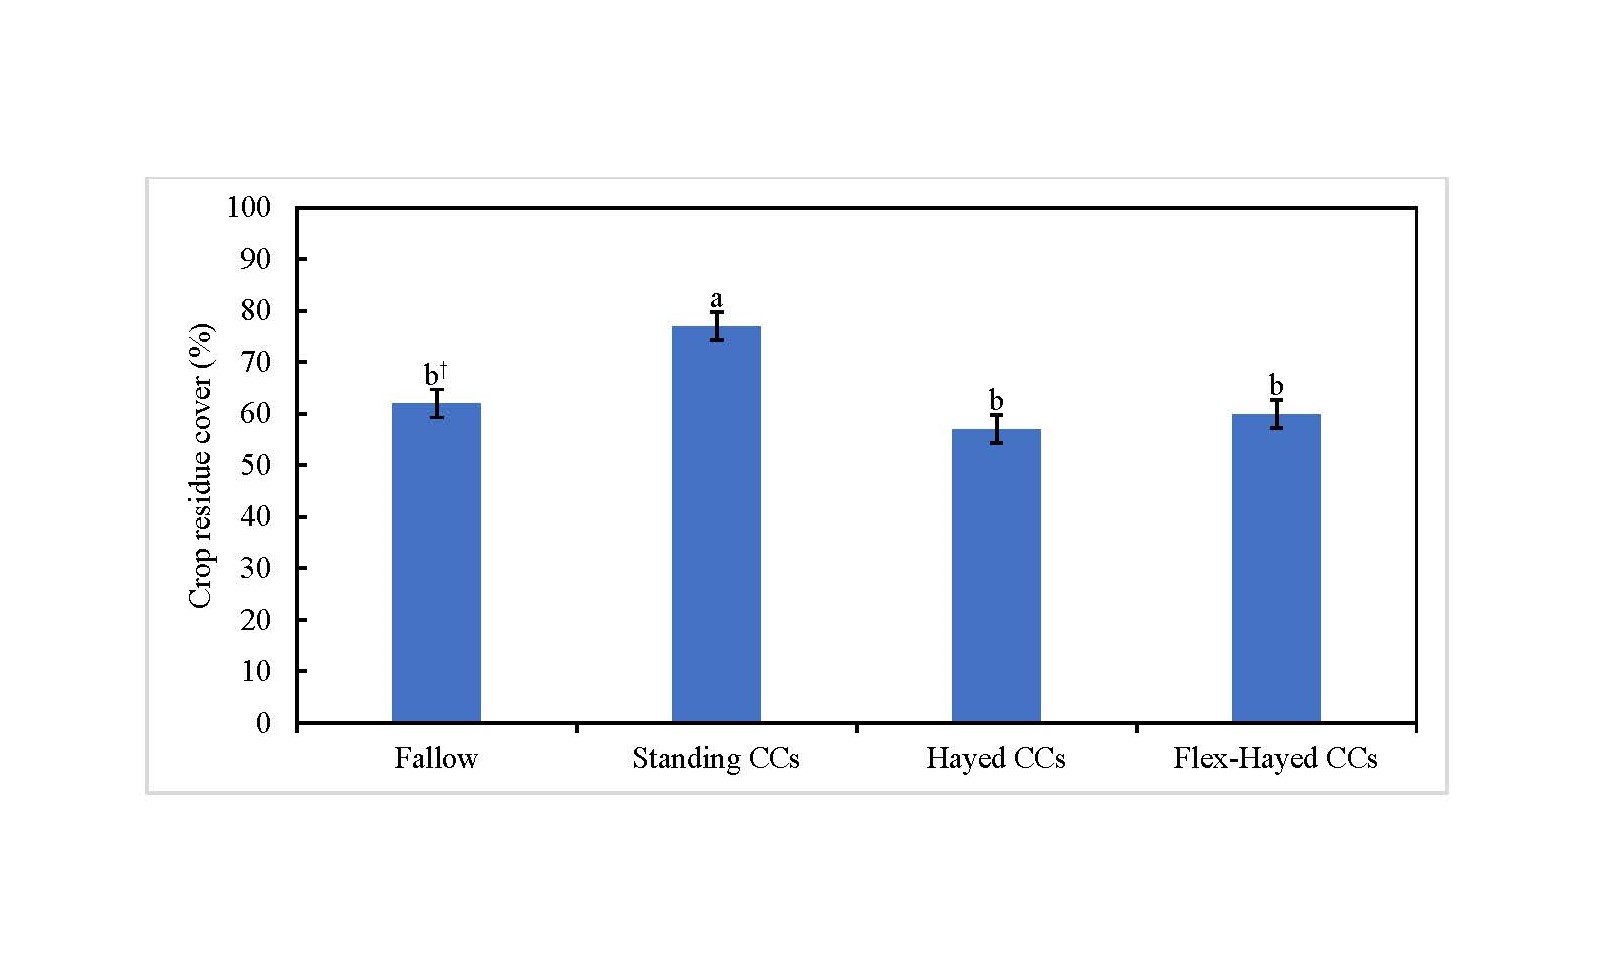
Crop residue cover at winter wheat planting in the fall of 2021 was unaffected by CC management practices compared to chemical fallow at Brownell, KS (Fig. 8). Crop residue cover measured on the fallow plots exceeded 80% at winter wheat planting. However, in the 2022 season, standing CCs increased crop residue cover 29% and 24% compared to fallow at Brownell (Fig 8.) and Garden City, KS (Fig. 9), respectively. Across locations, hayed and flex-hayed CCs had similar levels of crop residue cover compared to fallow. Although CC biomass was removed as hay, the 15 cm cutting height of the forage harvester maintained similar or somewhat greater residue cover compared to fallow.
Across locations in 2021, soil bulk density, SOC stocks, and wind-erodible fraction were unaffected by CC management practices compared to chemical fallow regardless of soil depth (0-5 and 5-15 cm) (Table 6). This indicates that haying or grazing CCs did not cause any soil compaction
compared to standing CCs or fallow. Soil organic carbon is a soil chemical property that is slow to respond to changes in management, especially in semi-arid dryland cropping systems where crop residue inputs are relatively low. Results indicate that hayed and flex-hayed CCs did not affect SOC stocks compared to standing CCs, which suggests that CC biomass removal as hay did not limit organic carbon inputs from crop residue compared to fallow. The flex-hayed CCs were not different compared to the fixed rotations with hayed CCs or fallow. The wind-erodible fraction, which is the fraction of soil <0.84-mm diameter, was unaffected by CC management compared to fallow. This property indicates the susceptibility of the soil to wind erosion though actual soil loss will also be dependent on crop residue cover. In the 2021 growing season at Brownell, crop residue cover was unaffected by CC management compared to fallow (Fig. 8). However, in the 2022 growing season, standing CCs increased crop residue cover compared to fallow though hayed CCs and flex-hayed CCs were not different from fallow.
Table 6. Cover crop management effects on soil physical and chemical properties in the 0-5 and 5-15 cm soil depths at winter wheat planting in 2021 at Brownell and Garden City, KS.
|
Location |
Depth |
Treatment |
Bulk Density |
Soil Organic Carbon |
Wind Erodible Fraction |
|||
|
g cm-3 |
Mg ha-1 |
% |
||||||
|
Brownell |
0-5 cm |
Fallow |
1.17† |
12.6 |
23.9 |
|||
|
Standing CCs |
1.14 |
13.2 |
24.0 |
|||||
|
Hayed CCs |
1.23 |
14.6 |
26.0 |
|||||
|
Flex-Hayed CCs |
1.23 |
16.2 |
25.2 |
|||||
|
5-15 cm |
Fallow |
1.46 |
11.5 |
13.0 |
||||
|
Standing CCs |
1.43 |
13.8 |
12.3 |
|||||
|
Hayed CCs |
1.45 |
10.7 |
12.2 |
|||||
|
Flex-Hayed CCs |
1.42 |
11.3 |
12.7 |
|||||
|
|
|
|
|
|
|
|
|
|
|
Garden City |
0-5 cm |
Fallow |
1.34 |
6.4 |
30.3 |
|||
|
Standing CCs |
1.40 |
7.5 |
29.3 |
|||||
|
Hayed CCs |
1.32 |
6.6 |
37.0 |
|||||
|
Flex-Hayed CCs |
1.33 |
6.6 |
27.1 |
|||||
|
5-15 cm |
Fallow |
1.44 |
13.1 |
16.9 |
||||
|
Standing CCs |
1.41 |
12.2 |
18.2 |
|||||
|
Hayed CCs |
1.46 |
12.4 |
18.5 |
|||||
|
Flex-Hayed CCs |
1.45 |
13.4 |
16.4 |
|||||
†Means are not significantly different (α = 0.05).
In the 2021 growing season at Brownell, all CC management practices (standing, hayed, and flex-hayed) increased the mean weight diameter of water stable aggregates in the 0-2-inch cm soil depth by 39 to 70% compared to chemical fallow (Fig 10). This indicates that CCs could increase mean weight diameter even when CC biomass is harvested for hay or when CCs are used in flexible cropping systems. At Brownell, flex-hayed CC plots were planted to CCs in 2021 but had not been planted in 2018, three years prior in the winter wheat-grain sorghum-fallow cropping system. This indicates that MWD was not limited by a legacy of fallow in this flexible cropping system.
In the 2-6 inch soil depth, mean weight diameter was 78 and 53% greater with standing and flex-hayed CCs compared to fal
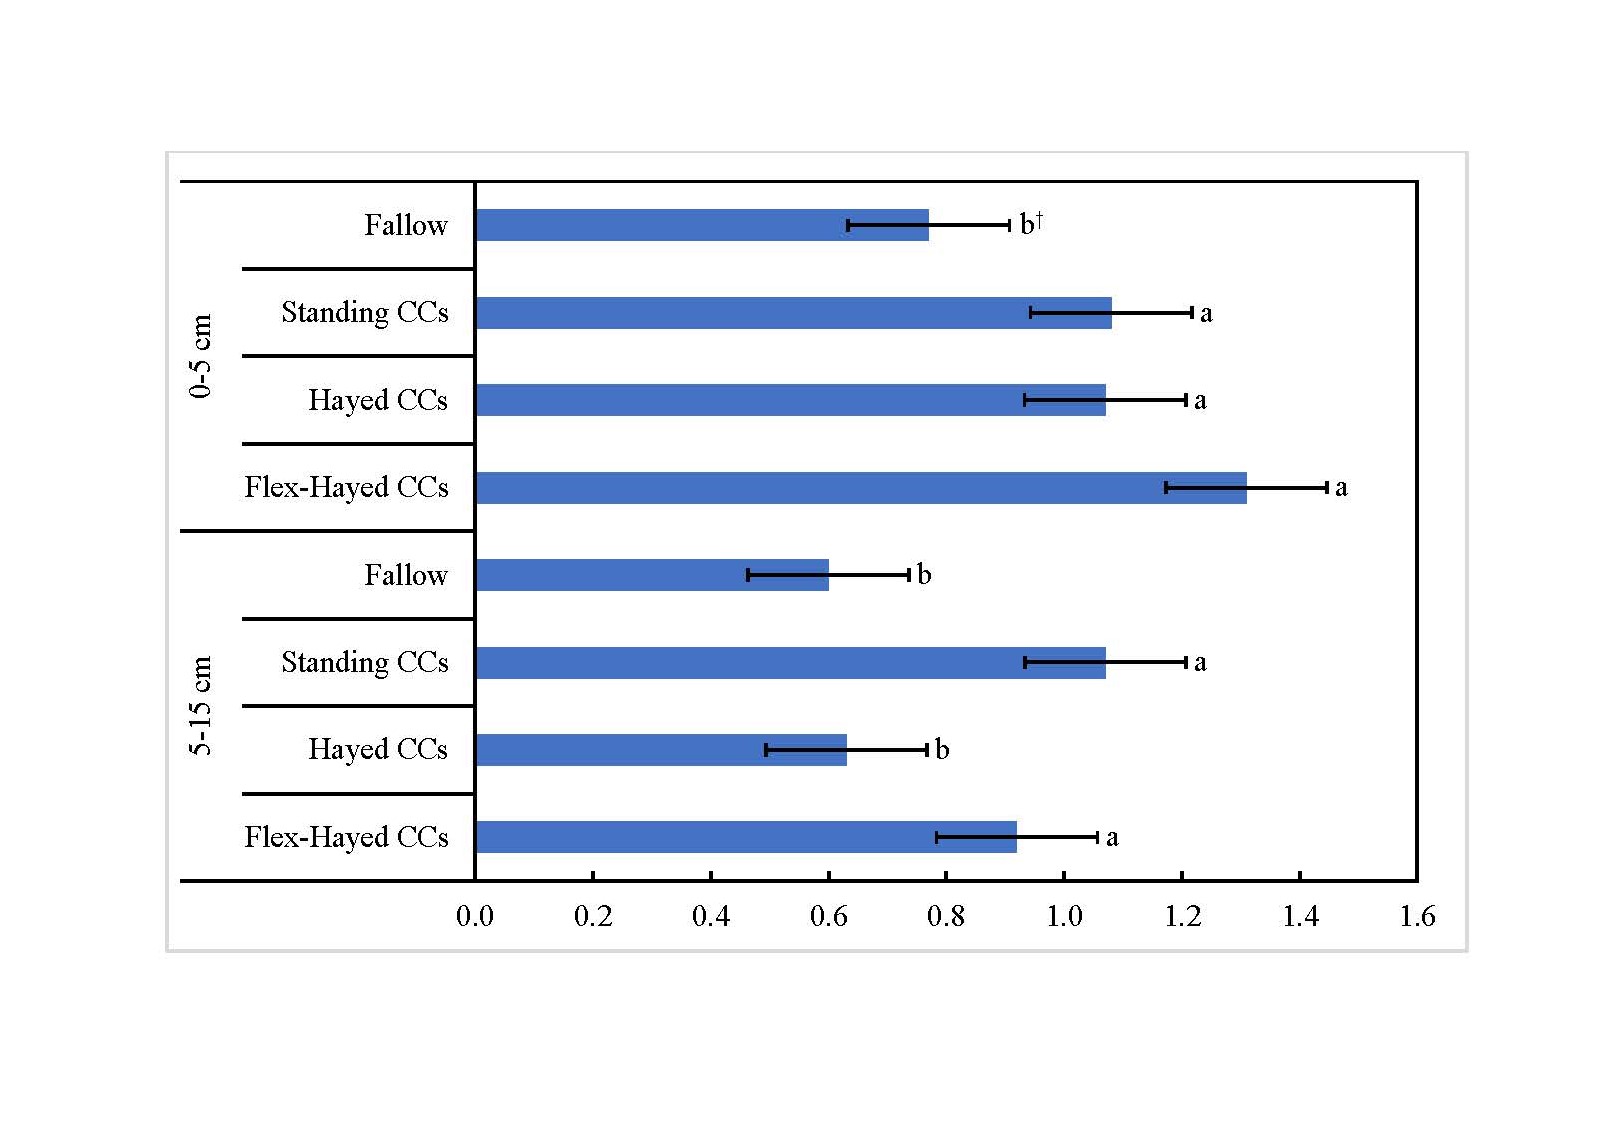
†Error bars indicate standard error (α = 0.05) and bars with the same letter are not significantly different (α = 0.05).
low, respectively (Fig. 10). However, hayed CCs were not significantly different from fallow. This was surprising as past investigations of CC management effects on soil properties have shown treatment differences only in the surface 0-2-inch soil depth. These results suggest that standing CCs can increase mean weight diameter compared to fallow. However, hayed CCs may not always increase mean weight diameter compared to fallow.
In the 2021 growing season at Garden City, standing and hayed CCs increased the mean weight diameter of water stable aggregates in the 0-2-inch soil depth 98% compared to the traditional fallow (Fig. 11). However, flex-hayed CCs were unaffected compared to fallow. These results were similar to those observed at Brownell (Fig. 10) and indicate that CCs could increase mean weight diameter even when CC biomass is harvested for hay. At Garden City, flex-hayed CCs were not planted in 2021 nor in 2018 three years prior in the winter wheat-grain sorghum-fallow cropping system. In both growing seasons, criteria for CC planting were not met so the plots were management the same as the fixed fallow cropping system.
In the 2-6-inch soil depth, MWD was 23% lower under the flex-hayed CCs treatment compared to standing and hayed CCs though all CC management treatments were similar to fallow (Fig. 11). As previously mentioned, flex-hayed CCs had not been planted at Garden City in the 2018 growing season so that this treatment was managed the same as fallow. These results indicate that CCs, whether standing or hayed, may increase mean weight diameter in the 2 to 6-inch soil depth compared to fallow.
In conclusion, standing CCs may increase crop residue cover compared to fallow and hayed CCs may maintain crop residue
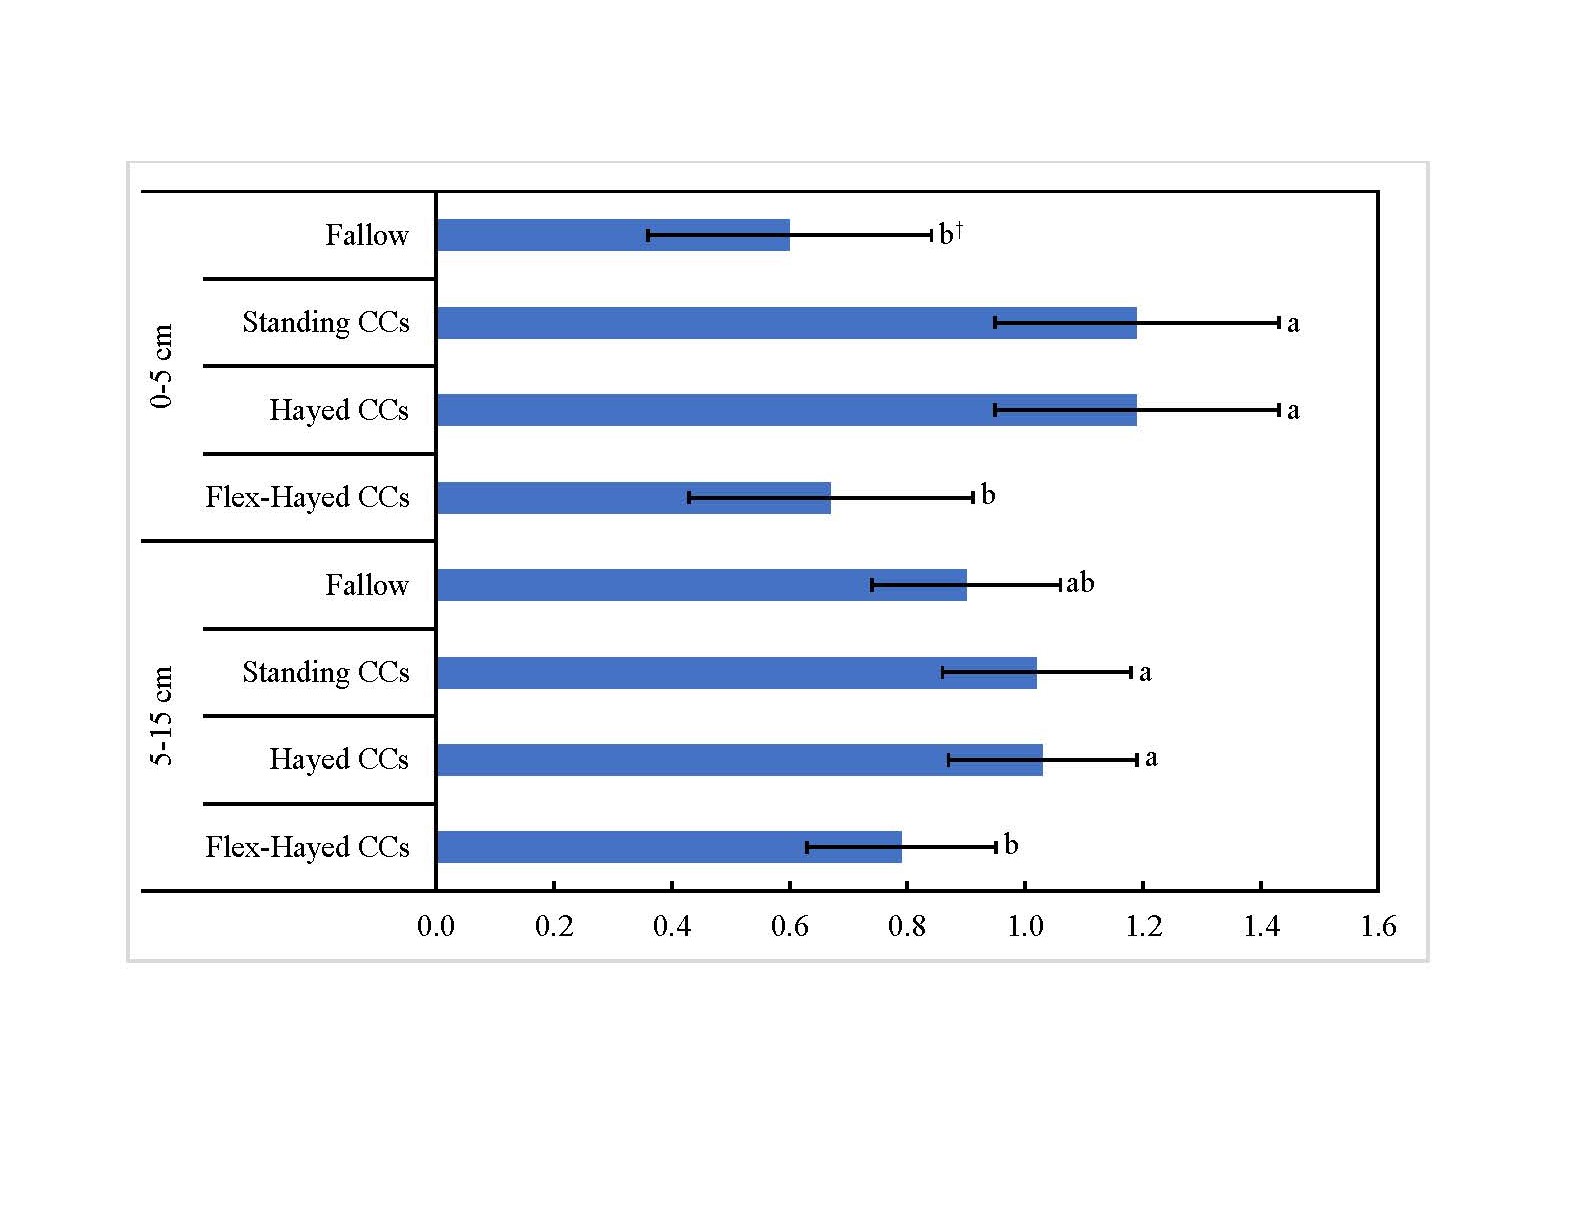
†Error bars indicate standard error (α = 0.05) and bars with the same letter are not significantly different (α = 0.05).
cover when 6-inch stubble remains after harvest. Bulk density, SOC, and wind-erodible fraction were unaffected by CCs compared to fallow. Hayed and flex-hayed CCs were not significantly different from standing CCs. Cover crop management practices may increase mean weight diameter of water stable aggregates compared to fallow in both the 0-5 and 5-15 cm soil depths. Harvesting CCs for hay may limit the effect compared to standing CCs. However, flex-CCs may increase mean weight diameter compared to fallow despite a legacy of fallow in past growing seasons when growing conditions were not favorable for planting a CC.
This research was conducted to fill critical knowledge gap by investigating CC management options to sustainably use CCs to improve soil health while maintaining economic profitability in semi-arid dryland cropping systems. Results showed CC could provide good forage resource for dryland farmers with about 25 to 54 grazing days. However, productivity varied from year to year, and farmers wanting to graze CCs should have alternative forage plans in years when CC forage production is low. Cover biomass after grazing were not different from biomass measured before grazing, confirming significant regrowth of cool season CC species to provide adequate cover to protect the soil. Growing a CC provided significant weed suppression and reduced herbicide application frequency compared to chemical fallow. Cover crops reduced winter wheat yields compared to fallow in 2- out of 5-years. Grazing CCs did not increase bulk density or penetration resistance compared to hayed or non-grazed CCs. The SOC, aggregate size distribution, and mean weight diameter (MWD) of water stable aggregates were not different between grazed and non-graze CCs. Growing CCs (either grazed, or non-grazed) tended to increase residue cover, SOC and aggregate stability compared to chemical fallow. Grazed and hayed CCs provided similar soil health benefits compared standing CCs. However, residue management is more critical to maintain soil health. In years when CC productivity is limited by growing conditions, grazing is preferred to haying of CCs to maintain adequate residue cover on the soil surface. Findings of this research suggest CCs can be grazed or hayed in no-tillage (NT) dryland cropping systems with no negative effects on soil properties, and crop yields compared to standing CCs or fallow. Therefore, we recommend grazing of CCs enrolled in National Resource Conservation Service (NRCS) cost-share programs as a management strategy for farmers to integrate CCs in dryland cropping systems to balance profitability, increase CC adoption and improve soil health in water-limited production systems.
Project Activities
Educational & Outreach Activities
Participation summary:
Journal articles
- Blanco-Canqui, H., S.J. Ruis, J. Holman, C. Creek, A. K. Obour. 2022. Can cover crops improve soil ecosystem services in water‐limited environments? A review. Soil Sci. Soc. Am. J.86:1-18 https://doi.org/10.1002/saj2.20335.
- Obour, A.K., J.A. Dille, J.D. Holman, L.M. Simon, B. Sancewich and V. Kumar. 2022. Spring-planted cover crop effects on weed suppression, crop yield and net returns in no-tillage dryland crop production. Crop Science https://doi.org/10.1002/csc2.20801.
- Obour, A.K., J. D. Holman, Y. Assefa. 2022. Single and multi-species dual-purpose cover crop productivity, nutritive value, and profitability. Agrosystems, Geosciences & Environment,5, e20275.https://doi.org/10.1002/agg2.20275.
- Simon, L.M. A. K. Obour, J. D. Holman, and L. Roozeboom. 2022. Long-term cover crop management effects on soil properties in dryland cropping systems. Agric. Ecosyst. Environ. 328, 107852 https://doi.org/10.1016/j.agee.2022.107852.
- Obour, A., J. Holman, S. Johnson, D. Presley, K. Roozeboom, and L. Simon. 2022. Does grazing cover crops impact soil properties? Agronomy eUpdate, issue 905. https://eupdate.agronomy.ksu.edu/article_new/does-grazing-cover-crops-impact-soil-properties-493.
- Holman, J.D., Y. Assefa, and A.K. Obour. 2021. Cover crop water use and productivity in the high plains wheat-fallow crop rotation. Crop Science, 61: 1374-1385.
- Holman, J., A. Obour, Y. Assefa. 2021. Productivity and profitability with fallow replacement forage, grain, and cover crops in W‐S‐F rotation. Crop Sci. 62:913-927. https://doi.org/10.1002/csc2.20670
- Holman, J., A. Obour, Y. Assefa. 2021. Fallow replacement cover crops in a semi-arid High Plains cropping system. Crop Sci. 61:3799-3814. https://doi.org/10.1002/csc2.20543
- Obour, A.K., M. Simon, J.D. Holman, P.M. Carr, M. Schipanski, S. Fonte, R. Ghimire, T. Nleya & H. Blanco-Canqui. 2021. Cover crops to improve soil health in the north American Great Plains. Agron. J. 113:4590–4604. http://dx.doi.org/10.1002/agj2.20855.
- Simon, L.M, K. Obour, J.D. Holman, S.K. Johnson and K. L. Roozeboom. 2021. Forage productivity and soil properties in dual‐purpose cover crop systems. Agron. J. 113; 5569-5583. http://dx.doi.org/10.1002/agj2.20877.
- Obour, A.K., L. Simon, J. Holman & Sandy Johnson. 2021. Does grazing cover crops impact soil properties? Agronomy eUpdate, Issue 868 Agronomy eUpdate August 12th, 2021 : Issue 868 (ksu.edu).
- Homan, J.D., A. Schlegel, A.K. Obour, and Y. Assefa. 2020. Dryland cropping system impact on forage accumulation, nutritive value, and rainfall use efficiency. Crop Science.2020;1–15. https://doi.org/10.1002/csc2.20251.
- Holman, J.D., Y. Assefa, and A.K. Obour.2020. Cover Crop Water Use and Productivity in the High Plains Wheat-Fallow Crop Rotation. Crop Science https://doi.org/10.1002/csc2.20365.
- Kumar, V., A. Obour, P. Jha, R. Liu, M. R. Manuchehri, J. A. Dille, J. Holman7, and P. W. Stahlman. 2020. Integrating cover crops for weed management in the semi-arid U.S. Great Plains: opportunities and challenges. Weed Sci. 68: 311-323. DOI: 10.1017/wsc.2020.29.
- Obour, A.K., J. D. Holman, and A.J. Schlegel. 2020. Spring triticale forage responses to seeding rate and nitrogen application. Agrosyst. Geosci. 3:e20053. https://doi.org/10.1002/agg2.20053.
Extension and Proceedings publications
- Dhanda, S., V. Kumar, A.K. Obour, A. Dille, and J.D. Holman. 2022. Fall-planted cover crops for weed suppression in western Kansas. Kansas Agricultural Experiment Station Research Reports: Vol. 8: Iss. 4. https://doi.org/10.4148/2378-5977.8308.
- Simon, L. M.; A.K. Obour, J.D. Holman, S.K. Johnson, and K.L. Roozeboom. 2022. Spring and summer cover crop effects on dryland wheat and grain sorghum yields in western Kansas. Kansas Agricultural Experiment Station Research Reports: Vol. 8: Iss. 4. https://doi.org/10.4148/2378-5977.8313.
- Simon, L. M.; A.K. Obour, J.D. Holman, S.K. Johnson, and K.L. Roozeboom. 2022. Cover crop grazing effects on soil compaction indicators in western and central Kansas. Kansas Agricultural Experiment Station Research Reports: Vol. 8: Iss. 4. https://doi.org/10.4148/2378-5977.8312.
- Simon, L. M., K. Obour, J. D. Holman, S. K. Johnson, and K. L. Roozeboom, K. 2021. Forage accumulation of spring and Summer cover crops in western Kansas. Kansas Agricultural Experiment Station Research Reports: Vol. 7: Iss. 5. https://doi.org/10.4148/2378-5977.8134.
- Simon, L. M.; K. Obour, J. D. Holman, S. K. Johnson, and K.L. Roozeboom. 2021. Dual-Purpose cover crop effects on soil health in western Kansas no-till dryland cropping. Kansas Agricultural Experiment Station Research Reports: Vol. 7: Iss. 5. https://doi.org/10.4148/2378-5977.8135.
- Obour, A.K., L. Simon, J. Holman & Sandy Johnson. 2021. Does grazing cover crops impact soil properties? Agronomy eUpdate, Issue 868 Agronomy eUpdate August 12th, 2021 : Issue 868 (ksu.edu).
- Obour, A. K., L.M. Simon, J. D. Holman and S. K. Johnson. 2021. Does grazing cover crops impact soil properties? Kansas Agricultural Experiment Station Research Reports: Vol. 7: Iss. 5. https://doi.org/10.4148/2378-5977.8078
- Simon, L.M., A.K. Obour, J.D. Holman, K.L. Roozeboom. 2020. Long-term cover crop and annual forage effects on soil organic carbon, nitrogen stocks, and water stable aggregates in the semiarid central Great Plains. In Proc. of the Great Plains Soil Fertility Conf., 2020. Vol. 18:203-207.
- Johnson, S., J. Brummer, A. Obour, A. Moore, J. Holman, and M. Schipanski. 2020. Cover crop grown post-wheat for forage under dryland conditions in the High Plains. Kansas State Univ. Agric. Expt. Station & Coop. Ext. Publication no. MF3523. https://bookstore.ksre.ksu.edu/pubs/MF3523.pdf.
- Simon, L. M. A.K. Obour, J. D. Holman, and K. L. Roozeboom. 2020. Long-Term Cover Crop Management Effects on Soil Health in Semiarid Dryland Cropping Systems, Kansas Agricultural Experiment Station Research Reports: Vol. 6: Iss. 5. https://doi.org/10.4148/2378-5977.7927.
- Obour, A. K.; Holman, J. D.; Simon, L. M.; and Johnson, S. K. 2020. Dual use of cover crops for forage production and soil health in dryland crop production. Kansas Agricultural Experiment Station Research Reports: Vol. 6: Iss. 5. https://doi.org/10.4148/2378-5977.7930.
- Obour, A. K., J. D. Holman, J. A. Dille, and V. Kumar. 2019. Effects of spring-planted cover crops on weed suppression and winter wheat grain yield in western Kansas. Kansas Agricultural Experiment Station Research Reports: Vol. 5: Iss. 6. https://doi.org/10.4148/2378-5977.7784.
- Obour, A. K., J.D. Holman, and J. R. Jaeger. 2019. Cover crop management effects on soil water content and winter wheat yield in dryland systems. Kansas Agricultural Experiment Station Research Reports: Vol. 5: Iss. 6. https://doi.org/10.4148/2378-5977.7785.
Presentation
- Obour, A.K, and J. Holman. 2022. Cover crops as forages in the western Great Plains. American Forage & Grassland Council Conference. Jan 9-12, 2022. Wichita, KS.
- Obour, A.K. 2022. Cover crop management for soil health. Fall Field Day, August 25, 2022, Garden City, KS.
- Obour, A.K. 2022. Cover crop management options for dryland systems. Producer meeting in Ellsworth, KS. March 30, 2022.
- Obour, A.K., and L. Simon. 2022. Demonstrating in field measurements of soil physical properties. Soil Health Workshop, May 18-19 in Hays, KS.
- Obour, A. K., Simon, L. M., Holman, J. D., & Johnson, S. K. (2021) Effects of grazing cover crops on soil properties in no-till rain-fed cropping systems in west central Kansas [Abstract]. ASA, CSSA, SSSA International Annual Meeting, Salt Lake City, UT. https://scisoc.confex.com/scisoc/2021am/meetingapp.cgi/Paper/133324
- Simon, L. M., Obour, A. K., Holman, J. D., Schipanski, M. E., Johnson, S. K., & Roozeboom, K. L. (2021) Post-wheat summer cover crop effects crop yields and soil properties in a no-till dryland cropping system [Abstract]. ASA, CSSA, SSSA International Annual Meeting, Salt Lake City, UT. https://scisoc.confex.com/scisoc/2021am/meetingapp.cgi/Paper/134639.
- Obour, A.K. J. D. Holman, & L. Simon. 2021. Cover crops to improve soil health in dryland systems. Invited Guest Lecture, Fort Hays State University, Hays, KS, October 4, 2021
- Obour, A.K. J. D. Holman, & L. Simon. 2021. Cover crop management options to improve soil health in dryland systems. Bottom Line Conference, Lakin, KS, August 25-26, 2021
- Obour, A.K., J. D. Holman, & L. Simon. 2021. Western Kansas cover crop research update. Kansas Soil Partnership Monthly Meeting, Virtual, April 28, 2021.
- Obour, A.K, J.D. Holman, L. Simon and S. Johnson. Dryland Cover Crops Grazing Research in Western Kansas. Northwest Agronomy Update, Ness City, KS. December 7, 2021.
- Obour, A.K, J.D. Holman, L. Simon and S. Johnson. Dryland cover crop grazing research in western Kansas. Cattle Conversations, Virtual, December 23, 2021.
- Obour, A.K. J. D. Holman, & L. Simon. 2021. Cover crop grazing research in western Kansas. Tear Down the Walls Meeting, Fort Collins, CO. August 16-17, 2021.
- Obour, A.K. J. D. Holman, & L. Simon. 2021. Cover crop options for dryland systems. Tailgate Talk and Field day. Russell County, KS. July 28, 2021
- Obour, A.K. J. D. Holman, & L. Simon. 2021. Cover crops to improve soil health in dryland systems. Producer Meeting, Hay, KS. Nov 18, 2021.
- Obour, A.K. J. D. Holman, & L. Simon. 2021. Cover crops to improve soil health in dryland systems. Producer Meetings, Norton, KS. December 6, 2021.
- Obour, A.K., J.D. Holman and L. Simon. 2020. Dual use of cover crops for forage and soil health in dryland cropping systems. Women Managing farms conference, Fe.13-14, 2020, Manhattan, KS.
- De Jesus, D.M., A.K. Obour, V. Acosta-Martinez, J. Holman, and M. Vandeveer. 2019. Soil microbial community response to long-term cover crop use in dryland systems of the central Great Plains. ASA-CSSA International Annual Meeting, San Antonio, TX, Nov. 10-13, 2019. In ASA-CSSA-SSSA Abstracts 2019 [CD-ROM]. ASA, CSSA, and SSSA, Madison, WI.
- Obour, A.K., J.D. Holman and Sandy Johnson. Annual forage fertility management and soil health. Southwest Kansas Forage Conference. Feb. 27, 2020, Garden City, KS.
- Obour, A.K., J.D. Holman, L. M. Simon and S. Johnson. 2020. Dual use of cover crops for forage and soil health in dryland systems. ASA-CSSA-SSSA International Annual Meeting, Virtual, Nov. 9-13, 2020. In ASA-CSSA-SSSA Abstracts 2020 [CD-ROM]. ASA, CSSA, and SSSA, Madison, WI.
- Simon, M. L., A. K. Obour, J. D. Holman, K. L. Roozeboom. 2020. Dual-purpose cover crops for soil health and forage production in the semiarid central Great Plains. ASA-CSSA-SSSA International Annual Meeting, Virtual, Nov. 9-13, 2020. In ASA-CSSA-SSSA Abstracts 2020 [CD-ROM]. ASA, CSSA, and SSSA, Madison, WI.
- Holman, J.D., K. Obour, L. Simon, A.J. Schlegel. 2020. Long-term forage rotation yields, soil water use, and profitability. In Proc. of the Great Plains Soil Fertility Conf., 2020. Vol. 18:158-164.
- Simon, L.M., K. Obour, J.D. Holman, K.L. Roozeboom. 2020. Long-term cover crop and annual forage effects on soil organic carbon, nitrogen stocks, and water stable aggregates in the semiarid central Great Plains. In Proc. of the Great Plains Soil Fertility Conf., 2020. Vol. 18:203-207.
- Holman, J., and A. Obour. 2019. Cover crop use in a semi-arid wheat-sorghum-fallow cropping system. ASA-CSSA-SSSA International Annual Meeting, Nov. 11-14, 2019. San Antonio, TX. In ASA-CSSA-SSSA Abstracts 2019 [CD-ROM]. ASA, CSSA, and SSSA, Madison, WI.
- Simon, L., A.K. Obour, J.D. Holman, K.L. Rooseboom. 2019. Long-term cover crop effects on soil organic carbon, nitrogen stocks, and water stable aggregates in the semiarid central Great Plains. ASA-CSSA International Annual Meeting, San Antonio, TX, Nov. 10-13, 2019. In ASA-CSSA-SSSA Abstracts 2019 [CD-ROM]. ASA, CSSA, and SSSA, Madison, WI.
Workshop and field days
- Organized a two-day Soil health demonstration workshop in collaboration with KCARE, Kansas NRCS and Soil health Nexus on May 18-19, 2022 in Hays, KS
- Organized Dryland Soil Health Network Kickoff Meeting at Hays, KS on Feb. 18, 2020. There were 30 participants (farmers, Ag retailers, NRCS Staff and K-State Research and extension faculty) at the meeting. Overall goal of the dryland soil health initiative is to advance soil management strategies to improve soil health and crop productivity of dryland cropping systems through participatory research learning.
- Obour, A.K. 2020. Dual use of cover crops for forage and soil health in dryland cropping systems. Western Kansas Agricultural Research Center Virtual Field Day, Aug. 26, 2020.
- Holman, J.D. 2020. A decade of dryland cover crop research in western Kansas. Western Kansas Agricultural Research Center Virtual Field Day, Aug. 27, 2020.
- Organized a cover crop field day with collaborator producer near Marquette, KS on August 24, 2021. Topic covered included using cover crops for grazing; management options for soil health; cover crops and water quality, and NRCS cover crop programs (45 farmer attendees)
- Organized cover crop field day on producer field on May 25, 2021 at Hays Kansas. Topic covered included using cover crops for grazing; management options for soil health; cover crops and water quality, and NRCS cover crop programs (45 farmer attendees)
Radio Interviews
- Grazing cover crops and soil health with K-State Agricultural Today on Feb. 13, 2020 in Manhattan, KS.
- Dryland soil health initiative with Eagle Radio on Feb. 14, 2020 in Hays, KS.
- No-till magazine: Cover crop as fallow alternative in dryland systems. 07/19/2021.
- K-State Agriculture today: soil properties in dual-purpose cover crop systems. 08/09/2021.
- Harvest Public Media: Cover crops in dryland environments. 08/12/21.
- K-State Agriculture today: Grazing cover crops impacts on soil bulk density and soils health 03/23/2022.
Learning Outcomes
- Cover crop management options and their effect on crop yields and soil properties. In field assessment of soil physical properties.
Project Outcomes
Integrating grazing cover crops in their crop production system
Farmers were very pleased with the number of grazing days cattle can graze cover crops without having to be pastures or feeding hay.
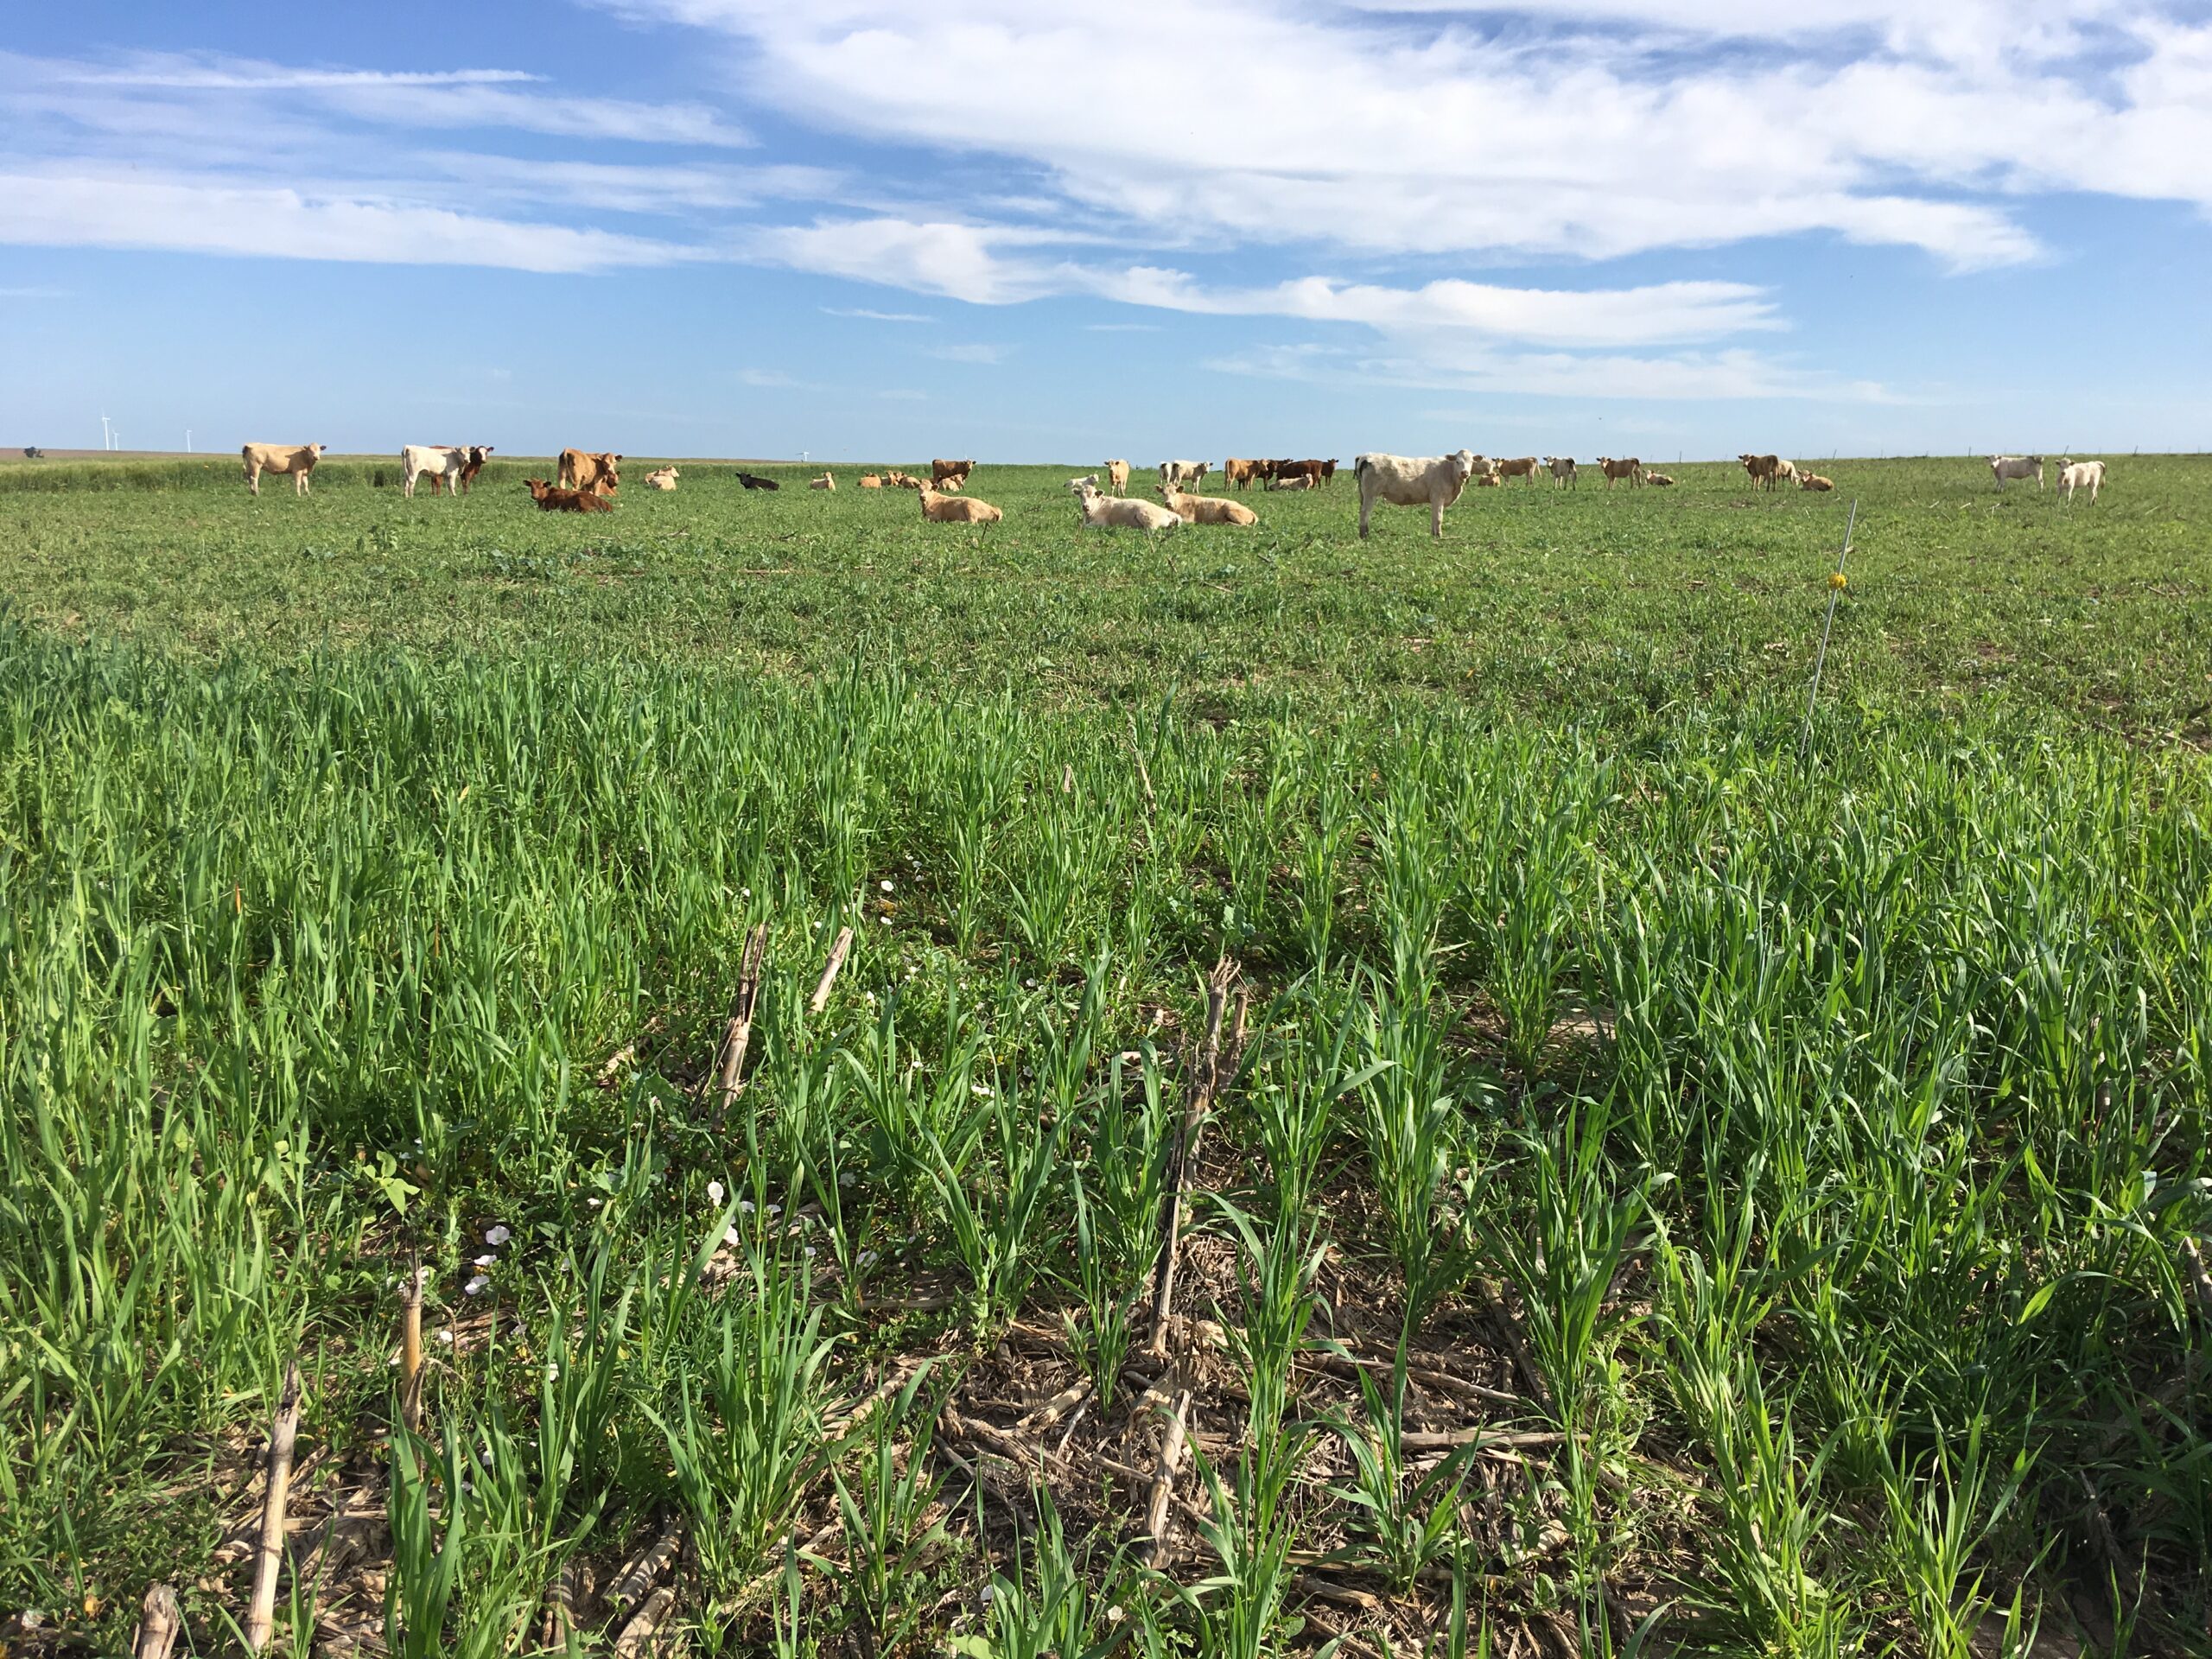
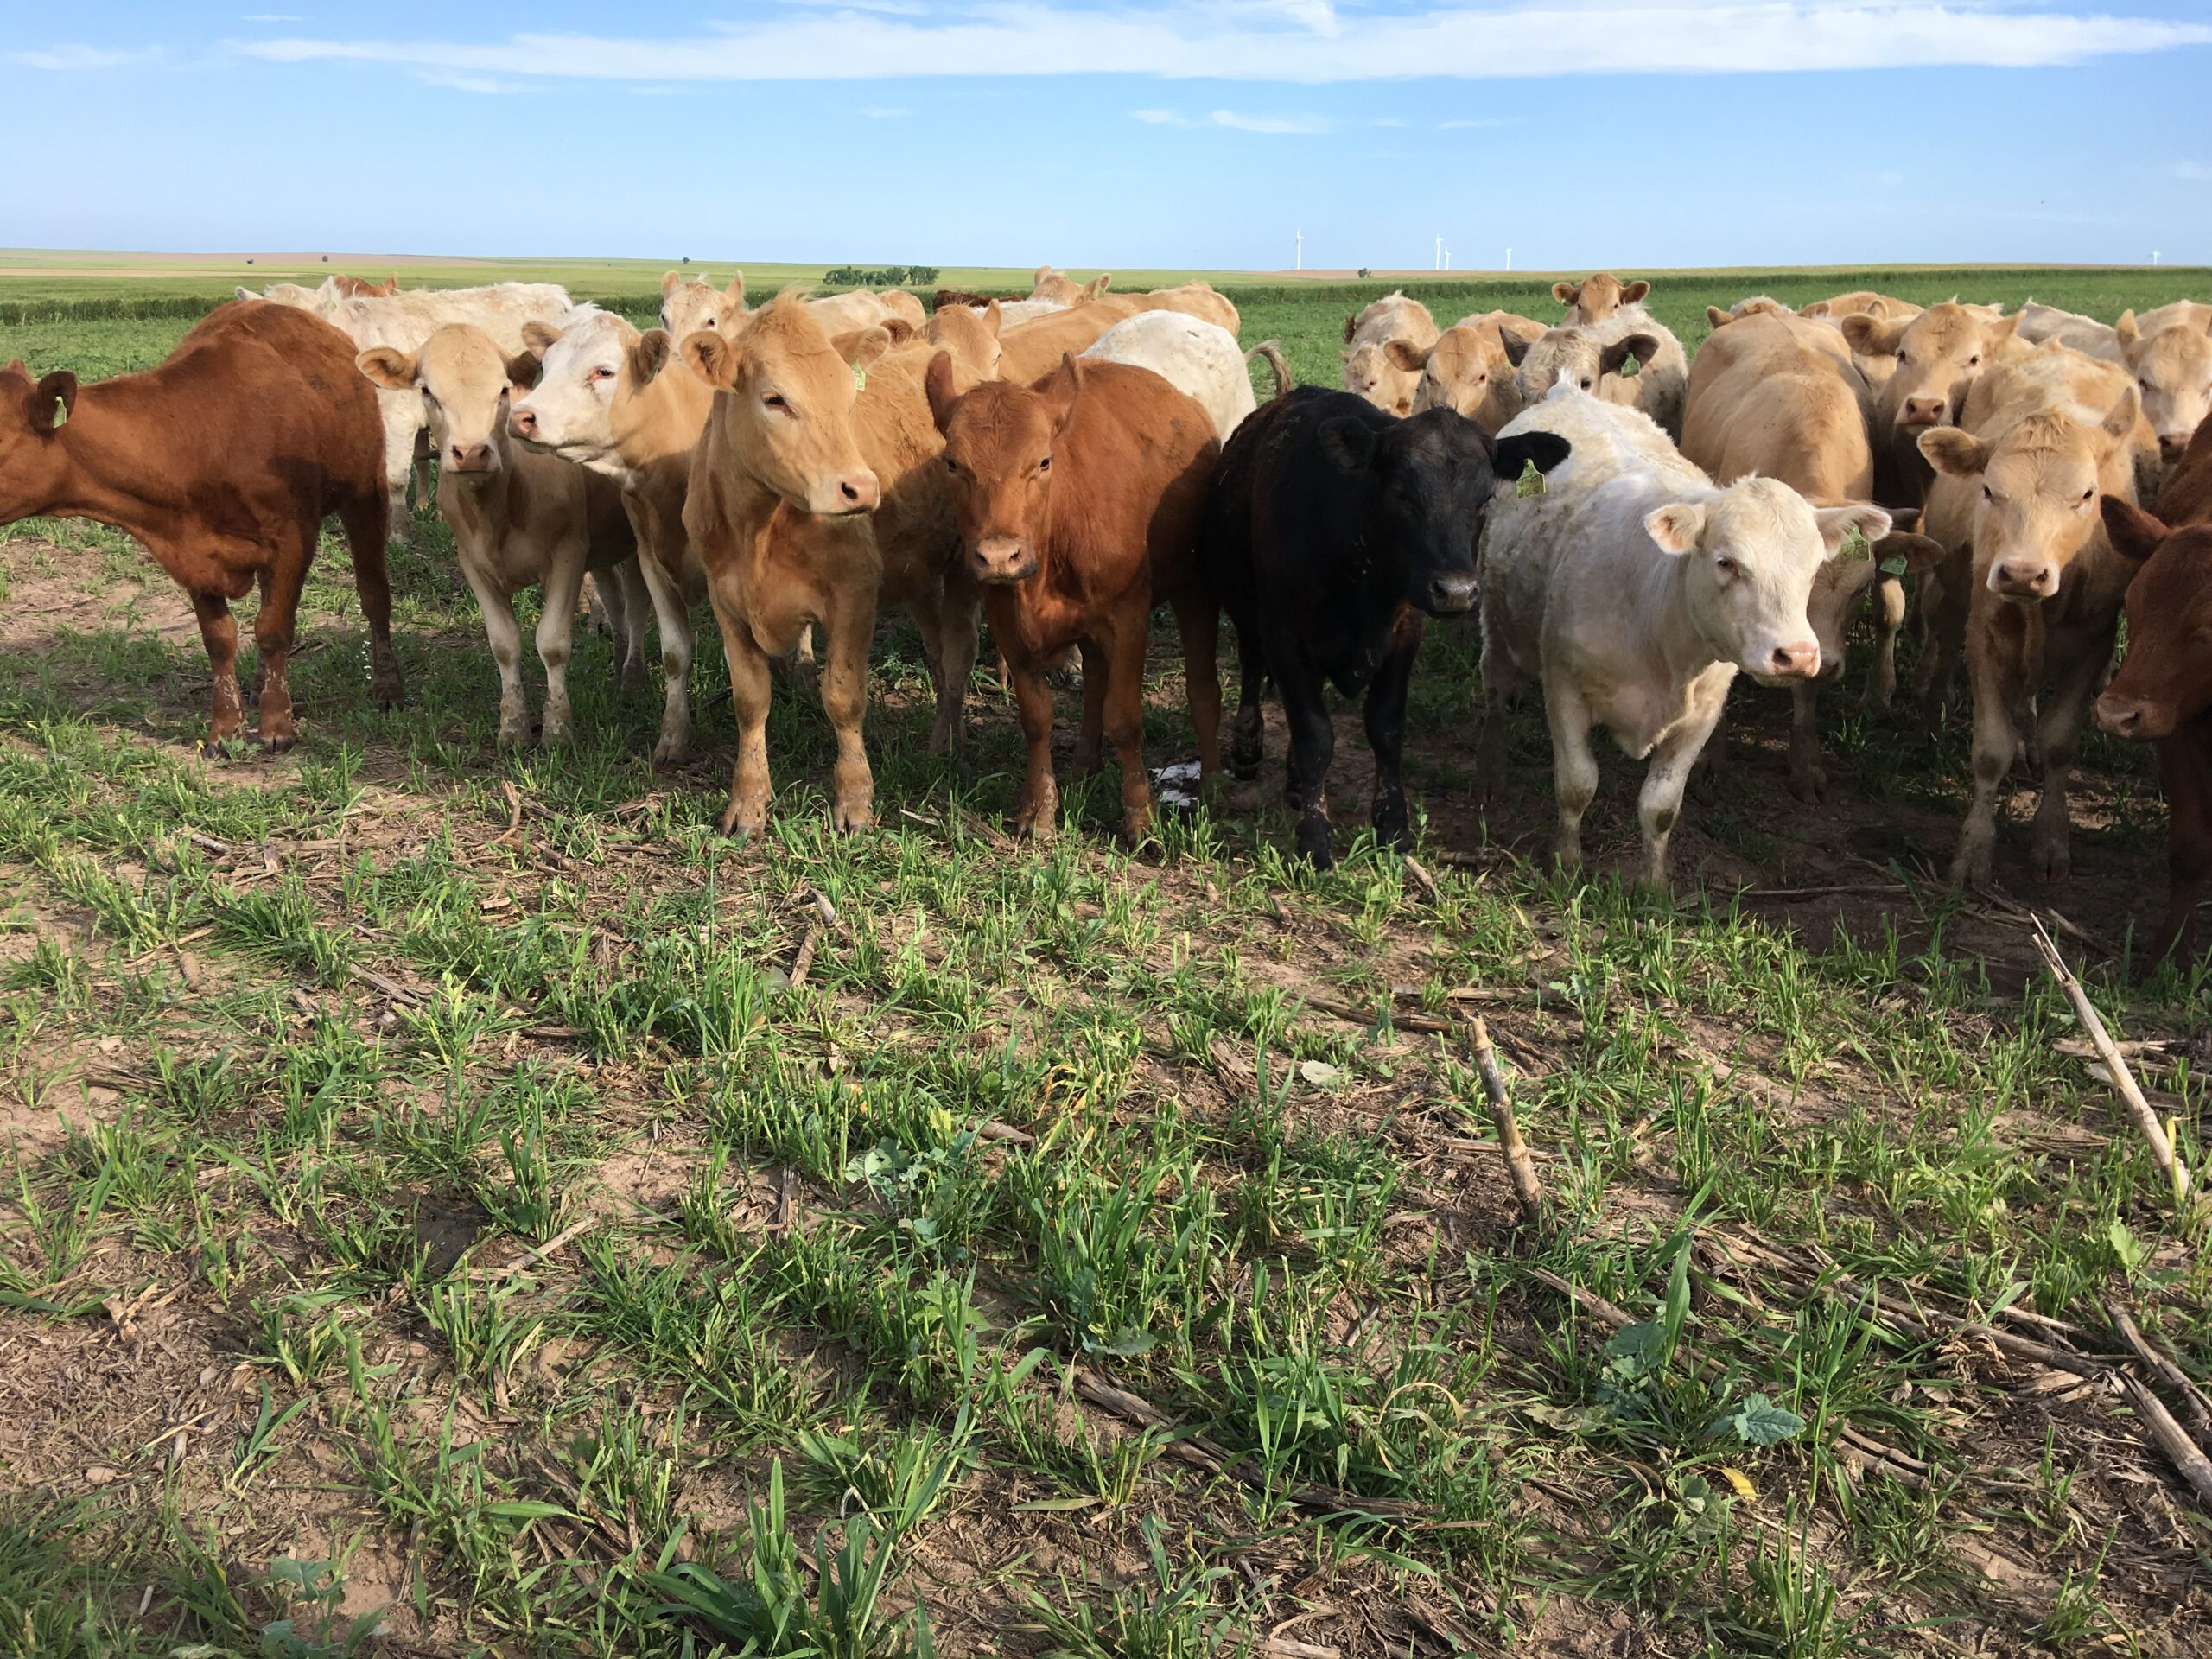
Long-term cover crop grazing research, amount of cover crop biomass removed, stocking rate and their impacts on crop yields, residue cover and soil properties