Final report for LNC18-413
Project Information
Beef producers in Northern Michigan are seeking to increase the supply of and demand for localized beef value chains. Building upon a 2012 USDA NCR-SARE R&E grant that developed a northwest Michigan grass-fed beef chain, this proposal seeks to address remaining challenges related to beef quality and product consistency, annual supply, the high cost of beef production and subsequently high retail price. In order to diversify the production systems, a natural grain-finished system will be investigated in the region, in addition to the established grass-fed system to compare carcass quality, beef sensory, and overall production performance and consistency. In both systems, we have introduced Akaushi (AK) beef genetics, a Red Wagyu that is known for high marbling. Our hypothesis is that these genetics will help the grass-fed cattle more consistently grade choice. Therefore, we have two different genetic combinations of cattle: AK X Red Angus (RA); (high fat) compared to RA (moderate fat) with in the grass- and grain-fed localized production systems. Investigation of these two systems allow for broader comparative research, including indicators of healthfulness in grass and grain-fed beef. We will investigate the impact of genetics and management on fatty acid profiles and secondary compound content (such as polyphenols) known for cardiovascular health benefits. We will also develop enterprise budgets for each beef production system researched. To ensure research findings are suitable to be integrated into the value chain, beef producers and consumers will be surveyed and will interact via focus groups for greater understanding of barriers and prospects in expanding local beef, including their perceptions on the two beef production systems. The project outcomes coalesce with the NCR-SARE broad-based outcomes of improving lives for people and sustaining our resource base in a profitable way. Although Michigan-focused, this value chain project is not geographically limited and is scalable to the entire North Central Region.
1. Determine impact of Akaushi genetics on grass and natural grain-fed beef performance, quality, consistency
2. Assess genetics and finishing strategy impact on beef healthfulness and sensory attributes
3. Generate enterprise budgets and producer decision tools
4. Determine participant attitudes, beliefs, behaviors, willingness to purchase grass or natural grain-fed beef Outcomes
Short-term: Increased understanding of producer and consumer attitudes toward beef finishing systems, economics and cost
Medium-term: Improvements in beef product consistency and healthfulness
Long-term: Increased local cattle supply marketed through value chain, affordable beef for consumers
A recent study from our laboratory indicates that grass finishing model is a considerable Carbon sink (Stanley et al., 2018). To further our work and align with NCR-SARE’s call for resilient agricultural systems, we systematically address challenges in the grass finishing models. We will research linkages of plant (pasture) biological diversity and beef healthfulness, economic sustainability, and social well-being.
Beef is a complex issue with respect to human health. Although beef has a tremendous balance of amino acids and important minerals and vitamins (Williamson et al., 2005), there is concern regarding its high level of saturated fat. Therefore, there is a need to improve beef healthfulness. Duckett et al., (2009) indicates the nutritional benefits of grass-fed beef are lower fat and higher omega 3 (n-3) fat content which has been shown to reduce coronary disease. However, Van Elswyk and McNeil (2014) indicate that due to overall grass-fed beef carcass leanness, grain-fed beef has comparable concentrations of n:3 fatty acids but also a greater omega 6 (n:6)- n:3 ratio. While there is no daily reference value for the n-6:n-3 ratio, it is suggested that a healthy diet should be between 1:1-4:1 (Daley et al., 2010). Our hypothesis is that can we increase carcass fatness in grass-fed beef thereby increasing beef n:3 fatty acid content.
Importantly, we aim to link forage biodiversity to beef nutritive content, namely through the hypothesis of increasing important secondary compounds (polyphenols) in beef with forages that have high concentrations of secondary compounds. Little information is available comparing forage biodiversity to a feedlot ration for beef polyphenols. Forage legumes and grasses rich in polyphenols (as an example, tannins in trefoil) have gained interest in ruminant nutrition not only regarding meat quality issues but because of lowering enteric methane and other greenhouse gas emission and parasitic worm burdens (Girard et al., 2016). We believe forage biodiversity will result in increased beef polyphenol content. Important to health human, epidemiologic studies indicate high polyphenol intake is associated with decreased risk of cardiovascular disease (CVD) and cancer (Okarter & Liu, 2010; Vauzour et al., 2010).
Our laboratory has also worked to improve grass-fed beef quality grade. Our data indicate that in an 18-20 mo model, 35-40% of cattle grade choice. Thus, we have introduced Red Wagyu (Akaushi) breeding to test if this increases the percent of cattle grading choice. We believe that using forages to encourage n:3 deposition, combined with the potential higher marbling of Akaushi will produce a nutritionally superior beef product. This combined with the polyphenolic investigation provides a unique research framework and to our knowledge, not approached in the scientific literature.
For context, and to compare to the grass-finishing system, we will implement a non-GMO, natural-feedlot beef production system. This gives comparison to aspects of biodiversity on polyphenols and also to test the impact of genetics (Akaushi X Red Angus versus Red Angus) on carcass merit, fatty acid profiles, beef sensory dynamics and economics. Importantly, there may be economic benefits of implementing both production methods in an existing system.
Stonebarn’s report identified a need to increase and establish high-quality grass-fed beef to further differentiate domestic from imported grass-fed beef (Cheung et al., 2017). Thus investigation into improving grass-fed beef quality and healthfulness is needed. Secondly, our investigation into the impact of plant diversity, an important component of environmental sustainability on polyphenol content in forages and beef, is a novel approach to link forage biodiversity to beef nutrient density and ultimately human health. We will also assess the natural, grain-fed beef model for production and economic comparisons.
Research
We hypothesized that Akaushi would have a higher carcass grade and better meat quality compared to Angus in grass finishing systems. The objectives of this study were to evaluate the influence of beef genotype on the performance, carcass characteristics, meat quality, and sensory attributes of cattle finished on either grass or grain systems. This information sets the stage for the impact of beef genotype and finishing systems on fatty acids composition that will be explored in future publications.
The Michigan State University Institutional Animal Care and Use Committee approved the research protocols for the use of animals and procedures (IACUC #201800155).
Experimental Design
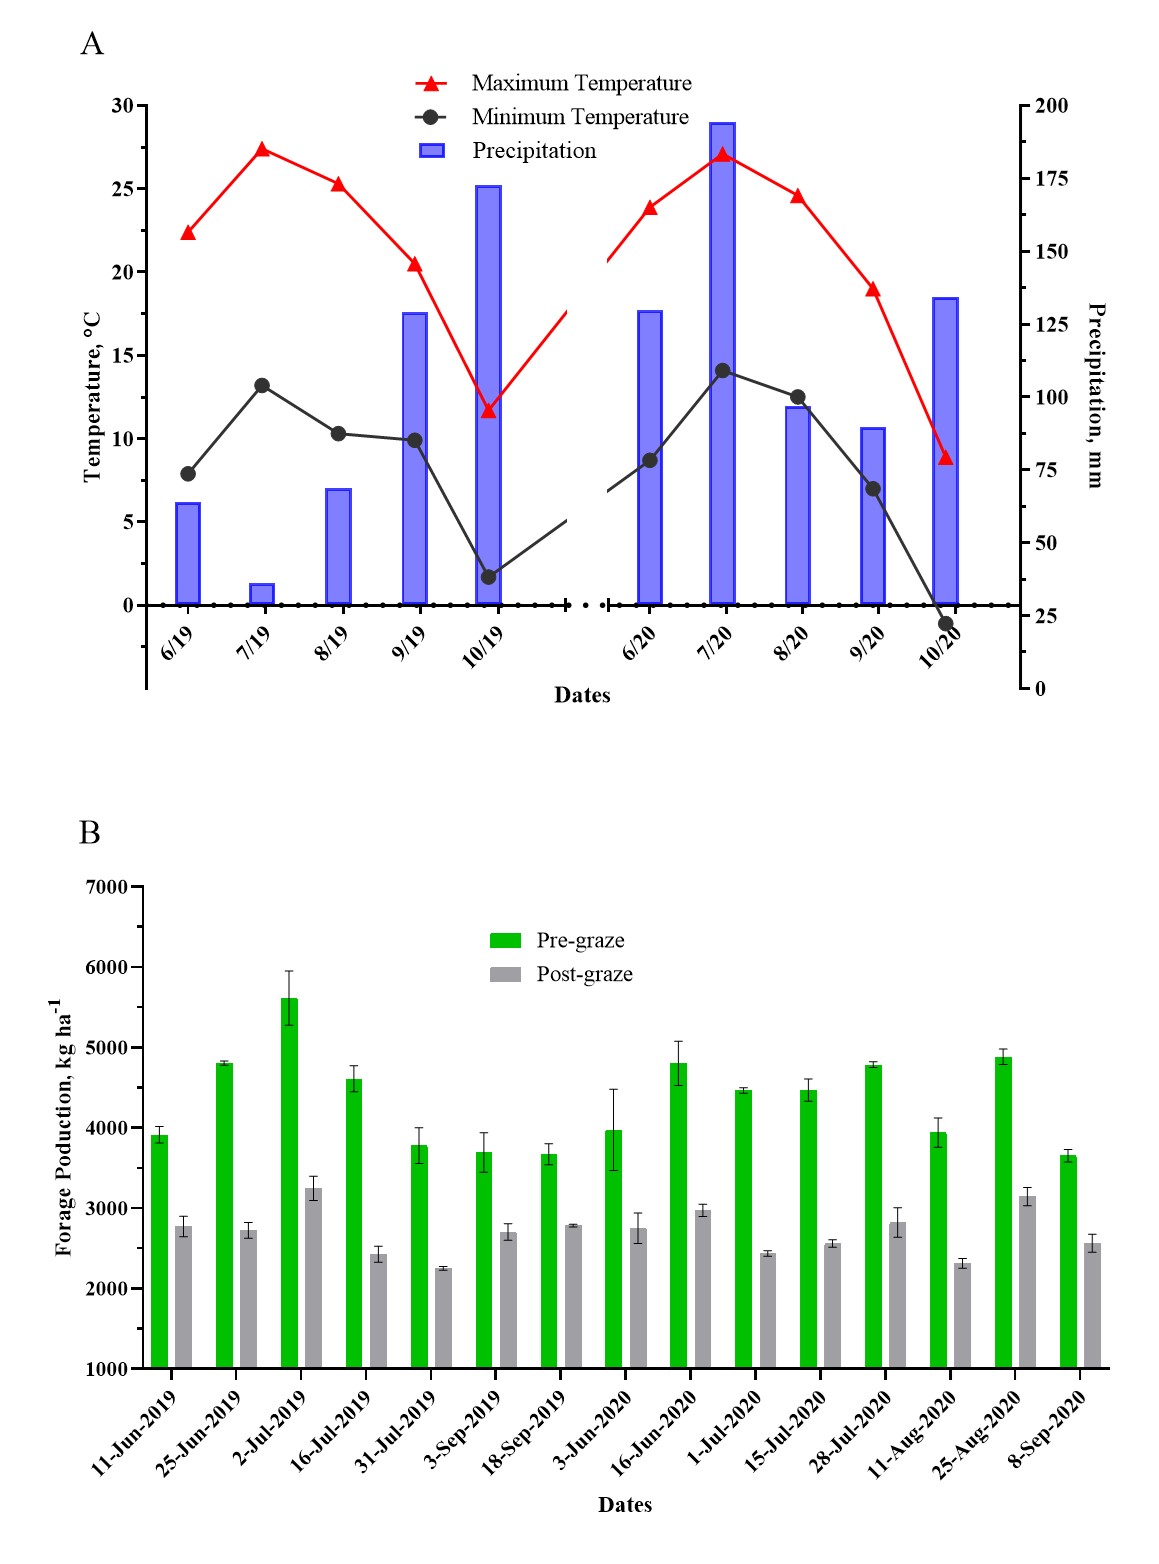
The study was conducted at the Michigan State University Upper Peninsula Research and Extension Center, UPREC (latitude 46°20'N, longitude 86°55'W, elevation 271 m) located in Chatham, MI. The trial consisted of two consecutive years (2019 and 2020). Weather data was collected from the weather station located at UPREC (Fig. 1A).
A 2×2 factorial experiment was used to randomly allocate 60 steers (14-20 months old) in 2019 (year 1, YR1) and 44 steers (14-20 months old) in 2020 (year 2, YR2). Two beef genotypes, Red Angus (RA) and RA x Akaushi crossbred (AK), were equally assigned to one of two finishing systems; a mixed-species pasture forage (GRASS) or a total mixed feedlot ration (GRAIN), in three groups. For each genotype in each finishing system, animals were stratified randomly and assigned to one of the three groups.
Animals
Each year, steers assigned to the GRASS system were selected from a herd at the Michigan State University Upper Peninsula Research and Extension Center, while steers assigned to the GRAIN system were selected from a herd at the Michigan State University Lake City AgBio Research Center (latitude: 44°18’N, longitude: 85°11’W; elevation 377 m). The GRASS steers were 6-mo older (fall born) than the GRAIN steers (spring born). The ages of the cattle for the trial were staggered such that with the extra age, the GRASS cattle would be 24-26 mo at slaughter while the GRAIN cattle would be 16-18 mo at slaughter.
In year 1, 15 RA (440.7 ± 20.6 kg) and 15 AK (438.5 ± 19.7 kg) were assigned for GRASS and 15 RA (466.5 ± 36.7 kg) and 15 AK (473.0 ± 36.6 kg) were assigned for GRAIN. In each finishing treatment, three groups contained 5 RA and 5 AK steers. Therefore, each finishing treatment had three groups of 10 steers representing RA and AK, totaling 30 steers. The trial started on June 11, 2019, for GRASS and on June 12, 2019, for GRAIN and ended on September 27, 2019.
In year 2, due to a low number of male births, we had less steers available for the GRAIN system. Thus, 15 RA (430.6 ± 20.3 kg) and 15 AK (437.0 ± 19.0 kg) were assigned for GRASS and 7 RA (479.8 ± 30.0 kg) and 7 AK (490.8 ± 61.9 kg) were assigned for GRAIN. For GRASS, three groups contained 5 RA and 5 AK steers, totaling 10 steers representing RA and AK. For GRAIN, two groups were established – one contained 4 RA and 4 AK, and the other contained 3 RA and 3 AK, totaling 14 steers. The trial started on June 3, 2020, and it ended on October 2, 2020.
Grazing
Grazing consisted of an established mixed forage, which was planted in the summer of 2017 and was grazed during the summer of 2018. Animals selected for the GRASS system were rotationally grazed on mixed legumes and grass pastures for two weeks before the start of the trial in each year.
Pastures were seeded at a rate of 19.3 kg ha-1, corresponding to meadow fescue (Fetusca pratensis (Huds.) P. Beauv.), birdsfoot trefoil (Lotus corniculatus L.), alfalfa (Medicago sativa L.), orchardgrass (Dactylis glomerata L.), red clover (Trifolium pratense L.), timothy grass (Phleum pretense), forage chicory (Cichorium intybus), and white clover (Trifolium repens L.).
The total area of 14 hectare was divided into eight paddocks and then subdivided into sub-paddocks. The stipulated grazing area was approximately 0.2 ha per group per day. The steers were rotationally moved 5 times per week to new sub-paddocks from Monday to Friday. On the weekends, the delimited area was calculated to allow enough forage. Stocking rates were adjusted when necessary to guarantee the forage on offer always exceeded the requirements of the livestock, leaving enough residual forage.
The experimental grazing period lasted 80 days in YR1 and 121 days in YR2. In year 1, between August 6 and September 3, 2019 (28 days) animals were removed due to low forage quantity and managed together in a mixed legume and grass pasture until grazing could continue in the experimental area. These 28 d were not included in the animal performance data. Shrunk body weights were obtained from each animal before removal and after return to pasture. Steers had ad libitum access to fresh water and free choice of mineral and vitamin block supplements (Prince Corporation, Marshfield, WI) during grazing period.
To determine forage biomass, forages were randomly measured 30 times every two weeks in each sub-paddock using the plate meter method, in pre- and post-grazing areas. At the beginning of the growing season and then 2 months later, ten additional plate meter readings were recorded in each sub-paddock, and the sampled area was hand clipped to ground level. All clippings were weighed, dried at 55°C in a forced-air oven for 72 h, and weighed again to calculate dry matter (DM) content. A regression line was fitted twice each year and applied to the next plate meter readings to estimate dry forage mass. Pre-grazing biomass samples were collected immediately before the steers were allowed access to fresh forage; post-grazing residual biomasses were collected after the steers were moved. Pre- and post-grazing forage samples were collected every two weeks by randomly clipping three 0.25-m2 quadrats to a 5-cm stubble using Gardena 8803 battery-operated harvest shears (Ulm, Germany) in each sub-paddock. Samples were dried at 55°C in a forced-air oven for 72 h and ground with a Wiley mill (1-mm screen; Arthur H. Thomas, Philadelphia, PA). Wet and dry weights were recorded. Approximately 500 g of samples were composited by group and underwent subsequent chemical analyses.
Botanical composition was determined monthly in all pasture areas using the dry-rank-weight method described by Mannetje and Haydock (1963) by two trained observers. For each paddock of approximately 1.75 ha, 6 locations were randomly zig-zag selected by placing a 0.13 m2 quadrat and ranking species by observed content as: 1 (70%), 2 (21%), or 3 (9%), totaling 48 locations monthly. All species presents were recorded even if not ranked 1, 2, or 3.
Feedlot
Animals selected for GRAIN system were transported to UPREC in December of each year to acclimate to the system and were fed legume/grass baleage until the middle of February. Multiple phases of the ration were balanced in this period and fed to the animals to transition the diet from hay to the higher energy diet. Concentrate was slowly and incrementally added to their diet every 4-5 days until they were on their final feedlot high energy diet immediately before the trial began. Initially, 90% hay and 10% concentrate diet were supplied, the amount of concentrate was increased until the ratio of hay: concentrate was 20:80 (DM base). Data from the adaptation period was excluded from the analysis. Nutrient composition of the ingredients used in the pre-trial period for each year is presented in Table S1.
Steers were allocated to collective pens, providing at least 7 m2 per steer. Once daily, steers were fed a total mixed ration (TMR) formulated to contain 80% grain. The diet consisted of 20% orchardgrass hay, 74% corn, and 6% pellets. In YR1, the diet contained 50% dry corn and 24% high moisture corn (HMC), while in YR2 the diet contained 74% dry corn. Pellets contained 36% crude protein (N536, Kalmbach Feeds, INC. Upper Sandusky, Ohio).
Steers had ad libitum access to fresh water and free choice of mineral and vitamin block supplements (Prince Corporation, Marshfield, WI). The diet was offered once daily over 107 d in YR1 and 121 d in YR2. The ration was adjusted daily to maintain 3 to 5% refusals. The amount of feed offered and refusals were weighed per pen daily.
The TMR and orts were sampled weekly and stored at -20°C. At the end of each month, samples from two weeks were mixed according to group and a composited subsample was dried at 55°C in a forced-air oven for 72 h, ground with a Wiley mill (1-mm screen; Arthur H. Thomas, Philadelphia, PA), and underwent subsequent chemical analysis.
Table 1: Nutritive value of forage (pre and post graze) and feedlot diets (TMR and orts) in 2019 (YR1) and 2020 (YR2)
|
Item % DM |
YR1 |
|
YR2 |
||||||
|
Pre |
Post |
TMR |
Orts |
|
Pre |
Post |
TMR |
Orts |
|
|
Dry matter, % |
20.5 |
26.9 |
75.9 |
74.6 |
|
22.1 |
25.3 |
85.4 |
78.9 |
|
Ash |
7.1 |
6.7 |
4.4 |
4.8 |
|
6.1 |
5.8 |
3.0 |
4.3 |
|
Crude Protein |
11.5 |
8.7 |
9.7 |
9.6 |
|
15.0 |
12.3 |
9.6 |
8.9 |
|
NDF1 |
52.2 |
59.1 |
21.2 |
20.6 |
|
51.5 |
55.5 |
19.9 |
32.1 |
|
ADF2 |
35.0 |
38.5 |
10.0 |
9.8 |
|
32.0 |
34.0 |
9.4 |
16.6 |
|
TDN3 |
62.0 |
59.1 |
78.9 |
79.2 |
|
62.3 |
60.6 |
79.6 |
72.7 |
1NDF = Neutral detergent fiber
2ADF = Acid detergent fiber
3TDN = Total digestible nutrients. The TDN was estimated using the formula recommended by Capelle et al. (2001): TDN (%) = 83.790–0.4171 x NDF (forage) and TDN (%) = 91.0246 − 0.571588 x NDF (TMR and orts).
Feed Sample Collection and Analysis
All forage, TMR, and orts were separated for each group every two weeks and analyzed for DM, ash, neutral detergent fiber (NDF), acid detergent fiber (ADF), crude protein (CP) and gross energy (GE). All nutrients were expressed as percentages of DM, determined by drying at 105°C in a forced-air oven for at least 8 h. Ash content was determined after 6 h of oxidation at 500°C in a muffle furnace. The NDF was analyzed according to Mertens (2002) with the inclusion of amylase and sodium sulfite. The ADF was analyzed according to AOAC (2000). Crude protein was determined according to Hach et al. (1987).
Performance
A shrunk body weight (BW) was measured at the onset and end of the trial. A 12-hr fasting body weight was recorded monthly and average daily gain (ADG) was determined via linear regression, and total gain was obtained by multiplying ADG by the number of days.
The length of time the animals were evaluated was determined based on forage mass availability, and all animals were slaughtered on the same date. The animals were slaughtered at the age of 18 and 26 mo (GRAIN and GRASS, respectively), at a commercial slaughter plant according to standard operating procedures.
Carcass Traits
Final weight at slaughter was recorded the day before the slaughter. Hot carcass weight (HCW) was recorded for each animal. Dressing percent was calculated from the HCW divided by the final weight at slaughter and multiplied by 100. Carcass measurements were collected by a trained personnel 48-hr postmortem and included ribeye area (REA), 12th rib back fat, USDA yield grade, and marbling score.
A portion of the muscle longissimus lumborum (between 11th and 13th rib) was collected from the left side of each carcass and the samples were transferred to the MSU Meat Laboratory in a cooler on ice packs within two hours. Two 2.54 cm-thick steaks were cut, individually vacuum packed and placed on stainless steel trays and aged at 4°C for 14 d.
At d 14, one steak was frozen until the thawing and cooking loss analysis and Warner-Bratzler shear force (WBSF) analysis could be performed. The other fresh steak was evaluated for instrumental color and cooked for consumer panelists.
Instrumental Surface Color
Color measurements were taken in three different locations on the surface of the meat using a Hunter MiniScan XE Plus (Model 4500L, aperture 25 mm, 45/0° illumination/viewing, illuminant D65, 10° standard observer, Hunter Labs, Inc. Reston, VA) colorimeter and averaged to represent the value for each steak. For each measurement, CIE lightness (L*), redness (a*), and yellowness (b*) color space values were recorded. The instrument was calibrated against a white and a black standard at the beginning of the measurement.
Hue angle and chroma values were calculated according to AMSA (2012). Chroma (color saturation) is a measure of the intensity of the red color, and it was calculated from the formula [(a*)2 + (b*)2 ]0.5 and hue angle, a measure of overall color, was calculated from arc-tan b*/a*.
Sensory Attributes
A sensory analysis protocol was approved by the Michigan State University Institutional Review Board before this study (Study number #1799). In YR1, the consumer test was performed at the testing area in the Department of Food Science, MSU, East Lansing, MI. In YR2, it was performed at Matrix Sciences Company located in Grand Rapids, MI due to COVID restrictions in place at MSU at the time. The steaks were always transferred in coolers on ice packs and the tests were performed by the same people in both years.
For each year, the steaks were cooked for consumer panelists (n = 105) to evaluate flavor, texture, juiciness, and overall acceptability using a 9-point hedonic scale (1 = dislike extremely and 9 = like extremely). A quality attribute panel was used to evaluate the samples.
The study consisted of 15 groups of seven people each year. Each group tested the same steaks, one from each of the four treatments. The steaks were selected randomly, unpacked, and the subcutaneous fat was trimmed off. The steak was cooked to an internal temperature of 71°C using a clamshell electric grill (George Foreman) that was preheated. After cooking, the steaks were allowed to rest at room temperature for three min. The steaks were cut into 1.27 × 1.27 × 2.54 cm pieces, and all external fat and connective tissue was removed.
The cubes from each treatment were identified with random three-digit-codes and placed in an individual covered container and served to each panelist. Panelists were given four containers with each treatment (each sample was represented by two pieces) at the same time, beside one cup filled with distilled water and unsalted saltine crackers. Panelists were first asked to take a bite of cracker and a sip of water to cleanse their palate before starting, and between each sample.
Water Holding Capacity
A 2.54 cm-thick steak was used for thawing and cooking loss and shear force analyses. The samples were stored at -24°C under vacuum for approximately 35 days before the analyses. The steaks were thawed at a temperature of 4°C for 24 h before cooking.
The steaks were then weighed and cooked to an internal temperature of 71°C using a clamshell electric grill (George Foreman) that was preheated for at least 15 min. The cooked samples rested at room temperature for five min and the weight was recorded. Thawing and cooking loss was expressed as the percentage of weight loss against fresh weight.
Warner-Bratzler Shear Force
The cooked steaks were cooled down overnight at 4°C. Six to eight 1.27-cm diameter cores were obtained from each steak parallel to the muscle fibers (AMSA, 2015) using a drill press mounted corer. The cores were subjected to shear force measurement using a TA-XT Texture Analyzer (Stable Micro System Ltd., UK) fitted with a V-shaped Warner-Bratzler blade. Samples were cut through the slit of the table as the blade moved down with a constant speed of 20 cm/min. Each core was sheared once, so that the blade cut across the muscle fiber. The mean of the cores was utilized for statistical analysis.
Statistical Analysis
All data were analyzed using the GLIMMIX procedure in SAS (SAS Institute Inc., Cary, NC, v 9.4). The distribution of model residual was tested for normality and homogeneity using Shapiro-Wilk and Cochran tests. Backfat, USDA yield grade, thawing loss, cooking loss, WBSF, color measurements, and sensory attributes were log transformed.
Data for growth performance, carcass traits, and meat quality traits were analyzed using the fixed effect of genotype, finishing system, year, and their interaction. Sensory panel results were also analyzed using a randomized complete design in SAS, and the sensory panelist was the random effect. Depending on the variable, the individual steer, carcass, or steak was considered as the experimental unit. The three-way interaction was not significant, and it was removed from the model.
The PDIFF option of the LSMEANS statement was used when comparing treatment means. Statistical differences were considered significant when the P-value was less than or equal to 0.05, and tendencies were considered when the P-value was greater than 0.05 and less than 0.10. Lower and upper confidence limits at 95% were reported for each treatment.
Weather Conditions and Diet Quality
The total rainfall observed throughout the experimental period was 470.4 mm in YR1 and 645.2 mm in YR2 (Fig. 1A). Daily mean air temperature increased from the beginning of the trial until July and then decreased over time in each year. The maximum temperature ranged from 27.1 to 8.9 °C and the minimum temperature ranged from 14.1 to -1.1°C.
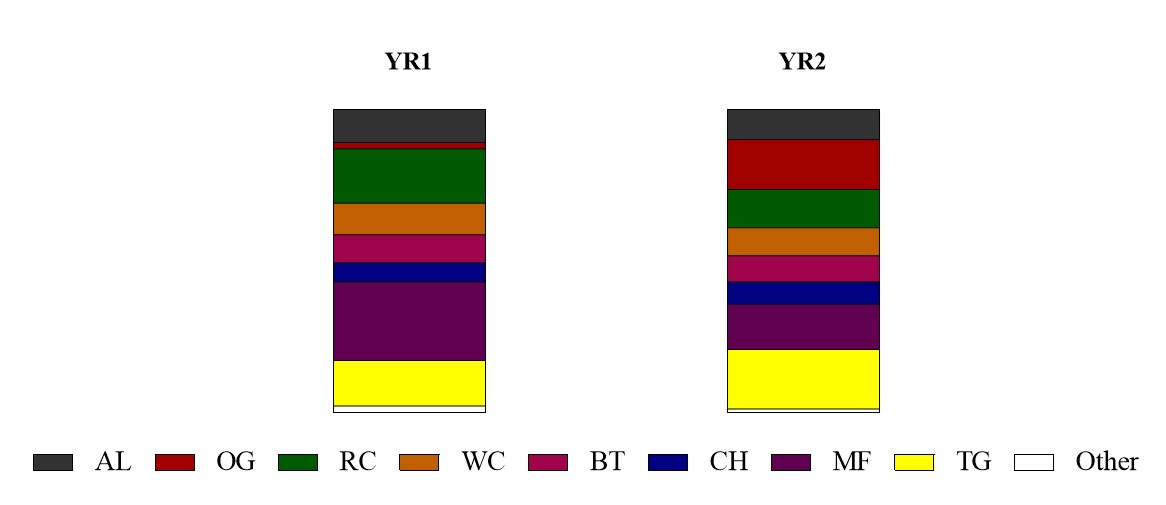
Pre-graze forage mass averaged 4,298.4 and 4,372.4 kg of DM and post-graze averaged 2,702.1 and 2,695.9 kg of DM in YR1 and YR2, respectively (Fig. 1B). Post-graze forage mass corresponded to 62.9% in YR1 and 61.7% in YR2 of the pre-graze mass. Botanical composition for each year is detailed in Fig. 2. A variation was observed between the years as expected. In YR1 the pasture was dominated by meadow fescue at 25.9%, followed by red clover (18.0%), timothy grass (15.0%), alfalfa (11.0%), and white clover (10.4%). Each other species accounted for less than 10%, together totaling 19.7%. In YR2, timothy grass (19.8%) was the dominant species and orchard grass (16.6%) was the second most present species, followed by meadow fescue (15.0%), and red clover (12.7%). The other species combined totaled 35.9%. Meadow fescue and red clover dropped from YR1 to YR2, while orchard grass and timothy grass increased considerably.
Forage and diet nutritive values for each year are presented in Table 1. As expected, pre-graze forage was higher in quality, including greater CP and reduced values for both NDF and ADF, compared to post-graze. Crude protein increased from 11.5 to 15.0% in DM basis from YR1 to YR2. The TMR and orts had consistent values between years, except for DM. The lower DM value observed in YR1 is due to the inclusion of HMC (24% of the DM) in the diet compared to no HMC in YR2. The averaged values for both years were 9.7% crude protein, 20.3% NDF, and 9.7% ADF.
Performance, Carcass Traits and Meat Quality
The main effects (beef genotype, finishing system, and year) for all variables evaluated were presented in Tables 2 and 3. When any of the two-way interactions were significant, the data were presented as a graph. P-values for all variables, including the main effects and their interactions, were presented in Table S2.
Performance.
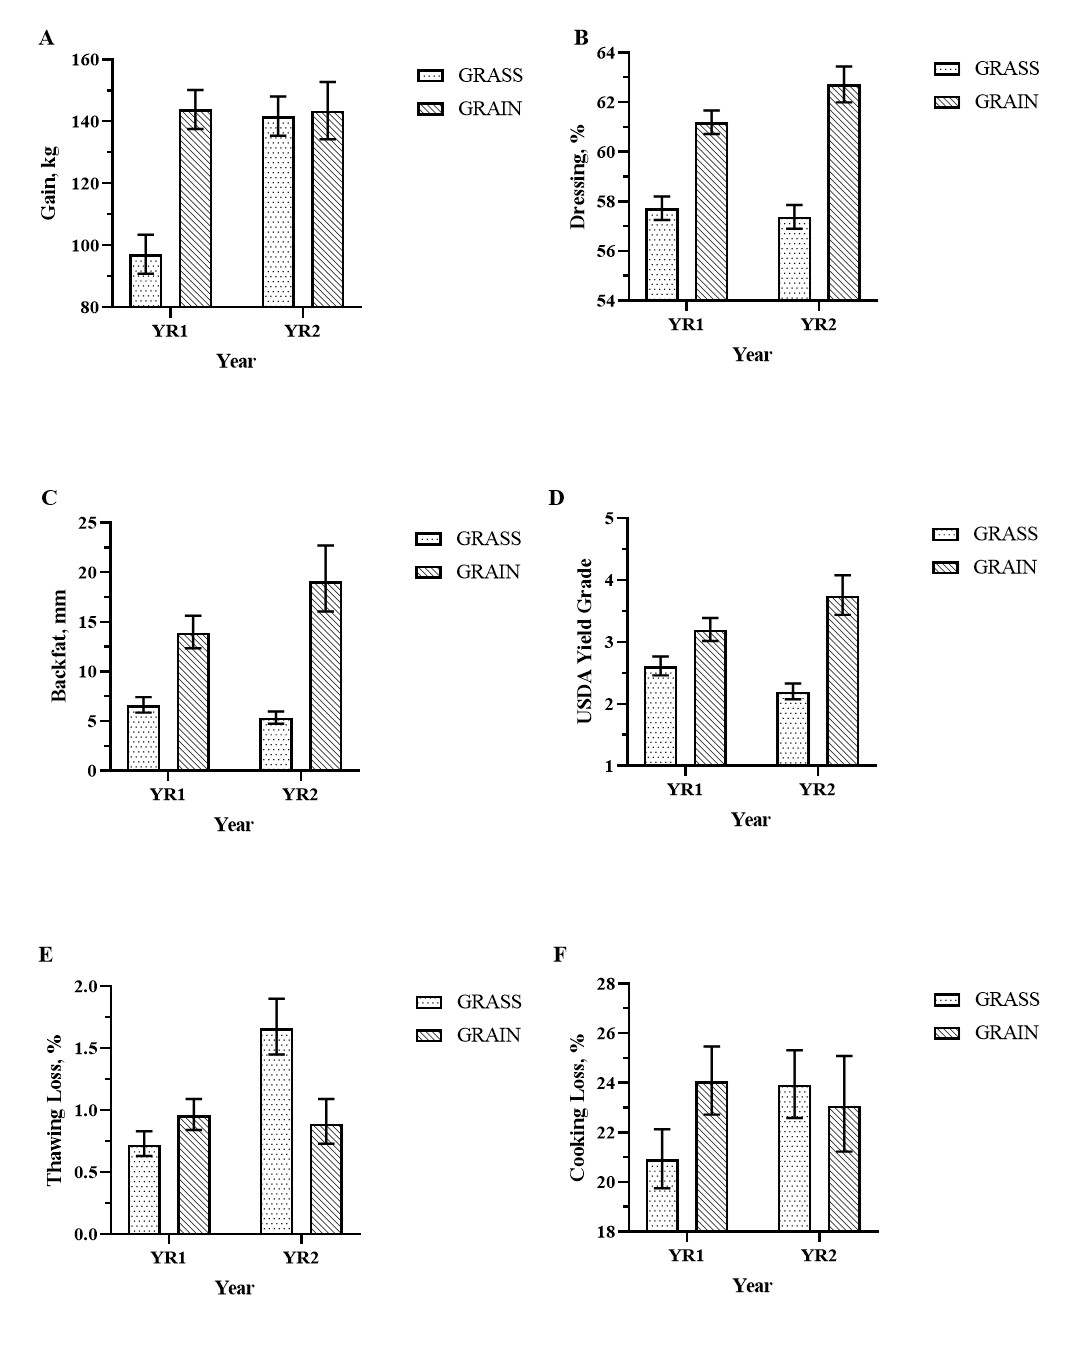
Both initial and final BW were significantly impacted by finishing system (P < 0.01), but neither were impacted by genotype. Initial and final BW were greater for GRAIN than for the GRASS system (P < 0.01). Final BW was also impacted by year; steers in YR2 had greater BW compared to YR1 (603.5 vs 579.9 kg, P < 0.01). Total gain was significantly impacted by system and year (P < 0.01) and the results mirrored those of final BW. There was a tendency (P = 0.09) for greater gain in RA than AK steers (134.6 vs 128.5, P = 0.09). A system by year interaction was significant for total gain (Fig 3A, P < 0.01). In YR1, steers from GRASS had a lower total gain compared to those in GRAIN (97.1 vs 141.7 kg), and no difference was observed in YR2. There were both system and year significant effects for ADG. Steers finished under the GRAIN system had greater ADG compared to those under the GRASS (1.26 vs 1.19 kg d-1, P = 0.04), and ADG was greater in YR1 than YR2 (P < 0.01).
Table 2: Effects of beef genotypes and finishing system on performance and carcass traits (mean and lower and upper confidence limit at 95%)
|
Item |
Genotype1 |
|
System |
|
Year |
|||
|
RA |
AK |
|
GRASS |
GRAIN |
|
2019 |
2020 |
|
|
Growth2 |
|
|
|
|
|
|
|
|
|
Initial BW, kg |
454.2 (445.6 - 462.9) |
459.7 (451.1 - 468.4) |
|
436.5 (428.7 - 444.2) |
477.5 (467.8 - 487.2) |
|
454.4 (446.7 - 462.2) |
459.5 (449.9 - 469.2) |
|
Final BW, kg |
592.8 (581.9 - 603.6) |
590.6 (579.8 - 601.5) |
|
563.5 553.8 - 573.2) |
619.9 (607.7 - 632.1) |
|
579.9 (570.2 - 589.6) |
603.5 (591.3 - 615.6) |
|
Total gain, kg |
134.6 (129.6 - 139.6) |
128.5 (123.5 - 133.5) |
|
119.4 (115.0 - 123.9) |
143.7 (138.1 - 149.3) |
|
120.5 (116.0 - 125.0) |
142.6 (137.0 - 148.2) |
|
ADG, kg d-1 |
1.25 (1.21 - 1.31) |
1.20 (1.15 - 1.25) |
|
1.19 (1.15 - 1.24) |
1.26 (1.21 - 1.32) |
|
1.28 (1.24 - 1.32) |
1.18 (1.12 - 1.23) |
|
Carcass3 |
|
|
|
|
|
|
|
|
|
Wgt at slaughter, kg |
571.6 (561.3 - 582.0) |
572.3 (561.7 - 582.9) |
|
547.4 (538.2 - 556.7) |
596.5 (584.6 - 608.4) |
|
559.7 (550.5 - 569.0) |
584.2 (572.3 - 596.1) |
|
HCW, kg |
337.4 (331.2 - 343.7) |
345.7 (339.4 - 351.9) |
|
314.9 (309.3 - 320.5) |
368.2 (361.2 - 375.2) |
|
333.2 (327.6 - 338.8) |
349.9 (342.8 - 356.9) |
|
Dressing, % |
59.1 (58.7 - 59.4) |
60.5 (60.1 - 60.9) |
|
57.6 (57.3 - 57.9) |
61.9 (61.5 - 62.4) |
|
59.5 (59.1 - 59.8) |
60.1 (59.7 - 60.5) |
|
Backfat, mm |
9.7 (8.9 - 10.7) |
9.9 (9.0 - 10.9) |
|
5.9 (5.5 - 6.4) |
16.3 (14.7 - 18.1) |
|
9.6 (8.8 - 10.4) |
10.1 (9.1 - 11.2) |
|
Ribeye area, cm2 |
72.1 (70.2 - 74.0) |
74.9 (73.0 - 76.8) |
|
69.2 (67.5 - 70.9) |
77.8 (75.7 - 80.0) |
|
72.3 (70.6 - 74.0) |
74.7 (72.6 - 76.9) |
|
Ribeye cm2 CW-1 |
9.7 (9.4 - 9.9) |
9.9 (9.6 - 10.1) |
|
9.9 (9.7 - 10.2) |
9.6 (9.3 - 9.9) |
|
9.9 (9.6 – 10.1) |
9.7 (9.4 – 10.0) |
|
USDA yield grade |
2.9 (2.8 - 3.0) |
2.9 (2.7 - 3.0) |
|
2.4 (2.3 - 2.5) |
3.5 (3.3 - 3.6) |
|
2.9 (2.8 - 3.1) |
2.9 (2.7 - 3.0) |
|
Marbling Score |
494.5 (474.8 - 514.3) |
529.2 (509.5 - 549.0) |
|
404.5 (386.9 - 422.1) |
619.2 (597.1 - 641.3) |
|
519.2 (501.5 - 536.8) |
504.6 (482.5 - 526.7) |
1RA = Red Angus; AK = Red Angus x Akaushi crossbred
2BW = Body weight; ADG = Average daily gain
3HCW = Hot carcass weight; Marbling scores: Choice- = 400–499, Choice0 = 500–599, Choice+ = 600–699.
Bold values indicate that the main effect was statistically different (P < 0.05). P-values are shown on Supplementary Table S2.
Carcass Traits.
All carcass traits were impacted by finishing system (P < 0.01). Steers in GRAIN had the greatest values for all variables evaluated compared to those in GRASS, except that GRASS had a tendency (P = 0.06) for higher ribeye area by carcass weight than GRAIN. There was a genotype effect for dressing (P < 0.01) and marbling score (P = 0.01), where AK steers had the greatest values (60.5% and 529 vs 59.1% and 494 for AK and RA, respectively). There was a tendency for the AK steers to have greater HCW (345.6 kg, P = 0.06) and ribeye area (74.9 cm2, P = 0.06) compared to RA (337.4 kg and 72.1 cm2). Year was significant for weight at slaughter (P < 0.01), HCW (P < 0.01), dressing (P = 0.01), and ribeye area (P = 0.08), with the greatest values observed in YR2.
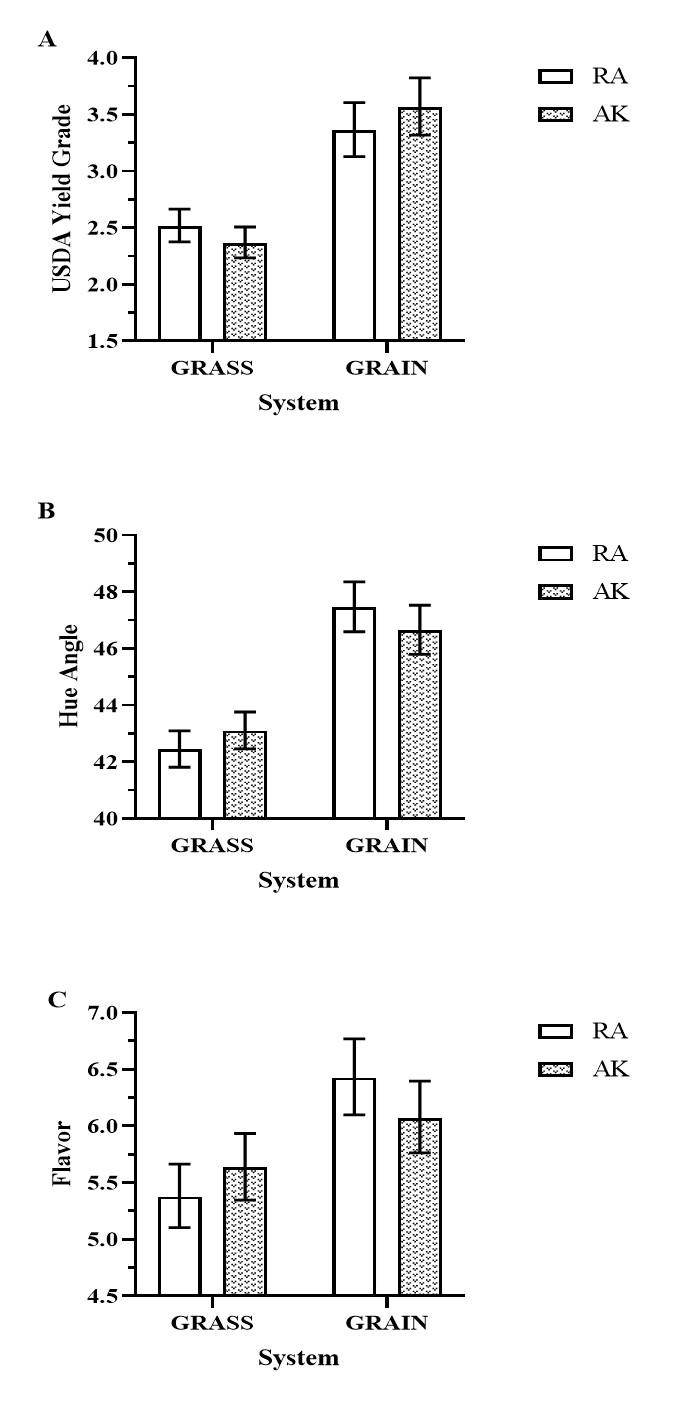
There was a system by year interaction for dressing, backfat, and USDA yield grade (Fig. 3B-D, P < 0.01). USDA also had a genotype by system interaction (Fig. 4A, P = 0.06) and no genotype by year interaction was observed for any of the carcass traits. Dressing was lower in GRASS than GRAIN in both years. No difference was observed in GRASS between the years, but for GRAIN dressing was lower in YR1 than in YR2 (Fig. 3B). The same pattern was observed for backfat, with lower values in GRASS compared to GRAIN in both years. No difference was observed for GRASS between YR1 and YR2, but for GRAIN, backfat was lower in YR1 than in YR2 (Fig. 3C). USDA yield grade was lower in GRASS than GRAIN in both years. For GRASS, steers from YR1 had a greater USDA yield grade than those from YR2, and for GRAIN, YR1 had the lowest value (Fig.3D). Regarding the genotype by system interaction, USDA yield grade was lower in GRASS compared to GRAIN in both genotypes, and no difference was observed between the two genotypes for any GRASS or GRAIN systems (Fig. 4A).
Meat Quality.
There was no difference in water holding capacity for genotypes (Table 3, P > 0.05), but thawing loss was lower in GRAIN than GRASS (0.9 vs 1.1%, P = 0.03), and it was greater in YR2 than YR1 (1.2 vs 0.8%, P < 0.01). There was a system by year interaction for both thawing and cooking loss (P < 0.01). Thawing loss was lower in GRASS than GRAIN in YR1 but was greater in GRASS than GRAIN in YR2. No difference was observed for GRAIN between YR1 and YR2, but for GRASS it was lowest in YR1 (Fig. 3E). Cooking loss was lower in GRASS than GRAIN in YR1, and no difference was observed between systems in YR2. For GRASS, cooking loss was greater in YR2 than YR1, and for GRAIN, no difference was observed between years (Fig. 3F).
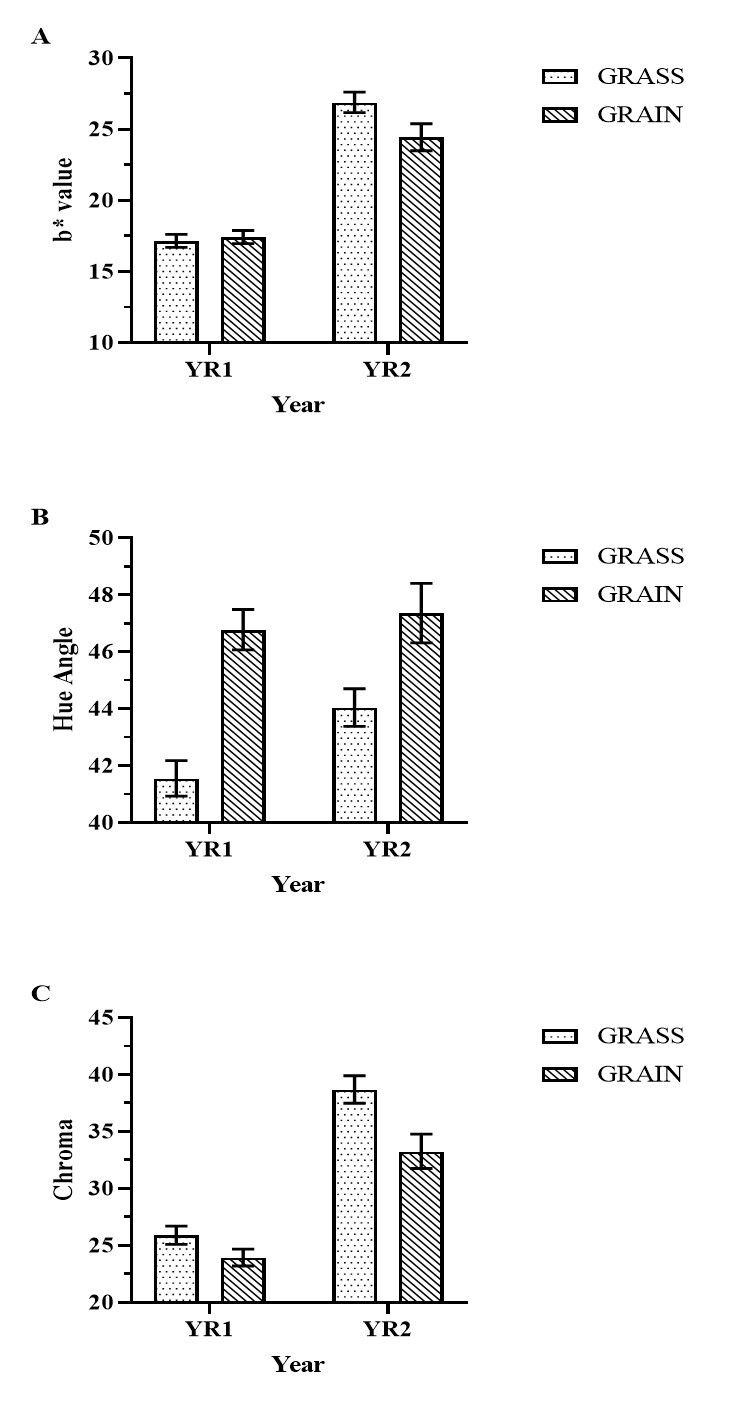
Color variables were impacted by system and year (Table 3, P < 0.01). L* color parameter (lightness) and hue angle presented greater values while a* (redness), b* (yellowness), and chroma presented lower values in GRAIN compared to GRASS. Regarding the year effect, L* had the greatest value while all other variables had the lowest values in YR1. A significant interaction between system and year was observed for b*(P < 0.01), hue angle (P < 0.01), and chroma (P = 0.04). No difference was observed for b* between GRASS and GRAIN in YR1, but GRAIN had a lower value compared to GRASS in YR2. Also, both GRASS and GRAIN presented lower values in YR1 compared to YR2 (Fig. 5A). For hue angle, GRASS presented lower values compared to GRAIN in both years (P < 0.01). For GRASS, YR1 presented a lower value than YR2, however, for GRAIN no difference was observed between the years (Fig. 5B). For chroma, GRAIN presented the lowest values in both years, and for both systems, YR1 presented a lower value than YR2 (Fig. 5C).
Table 3: Effects of beef genotypes and finishing system on meat quality and sensory attributes (mean and lower and upper confidence limit at 95%)
|
Item |
Genotype1 |
|
System |
|
Year |
|||
|
RA |
AK |
|
GRASS |
GRAIN |
|
2019 |
2020 |
|
|
Water holding capacity |
|
|
|
|
|
|
|
|
|
Thawing loss, % |
1.0 (0.9 - 1.1) |
1.0 (0.9 - 1.0) |
|
1.1 (1.0 - 1.2) |
0.9 (0.8 - 1.0) |
|
0.8 (0.8 - 0.9) |
1.2 (1.1 - 1.4) |
|
Cooking loss, % |
22.7 (21.7 - 23.8) |
23.2 (22.1 - 24.2) |
|
22.4 (21.5 - 23.2) |
23.6 (22.4 - 24.8) |
|
22.4 (21.5 - 23.3) |
23.5 (22.3 - 24.7) |
|
Color |
|
|
|
|
|
|
|
|
|
Lightness (L*) |
33.2 (32.3 - 34.1) |
33.6 (32.7 - 34.5) |
|
29.4 (28.7 - 30.1) |
37.9 (36.7 - 39.0) |
|
36.0 (35.1 - 36.9) |
30.9 (30.0 - 31.9) |
|
Redness (a*) |
21.0 (20.4 - 21.7) |
21.1 (20.5 - 21.8) |
|
23.2 (22.5 - 23.8) |
19.1 (18.5 - 19.8) |
|
17.8 (17.3 - 18.3) |
25.0 (24.1 - 25.9) |
|
Yellowness (b*) |
21.1 (20.6 - 21.5) |
21.0 (20.6 - 21.5) |
|
21.5 (21.1 - 21.9) |
20.6 (20.1 - 21.1) |
|
17.3 (17.0 - 17.6) |
25.6 (25.0 - 26.2) |
|
Hue angle |
44.9 (44.4 - 45.4) |
44.8 (44.3 - 45.4) |
|
42.8 (42.3 - 43.2) |
47.1 (46.4 - 47.7) |
|
44.1 (43.6 - 44.6) |
45.7 (45.2 - 46.3) |
|
Chroma |
29.9 (29.2 - 30.6) |
29.9 (29.1 - 30.6) |
|
31.6 (31.0 - 32.3) |
28.2 (27.4 - 29.0) |
|
24.9 (24.3 - 25.4) |
35.9 (34.9 - 36.9) |
|
Shear force2 |
|
|
|
|
|
|
|
|
|
WBSF, kg |
4.1 (3.8 - 4.3) |
4.2 (4.0 - 4.5) |
|
4.6 (4.4 - 4.8) |
3.7 (3.5 - 4.0) |
|
3.7 (3.5 - 3.9) |
4.6 (4.3 - 5.0) |
|
Sensory3 |
|
|
||||||
|
Flavor - liking |
5.9 (5.6 - 6.1) |
5.8 (5.6 - 6.1) |
|
5.5 (5.3 - 5.7) |
6.2 (6.0 - 6.5) |
|
6.0 (5.7 - 6.3) |
5.7 (5.4 – 6.0) |
|
Juiciness – liking |
5.5 (5.3 - 5.8) |
5.8 (5.6 - 6.1) |
|
5.4 (5.1 - 5.6) |
6.0 (5.7 - 6.2) |
|
5.6 (5.3 - 5.9) |
5.7 (5.4 - 6.0) |
|
Texture/firmness - liking |
6.0 (5.8 - 6.3) |
5.9 (5.7 - 6.1) |
|
5.5 (5.3 - 5.7) |
6.4 (6.2 - 6.7) |
|
6.0 (5.7 - 6.2) |
5.9 (5.7 - 6.2) |
|
Overall acceptability |
5.9 (5.6 - 6.1) |
5.8 (5.6 - 6.0) |
|
5.4 (5.1 - 5.6) |
6.3 (6.1- 6.6) |
|
6.0 (5.7 - 6.3) |
5.7 (5.4 - 6.0) |
1RA = Red Angus; AK = Red Angus x Akaushi crossbred
2WBSF = Warner-Bratzler Shear Force
3Sensory: Panelists assigned steak attributes using 9-point scales (1 = dislike extremely; 9 = like extremely) for flavor, juiciness, texture/firmness, and overall acceptability.
Bold values indicate that the main effect was statistically different (P < 0.05). P-values are shown on Supplementary Table S2.
Sensory Attributes and Shear Force
All sensory attributes were significantly impacted by system (Table 3, P < 0.01), but no effects of genotypes were observed, except a tendency for juiciness (Table S2, P = 0.06). The attributes were scored greater in GRAIN than GRASS beef. Steaks from AK tended to be juicier than RA (5.8 vs 5.5). There was a genotype by system interaction for flavor (P = 0.02). Beef from RA had lower flavor liking in GRASS than in GRAIN, and no difference was observed for AK. No difference was observed for flavor between RA and AK within each system (Fig. 4C).
There were both system and year effects for WBSF (P < 0.01), no difference for genotype (P = 0.51) nor any interaction. Beef from steers in GRASS had greater WBSF than those from GRAIN (P < 0.01). Regarding the year effect on WBSF, YR2 presented greater values compared to YR1 (P < 0.01).
Supplementary material
Table S1. Nutrient composition of the ingredients used in the pre-trial period for the GRAIN treatment.
|
Nutrient Composition, % DM |
YR1 |
|
YR2 |
||||
|
Hay |
Dry corn |
Pellet2 |
|
Hay |
Dry corn |
Pellet3 |
|
|
Dry matter, % |
76.7 |
81.1 |
85.0 |
|
81.7 |
85.5 |
86.4 |
|
Ash |
8.0 |
1.6 |
20.8 |
|
5.3 |
1.2 |
20.6 |
|
Crude Protein |
9.9 |
5.8 |
34.6 |
|
7.2 |
7.4 |
35.4 |
|
NDF1 |
63.4 |
9.3 |
10.8 |
|
65.1 |
10.2 |
10.0 |
|
ADF2 |
36.2 |
3.1 |
5.6 |
|
38.7 |
3.2 |
5.4 |
1NDF = Neutral detergent fiber
2ADF = Acid detergent fiber
Pellet3 (N536, Kalmbach Feeds, INC. Upper Sandusky, Ohio)
Table S2. P-values for the main factors (Beef genotype, finishing system and year) and their interaction for all variables evaluated.
|
Variables |
|
P-values |
||||||
|
Genotype1 (G) |
System (S) |
Year (Y) |
G*S |
G*Y |
S*Y |
G*S*Y |
||
|
Growth2 |
|
|
|
|
|
|
|
|
|
Initial BW, kg |
0.37 |
<0.01 |
0.42 |
0.53 |
0.54 |
0.10 |
0.84 |
|
|
Final BW, kg |
0.78 |
<0.01 |
<0.01 |
0.81 |
0.94 |
0.45 |
0.90 |
|
|
Total gain, kg |
0.09 |
<0.01 |
<0.01 |
0.42 |
0.17 |
<0.01 |
0.89 |
|
|
ADG, kg d-1 |
0.15 |
0.04 |
<0.01 |
0.45 |
0.24 |
0.11 |
0.96 |
|
|
Carcass3 |
|
|
|
|
|
|
|
|
|
Weight at slaughter, kg |
0.92 |
<0.01 |
<0.01 |
0.66 |
0.91 |
0.69 |
0.74 |
|
|
HCW, kg |
0.06 |
<0.01 |
<0.01 |
0.47 |
0.83 |
0.52 |
0.68 |
|
|
Dressing, % |
<0.01 |
<0.01 |
0.01 |
0.11 |
0.95 |
<0.01 |
0.23 |
|
|
Backfat, mm |
0.80 |
<0.01 |
0.45 |
0.29 |
0.16 |
<0.01 |
0.90 |
|
|
Ribeye area, cm2 |
0.04 |
<0.01 |
0.08 |
0.91 |
0.33 |
0.17 |
0.32 |
|
|
Ribeye, cm2 CW-1 |
0.33 |
0.06 |
0.39 |
0.54 |
0.45 |
0.27 |
0.54 |
|
|
USDA yield grade |
0.95 |
<0.01 |
0.85 |
0.06 |
0.20 |
<0.01 |
0.94 |
|
|
Marbling Score |
0.01 |
<0.01 |
0.31 |
0.37 |
0.10 |
0.46 |
0.31 |
|
|
Water capacity |
|
|
|
|
|
|
|
|
|
Thawing loss, % |
0.55 |
0.03 |
<0.01 |
0.76 |
0.34 |
<0.01 |
0.23 |
|
|
Cooking loss, % |
0.57 |
0.11 |
0.16 |
0.50 |
0.36 |
<0.01 |
0.40 |
|
|
Color |
|
|
|
|
|
|
|
|
|
Lightness (L*) |
0.55 |
<0.01 |
<0.01 |
0.33 |
0.41 |
0.13 |
0.11 |
|
|
Redness (a*) |
0.86 |
<0.01 |
<0.01 |
0.31 |
0.39 |
0.35 |
0.46 |
|
|
Yellowness (b*) |
0.96 |
<0.01 |
<0.01 |
0.75 |
0.52 |
<0.01 |
0.97 |
|
|
Hue angle |
0.91 |
<0.01 |
<0.01 |
0.05 |
0.50 |
<0.01 |
0.15 |
|
|
Chroma |
0.96 |
<0.01 |
<0.01 |
0.65 |
0.43 |
0.04 |
0.64 |
|
|
Shear Force |
|
|
|
|
|
|
|
|
|
WBSF4, kg |
0.51 |
<0.01 |
<0.01 |
0.43 |
0.56 |
0.37 |
0.45 |
|
|
Sensory5 |
|
|
|
|
|
|
|
|
|
Flavor |
0.83 |
<0.01 |
0.12 |
0.02 |
0.84 |
0.18 |
0.97 |
|
|
Juiciness |
0.06 |
<0.01 |
0.67 |
0.19 |
0.99 |
0.61 |
0.57 |
|
|
Texture/firmness |
0.49 |
<0.01 |
0.93 |
0.35 |
0.51 |
0.89 |
0.84 |
|
|
Overall acceptability |
0.75 |
<0.01 |
0.14 |
0.31 |
0.30 |
0.48 |
0.77 |
|
1RA = Red Angus; AK = Red Angus x Akaushi crossbreed
2BW = Body weight; ADG = Average daily gain
3HCW = Hot carcass weight; Marbling scores: Choice- = 400-499, Choice0 = 500-599, Choice+ = 600-699.
4WBSF = Warner-Bratzler Shear Force;
5Sensory: Panelists assigned steak attributes using 9-point scales (1 = dislike extremely; 9 = like extremely) for flavor, juiciness, texture/firmness, and overall acceptability.
Results of this study have shown that beef finishing system has a significant impact on animal performance, carcass traits, meat quality and sensory attributes of the meat. The grain finishing system not only produced heavier carcasses with greater marbling scores than the grass finishing system, but also had lower shear force and a marked impact on steaks’ sensory attributes and consumer acceptability. In addition, the color attributes were influenced by the finishing system, and the results were more favorable for the grass-fed meat.
The AK had greater dressing percentage and ribeye area compared to RA steers, as well as a higher marbling score. Both genotypes had similar sensory scores, with only small indications that AK might produce meat with higher beef juiciness than RA, which likely may be related to high marbling.
Fatty acid analyses are still being processed. We are finalizing the methods and we are planning to have them run in the next month at the MSU Core facility in physiology. Due to COVID, some laboratories were shut down and we did not have the results yet.
Education
While this is a research project, we aim to engage and involve producers. First, we will select a group of producers to serve as advisors for the project. Second, we have built in $5000 in travel for producer engagement visit for survey development, economic analysis and production data. Next, we will host education days for two years at the Upper Peninsula and Lake City Center, a MSU AgBioResearch Center in northern lower Michigan. We include producers and value chain participants in surveys and focus groups. Results will be presented through producer meetings and education days. Data will be published in appropriate academic and outreach publications. Additionally, a seminar will be conducted during the National Grassfed Exchange meetings.
Project Activities
Educational & Outreach Activities
Participation summary:
Given the overlap of this project and the COVID-19 pandemic, which had significant impacts on the beef sector, we pivoted the focus groups to explore the impacts of the pandemic on the beef supply chain. We hosted three focus groups – two with beef producers and one with representatives of the processing and retail sectors. Data analysis is ongoing, but participants highlighted elements of the supply chain that were more and less resilient to the pandemic and discussed the potential of statewide cooperatives in supporting resilience in the future.
On-farm demonstration:
The Upper Peninsula Research and Extension Center held a field day in August 2019 to highlight a wide range of research and education projects conducted at the center. The beef cattle feeding study was approached, and the data collected up to that moment were presented to local producers. The objective was to support and assist in the development of farmers in the Upper Peninsula.
Other Educational activities:
Beef producers who were interested in learning more about cooperatives attended a gathering with two guest speakers at the Clare-Gladwin RESD conference room, Clare, MI in January 2020. The speakers shared the reasons for the success of farmer/rancher owned cooperatives that they are involved in. It is difficult to be successful on an island, those producers that are fortunate enough to belong to a group of like-minded individuals that bring different strengths to the table should be more successful than a person that tries to go at it alone.
We invited speakers from Both Country Natural Beef and Desert Mountain Grass-Fed Beef, which are suppliers for Whole Foods among others. The guest speakers for the evening were:
- Stacy Davies, Country Natural Beef
- Bob Howard, Desert Mountain Grass-Fed Beef
- Jason Rowntree, Associate Professor, Animal Science at Michigan State University
Learning Outcomes
- Grass-fed beef system
- Genetics strategy
- beef healthfulness
- Sensory attributes
Project Outcomes
NA