Final report for LNC20-436
Project Information
Background: In 2017 over 3100 farms across the North Central Region (NCR) dedicated 4,928 acres to strawberry production, with an economic value of $17.5 million for growers in Michigan, Ohio, and Wisconsin, alone. Lygus lineolaris, the tarnished plant bug (TPB), is the primary insect pest of strawberries in eastern and central North America. Strawberries are most susceptible to TPB damage during bloom and the early stages of fruit development, which leads to difficulties balancing TPB management with pollinator protection. Improved monitoring tools and strategies that reduce TPB colonization of strawberry fields during the short window of susceptibility may offer a solution to this problem.
Trap cropping: Alfalfa (Medicago sativa) is a preferred TPB host, that has been deployed as a trap crop against Lygus spp. in California and Europe. This project examined the potential of alfalfa trap cropping to improve TPB management in June-bearing strawberries. We sought to understand:
1) Whether alfalfa perimeter strips influence TPB populations in associated strawberry fields?
2) The extent of TPB movement between alfalfa perimeter strips and associated strawberry fields?
3) The impact of alfalfa perimeter strips on beneficial arthropod populations?
Data were collected over three years at three commercial strawberry farms in Southern Wisconsin. We found that alfalfa perimeter strips reduced TPB densities by an average of 36% compared to paired control plots. In a mark-capture experiment we observed approximately three times as many TPB moving from the strawberry into the alfalfa strips, and that females were overrepresented among immigrants to alfalfa. While the presence of alfalfa perimeter strips increased beneficial arthropod abundance and diversity in experimental plots overall, most effects were limited to the alfalfa strip itself, with little spillover into adjacent strawberry fields. These data suggest that preferential utilization of alfalfa by TPB underlies the observed population reductions and that alfalfa perimeter strips act as a trap crop in June-bearing strawberries.
Monitoring: Growers also expressed concerns about the efficacy of current TPB monitoring recommendations. While non-UV white sticky traps are frequently recommended, several studies have demonstrated that other colors are more efficient (Wold and Hutchison 2003; Legrand and Los 2003). Moreover, trap visual qualities may interact with chemical lures, enhancing or undermining insect attraction. We sought to understand:
1) The impact of trap color on TPB capture.
2) The potential for plant-derived semiochemicals to improved TPB monitoring.
Trapping experiments in alfalfa and strawberry fields confirmed grower concerns that non-UV white sticky traps were ineffective for TPB monitoring. Red traps captured the most TPB in both alfalfa and strawberry fields, averaging 733% more TPB than white traps. Previous work in our lab had determined that TPB antennae are sensitive to (Z)-3-hexenol, (R)-(+)-α-pinene, (E)-β-ocimene, (±)-linalool, and sulcatone. A field experiment was conducted to determine whether any of these compounds increased TPB trap catch compared to blank controls. We found that (±)-linalool increased TPB capture by 85% compared to controls. As (±)-linalool is a mixture of (S)-(+)- and (R)-(-)-linalool, which may elicit different behavioral responses, a second trapping experiment was conducted to examine how stereochemistry influences TPB attraction to (±)-linalool. We observed that red traps with (±)-linalool lures captured 108% and 112% more TPB than red controls and those baited with (R)-(-)-linalool respectively, while similar increases were not observed for white traps. These data suggest that (S)-(+)-linalool mediates TPB attraction to the racemate, while (R)-(-)-linalool does not deter TPB.
Education: Our educational approach focused on presenting research at grower-centered conferences and these data have been presented at the Wisconsin Fresh Fruit and Vegetable Conference (WFFVC) three times, at the Great Lakes EXPO, and at the Marbleseed Organic Research Forum. We expected that exposure to this research would lead to knowledge gains around the use of alfalfa trap crops to manage TPB and increased willingness to incorporate alfalfa perimeter strips into field designs. Pre-study surveys were conducted at the WFFVC in 2020, and had 16 respondents, 6.25% of whom knew that alfalfa has been deployed to manage Lygus spp., 43.75% of whom responded that it had not, and 50% of whom were unsure. 31.25% of growers reported that they would not consider trap cropping with alfalfa, even if it reduced insecticide inputs and/or TPB damage. The post-study survey (n = 24) revealed less certainty around alfalfa trap cropping, with 91.67% responding ‘unsure’ and 8.33% responding that alfalfa has been deployed to manage Lygus spp., while none responded that it had not; and more openness to the idea of trap cropping, with only 13.64% of respondents saying that they would not consider implementing a trap crop for TPB management. These findings suggest that growers are open to the idea of trap cropping. Small plot studies examining how this strategy impacts insecticide use and TPB damage, and refining recommendations may be useful for improving grower confidence and adoption of trap cropping.
1) Determine the efficacy of alfalfa trap cropping as a cultural control strategy for managing TPB
2) Determine the extent of movement between the trap crop and the cash crop
3) Assess the impact of alfalfa trap cropping on beneficial and pest arthropod communities
4) Assess the effect of trap color on TPB capture
5) Identify semiochemicals that may facilitate TPB monitoring and mass trapping
The tarnished plant bug is the primary insect pest of strawberries in the north-central (Rose et al. 1996; Matos & Obrycki 2004; Guédot, unpublished data). Strawberries are susceptible to TPB damage from flowering through fruit development, with susceptibility decreasing as fruit matures (Handley & Pollard 1991). Tarnished plant bugs feed on the achene and/or receptacle of developing strawberries (Allen & Gaede 1963; Handley & Pollard 1991), which leads to "cat-facing" and apical seediness, reducing fruit size, quality, and marketability (Schaefers 1980). Insecticide applications are the primary management strategy for TPB management (Rhainds et al., 2001). However, because strawberries are most susceptible to TPB damage during and shortly after bloom, balancing pest management with pollinator protection can be difficult in this system.
Trap cropping is a cultural control strategy in which a preferred host species is planted alongside the primary cash crop to divert, intercept, and retain insect pests (Shelton & Badenes-Perez, 2006). This strategy has been employed against Lygus hesperus in California (Sevacherian & Stern 1975; Godfrey & Leigh 1994; Swezey et al. 2007), Lygus rugulipennis in Europe (Easterbrook and Tooley 1999; Accinelli et al. 2005; Ondiaka et al. 2016), Lygus pratensis in China (Zhang et al. 2020; Wang et al. 2021), and Lygus lineolaris in Canada (Dumont & Provost 2019, 2022); and may be useful for managing L. lineolaris in the North Central region. A critical challenge of trap cropping is ensuring that trap crops remain sinks for the target pest, rather than become a source of infestation (Shelton & Badenes-Perez, 2006). Accordingly trap crops frequently require supplemental management such as vacuuming (Swezey et al., 2007), strip cutting (Godfrey and Leigh, 1994), or insecticide applications (Zhang et al., 2020; Weng et al., 2020; Dumont et al., 2019; Accinelli et al., 2005). However, the short window of TPB susceptibility may reduce the risk of dispersal from the trap crop into June-bearing strawberries compared to day-neutral and everbearing varieties, which flower later and for longer periods of time. Alfalfa is a preferred L. lineolaris host that has previously been deployed as a trap crop to manage L. hesperus and L. rugulipennis in day-neutral and everbearing strawberries, respectively (Swezey et al. 2007; Easterbrook & Tooley 1999), as well as other crops (Godfrey and Leigh, 1994; Sevacherian and Stern, 1974; Stern 1966; Accinelli et al., 2005). As a perennial crop, alfalfa trap crops can easily be incorporated into the perennial production system employed in the north-central region and is a logical choice for a trap crop in June-bearing strawberry.
Improvements to TPB monitoring strategies will allow growers to better assess risks associated with TPB populations and improve management decision-making. Insects rely on the integration of chemical and visual information to successfully navigate complex environments and both of these sensory channel can be exploited to facilitate insect monitoring (Campbell and Borden 2009). Olfactory cues frequently mediate long-range orientation, while visual cues affect behavior at shorter distances (Prokopy and Owens 1983). Investigations of chemical attractants of Lygus spp. have largely focused on sex pheromones, with recent successes in deployment of pheromone lures against TPB (Parys and Hall 2017; George et al. 2023). Host plant volatiles represent a complementary source of potentially attractive chemicals. Attraction to host plant volatiles is well-established for L. hesperus (Blackmer et al. 2004; Blackmer and Canas 2005; Williams et al. 2010) and L. rugulipennis (Frati et al. 2008, 2009; Koczor et al. 2012; Baroffio et al. 2018; Fountain et al. 2021), but kairomone use in TPB has not been thoroughly investigated. van Tol and colleagues (2022) recently demonstrated that light traps were more effective than pheromone traps for monitoring L. rugulipennis in greenhouses, emphasizing the importance of visual cues in Lygus spp. orientation. Early investigations of visual traps for TPB monitoring in apple orchards determined that non-UV reflecting white, yellow, and clear rectangles were more effective than blue, dark red, silver, orange, green, and black traps (Prokopy et al. 1979). As white traps were also useful for monitoring the European apple sawfly (Hoplocampa testudinea), they were recommended. Over time such traps became the standard for monitoring TPB populations in many crops. However, recent studies have demonstrated that pink traps are more efficient than white for monitoring TPB in peach orchards (Legrand and Los 2003), while yellow traps are superior in strawberry and alfalfa fields (Wold and Hutchison 2003).
Cooperators
Research
Objective 1: Determining the efficacy of alfalfa trap cropping as a cultural control strategy for TPB.
Alfalfa perimeter strips may impact TPB density in associated strawberry fields in several ways:
1) Reduced density in strawberry and increased density in alfalfa perimeter strips would be consistent with alfalfa acting as a trap crop in this system.
2) Increased density in strawberry and increased density in alfalfa perimeter strips would suggest that alfalfa acts a source of infestation in this system.
3) No change in strawberry would be inconsistent with the hypothesis that alfalfa acts as a trap crop in this system.
Objective 2: Determine the extent of movement from the trap crop into strawberry.
The degree and direction of TPB movement between alfalfa perimeter strips and strawberry fields is important for understanding whether and how alfalfa perimeter strips function as a trap crop. Three movement patterns may be observed:
1) No net movement suggests that alfalfa is not attracting TPB out of the strawberry field. Changes in TPB density associated with alfalfa perimeter strips may stem from delayed colonization of strawberry or biological control.
2) Net movement into alfalfa suggests that alfalfa attracts TPB out of the strawberry field and is consistent with alfalfa acting as a trap crop.
3) Net movement into strawberry suggests that alfalfa perimeter strips act as a source of infestation and require supplemental management.
Objective 3: Assessing the impact of incorporating alfalfa trap strips on beneficial arthropod communities.
Reduced TPB density in trap cropped strawberry does not necessarily mean that alfalfa perimeter strips act as a trap crop. An alternative explanation is that alfalfa perimeter strips enhance biological control in adjacent strawberry fields. Alfalfa perimeter strips may impact the abundance and diversity of beneficial arthropod taxa in several ways:
1) If no effect is observed, any changes in TPB density associated with alfalfa perimeter strips are not due to enhanced biological control.
2) If natural enemy abundance/diversity increase in strawberry fields, biological control remains a viable alternative explanation for changes in TPB density associated with alfalfa perimeter plantings.
3) If natural enemy abundance/diversity increases in alfalfa, but not associated strawberry fields, biological control cannot explain changes in TPB density in strawberry fields, but may be enhanced within the trap crop.
Objective 4: Assess the effect of trap color on TPB capture.
It is expected that TPB capture will vary with trap color.
Objective 5: Assess TPB attraction to host volatiles
It is expected that antennally active floral volatiles are more likely to attract TPB than non-floral volatiles, as TPB is known to prefer flowering hosts.
We established a grower advisory panel to ensure that this project was implemented in a way that fully addresses stakeholder needs and concerns.
Objective 1: Determining the efficacy of alfalfa trap cropping as a cultural control strategy for TPB.
Site Selection: Trials were conducted between 2020 and 2022 at three commercial strawberry farms in Southern Wisconsin. All farms employed a perennial, June-bearing, matted-row production system, as is typical of strawberry production in the north-central US (Samtani et al., 2019). The strawberry cultivars varied across farms and fields, and included ‘Wendy’, ‘Annapolis’, ‘Honeoye’, and ‘Jewel’. Strawberry fields were watered and fertilized at the growers’ discretion. Bifenthrin was applied to the strawberries at two farms in 2020 and 2022 to manage thrips, these applications were applied to both control and experimental plots and data was collected normally. Fields that had been in production for at least three years and thus were nearing the end of the production cycle were selected to minimize unforeseen negative impacts of the trap cropping strategy, such as increases in TPB pressure.
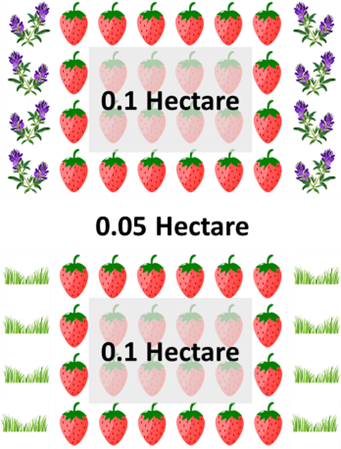
Experimental Design: Strawberry fields were divided into paired 0.1 hectare experimental and control plots, which were separated by a 0.05-hectare buffer zone (Figure 1). The distance between blocks was at least 20 m. At each experimental plot, 1 m-wide x 20-40 m-long strips of alfalfa were established along both sides of each experimental plot, running parallel to the strawberry rows, approximately 1 m from the first strawberry row. Alfalfa perimeter strips were established by tilling the soil and transplanting greenhouse-started alfalfa plants in a single row every 0.33 m along the entire length, and then broadcast-seeding the strip at a rate of 13 kg/ha. Control plots retained the standard turf border. This design was replicated five times in 2020, six times in 2021, and four times in 2022. Alfalfa strips were initially established at all farms in the spring of 2020 and were established at new plots on two farms in 2021, as some of the 2020 fields were rotated out of strawberry production. Second- or third-year alfalfa strips were present alongside all experimental plots in 2022.
TPB Sampling: TPB were sampled with 38 cm diameter sweep nets (Oakfield Apparatus, Oakfield, WI, USA). In each plot, a set of 20 sweeps was taken from the centermost 10 m of the field perimeter, each of the first three strawberry rows, and the 10th strawberry row on each side of the field weekly, beginning the last week of May through the end of strawberry season in 2020, 2021, and 2022. Sweep net samples were stored in paper bags at -20°C until processed. TPB were identified to species and counted under a stereomicroscope (Olympus XZS10, Olympus Life Science, Waltham, MA, USA).
Statistical Analysis: All statistical analyses were performed using R version 4.1.3 (R core team 2022). Linear mixed models were fitted using the “lme4” package (Bates et al., 2015) and the package “lmerTest” (Kuznetsova et al., 2017) was employed to assess overall model outputs. The package “emmeans” (Searle et al., 2022) was utilized to compare geometric means after statistically significant effects were identified.
TPB densities collected on the same day from opposite sides of each plot were averaged, and a linear mixed model was fit to examine the relationship between TPB density (insects/sweep) and the presence of alfalfa strips, row of collection, week of collection, and all interactions of alfalfa, row, and week. The nested random effects term consisted of week within field within farm within year (1|Year/Field/Week). To improve homogeneity of variance and normality of the residuals, a log(n+0.1) transformation was applied before analysis. Geometric means were then compared across levels of all significant effects, using Tukey’s HSD test to control family-wise error rate during multiple comparisons.
Objective 2: Determine the extent of movement from the trap crop into strawberry
In 2022, a protein immunomark-capture study (Hagler, 2019) was conducted to determine the extent of TPB movement between the alfalfa trap crop and adjacent strawberry plants. This experiment was replicated at two of the three farms, as TPB populations at one farm were too low in 2022 to assess movement. A 12.5% egg white solution was applied to the alfalfa perimeter strips at a rate of 1 L/5 m, while a 100% solution of non-fat milk was applied to the first three strawberry rows at the same rate. Protein markers were applied to four plots on 5 June and reapplied on 19 June using dedicated gas-powered backpack sprayers to prevent contamination. Before the second protein application, ten leaves were randomly collected from each strawberry and alfalfa row to which a protein marker was applied. Enzyme-linked immunosorbent assays (ELISAs) were conducted on leaf tissue to verify that markers were no longer present. TPB were collected 36 hrs after each application on 6 June and 20 June, following the sweep net sampling protocol described previously. To prevent the risk of contamination via sweep nets, all collection nets were machine-washed before use and only used once. Insects were then transferred to bags and placed on dry ice. Upon returning to the lab, bags were stored in a freezer -20°C until sorting. Prior to beginning the mark-capture experiment, insects serving as negative controls were collected from an alfalfa field at the West Madison Agricultural Research Station in Madison, WI.
TPB were sorted and identified as nymphs, adult males, or adult females and transferred to individual 1.5 mL microcentrifuge tubes with a clean toothpick. Indirect ELISAs were performed to detect chicken ovalbumin and bovine casein on insects collected from the perimeter alfalfa strips and first three strawberry rows. Briefly, all insects were soaked in TBS at 4°C overnight and 80 ul of rinse was added to each well of an ELISA plate (medisorp coating, Thermo Fisher Scientific, Waltham, MA, USA) and allowed to incubate at room temperature for 2 hrs before the rinse was discarded and wells were washed five times with 300 ul of PBS-Tween (Sigma-Aldritch, St. Louis, MO, USA). An aliquot of 300 ul of 50% soy milk solution was added to each well and incubated for 30 min, after which wells were washed twice with 300 ul of PBS-Tween. Then, 50 ul of primary antibody solution, either 1:2000 rabbit anti-casein (Abcam, Waltham, MA, USA) or 1:4000 rabbit anti-ovalbumin (Abcam, Waltham, MA, USA) in 50% soy milk solution with 1.3 ug/ml silwet L-77 (Helena Chemical, Memphis, TN, USA) was added to each well and allowed to incubate for 1 hr before the antibody solution was discarded and wells were washed five times with 300 ul PBS-Tween. Then, 50 ul of 1:10000 goat anti-rabbit-HRP (Abcam, Waltham, MA, USA) in 50% soy milk with 1.3 ug/ml silwet L-77 before the antibody solution was discarded and wells were washed five times with 300 ul PBS-Tween. Then, 50 ul of TMB solution (SurModics, Eden Prairie, MN, USA) was added and allowed to incubate for 10 min before the reaction was stopped with 50 ul of TMB stop solution (Invitrogen, Waltham, MA, USA). Optical density was determined at 450 nm on an iMark Microplate Absorbance Reader (Bio-Rad Laboratories, Des Plaines, IL, USA).
One column of each 96-well ELISA plate was dedicated to negative control samples. For each plate, mean (± SD) absorbance values were calculated for the negative controls, and TPB were considered positive for a particular marker if the absorbance was three standard deviations above the negative control mean (Buczkowski & Bennett, 2007; Jasrotia & Ben-Yakir, 2006). Rinses from all TPB were subjected to both ELISAs. The proportion of individuals collected from strawberry rows (casein-marked) testing positive for casein and individuals collected from alfalfa (ovalbumin-marked) testing positive for ovalbumin were used to assess the efficiency of marker application, while casein-marked individuals collected from alfalfa and ovalbumin-marked individuals collected in strawberry were assumed to have moved between plants.
Statistical Analysis: The "t.test" and “chisq.test” functions in the package "stats'' were used to conduct paired t-tests and chi-square tests, respectively. The package chisq.posthoc.test (Beasley & Schumacher, 1995) was employed to conduct post-hoc comparisons based on the residuals of a chi-squared test. A paired t-test was applied to compare the number of immigrants collected from strawberry and alfalfa. Subsequently, a chi-squared test was applied to compare the frequency of adult males, adult females, and nymphs among immigrants collected from strawberry, immigrants collected from alfalfa, and the overall TPB population to determine whether the direction of TPB movement varied across sex and lifestage.
Objective 3: Assessing the impact of incorporating alfalfa trap strips on pest and beneficial arthropod communities.
Insect Sampling: Beneficial arthropods were sampled with sweep nets as described above, but also sampled passively, with clear sticky traps (Alpha Scents Inc., Canby, OR, USA) and pitfall traps (Dart Container Corporation, Mason, Michigan, USA). Traps were located in the field perimeter (either alfalfa strip or turf border) and in the second and tenth strawberry rows from the field perimeter. Trapping was conducted over seven days every other week from the last week of May through the end of strawberry harvest in 2020 and 2021. Sticky traps consisted of 15.25 cm clear squares hung from garden stakes at a height of 1 m. Traps were removed after seven days, wrapped in cellophane, and taken to the lab for insect identification. Pitfall traps consisted of a 240 ml solo cup containing drowning solution consisting of 15% food-grade propylene glycol (Duda Energy, Decatur, AL, USA) in water with a small amount of unscented dish soap (Colgate-Palmolive, New York, NY, USA) to reduce the surface tension of the liquid. Each trap cup was placed such that the lip of the cup was flush with the surrounding ground. After seven days, the contents of the trap were filtered through a disposable paint strainer with a 226 μm mesh size (Trimaco Inc, Elk Grove, IL) and the drowning solution was discarded. Samples were stored in 70% ethanol until identification.
Insect Identification: Beneficial arthropods were identified and counted under a stereomicroscope (Olympus XZS10). Non-insect arthropods were identified to order. Beneficial insects in the pitfall traps and sweep net samples were identified to family apart from minute (< 5 mm) parasitic wasps. Because arthropods collected on the sticky traps were frequently badly damaged, we used the subsection Calyptratae to replace family-level identification for the Anthomyiidae, Calliphoridae, and Tachinidae, bees were identified to Anthophila, and other Apocrita were identified as large wasps, minute wasps, or ants.
Statistical Analysis: All statistical analyses were performed using R version 4.1.3 (R core team 2022). Multivariate analysis of beneficial arthropod datasets were conducted using the package “vegan” (Dixon, 2003). Subsequent univariate linear mixed models were fitted using the “lme4” package (Bates et al., 2015) and the package “lmerTest” (Kuznetsova et al., 2017) was employed to assess overall model outputs. The package “emmeans” (Searle et al., 2022) was utilized to compare geometric means after statistically significant effects were identified.
Beneficial arthropod counts from sticky cards, sweep net samples, and pitfall traps collected on the same day from opposite sides of each plot were averaged and Bray-Curtis distance matrices were constructed for each dataset using the function ‘vegdist’. Distance-based redundancy analyses (db-RDA) were then applied to examine the relationship between each distance matrix and the presence of alfalfa perimeter strips, the row from which samples were collected, and the interaction of perimeter strips and row. A conditional variable was included to partition out the variance associated with year, field, and week. Following a significant db-RDA, the correlation of each taxon with the significant canonical axes was examined to determine which taxa underlie observed differences in bycatch community composition. Distance-based multivariate methods can confound effects of location and dispersion (Warton et al., 2012), we therefore applied the “betadisper” function to conduct multivariate analogs of Levene's test for homogeneity of variances for each significant predictor variable.
Following significant multivariate analyses, individual univariate linear mixed-effects models were fitted to examine the relationship between the abundance of the most common taxa, the presence of alfalfa perimeter strips, the row from which samples were collected, and their interactions. The nested random effects term for these models consisted of week within field within year (1|Year/Field/Week). To preserve statistical power when making multiple comparisons, univariate tests were restricted to the ten most common taxa in each data set or all taxa present in at least 1% of samples, if fewer than ten taxa were present in 1% of samples. Bonferroni correction was applied to control family-wise error rate during multiple testing. Geometric means were then compared across levels of all significant effects, using Tukey’s HSD test to control family-wise error rate during multiple comparisons.
Objective 4: Assess the effect of trap color on TPB capture.
Trap Description: This objective evaluated TPB attraction to commercially-available traps of different colors (Table 1). Red, white, and yellow traps were purchased from Great Lakes IPM (Vestaburg, MI), clear traps were purchased from Alpha Scents Inc. (Canby, OR), and blue traps were sourced from Arbico Organics (Oro Valley, AZ). The dimensions of available traps varied slightly, so sections of blue, clear, red, and yellow traps were removed such that 400 cm2 of sticky surface was present on each trap. Colorimetric features were examined using a computer program (Byers 2006). Digital photographs of each trap were taken with a 50-megapixel cell phone camera between 1130 and 1230 h. A 500x500 pixel square in the center of each photograph was analyzed to determine the RGB attributes of each trap (Table 1). The RGB values were then used to determine hue, saturation, and brightness (Byers 2006).
|
Trap Color |
Manufacturer |
Red |
Green |
Blue |
Hue |
Saturation |
Brightness |
|
Blue |
Agrisense |
52 |
162 |
243 |
0.5701 |
0.785 |
0.949 |
|
Clear |
Alpha Scents |
NA |
NA |
NA |
NA |
NA |
NA |
|
Red |
Trece |
213 |
70 |
59 |
0.0119 |
0.723 |
0.835 |
|
White |
Great Lakes IPM |
231 |
228 |
222 |
0.1041 |
0.034 |
0.901 |
|
Yellow |
Agrisense |
202 |
180 |
0 |
0.1485 |
1.0 |
0.792 |
Table 1: Manufacturer and color characteristics of color traps tested. Color characteristics were based on digital photographs taken with a cell phone camera and RGB and HSB values were extracted using software developed by Byers (2006).
Experimental Design: Trapping was conducted at the West Madison Agricultural Research Station (Madison, WI). Each block consisted of one linear array of blue, clear, red, white, and yellow sticky traps arranged along the perimeter of a 3.44 ha alfalfa hay field. Garden stakes were driven into the ground at a slight angle and traps were hung over the alfalfa such that the bottom of each trap was just above the alfalfa canopy. Within each block, traps were spaced 2 m apart and blocks were separated by 10 m. Each block of traps was replicated ten times in a randomized complete block design during each sampling event. Samples were collected over two one-week periods immediately before the third and fourth alfalfa harvest, in late July and late August of 2021.
Traps were removed after each seven-day sampling period and wrapped with cellophane in the field, TPB were visually identified and counted under a stereomicroscope (Olympus XZS10) upon returning to the lab.
Statistical Analysis: All statistical analyses were conducted in R version 4.1.3 (R Core Team, 2022). Linear mixed-effects models were fitted using the lme4 package (Bates et al. 2015) and significance tests of the fixed effects were conducted using lmerTest (Kuznetsova et al. 2017). The package emmeans (Lenth 2022) was employed to compare predefined groups. Linear mixed-effects models were fit to examine the relationship between TPB capture rate (TPB/trap/week) and trap color. In both cases, capture rate was square root transformed to improve homogeneity of variance and normality of the residuals. Trap color was the sole predictor in our models and the random effect term consisted of block nested within sampling date. After color was determined to significantly influence capture rate, the estimated marginal means of each color were compared. Sidak’s method was employed to control family-wise error rate during multiple comparisons testing.
Objective 5: Identify semiochemicals that may facilitate TPB monitoring and mass trapping
Previous experiments conducted in our lab revealed that TPB antennae are sensitive to (Z)-3-hexenol, (R)-α-pinene, (E)-β-ocimene, (±)-linalool, and sulcatone.
TPB attraction to antennally active plant volatiles: Field experiments were conducted to compare TPB capture rate between traps baited with each of the five antennally-active host plant volatiles identified previously and a negative control. Each block consisted of a linear array of six red sticky traps (Trécé Pherocon SWD STKY adhesive traps; Great Lakes IPM, Vestaburg, MI), as previous experiments conducted in our lab (Hetherington 2023) and others (George et al., 2023) revealed that these traps capture TPB at significantly higher rates than other colored traps. Each trap was baited with a lure containing 500 mg of either (Z)-3-hexenol, (R)-α-pinene, ocimene, (±)-linalool, sulcatone, or no stimulus (control). Three blocks were arranged along the Southern (upwind) perimeter of a 3.44 hectare alfalfa hay field at the West Madison Agricultural Research Station (Madison, WI). Garden stakes were placed at a slight angle and traps were hung over the alfalfa, such that the bottom of each trap was just above the alfalfa canopy. Traps were separated by 10 m within each block and blocks were separated by 20 m. Each block was replicated three times in a randomized complete block design during each sampling period. Traps and lures were changed weekly over two four-week sampling periods beginning one week after the first and second harvest of alfalfa, 6 June – 4 July and 11 July - 8 August, 2022. After removal, traps were wrapped in cellophane and returned to the lab, where TPB were identified and counted under a stereomicroscope (Olympus XZS10). Sweep net samples were taken weekly during each sampling period to assess TPB population in the alfalfa field near each block. Ten sweeps were taken with a 45 cm sweep net (Oakfield apparatus, Oakfield, WI) along the length of each block, stored in paper bags, and frozen upon returning to the lab. TPB were identified as juveniles or adults and adults were sexed, numbers of juveniles, adult males, and adult females were recorded.
Influence of trap color and stereochemistry on TPB attraction to (±)-linalool: An experiment was conducted to examine the enantiospecificity of TPB attraction to (±)-linalool and whether this response depends on trap color. Each block consisted of a linear array of three red and three white sticky traps (Great Lakes IPM, MI, USA). Traps were baited with lures containing 500 mg of either (±)-linalool, (R)-(-)-linalool, or no stimulus (control) such that each lure was associated with one trap of each color in each block. (S)-(+)-linalool was not tested due to the lack of commercial availability. Nine blocks were arranged along the Southern perimeters of two alfalfa hay fields that were separated by 100 m (6.34 hectare field, n = 5; 5.48 hectare field, n = 4) at the Arlington Agricultural Research Station (Arlington, WI). Trapping was conducted over two weeks, beginning two weeks after the third alfalfa harvest, between 9 August and 23 August, 2022. Traps were processed as described above. Sweep net samples were taken weekly during each sampling period to assess TPB population in the alfalfa field near each block as described above. The traps varied in surface area with 406.45 cm2 and 522.58 cm2 of sticky surface for the white and red traps, respectively, thus, TPB capture rates were divided by surface area and are reported as insects/cm2/week.
Statistical analysis: All statistical analyses were performed using R version 4.1.3 (R core team 2022). Linear mixed models were fitted using the lme4 package (Bates et al. 2015) and the package emmeans (Lenth 2022) was employed to compare predefined groups. The package lmerTest (Kuznetsova et al. 2017) was used to assess overall model outputs.
Data from both experiments were square root transformed to improve homoscedasticity and normality of model residuals. Linear mixed models were fit to examine the relationship between TPB capture rate and predictor variables. In the first experiment, lure identity was the sole predictor in our model, sampling date and block were included as crossed random effects. It was decided a priori to limit contrasts to each treatment and the negative control, as the goal of this experiment was to determine whether the presence of antennally active compounds increases TPB capture rate relative to control traps rather than compare attraction between active compounds. In the second experiment, lure identity, trap color, and their interaction were included as predictor variables, while sampling date and block were again included as crossed random effects. All pairwise comparisons were expected to be relevant for experiment 2, so no a priori contrasts were defined. Sidak's method was employed to control family-wise error rate during post-hoc multiple comparisons testing.
Objective 1: Determining the efficacy of alfalfa trap cropping as a cultural control strategy for TPB.
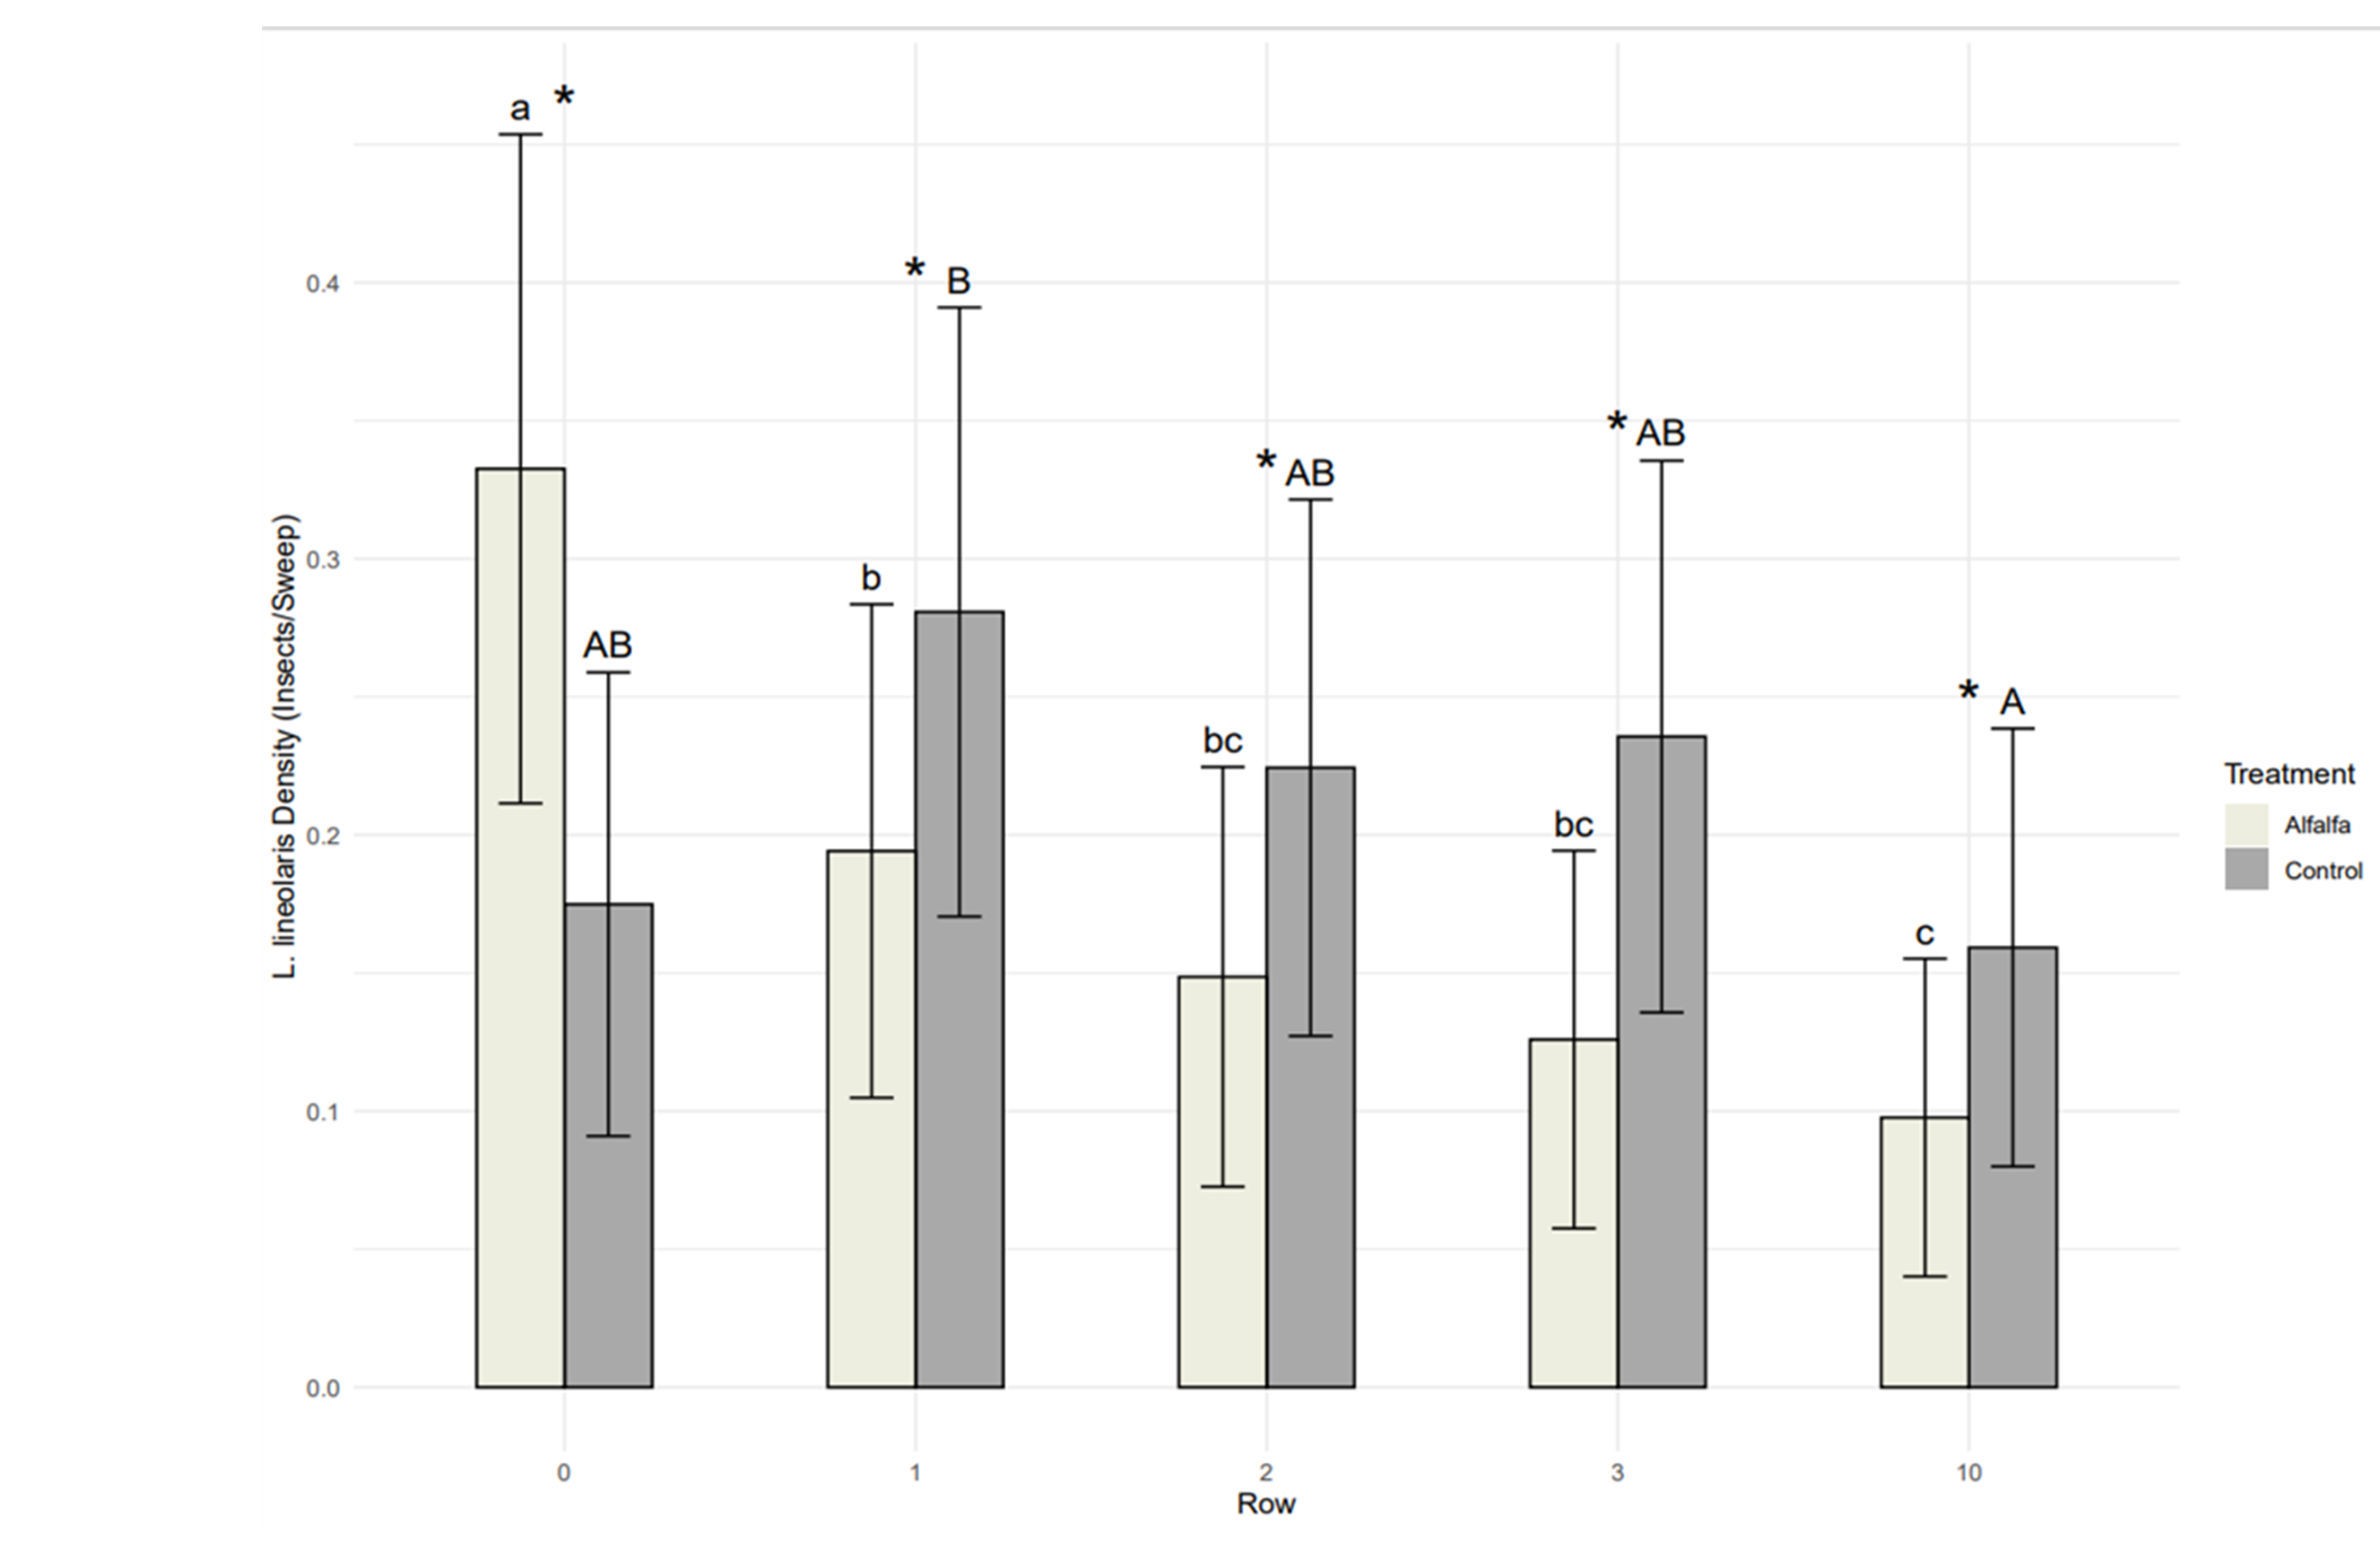
TPB density was significantly influenced by the presence of alfalfa perimeter strips (F1,443.52 = 20.81, P < 0.001), the row from which insects were collected (F4,62.85 = 3.96, P = 0.006), and the week of collection (F7,374.86 = 38.39, P < 0.001; Figure 2). Additionally, the effect of alfalfa perimeter strips depended on the row from which insects were collected (F4,443.76 = 26.63; P < 0.001; Figure 2), with 90.16% more TPB collected from alfalfa strips than control field perimeters and 36.77% fewer TPB collected from trap cropped strawberry rows, on average, compared to controls. The effect of row was similar between trap cropped and control strawberry fields, with significantly higher TPB densities in row 1 compared to row 10 and intermediate densities in rows 2 and 3 (Figure 2).
Our results suggest that alfalfa perimeter strips concentrate TPB populations and reduce TPB density in adjacent strawberry fields compared to paired control plots, which is consistent with the hypothesis that alfalfa acts as a trap crop in this system. Further examination of how alfalfa perimeter strips mediate the observed effect are presented with Objective 2. Enhanced biological control remains a viable alternative explanation of the observed reductions and is investigated in Objective 3.
Objective 2: Determine the extent of movement from the trap crop into strawberry.
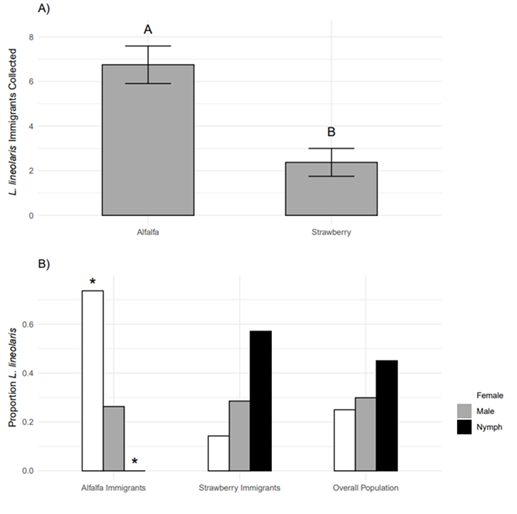
The mark-capture experiment revealed that TPB were moving between the strawberry field and the alfalfa perimeter strip. Thirty-six hours after marker application, 679 TPB were collected from marked plots, with 299 collected from alfalfa and 380 collected from marked strawberry rows. Marker coverage averaged 76% in the alfalfa and 80% in the strawberry. On average, 6.75 ± 0.84 immigrants were collected from alfalfa strips, while 2.38 ± 0.63 immigrants were collected from strawberry rows (Figure 3A; t = 4.23, df = 7, P = 0.003). Moreover, adult females represented a significantly higher proportion of immigrants to alfalfa (Ratio of females to males to nymphs: 73.68 : 26.32 : 0.00) than expected based on the overall population (25.00 : 29.92 : 45.08) (Figure 3B; χ2= 23.5, df = 2, P < 0.001), while the immigrant population in strawberry (14.29 : 28.57 : 57.14) reflected the overall population (χ2 = 0.54, df = 2, P = 0.7635).
These data clearly demonstrate net immigration into the alfalfa perimeter strips, suggesting that alfalfa perimeter strips do not merely arrest dispersing TPB, but attract TPB from strawberry fields throughout the season. Moreover, adult females, which represented 25% of the overall population, constituted 73.68% of emigrants from strawberry. This is further evidence that alfalfa strips indeed act as a trap crop and is consistent with observations that L. hesperus females, but not males, are attracted to alfalfa volatile emissions (Blackmer et al., 2004; Blackmer & Cañas, 2005). Alfalfa strips may be useful as a component of a push-pull management strategy for Lygus spp.. Alfalfa strips could be paired with reflective mulches as a deterrent, as such mulches have been shown to significantly reduced the number of TPB nymphs and TPB damage in small plots of day-neutral and June-bearing strawberries (Rhainds et al. 2001). A push-pull system combining L. rugulipennis sex pheromone lures and phenylacetaldehyde as the pull, and hexyl butyrate emitters as the push was recently shown to reduce L. rugulipennis damage to strawberries by approximately 80% in organic field trials (Fountain et al. 2021).
Objective 3: Assessing the impact of incorporating alfalfa trap strips on beneficial arthropod communities.
Sweep net samples: The beneficial bycatch of the sweep net samples was dominated by a few taxa (Table 1). The Anthomyiidae represented 19.83% of all collected beneficial arthropods, while minute parasitic wasps (16.69%), Dolichopodidae (11.61%), Syrphidae (9.85%), Araneae (8.58%), Rhagionidae (7.35%), Braconidae (6.92%), Coccinellidae (3.85%), Anthocoridae (2.81%), and Opiliones (2.67%) were also common in sweep net samples. The remaining 26 families accounted for 10.89% of sweep net collected beneficial arthropods, and included Nabidae, Formicidae, Halictidae, Tachinidae, Empididae, Ichneumonidae, Proctotrupidae, Andrenidae, Apidae, Chrysopidae, Reduviidae, Calliphoridae, Pompilidae, Sphecidae, Carabidae, Muscidae, Asilidae, Fanniidae, Sarcophagidae, Megachilidae, Vespidae, Mutillidae, Geocoridae, Chrysididae, Scoliidae, Conopidae, and Mantispidae.
Distance-based redundancy analysis indicated that the presence of alfalfa perimeter plantings significantly influenced the community sampled by sweep nets (F1,258 = 2.37, P = 0.002), as did the row from which insects were collected (F4,258 = 3.33, P = 0.001) and the week of collection (F5,258 = 10.72, P = 0.001). Arthropods tended to exhibit an edge-biased distribution in both trap-cropped and control plots, with 36.44% collected from the perimeter, 21.75%, 17.09%, and 14.84% collected from strawberry rows 1, 2, and 3, respectively, and only 9.87% collected from the 10th strawberry row. The impact of alfalfa depended on the week of sample collection (F5,258 = 1.36, P = 0.019), but not on the row sampled (F4,258 = 1.15, P = 0.179). Likewise, the effect of row varied by week (F20,258 = 1.20, P = 0.01), but no three-way interactions were detected (Alfalfa:Row:Week: F20,258 = 0.87, P = 0.958). Both the Alfalfa:Week and Row:Week interactions are largely due to low arthropod abundance in the first two weeks of sampling, with 3.77% and 8.51% of beneficial arthropods collected in week 1 and 2, respectively. On average, 21.93% of beneficial arthropods were collected in each of weeks 3 through 6.
Subsequent univariate tests revealed that the Rhagionidae, were, on average, 891.31% more abundant in trap cropped plots regardless of row (Table 1; Alfalfa - F1,281 = 14.79, Padj < 0.001; Alfalfa:Row – F4,281 = 2.28, Padj = 0.613), while the Anthomyiidae, Braconidae, and Coccinellidae tended to be more abundant in the alfalfa strips, but similar in experimental and control strawberry rows (Table 2; Anthomyiidae: Alfalfa - F1,281 = 2.86, Padj = 0.921; Alfalfa:Row – F4,281 = 3.73, Padj = 0.056; Braconidae: Alfalfa - F1,281 = 7.80, Padj = 0.035; Alfalfa:Row – F4,281 = 6.37, Padj < 0.001; Coccinellidae: Alfalfa - F1,280 = 10.45, Padj = 0.014; Alfalfa:Row – F4,280 = 5.68, Padj = 0.002). Neither alfalfa perimeter plantings nor row was found to influence the abundance of Araneae, Opiliones, or Anthocoridae in sweep net samples (Table 1). All the most common beneficial arthropod taxa except for Araneae (F4,280 = 3.28, Padj = 0.12) and Rhagionidae (F4,281 = 1.63, Padj = 1) were more abundant at the edge of the field than in the tenth strawberry row (Table 1).
|
Taxon |
Perimeter |
Strawberry 1 |
Strawberry 2 |
Strawberry 3 |
Strawberry 10 |
|||||
|
Alfalfa |
Control |
Alfalfa |
Control |
Alfalfa |
Control |
Alfalfa |
Control |
Alfalfa |
Control |
|
|
Anthomyiidae |
5.61 ± 1.3 A |
2.88 ± 0.85 B |
2.14 ± 0.48 B |
2.48 ± 0.88 B |
1.96 ± 0.37 B |
1.98 ± 0.42 B |
1.92 ± 0.38 B |
1.69 ± 0.3 B |
1.36 ± 0.26 B |
1.8 ± 0.51 B |
|
Minute Wasps |
5.44 ± 1.16 A |
2.67 ± 0.55 B |
1.53 ± 0.42 BC |
1.53 ± 0.43 BC |
1.17 ± 0.33 BC |
0.82 ± 0.2 C |
0.55 ± 0.15 C |
1.04 ± 0.26 C |
0.79 ± 0.2 C |
0.92 ± 0.19 BC |
|
Dolichopodidae |
2.35 ± 0.69 A |
1.25 ± 0.38 B |
2.14 ± 0.63 A |
1.24 ± 0.35 B |
1.72 ± 0.58 A |
1.15 ± 0.33 B |
1.18 ± 0.33 A |
0.91 ± 0.31 B |
0.73 ± 0.22 B |
0.92 ± 0.24 B |
|
Syrphidae |
2.09 ± 0.66 AB |
1.02 ± 0.24 AB |
1.61 ± 0.42 A |
1.98 ± 0.63 A |
1.01 ± 0.34 BC |
1.06 ± 0.35 BC |
0.89 ± 0.34 BC |
1.08 ± 0.39 BC |
0.17 ± 0.06 C |
0.43 ± 0.18 C |
|
Araneae |
1.69 ± 0.34 |
1.34 ± 0.25 |
1.29 ± 0.33 |
0.75 ± 0.12 |
0.96 ± 0.21 |
0.91 ± 0.18 |
0.53 ± 0.08 |
1.33 ± 0.29 |
0.63 ± 0.16 |
0.99 ± 0.22 |
|
Rhagionidae |
1.68 ± 0.8 A |
0.07 ± 0.05 C |
1.76 ± 0.87 A |
0.14 ± 0.09 B |
2.32 ± 1.02 A |
0.84 ± 0.5 B |
1.35 ± 0.84 A |
0.29 ± 0.14 B |
0.12 ± 0.09 B |
0.3 ± 0.17 C |
|
Braconidae |
3.83 ± 0.69 A |
1.29 ± 0.28 B |
0.54 ± 0.12 BC |
0.53 ± 0.11 BC |
0.48 ± 0.12 C |
0.36 ± 0.11 C |
0.3 ± 0.1 C |
0.26 ± 0.09 C |
0.24 ± 0.06 C |
0.32 ± 0.08 C |
|
Coccinellidae |
1.86 ± 0.45 A |
0.35 ± 0.1 B |
0.47 ± 0.16 B |
0.25 ± 0.06 B |
0.16 ± 0.07 B |
0.07 ± 0.04 B |
0.2 ± 0.09 B |
0.29 ± 0.14 B |
0.22 ± 0.1 B |
0.1 ± 0.04 B |
|
Anthocoridae |
0.83 ± 0.2 A |
0.92 ± 0.41 A |
0.21 ± 0.1 B |
0.33 ± 0.12 B |
0.14 ± 0.05 B |
0.2 ± 0.06 B |
0.09 ± 0.07 B |
0.27 ± 0.15 B |
0.06 ± 0.03 B |
0.13 ± 0.05 B |
|
Opiliones |
0.31 ± 0.1 |
0.09 ± 0.05 |
0.38 ± 0.12 |
0.59 ± 0.18 |
0.34 ± 0.14 |
0.17 ± 0.08 |
0.58 ± 0.2 |
0.23 ± 0.1 |
0.16 ± 0.05 |
0.28 ± 0.16 |
Table 2: Mean ± SE of the most common beneficial arthropods collected via sweep net samples in strawberry plots with and without alfalfa perimeter plantings and test statistics for univariate predictors. Bold text indicates a significant effect of alfalfa perimeter plantings at α = 0.05. Letters denote significant differences between rows.
Sticky Cards: The Calyptratae, minute parasitic wasps, and Dolichopodidae were the dominant beneficial arthropods captured on clear sticky traps, representing 44.54%, 27.61%, and 14.68% of total captures, respectively. Distance-based redundancy analysis indicated that row (F2,125 = 2.73, P= 0.005) influenced the beneficial arthropod community captured on clear sticky traps, while the week of collection had a marginal effect (F2,125 = 1.90, P = 0.057), but the presence of alfalfa perimeter plantings did not affect the community of beneficial arthropods collected on sticky traps (F1,125 = 1.47, P = 0.194). Analysis of the dispersion of each variable revealed that neither the effect of alfalfa perimeter plantings nor the effect of row could be attributed to differential dispersion (Alfalfa: F1,154 = 2.19, P = 0.141; Row: F2,153 = 0.67, P = 0.513). However, the effect of week may be due to dispersion, alone, or a difference in both dispersion and location (F2,153 = 3.78, P = 0.025).
Univariate tests on the most common beneficial arthropods revealed that sticky traps collected, on average, 30.39%, 78.47%, and 372.69% more spiders (F1,125 = 15.32, Padj = 0.002), large wasps (F1,125 = 10.07 Padj = 0.019), and bees (F1,125 = 10.15 Padj = 0.018), respectively, in trap cropped plots than controls (Table 3). The presence of alfalfa perimeter plantings did not influence capture of minute parasitic wasps, Calyptratae, Dolichopodidae, or Syrphidae (Table 2). Minute wasps were captured at significantly lower rates in row 2 compared to the perimeter or row 10 (Table 2).
|
Taxon |
Perimeter |
Strawberry 2 |
Strawberry 10 |
|||
|
Alfalfa |
Control |
Alfalfa |
Control |
Alfalfa |
Control |
|
|
Calyptratae |
46.63 ± 6.3 |
33.5 ± 2.74 |
43.52 ± 7.06 |
33.33 ± 4.04 |
34.98 ± 3.57 |
43.36 ± 5.28 |
|
Minute Wasps |
30.38 ± 4.02 A |
24.77 ± 2.71 A |
19.17 ± 2.05 B |
16.18 ± 1.61 B |
19.44 ± 1.21 A |
36.33 ± 12.85 A |
|
Dolichopodidae |
8.35 ± 2.25 |
12.65 ± 2.24 |
15.37 ± 3.36 |
16.96 ± 2.62 |
13.52 ± 1.86 |
10.56 ± 1.51 |
|
Large Wasps |
5.9 ± 1.19 A |
3.07 ± 0.75 B |
4.5 ± 1.39 A |
2.15 ± 0.37 B |
3 ± 0.73 A |
2.24 ± 0.65 B |
|
Araneae |
2.19 ± 0.26 A |
1.65 ± 0.21 B |
2.62 ± 0.35 A |
2.02 ± 0.29 B |
2.42 ± 0.36 A |
1.88 ± 0.28 B |
|
Syrphidae |
1.94 ± 0.35 AB |
1.85 ± 0.27 AB |
2.19 ± 0.33 AB |
1.71 ± 0.31 AB |
1.27 ± 0.28 B |
2.42 ± 0.27 A |
|
Bees |
0.85 ± 0.33 A |
0.65 ± 0.21 B |
2.85 ± 1.06 A |
0.52 ± 0.14 B |
3.77 ± 1.47 A |
0.51 ± 0.13 B |
Table 3: Mean ± standard error of the most common beneficial arthropods collected on clear sticky cards in strawberry plots with and without alfalfa perimeter plantings. Bold text indicates a significant effect of alfalfa perimeter plantings at α = 0.05 or a marginally significant difference 0.075 > P > 0.05. Letters denote significant differences between rows at α = 0.05.
Pitfall Traps: Myriapoda were the most common beneficial arthropod captured in pitfall traps, representing 31.57% of total captures, while minute parasitic wasps, Araneae, and Opiliones were also common, representing 19.8%, 16.02%, and 14.03% of captured beneficial arthropods, respectively (Table 4). Distance-based redundancy analysis indicated that the community of beneficial arthropods sampled by pitfall traps was not influenced by the presence of alfalfa perimeter plantings (F1,126 = 1.61, P = 0.183), row (F2, 126 = 1.18, P = 0.292), or week (F2,126 = 0.96, P = 0.444).
|
|
Perimeter |
Strawberry Row 2 |
Strawberry Row 10 |
|||
|
Taxon |
Alfalfa |
Control |
Alfalfa |
Control |
Alfalfa |
Control |
|
Myriapoda |
1.21 ± 0.44 |
0.48 ± 0.15 |
0.6 ± 0.23 |
1.46 ± 0.62 |
1.13 ± 0.73 |
1.15 ± 0.47 |
|
Minute Wasps |
4.2 ± 1.23 |
3.4 ± 1.07 |
5.75 ± 1.13 |
6.56 ± 1.15 |
6.48 ± 1.19 |
5.56 ± 1.16 |
|
Araneae |
3 ± 0.32 |
2.73 ± 0.43 |
2.65 ± 0.37 |
4.87 ± 1.37 |
2.13 ± 0.34 |
2.9 ± 0.7 |
|
Opiliones |
2.94 ± 0.39 |
2.15 ± 0.34 |
3.08 ± 0.47 |
2.4 ± 0.42 |
2.69 ± 0.54 |
2.63 ± 0.51 |
|
Formicidae |
0.67 ± 0.39 |
0.5 ± 0.14 |
0.65 ± 0.2 |
1.23 ± 0.34 |
0.44 ± 0.12 |
1.15 ± 0.22 |
|
Carabidae |
3.57 ± 1.01 |
3.37 ± 0.7 |
3.88 ± 0.66 |
3.12 ± 0.46 |
3.27 ± 0.59 |
3.17 ± 0.52 |
|
Anthomyiidae |
0.05 ± 0 |
0.04 ± 0.03 |
0.02 ± 0.02 |
0.02 ± 0.02 |
0.1 ± 0.06 |
0.1 ± 0.05 |
|
Staphylinidae |
0 ± 0.02 |
0.02 ± 0.02 |
0.02 ± 0.02 |
0.02 ± 0.02 |
0 ± 0 |
0.02 ± 0.02 |
Table 4: Mean ± standard error of the most common beneficial arthropods collected in pitfall traps in strawberry plots with and without alfalfa perimeter plantings.
Overall alfalfa perimeter strips had little impact on the beneficial arthropod community associated with June-bearing strawberry fields. While beneficial arthropod taxa tended to be more abundant in plots with alfalfa perimeter plantings, such increases were typically restricted to the alfalfa itself. Easterbrook and Tooley (1999) likewise observed that natural enemies were abundant in trap crops but did not spillover into strawberry. Although TPB predation or parasitism may be increased in the alfalfa strips, as has been documented for L. hesperus in trap cropped strawberry fields (Hagler et al., 2018; Swezey et al., 2014). Minute wasps, Braconidae, and Coccinellidae were all significantly more abundant in the alfalfa strip than strawberry rows or control plots. However, most braconids in our collections were members of subfamily Aphidiinae, not the euphorine wasps that parasitize Lygus spp. (M.C. Hetherington, personal observation) and Coccinellidae were recently shown to consume L. hesperus at relatively low rates (Hagler et al., 2020). These taxa were likely targeting aphids, which were abundant in the alfalfa strip (M.C. Hetherington, personal observation). These data do not support the hypothesis that biological control explains observed reductions in TPB density.
Objective 4: Assess the effect of trap color on TPB capture.
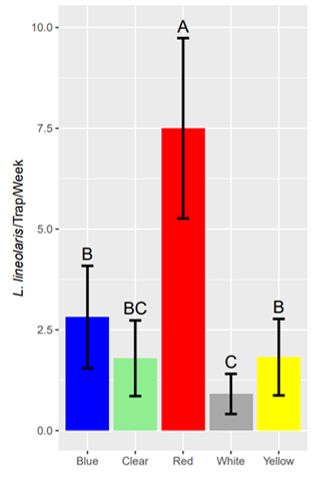
Trap color significantly influenced TPB capture rates (Figure 4; F4,74.47 = 20.33, P < 0.001). TPB capture rates were highest for red sticky cards, averaging 167%, 295%, 733%, and 313% more TPB per week than blue, clear, white, and yellow traps, respectively (µRed = 7.48; Blue: µ = 2.81, β = 1.40 ± 0.21, DF = 74, t ratio = 6.53, Padj < 0.001; Clear: µ = 1.89, β = 1.74 ± 0.24, DF = 74, t ratio = 7.24, Padj < 0.001; White: µ = 0.90, β = 1.78 ± 0.24, DF = 74, t ratio = 7.47, Padj < 0.001; Yellow: µ = 1.81, β = 1.24 ± 0.21, DF = 74, t ratio = 5.82, Padj < 0.001). The blue and yellow traps, respectively, captured more TPB than white traps, averaging 213% and 102% more Lygus per week, respectively (Blue: β = 0.65 ± 0.182, DF = 74, t ratio = 3.56, Padj = 0.007; Yellow: β = 0.80 ± 0.24, DF = 74, t ratio = 3.40, Padj = 0.011), while clear and white traps captured TPB at similar rates (β = 0.30 ± 0.21, DF = 74, t ratio = 1.430, Padj = 0.819). There was no statistical difference in Lygus capture rate between blue, yellow, and clear sticky cards (µBlue = 2.81, µClear = 1.89, µYellow = 1.81; Blue-Clear: β = 0.08 ± 0.24, df= 74, t ratio = 0.324, Padj = 1.00; Blue-Yellow: β = 0.11 ± 0.15, df = 74, t ratio = 0.77, Padj = 0.997; Clear-Yellow: β = 0.23 ± 0.19, df = 74, t ratio = -1.243, Padj = 0.914).
Although non-UV white sticky traps are frequently recommended for TPB monitoring, we observed that red traps were far more efficient. The high efficiency of red traps was unexpected, but is consistent with a concurrent study conducted in cotton (George et al. 2023). Attraction to red traps has been documented in the Cicadellidae, Psyllidae, and Aphidae (Sétamou et al. 2014; Rodriguez-Saona et al. 2012; Straw et al. 2011), but previous studies found red traps to be relatively unattractive to TPB (Prokopy et al. 1978) and L. hesperus (Blackmer et al. 2008; Landis and Fox 1972). Although few studies have evaluated spectral sensitivity among Hemiptera (van der Kooi et al. 2021; Döring and Chittka 2007), few insects possess photoreceptors that are maximally sensitive to red wavelengths (620-700 nm; van der Kooi 2021; Briscoe and Chittka 2001). However, the green-sensitive photoreceptors present in most insects exhibit modest sensitivity up to approximately 650 nm (Chittka and Waser 1997), wavelengths well within the red spectrum. Recent genomic studies have demonstrated that green-sensitive opsins are expanded in other mirids (Xu et al. 2021) and this may contribute to the observed attraction. Regardless of the underlying mechanisms, switching to red traps may be a simple way for growers to better monitor TPB populations in their fields.
Objective 5: Assess TPB attraction to host volatiles
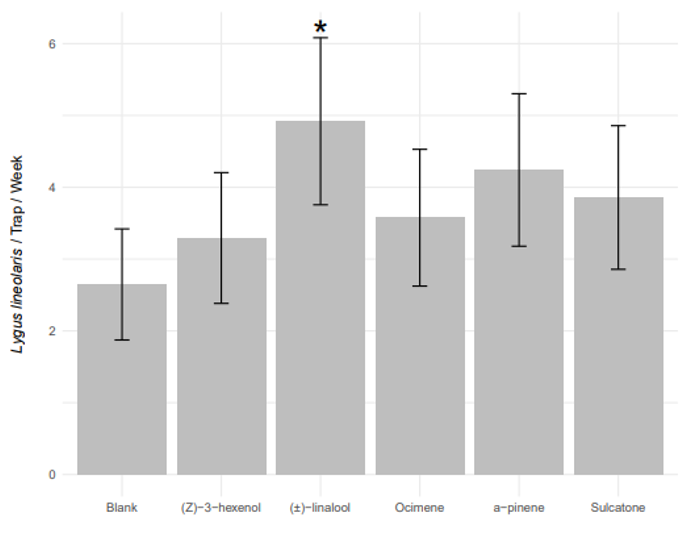
Response to host plant volatiles in the field Mean field densities of TPB adults ranged from 0 to 6.73 insects per sweep, with adult densities peaking in weeks three and seven. The presence of (±)-linalool increased TPB capture rates by 85% compared to control traps (Figure 5), (β = 0.714 ± 0.25, df = 128, t-ratio = 2.422, Padj = 0.0421). While numerical increases in capture rate were observed for the other chemical lures, none were significantly different from the control ((Z)-3-hexenol: β = 0.060 ± 0.27, df = 128, t-ratio = 0.022, Padj = 1; ocimene: β = 0.148 ± 0.23, df = 128, t-ratio = 0.641, Padj = 1; (R)-α-pinene: β = 0.338 ± 0.21, df = 128, t-ratio = 1.615, Padj = 0.544, sulcatone: β = 0.231 ± 0.19, df = 128, t-ratio = 1.244, Padj = 1).
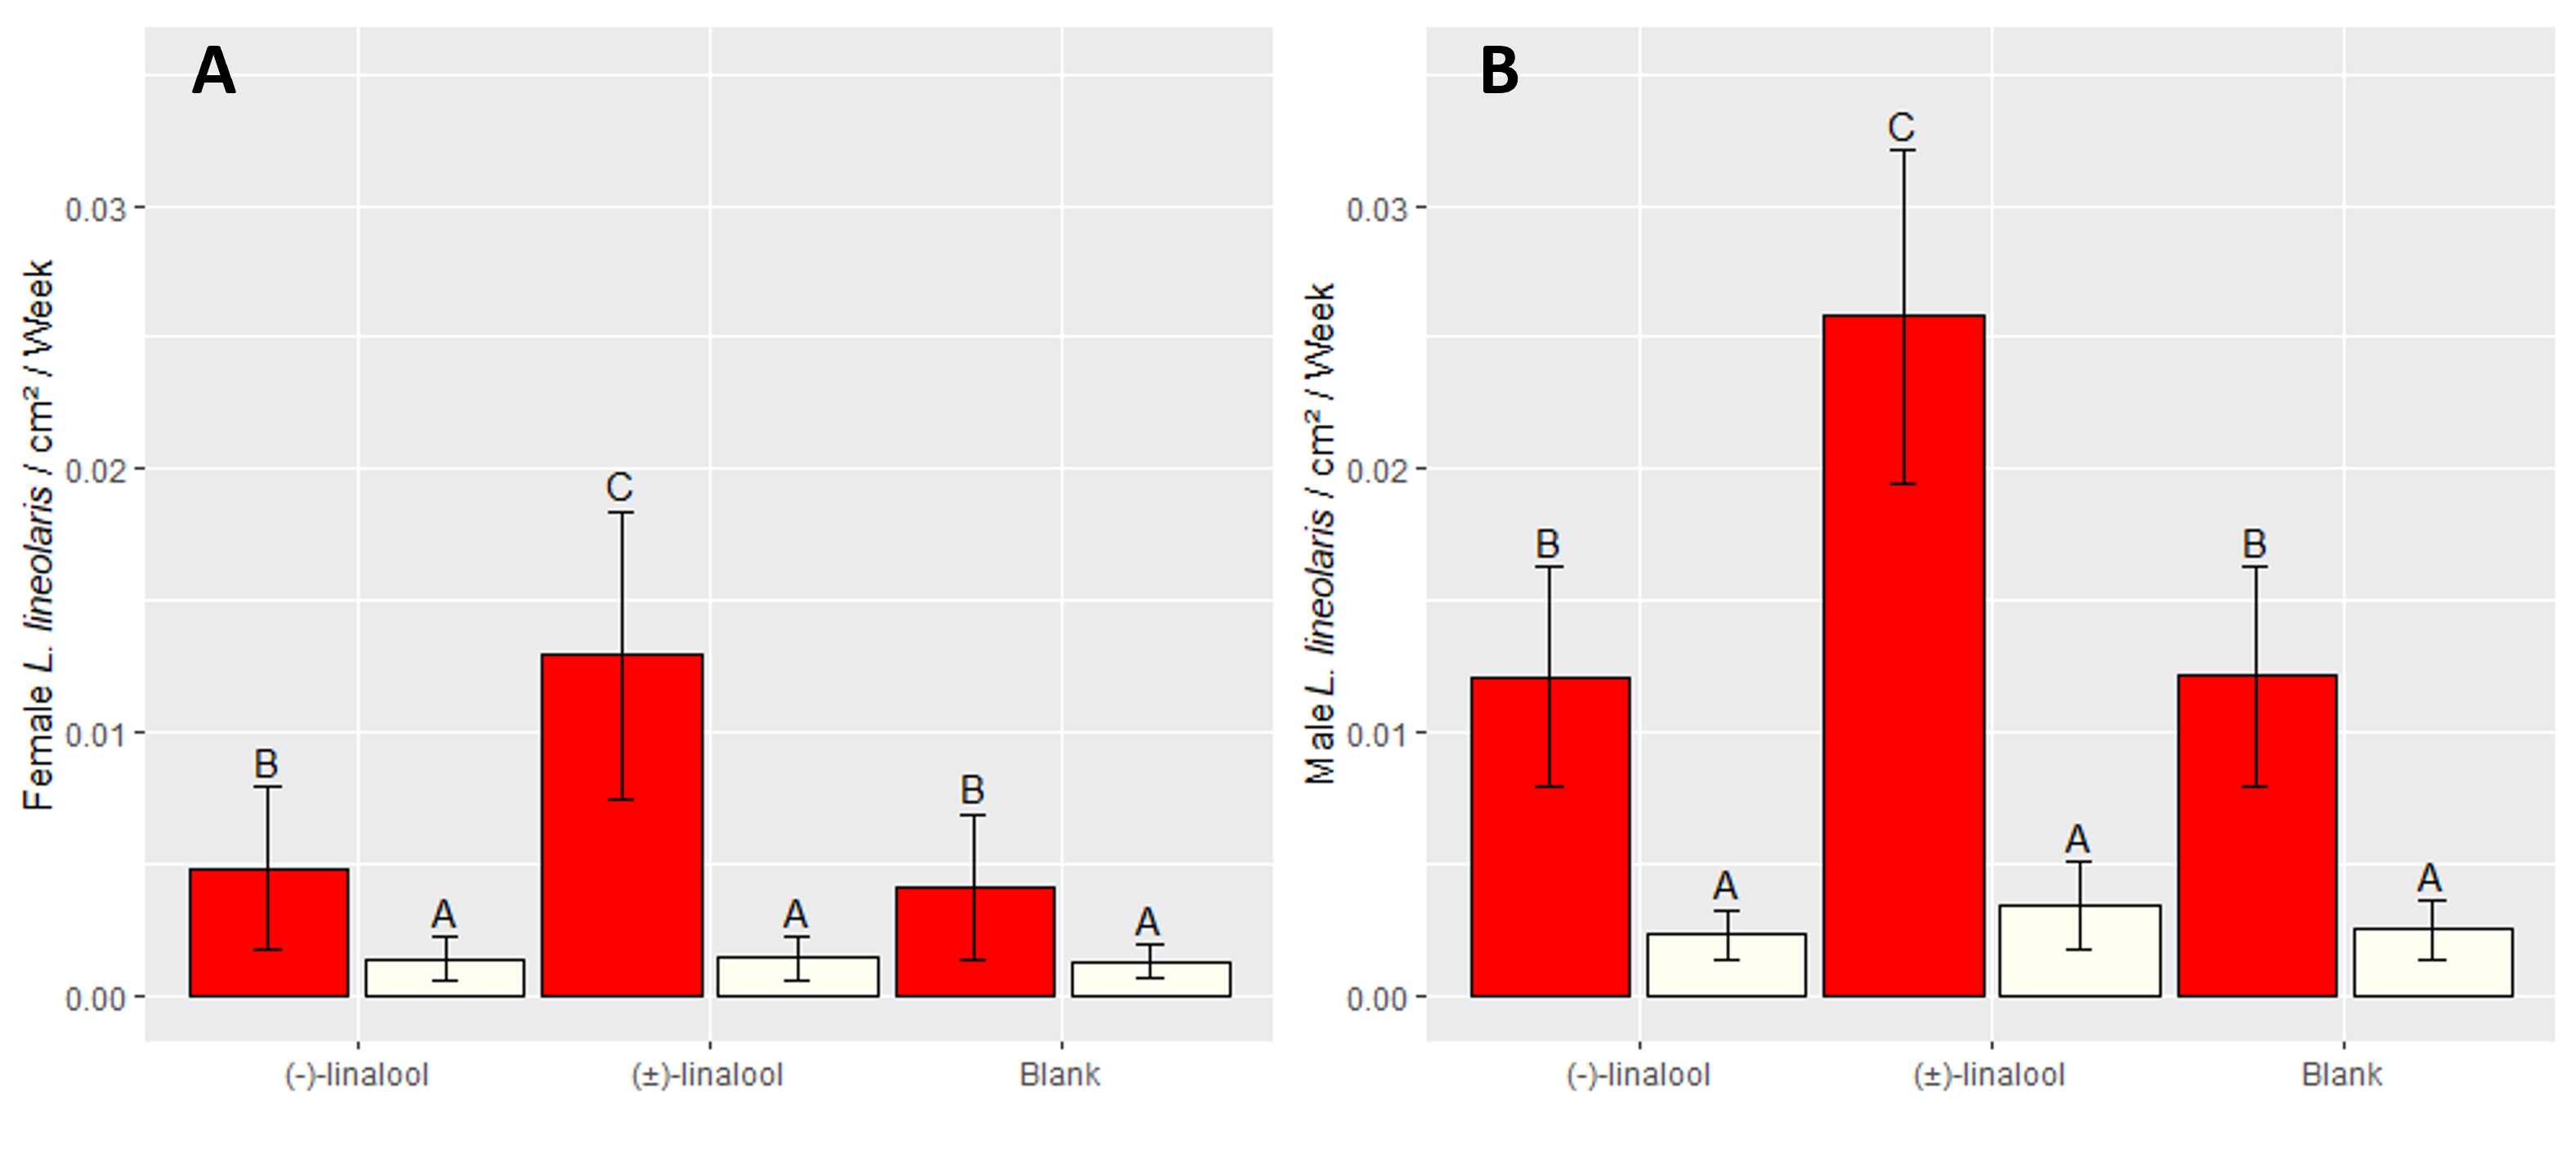
Influence of trap color and stereochemistry on TPB attraction Field densities of adult TPB ranged from 0.4 to 2.1 insects per sweep over the course of this experiment, with mean density of 0.89 adults per sweep. Both trap color and lure identity significantly influenced the capture rate of both TPB males (Color: F1, 99 = 119.64, P < 0.001; Lure: F2, 99 = 7.97, P = 0.001) and females (Color: F1, 93 = 84.17, P < 0.001; Lure: F2, 93 = 7.59, P = 0.001). Additionally, trap color was determined to influence lure efficacy for females (Color:Lure: F2, 93 = 6.12, P = 0.003), but not males (Color:Lure: F2, 93 = 2.49, P = 0.088). Comparison of geometric means revealed that red traps captured TPB at significantly higher rates than white traps, regardless of lure (Figure 6, Table 4), with 412%, 422%, and 753% increases in mean TPB capture rate observed for control, (R)-(-)-linalool, and (±)-linalool traps, respectively. Red traps with (±)-linalool lures captured TPB at significantly higher rates than other red traps, averaging 112% and 108% more TPB than traps baited with (R)-(-)-linalool and control traps, respectively (Figure 6). Red control traps captured TPB at similar rates as those baited with (R)-(-)-linalool.
TPB is thought to track the succession of flowering plants (Fleischer & Gaylor, 1987), as it, and mirids more broadly, prefer to feed on nutrient-rich meristematic and reproductive tissues (Wheeler, 2001). Floral volatiles may therefore be an effective habitat-finding cue, relaying information about plant phenology and allowing TPB to identify habitats where reproductive tissues are available. It is therefore not surprising to find that a common floral volatile is attractive to TPB, and a similar phenomenon has been observed in L. rugulipennis (Koczor et al. 2012; Baroffio et al. 2018; Fountain et al. 2021). While (±)-linalool increased TPB capture, lures containing (R)-(-)-linalool were similar to controls, implying that (S)-(+)-linalool contained in the racemic blend is essential to TPB attraction. Enantiomers have been reported to elicit different behavioral responses in other insects, including L. hesperus, which was attracted to (R)-(+)-α-pinene, but deterred by (S)-(-)-α-pinene (Williams et al. 2010). Although, (R)-(-)-linalool did not reduce TPB capture compared to controls, TPB attraction to pure (S)-(+)-linalool should be investigating. Moreover, red traps increased trap captures compared to white traps and the red color synergised the attractiveness of the (±)-linalool lures. These findings will facilitate the continued optimization of TPB monitoring strategies and emphasize the importance of multimodal cues in TPB orientation.
A three year experiment conducted on three commercial strawberry farms in south-central Wisconsin, demonstrated that alfalfa perimeter strips reduce TPB abundance in June-bearing strawberry fields. Evaluation of TPB movement between perimeter strips and strawberry fields revealed approximately three times more immigration into the alfalfa than into the strawberry, supporting the hypothesis that alfalfa acts as a trap crop in this system. Adult female movement into alfalfa was surprisingly high, and suggests that alfalfa perimeter strips may be a useful basis for a push-pull strategy for TPB management in the future. Investigation of the beneficial arthropod community provided no support for the hypothesis that biological control contributes to the observed reductions in TPB abundance associated with alfalfa perimeter strips. Presently alfalfa trap cropping appears to be a useful strategy for managing TPB in June-bearing strawberries. Additional research will be necessary to develop and refine recommendations for implementing alfalfa trap crops. Key questions including the effect of alfalfa trap crops on TPB damage, how trap crops influence overwintering populations, and optimal field design remain to be answered.
The monitoring experiments have led to revisions of TPB monitoring recommendations, as growers can get a better sense of TPB populations from red than white sticky traps. Furthermore, the observation that (±)-linalool attracts male and female TPB will facilitate the development of behavioral management strategies for this insect. The major appeal of kairomone lures is female attraction, as many potential offspring are removed with each female. The inclusion of phenylacetaldehyde alongside L. rugulipennis sex pheromones is a critical component of a push-pull system that dramatically reduced L. rugulipennis damage in European strawberry fields (Fountain et al. 2021). Recent advances in TPB pheromone lures combined with this discovery of a female attractant may allow a similar system to be developed in North America.
Our educational approach focused on presenting research at grower-centered conferences and these data have been presented at the Wisconsin Fresh Fruit and Vegetable Conference (WFFVC) three times, at the Great Lakes EXPO, and at the Marbleseed Organic Research Forum. We expected that exposure to this research would lead to knowledge gains around the use of alfalfa trap crops to manage TPB and increased willingness to incorporate alfalfa perimeter strips into field designs. Pre-study surveys were conducted at the WFFVC in 2020, and had 16 respondents, 6.25% of whom knew that alfalfa has been deployed to manage Lygus spp., 43.75% of whom responded that it had not, and 50% of whom were unsure. 31.25% of growers reported that they would not consider trap cropping with alfalfa, even if it reduced insecticide inputs and/or TPB damage. The post-study survey (n = 24) revealed less certainty around alfalfa trap cropping, with 91.67% responding ‘unsure’ and 8.33% responding that alfalfa has been deployed to manage Lygus spp., while none responded that it had not; and more openness to the idea of trap cropping, with only 13.64% of respondents saying that they would not consider implementing a trap crop for TPB management. These findings suggest that growers are open to the idea of trap cropping. Small plot studies examining how this strategy impacts insecticide use and TPB damage, and refining recommendations may be useful for improving grower confidence and adoption of trap cropping.
Education
The results generated in this research were disseminated to berry growers and agricultural professionals at different outreach events in the North Central region, including the Wisconsin Fresh Fruit and Vegetable Conference in 2021, 2022, and 2023; the Michigan Great Lakes EXPO in 2020; and the Midwest Organic and Sustainable Education Service Organic Research Forum in 2021.
Data from this study has also been presented to agricultural scientists and entomologists at the regional national Entomological Society of America meetings in 2020, 2021, and 2022.
Project Activities
Educational & Outreach Activities
Participation summary:
Presentations of our findings were made to growers and agricultural professionals at the Wisconsin Fresh Fruit and Vegetable Conference in 2021, 2022, and 2023.
Our findings were presented as a virtual poster at the Great Lakes EXPO in 2020.
Our findings were presented as a virtual poster at the Midwest Organic and Sustainable Education Service Organic Research Forum in 2021.
Data from this study has also been presented to agricultural scientists and entomologists at the regional national Entomological Society of America meetings in 2020, 2021, and 2022.
Learning Outcomes
- entomology
- pest management
Project Outcomes
Farmers were presented with results regarding alfalfa perimeter strips to reduce tarnished plant bug abundance in June-bearing strawberry fields. Growers have expressed interest in using this strategy in their June bearing strawberries but because the research happened and was presented during the Covid-19 pandemic, surveys to show a change in practice were conducted online and do not reflect growers that may have seen the research results at educational events.
We have only heard of one growers (the director of the Wisconsin Berry Grower Association) who implemented alfalfa as a trap crop.
We would recommend continuing to do outreach of this strategy as we believe more farmers could benefit from it. The pandemic limited our ability to see a change in knowledge or adoption of this strategy as we were not able to survey growers in person at the outreach events and further outreach would help determine the number of growers that implemented this strategy.