Final Report for LNE07-257
Project Information
This multi-year project was in response to farmer interest in gaining information and recommendations on pasture species and varieties. To meet this need three field experiments where established in 2007 at the UMass Research Farm, the Vermont Technical College dairy farm (Univ. of Vermont site), and a Pennsylvania site (USDA-ARS Pasture Systems and Watershed Management Research Unit). These research sites included 25 to 28 pasture blends varying in complexity from two species (a grass and a legume) to seven species with varied varieties in different blend from several commercial seed companies. Several dairy, livestock and other farmers in New England were provided up to five seed mixes for planting in the first and second years. Three grazing seasons were completed at the Vermont and Pennsylvania locations four at the UMass farm site. Results and conclusions have been summarized for all years for forage yield, forage quality (Massachusetts), cultivar differences, and economics. Five blends were identified for Massachusetts through the economic analysis as being superior to other blends. These contained a diversity of species and cultivars that were not uniformly in common to all the top five blends. Though many different cultivars were seeded, and more complex mixtures had higher yield, after two or three years there were two or three dominant species (white clover, orchardgrass, perennial ryegrass) in the stands. One orchardgrass cultivar in Massachusetts was better than all other orchardgrass cultivars and all blends containing orchardgrass were generally higher yielding than blends without orchardgrass. One blend was ranked high yielding in both Massachusetts and Pennsylvania. Farmers commented on how there on-farm trials influenced their choice in seeding more pastures, and on marketing ploys of companies to rename a previous year’s blend, to change the components without renaming a blend, or in giving two names to essentially the same blend. One important thing one farmer learned from this project was to have confidence to formulate his own custom blends without the extra expense of purchasing commercial blends.
Introduction:
Many farmers contact Extension and USDA-NRCS seeking information and recommendations on pasture species and varieties. This topic was mentioned often by farmers at meetings, in conference calls for the Upper Northeast Pasture Research Center for New England and Eastern New York, and at Vermont Grass Farmers’ Association meetings. The project was also in response to requests from producers for basic information and advanced research on increasing and improving pasture use and production efficiency.
Our hypotheses were (i) that with improved information on forage species and varieties interest and adoption of pasturing will increase because of economic benefit to farmers by in moving to pasture-based dairying, producers would reduce grain and fertilizer purchase costs, as well as reduce fuel costs and capital expenditures for equipment, since the cows harvest much of the forage and distribute much of the manure, and (ii) that this can be integrated into farm practices through a participatory project with farmers, complemented with outreach and education.
Replicated field experiments have been planted at the UMass Crop and Animal Research and Education Center farm, the Vermont Technical College dairy farm, and at the USDA-ARS Pasture Systems and Watershed Management Research Unit with 25 to 28 pasture mixes and commercial blend for evaluations. A mob-stocking was used to evaluate forages under grazing with beef cattle to determine yield and adaptability under grazing.
Involve more than 50 pasture producers from New England and Pennsylvania in pasture forage evaluations at the UMass Research Farm, a Vermont (UVM) site, and USDA-ARS Pasture Systems and Watershed Mgt Res. Unit (PA). Over a two to three year period, variety plots will be mob stocked to determine yield and adaptability under grazing. Of these farmers, 15 or more will choose from more than 25 new pasture varieties and blends, and plant the chosen species/varieties in on-farm trials for local adaptability, make management changes, and increase reliance on pasture for livestock.
Cooperators
Research
Research Sites
The three sites had varied growing season lengths resulting from different latitudes and elevations. All were seeded in the Fall 2007. These sites have varied soil conditions from deep fine sandy loam alluvial soil (UMass - Connecticut River), heavier upland or hill soils in Vermont (Randolph, VT), and a silt loam soil near State College, Pennsylvania. The mixtures and blends at the three locations seeded in are detailed below.
Seed Mixtures and Blends:
The 28 pasture seed mixtures/blends were seeded in August 2007 and included species of legumes – white clover, red clover, birdsfoot trefoil and alfalfa, and grasses – orchardgrass, perennial ryegrass, meadow fescue, tall fescue, festulolium, bromegrass, timothy, and Kentucky bluegrass. Seed mixtures in Massachusetts varied from 2 to 7 species sometimes with more than one variety within a species (Table 1). Eighteen of these were commercial blends and 10 were mixtures of either perennial ryegrass and Alice white clover or orchardgrass with Alice white clover.
The commercial blends used in Massachusetts below are shown with blend number used in figures and number of species included in parenthesis (#,#). In Pennsylvania (Table 2) blends 19-25 were specialized 2 and 3 specie custom mixes different from Massachusetts and Vermont. Also, in Vermont festulolium replaced ryegrass used in Massachusetts in 2 specie mixtures. Blend 16 was classified as a 3 species blend and did contain 3 species in Pennsylvania but in Massachusetts and Vermont two perennial ryegrass varieties were present and no festulolium. For Pennsylvania and Vermont specie and blend and mixture identification refer to Tables 2 and 3 respectively.
Massachusetts seed blends and mixtures:
AgriCulver - All-Weather Mix (14, 4)
AgriCulver - Graze Master Mix (15, 4)
AgriCulver - Lowland Mix (18, 5)
AgriCulver - Milk Master Plus Mix (16, 3)
AgriCulver - Renovator Mix (17, 3)
AMPAC Seed Co - Multi-Purpose Plus Mixture (8, 7)
Doebler's - DMX-D dairy mix (1, 3)
Doebler's - DMX-P pasture mix (2, 6)
King's Agriseeds - Creek Grazing mix (6, 6)
King's Agriseeds - Dairy Plus (3, 4)
King's Agriseeds - Greenfast (4, 6)
King's Agriseeds - Haymaster (5, 4)
King's Agriseeds - King's Grazing mix (7, 5)
Farm Science Genetics - Pro Beef Mix (12, 6)
Farm Science Genetics - Pro Dairy (10, 5)
Farm Science Genetics - Pro Horse (11, 5)
Farm Science Genetics - Range Master (13, 6)
Seed Solutions - Triple Crown (9, 5)
Two species mixes were seeded with Alice white clover and orchardgrass or perennial ryegrass with treatment number.
Orchardgrasses:
AMPAC Seed Co - Tekapo (19)
King's Agriseeds - Sparta (20)
Barenbrug - Baridana (22)
Doeblers - LG 31 (27)
Farm Sci. Genetics - Extend (28)
Perennial Ryegrasses:
AMPAC Seed Co - Tonga (21)
DFL International - Garibaldi (23)
King's Agriseeds - Mara (24)
King's Agriseeds - Tivoli (25)
King's Agriseeds - BG 34 (26)
Grazing Management:
The following is a description of the protocol used in Massachusetts. Grazing of the species mixes/blends in this field study began with beef cattle in May 2008 and in May in each of the following years. In Massachusetts in each year black Angus beef cattle were purchased to graze the pasture plots, one replication per day, and after the fourth rep was grazed, the plots were rested from grazing. The plots were again grazed in June and every month through to November, a total of 7 grazings in the first year and through October in subsequent years. Prior to each grazing, yield of each plot was measured from two to three averaged 0.1 m2 quadrates per plot, clipped to 7.5 cm above the surface, and residue uneaten biomass was also determined following some of the grazing periods in 2008 and 2009. Pastures were grazed to this height or clipped after grazing as needed. The experiments were managed under grazing at all test sites in 2008, 2009 and 2010, and continued in 2011 in Massachusetts.
Biomass samples collected were dried in forced air ovens for dry matter determination and in Massachusetts for forage quality estimation (NIRS). Samples from other states will be analyzed for forage quality in 2012. Species determination was done by separation of herbage or by line point analysis to estimate percentage composition. In Massachusetts there were 7 grazing times in 2008, 6 in 2009 and 2010, and 5 in 2011. In Vermont there were 4 grazing times in 2008 and 2009, and 3 in 2010 year, and in Pennsylvania there were 6 grazing period each of the three years.
Milestones:
The first and second milestones involved project leaders meeting in 2007 at the Northeast Pasture Consortium meeting, in conference calls, and by email to develop protocols for forage evaluations at research sites and farms and to select the blends and mixtures to be tested. Three field experiments were established in the fall of 2007 at the UMass Research Farm, the Vermont Technical College Dairy Farm (UVM site), and a Pennsylvania site (USDA-ARS Pasture Systems and Watershed Mgt Res. Unit).
The three research sites included 25 to 28 pasture blends varying in complexity from two species (a grass and a legume) to seven species with varied varieties in different blend from several commercial seed companies that market pasture blends and varieties to farmers in the New England and northeast region. Farmers and seed industry representatives (third milestone) at the pasture consortium, at extension meetings, and pasture walks gave input to project leaders on specie choices, varieties and mixes/blends. All studies were seeded in the fall of 2007. In 2008 these three studies were rotationally (mob stocked) grazed 4 to 7 times (7 times in MA, 6 times in PA and 4 times in VT) during the grazing season. Data on establishment was collected by project leader teams and cooperators at the three main field experimental sites. All plots were evaluated for establishment and winter survival in spring of 2008. Again in spring of 2009 plots were evaluated for winter survival.
Ten farmers, some indicating a desire to evaluate pasture forages, and others recruited were provided five seed mixes for planting in this first year, and assistance in planting was provided to some as needed. A further distribution of seed was made to 9 farmers who planted test plots (fourth milestone). The distributions by state were 7 in Massachusetts, 8 in Vermont, 2 in New Hampshire, and 1 in each of Connecticut and Maine. The Pennsylvania test site was also a local beef farm. Thus the project included one or more farms in almost all New England states planting three to five selected blends in on-farm trials for a total of 20 farms including Pennsylvania. Reports from farmers on establishment and winter survival in spring of 2008 and 2009 were positive. Farmer sites were evaluated under grazing in 2008 and in 2009, and farmers reported positive animal responses or preferences for many of the newly seeded pasture mixes.
The fifth and sixth milestones in part were met with field tours each year at Massachusetts and Vermont experimental sites, pasture walks and meetings at a participating farms in Connecticut, multiple farms in Massachusetts, and similar in other states. Multiple field tours were hosted at all three main experiment sites, and many farms hosted pasture walks where information and results were provided to attendees in 2008, 2009 and 2010.
All milestones have been more than completed and results of the project are detailed in this final report.
Results and Discussion:
Forage Yield:
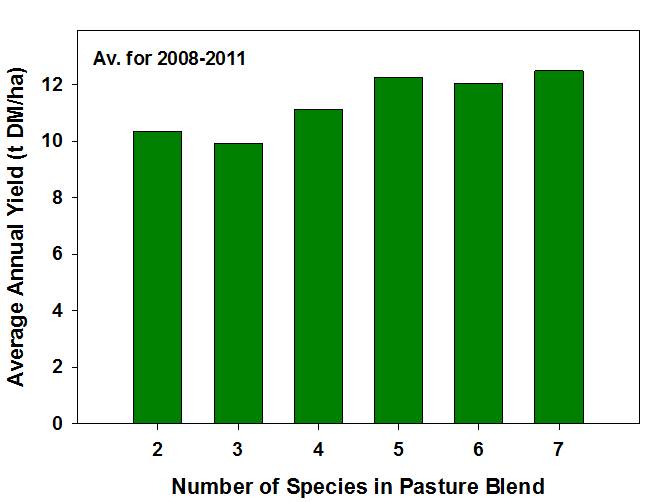
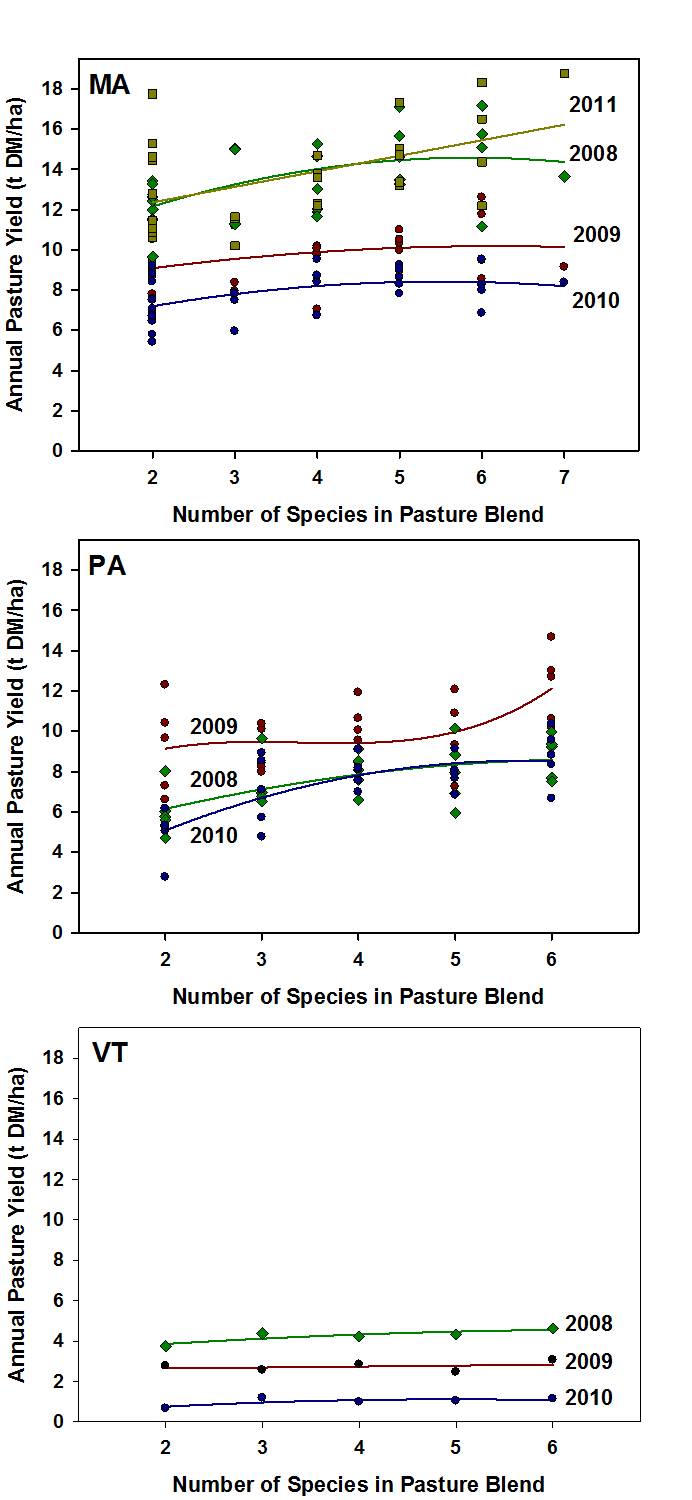
Crop establishment in 2007 prior to winter after establishment was monitored and winter survival in spring was good and deemed to be adequate for all mixtures and blends at all three state locations. Total pasture yield (forage plus weeds) varied among the three to four years and among the three state locations (Fig. 1). Yields in 2008 and 2011 were higher in Massachusetts than in 2009 and 2010 while in Pennsylvania the yields in 2009 were higher than in 2008 and 2010. Yields and number of grazings were much lower for the upland Vermont location and each year the yield decreased compared to the previous year. These data also showed that more complex mixtures, those with more species, tended to have higher yield, especially in Massachusetts and Pennsylvania, than those with fewer species (Fig. 2). It was also evident that there was much variation in yield within each number of species group (Fig. 1), and that species in blends that included small amounts of a species in the mixtures (e.g. with less than 10%, of trefoil, timothy, or bluegrass) did not establish sufficient plants to contribute much to forage yield.
The differences in yield among the years was most likely related to better growing conditions 2008 in Massachusetts when seven grazing times were possible before freezing conditions while in 2009 and 2010 there was only six grazing times. Rainfall in 2008 was near normal with good rainfall in June through September while 2009 was wetter than average both in Massachusetts (+ 6 inches May through August) and in the northeast. Pennsylvania was dry in 2008 and had better rainfall in 2009 than the previous dry year in 2008, and was dryer than the excessive 2009 rainfall at the Massachusetts site. Vermont was cooler than Massachusetts and Pennsylvania and rainfall was variable among years as in the other states. The low yields in Vermont (Fig. 1) are a reflection of the cooler conditions but also were probably due to the poorer soil condition (wet, poor drainage) and greater competition from weeds. The low Vermont yield in 2010 was due to just second pre-grazing harvest being collected. The first harvest was lost due to grazing the spring growth before data collection. The third pre-grazing harvest was not taken because the plots were too variable with weed invasion.
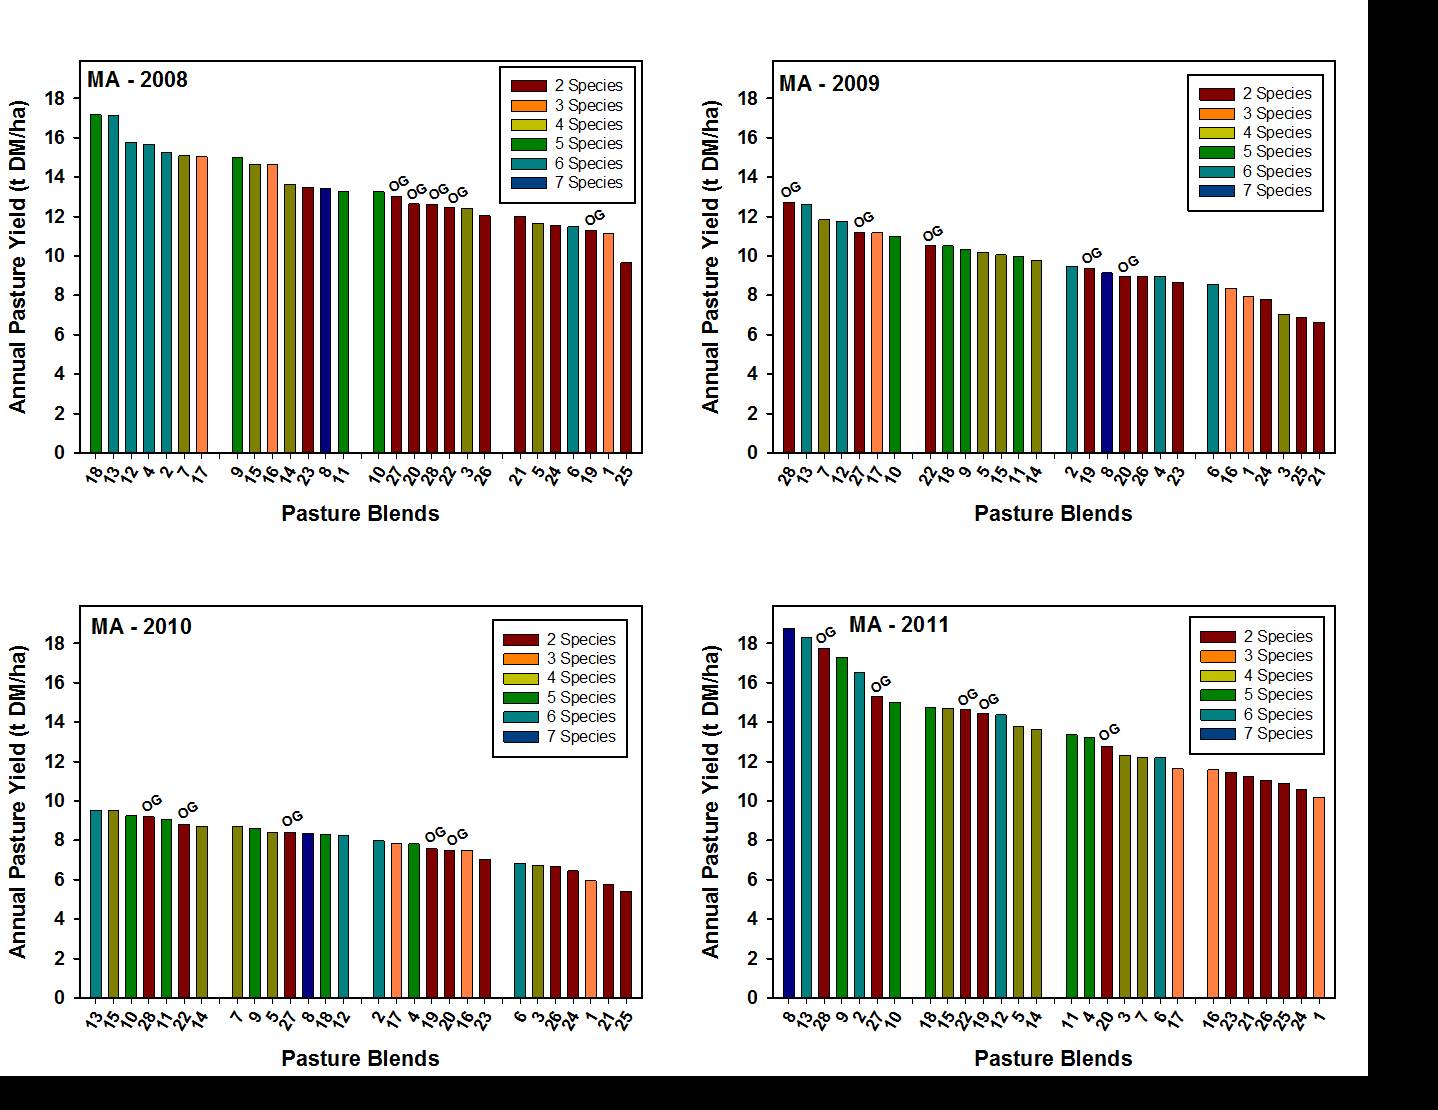
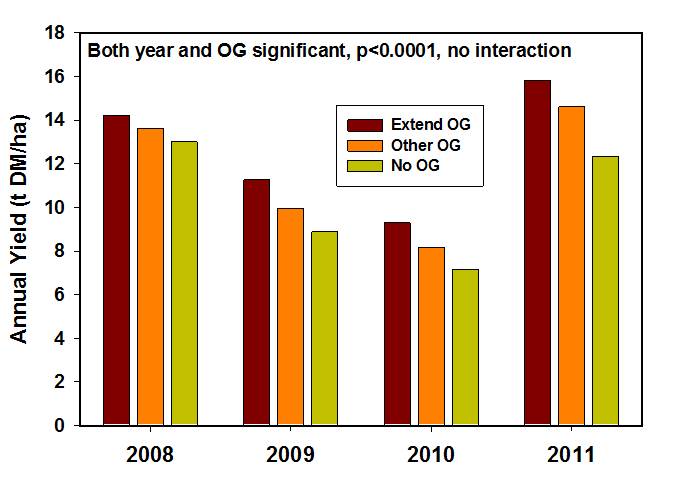
At each location for each year the blends and mixtures were ranked based on yield. In the first year (2008) in Massachusetts, the top 15 of 28 blends contained perennial ryegrass as one of the components (Fig. 3). However, in 2009, 2010 and 2011, 6 of the top 7 blends contained orchardgrass as a component. After the winter of 2008/09 among the 2-species mixtures all orchardgrass mixtures yielded more than all perennial ryegrass mixtures. In the spring of 2009 there was noticeable damage to perennial ryegrass in the Massachusetts field plots. The highest yielding 2-specie mixtures contained Extend orchardgrass and one blend (#13) was among the top 1 or 2 each year. Blend #13 was a 6-species commercial blend and included Extend orchardgrass (see Table 1 for a listing of varieties in each blend), and in 2010, the top 5 blends all contained Extend orchardgrass attesting to its superiority as a orchardgrass variety. Figure 4 gives a comparison of Extend orchardgrass in Massachusetts with other orchardgrasses and other blends without orchardgrass. Most of the blends without orchardgrass contained perennial ryegrass, thus figure 4 indicates the superiority of all orchardgrass cultivars over perennial ryegrass in Massachusetts.
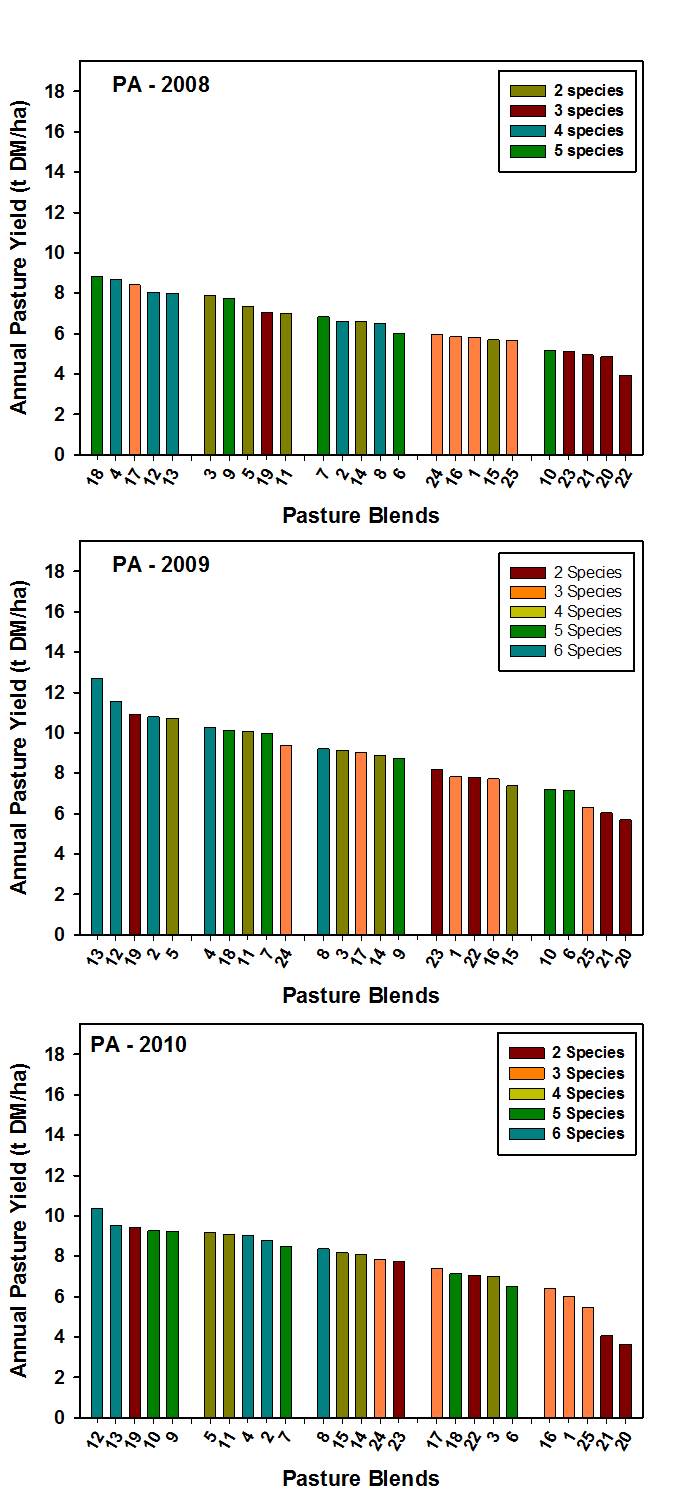
In Pennsylvania two mixtures (#’s 12 and 13) were ranked as the top 2 for highest yield and this was consistent over the three years (Fig. 5). While in Massachusetts blends with orchardgrass had greatest yield, in Pennsylvania blends with red clover, perennial ryegrass, orchardgrass, or tall fescue in Pennsylvania and with more than 2 species had greater yields. This reflects perhaps the less severe winter temperatures in Pennsylvania compared to Massachusetts and Vermont where perennial ryegrass suffered some winter damage reducing yield in the second and subsequent production years.
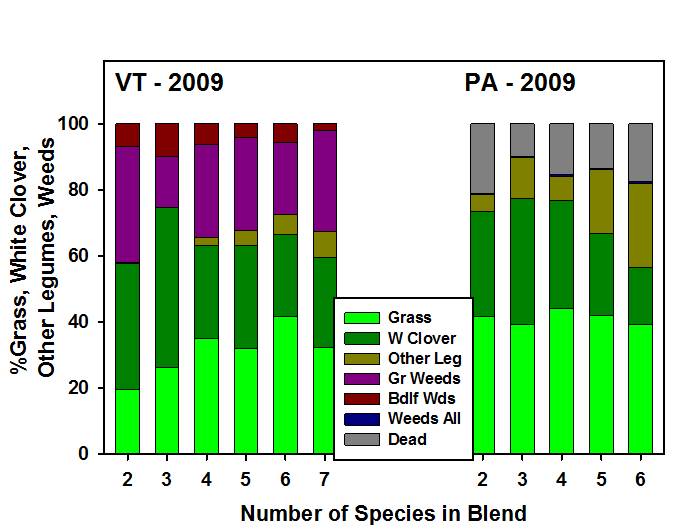
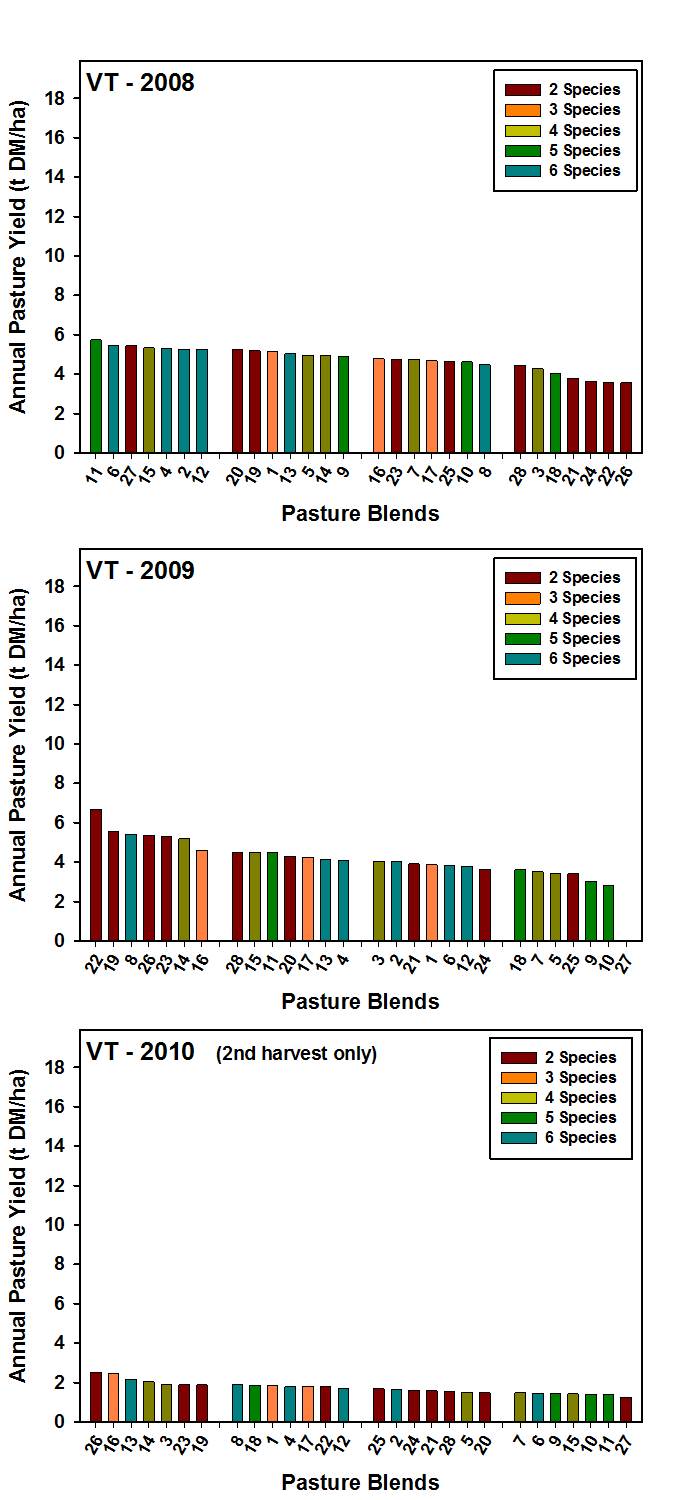
In Vermont plots contained significant amounts of weeds after winter thinning of susceptible species which may have affected the ranking of blends and mixtures (Fig. 6). There was no clear consistency for yield among blends and mixtures and orchardgrass or the mixes with the variety Extend had both high and low rankings each year. Weed content was likely a factor. In 2008 the average weed content was 13.6%, in 2009 34.7% and in 2010 (one harvest) 46.9% with grass weeds being 8 time more abundant than broadleaf weeds. The high and increasing content of weeds lead to abandonment of the experiment midway through 2010. In comparison to Vermont the content of weeds in Massachusetts was negligible (less than 2%) for all plots throughout the four years. Similarly, Pennsylvania had few weeds. Comparative results for forages and weeds for Vermont and Pennsylvania studies in 2009 are shown in Figure 7.
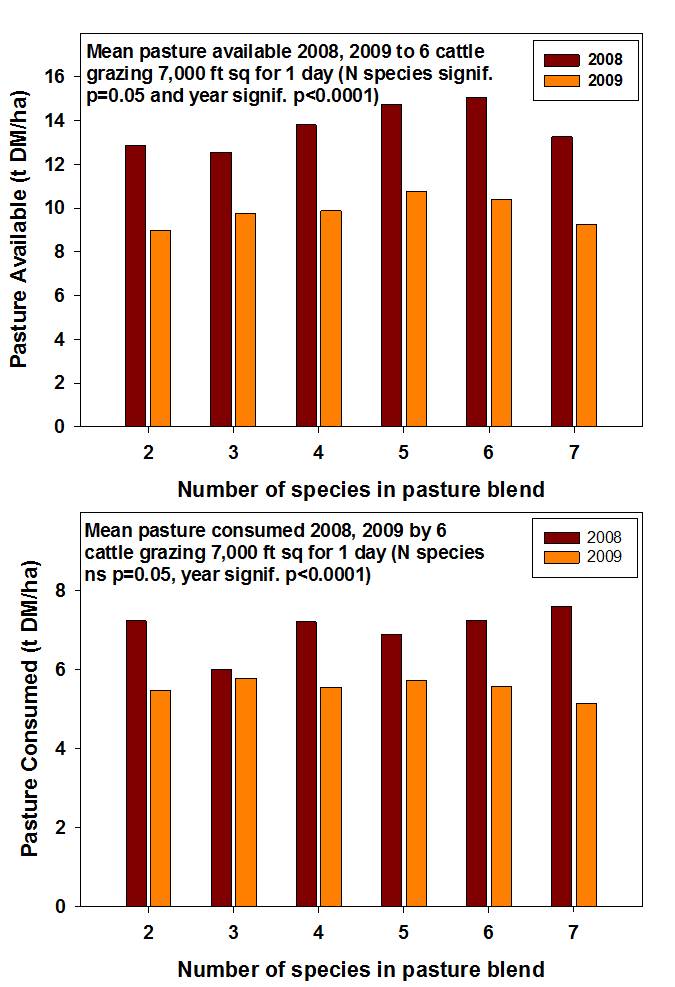
In Massachusetts we made an attempt to determine animal preference to different species and blend complexity by measuring the amount of pasture consumed during grazing periods in 2008 and 2009. When grazing pressure adequate all plots were grazed similarly regardless of the number of species in the pasture blend (Fig. 8). Perennial ryegrass and plots with much white clover were grazed preferentially with the whole plot grazed evenly while bordering plots were sometimes left, depending on species, for grazing later in the grazing period. Tall fescue and orchardgrass blends were not the first to be grazed but were grazed somewhat evenly if animals were restricted to the area long enough. These blends were less grazed if forage supply was over abundant for the animal grazing density.
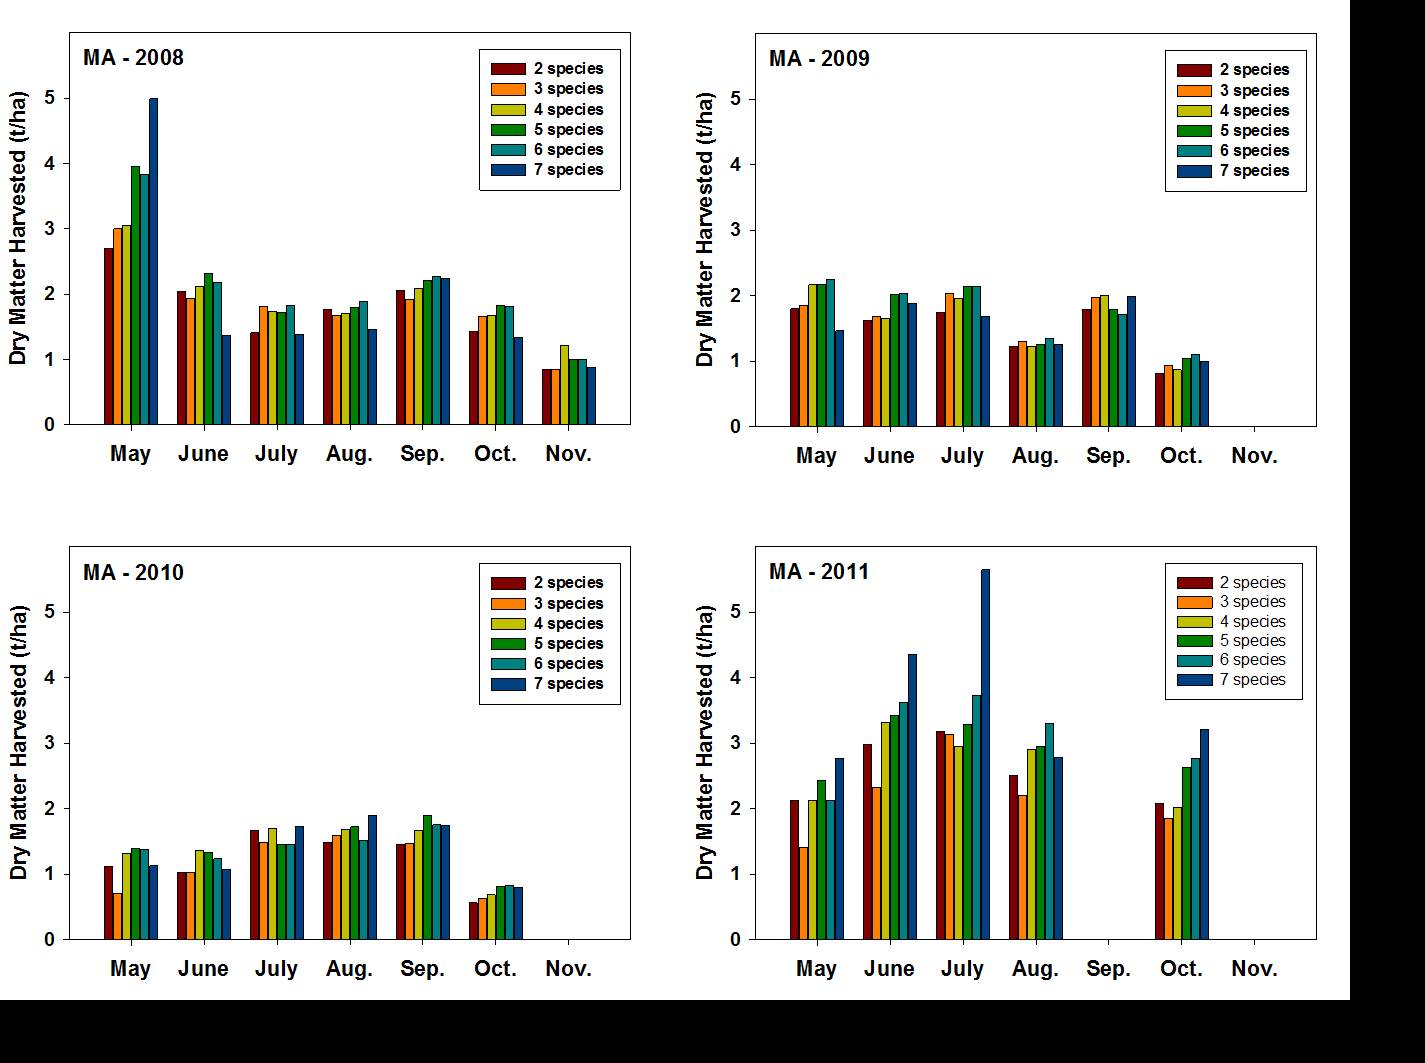
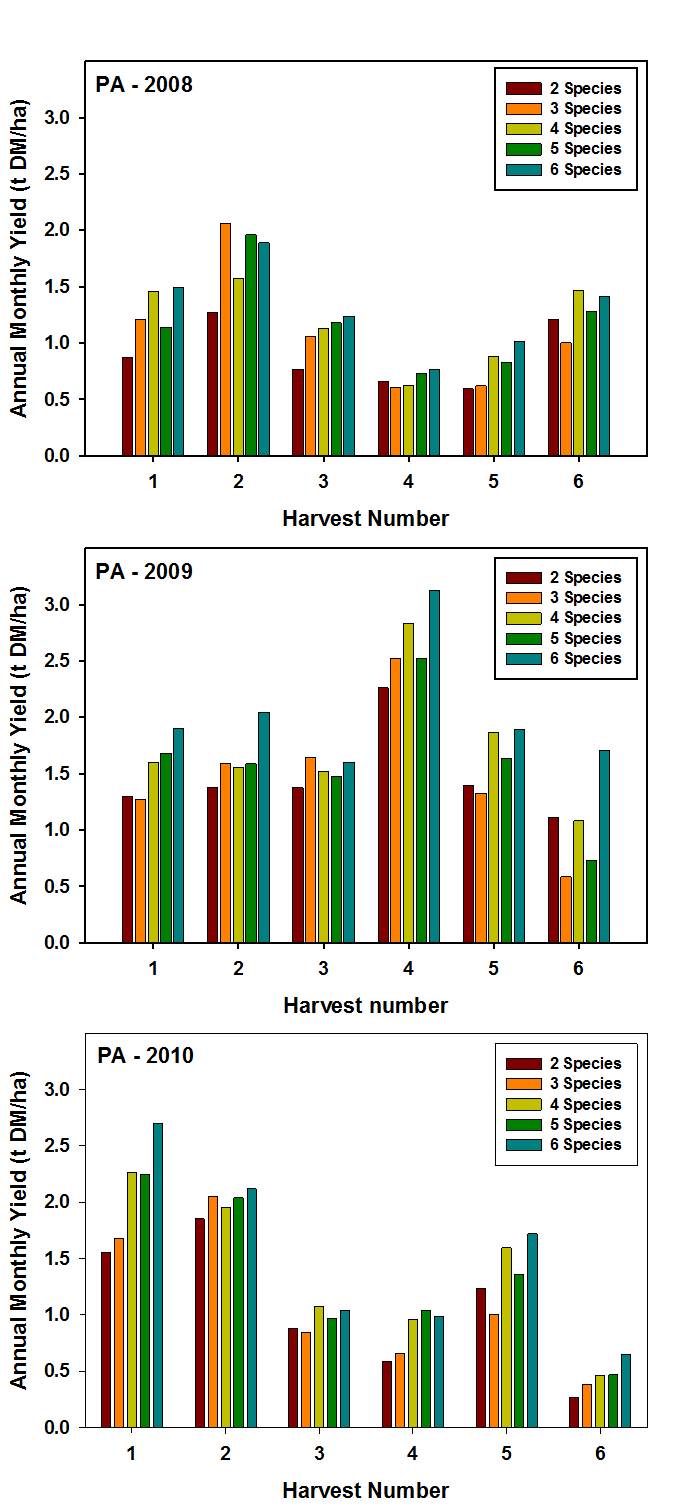
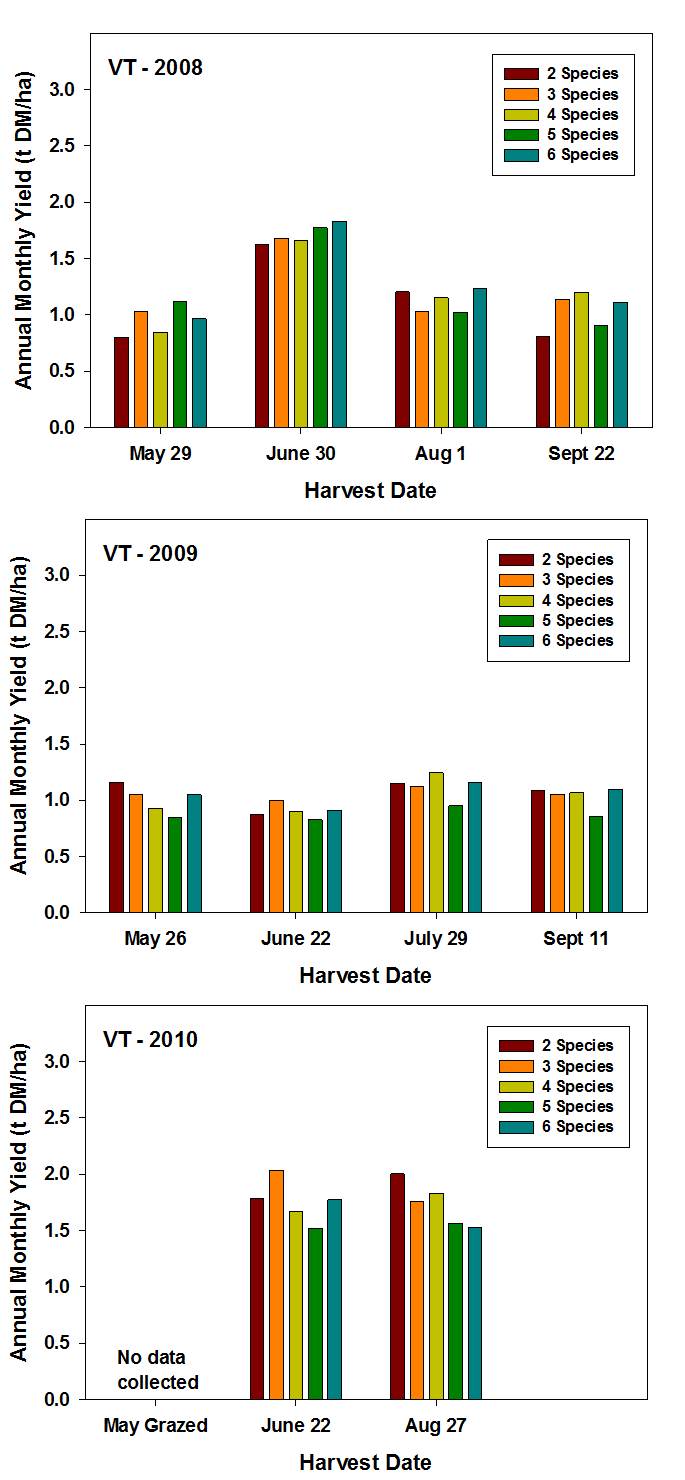
The distribution of forage production over the season is shown for Massachusetts in Figure 9, Pennsylvania in Figure 10, and Vermont in Figure 11. These are included mainly to show seasonal changes in production which were variable among years within all locations. Variations likely occurred because timing of grazing, rainfall patterns and quantity, and temperature profiles in different years. For example, the Pennsylvania site had a summer slump in production in 2008 (a dry year) and 2010 but the opposite in 2009, a year with more adequate rainfall.
Forage Quality:
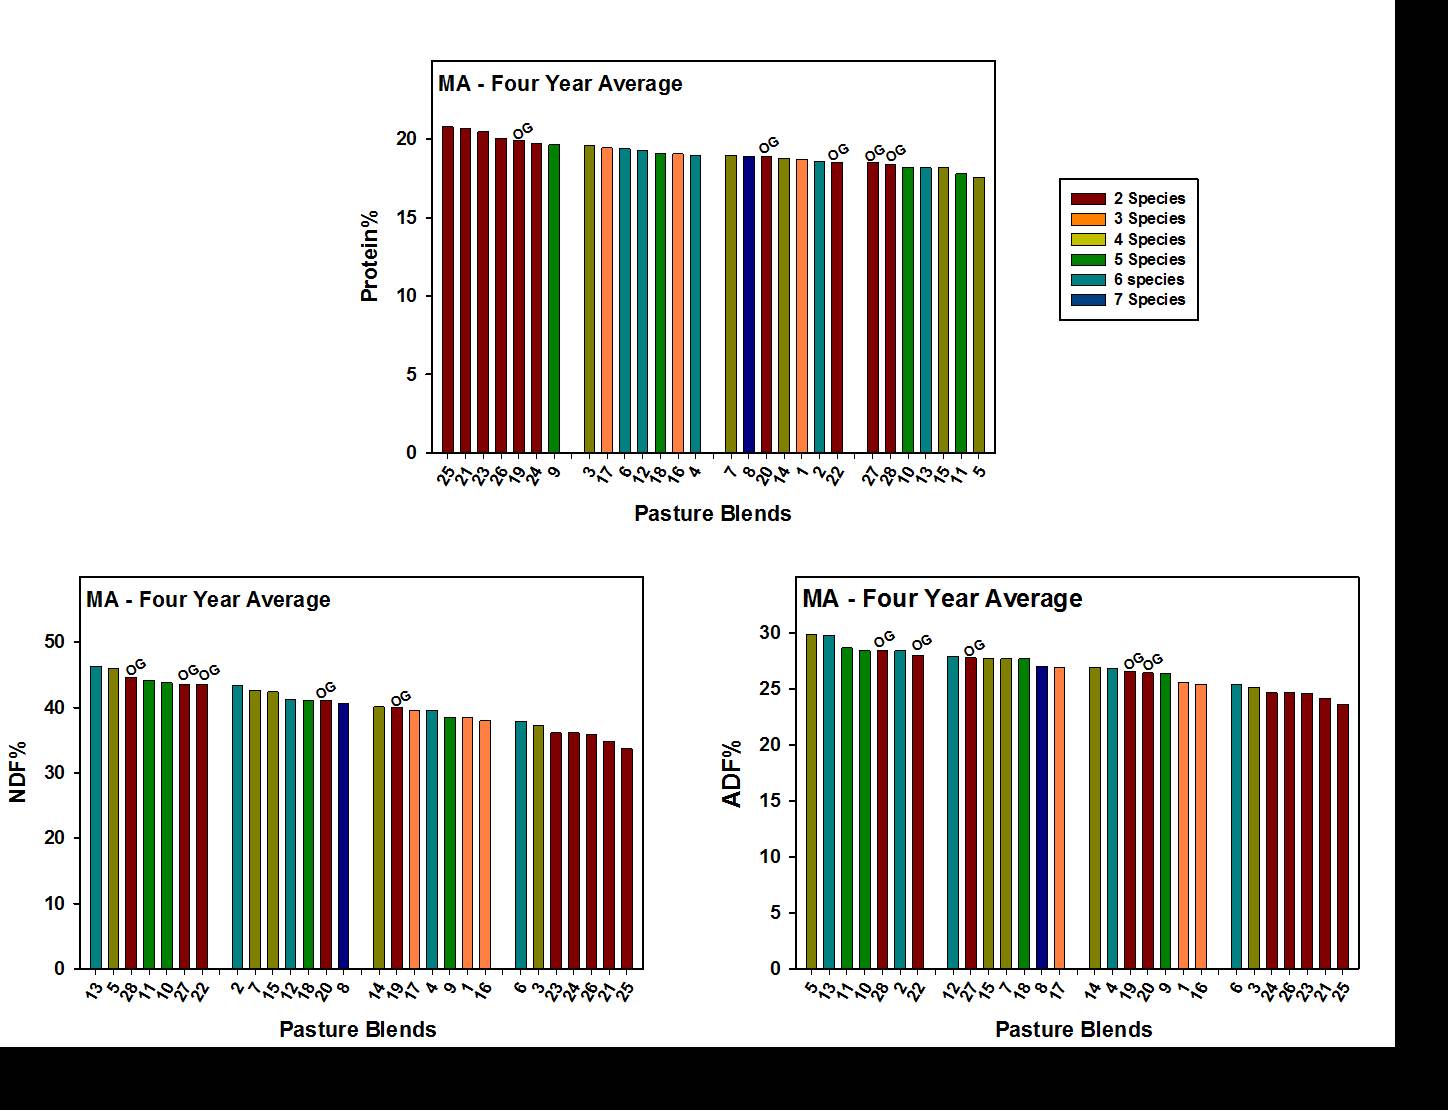
This project generated thousands of forage samples that ideally would be analyzed for forage quality. Because funding was not sufficient in the project this has not been completed for all samples. In Massachusetts we were fortunate enough to obtain funding in another project and purchased a NIRS forage analysis system. We have used this to complete the analysis for all samples collected in Massachusetts. The four year average for protein levels varied from a low of 17.6% to a high of 20.8% (Fig. 12). The blends containing perennial ryegrass had higher protein levels than most blends containing orchardgrass. Of the top 14 blends only two contained orchardgrass and all but one contained perennial ryegrass. Of the bottom half only two did not contain orchardgrass.
The NDF levels in blends were almost the reverse of the protein levels (Fig. 12). All 2-specie mixes with Alice white clover and a perennial ryegrass cultivar were the blends with the five lowest NDF levels. This was also true for ADF levels (Fig. 12). Blend 13, which was consistently high yielding in Massachusetts and Pennsylvania, had low protein (4th from the bottom) but highest estimated NDF and ADF values.
Variety/Cultivar Differences among the Pasture Blends:
Massachusetts -- Variety/cultivar performance within species in the pasture plot assessments must be made within the context of the other species within a blend. For example, there were 3 cultivars of alfalfa planted as part of three very different blends; Baralfa42-IQ was planted with Intensiv orchardgrass, Barfleo timothy, and Hakari bromegrass. Maxigraze GT was planted with Aubisque perennial ryegrass, Treasure timothy, Ginger Kentucky bluegrass, and Spring Green festulolium, and FSG 408DP alfalfa was planted with Boost perennial ryegrass, FSG 9601 red clover, Select tall fescue, Big Daddy annual ryegrass, and Summit timothy. All blends were assessed at multiple inventory dates in 2010 and 2011 for cultivar differences. While overall cultivar performances were compared, analysis of results is limited by the unknown effects of the different companion species.
The method used in Massachusetts to determine which species were present in a plot is as follows. A measuring tape was placed through a diagonal of a 3 m x 7 m plot. Over the central 3m of the diagonal, at 30 cm intervals, a pin was dropped at the tape. Every species found within 1 cm of the pin was recorded. If inventory was 3 m, this gave 10 inventory points and a species could get a maximum “score” of 10 if observed at each point. If five species were present, the “score” could theoretically be as high as 50. By allowing for more than one species per point to be counted, shorter species were not excluded, and fewer points were needed to avoid missing present species entirely. It would be expect to have seasonal differences in species. Some do well early in the season, in cool weather; others excel in hotter, drier weather. While the inventory timings and diversity of companion species present created some difficulty, there were clearly cultivars which performed better than others. Table 4 shows results of this assessment analysis.
The analysis for alfalfa shows significant differences of frequency of observation among the three varieties. Maxigraze GT performed best, but this could be because of its inherent superiority or it could be because alfalfa competes well with the rest of the blend of which Maxigraze GT was a part. Other species included in the pasture blends (table 4) were analyzed in a manner similar to that described for alfalfa. Birdsfoot trefoil, bromegrass, and meadow fescue were not included because only one cultivar of each was planted. Plots in with more than one cultivar within a species were not included in these analyses because cultivar identification was not possible. In plots of one planted cultivar within a species, it was assumed that if the species was present, it was the planted cultivar.
Cultivar differences in red clover performance were significant. However, for white clover the analysis may not reflect cultivar differences accurately. For most species, the species did not seem to have moved far from the plot in which it was planted. Thus we are fairly confident that the cultivar observed was the cultivar planted. In the case of white clover, however, all plots contained substantial amounts of white clover, so it is never clear which cultivar was being counted in the inventories or if the white clover observed was from the soil white clover seed bank.
Cultivar differences were not observed for festulolium or tall fescue in the pasture blends. Festulolium, a cross between meadow fescue and annual ryegrass, initially dominated mixtures when present the first year but declined over time as it did other sites. The data collected for timothy indicated three of the cultivars outperformed the other three. Plot to plot differences observed for Kentucky bluegrass made it impossible to confirm any difference in species presence based on either cultivar or time of observation. It appeared that Kentucky bluegrass had increased from 2010 to 2011, but statistical confirmation was not possible.
Orchardgrass was a major component of the pasture in pasture plots being included in 14 of the 28 blends. Over the four years grazed, Extend orchardgrass which was observed least in plots among the orchardgrass had the largest yield. Five blends contained Extend orchardgrass lending confidence to the determination. Perennial ryegrass was also abundant being the most planted species, included in 22 of the 28 blends. There were 12 different cultivar/cultivar combinations in the experiment. Cultivar differences ranged from a high of 88 to a low of 45 indicating significant differences occur within this species.
Vermont -- There was generally a good relationship between species richness and pasture yield in both years when only accounting for seeded grasses and legumes. In 2009, the more complex mixtures had fewer weeds than the 2-specie binary mixtures. By the middle to end of the 2009 season, there appeared to be a negative relationship between species/cultivar richness and the percentage of white clover in the stand. Perennial ryegrass, festulolium and Hakari brome declined rapidly over the first two years probably due to the elevation and latitude of this study and the poorly drained soil type. Some of the festulolium cultivars had severe winter injury particularly ‘Duo’ and ‘Lofa’. ‘Spring Green’ had the least injury and decline; however, it still dropped to about 20% of dry matter composition by the middle of the second harvest year. Amongst the orchardgrass cultivars, ‘Barandana’ appeared to be the most persistent under the conditions of this study, but it even declined over the two year period. ‘Tekapo’, a New Zealand low growing type orchardgrass showed the least persistence. Within the complex mixtures, tall fescue, meadow fescue and timothy appeared to slowly increase or stabilize. Kentucky bluegrass was only in a two of the mixtures and was slow to establish. All plots had grass weeds with the predominant grass weeds in the plots being reed canarygrass and quackgrass.
By the end of the first full harvest year (2008) in Vermont, seeded white clover made up approximately 30% of dry matter in the single grass cultivar plots and remained stable or increase slightly in the second year although most of the seeded grasses declined. Based on the treatments that were not seeded to any white clover, it appears the “baseline” for native white clover was between 8 and 15% by the middle to end of 2009. Red clover and alfalfa never became very prevalent in mixtures where it was included. They appeared to be losing persistence over time, perhaps not surprising considering the poor soil drainage class. Birdsfoot trefoil was slow to establish but showed higher amounts in the second year except toward the end of the grazing season.
On-Farm Pasture Evaluations:
A total of 20 farms agreed to establish with pasture blends. Seed of commercial blends was provided to participating farmers with a recommendation to establish test pastures in the late summer of the year (Table 5). Most seeded in the fall although some seeded in the spring the next year. However, not all farm tests were established. In each farm evaluation three to five pasture blends were selected as a subset of the larger evaluation at the research sites and were managed under grazing. Pasture blends established on farms were mostly planted in strips or larger fields but were not replicated on farms. Hence, data from these studies is not presented as research findings. Participating farmers included mostly beef and dairy with one or more sheep and poultry, and were from every New England state except Rhode Island. Project leaders worked with farmers to collect information on establishment and productivity of the pasture blends.
- Figure 2. Massachusetts annual yield with different number of species.
- Figure 3. MA yields ranked high to low.
- Figure 5. PA yields ranked high to low.
- Figure 7. Forage and weed composition PA and VT.
- Figure 8. Pasture available and consumed.
- Figure 9. MA forage distribution across harvests.
- Figure 10. PA forage distribution across harvests.
- Figure 11. VT forage distribution across harvests.
- Table 4. Observations on differing cultivars of each species.
- Figure 1. Total annual yields for MA, PA, and VT.
- Figure 4. Extend Orhardgrass vs other blends.
- Figure 6. VT yields ranked high to low.
- Figure 12. Pasture forage quality.
- Table 5. Pasture mixes used in on-farm trials.
Education
Pasture Walks in Massachusetts and Vermont:
*MA 2007 - 7 (MassGrass - 1 On-Farm Pasture Evaluation Cooperator)
*VT 2007 - 18 (UVM Center for Sustainable Agriculture or the VT Grass Farmers Association - 1 On-Farm Pasture Evaluation Cooperator)
*MA 2008 - 8 (MassGrass - 1 On-Farm Pasture Evaluation Cooperator)
*VT 2008 - 13 (UVM Center for Sustainable Agriculture or the VT Grass Farmers Association - 3 On-Farm Pasture Evaluation Cooperators)
*MA 2009 - 6 (MassGrass - 1 On-Farm Pasture Evaluation Cooperator)
*VT 2009 - 17 (UVM Center for Sustainable Agriculture or the VT Grass Farmers Association - 2 On-Farm Pasture Evaluation Cooperators)
*MA 2010 - 4 (1 On-Farm Pasture Evaluation Cooperator)
*VT 2010 - 13 (UVM Center for Sustainable Agriculture or the VT Grass Farmers Association - 1 On-Farm Pasture Evaluation Cooperator)
Pasture and Grazing Conferences Massachusetts and Vermont:
*MassGrass 2008 - The Grazing School – seven workshops and a pasture walk (tour of MA pasture project test plots) ; more than 200 participating (see attached program):
*Grazing 101
*Principles of Dairy Nutrition on Pasture
*Finishing Meat Animals on Pasture
*Pastured Poultry Feed and Feeding
*Behavior Based Animal Management
*Multi-species Grazing
*The Economic Benefits of Intensive Grazing
*MassGrass 2009 - The Grazing School – seven workshops and a pasture walk (tour of MA pasture project test plots) ; more than 150 participating (see attached program):
*Grazing 101
*Pasturing in Extreme Conditions
*Alternative Health Practices for Livestock
*Plant Species Diversity and Pasture Management
*Cheese from Sunlight and Rain
*Comparing Grass-fed and Grain-fed steers
*Producing Natural, Local Meat for Consumers
*Annual Vermont Grazing & Livestock Conferences – each with a dynamic program drawing about 400 at the 14th Annual Conference in 2010.
Annual Massachusetts Field Days, Twilight Meetings, and Farmer Research Group Meetings (Other similar meetings and field days were held in other states):
*MA Farmer Research Meeting. April 1, 2007. UMass Crop and Animal Research and Education Center. South Deerfield, MA.
*MA Farmer Research Meeting. April 3, 2007. Jordan Farm, Rutland, MA.
*MA Twilight Barn Meeting. July 12, 2007. Rocky Acres Farm, Warren, MA. (On-Farm Pasture Evaluations Cooperator)
*MA Annual Field Day. August 21, 2007. UMass Crop Research and Education Center Farm. South Deerfield, MA.
*MA Twilight Barn Meeting. July 31, 2008. Templeton Development Ctr. Templeton, MA.
*MA Farmer Research Meeting. March 31, 2009. UMass Crop Research and Education Center Farm South Deerfield, MA.
*MA Farmer Research Meeting. April 1, 2009. Worcester Co. MA.
*MA Round bale rodeo/demonstration. May 20, 2009. UMass Crop Research and Education Center Farm. South Deerfield, MA.
*MA Annual Field Day, July 16, 2009. UMass Crop Research and Education Center Farm. South Deerfield, MA.
*MA Pasture and Angus Beef Cattle Field Day, July 25, 2009. UMass Crop Research and Education Center. South Deerfield, MA.
*MA Twilight Barn Mtg, Aug. 5, 2009. Raymond and Pamela Robinson. Hardwick, MA.
*MA Farmer Meeting, March 31, 2010. Cooks Farm, Hadley, MA
*MA Farmer Meeting, April 7, 2010. Talvy Farm, W. Brookfield, MA (On-Farm Pasture Evaluation Cooperator)
*MA Twilight Barn Meeting, August 18, 2010. Hosted by Wayne Goulet. Hadley, MA.
*MA Annual Field Day, August 11, 2010. UMass Crop Research and Education Center. South Deerfield, MA.
MassAggie Seminars:
February to April, 2007 – three locations
*Keeping Pastures Green
*Manure and Mud Matters
*Will this Plant Hurt My Livestock/Horse?
*Hay, No Mold or Dust Please!
January to March, 2008 – three locations
*Is this Plant Poisonous?
*From Disaster to Pasture
*Weeds in my Pasture, Oh No!
*Manure and Mud Management
*Biosecurity on the Farm
*Understanding Hay Quality
April 2009 Sutton, MA
*Basics of pasture management
*Weeds and poisonous plants in pastures
*Equine and livestock barnyard management
*Hay quality principles
March and April 2010 – two locations
*Basics of pasture management
*Poisonous plants
*Hay quality
*Manure and mud management for Small-scale Livestock
Webpage Enhancements
*UMass Fact Sheets - http://extension.umass.edu/cdle/fact-sheets
*UMass Best Management Practices for Dairy -
http://extension.umass.edu/cdle/fact-sheets/best-management-practices-dairy
*UMass Best Management Practices for Livestock -
http://extension.umass.edu/cdle/fact-sheets/best-management-practices-livestock
*Univ. of Maine Cooperative Extension Publications Catalog
http://extensionpubs.umext.maine.edu/ePOS?this_category=97&store=413&form=shared3%2fgm%2fmain.html&design=413
*Univ. of New Hampshire Cooperative Extension http://extension.unh.edu/agric/AGroCrop.htm
*The Vermont Pasture Network (VPN) - http://www.uvm.edu/~pasture/
Other informal and formal gatherings and training sessions were held relating to pasture management for students from UMass and Tufts University and for USDA as In-Service training meetings. Also presentations were made related to pasture management at several regional and national meetings.
Additional Project Outcomes
Impacts of Results/Outcomes
Five blends were identified through the economic analysis (8, 9, 12, 13, and 18) as being superior to other blends. These contained a diversity of species and cultivars that were not uniformly in common to all the top five blends. This suggests the need for ongoing testing by researchers and farmers, the latter was an initial goal of the project. However, the comments of a farmer are worth noting. In commenting about a field this “photo shows the two middle plots that were the same mix, one called Pro Beef Mix (13.5#/ac) and the other Pro Dairy Pasture Mix (12#/ac.). You know how they market mixes from year to year with new names or mix ratio changes. Very confusing and frustrating. Nevertheless, the two turned out to look exactly alike and you looked up the seed mix description and lo and behold...a match.”
Given then that blend names sometimes are renamed, one problem, or that the cultivars may change without the blend name changing (which we experienced early on in this project), a second problem, it is difficult to see how farmers could do a testing program that would be meaningful. This is especially true since blend productivity cannot be judged from one or two years of testing. Also, since a forage quality analysis and economic evaluation may modify yield based criteria (described further below) it seems that this goal would not be easily met by farmer lead testing.
Research agronomic studies were validated and verified through the economic analysis which follows. The yield determinations in research studies identified Blend 13, to be the most consistently high yielding blend in Massachusetts and Pennsylvania. However, based on the economic analysis for Massachusetts, Blend 13 ranked 5th for the evaluation criteria used; one for income or revenue maximization, and one for the balanced optimization of income, nutritional quality, and species diversification. With the balanced scenario, Blends 8 and 9 were the top 2 blends to achieve a balance in yield, revenue, and feed quality, and for the revenue maximization. These two blends (8 and 9) were never in the top 25% of blends for yield in Massachusetts except the last in the year, 2011 when they were in the top 4 blends.
Research at experimental sites reported as many as seven grazing cycles producing 6 ton/ac of dry matter with 4, 5, and 6 specie blends having the highest productivity in almost all years. Blend 8 was seeded initially with 7 species two of which probably do not contribute to its high ranking. Blend 8, contained annual ryegrass which would not persist, and a small amount of birdsfoot trefoil which was only evident late in the season in later years. While orchardgrass and perennial ryegrass performed well in Pennsylvania, the latter suffer winter damage in Massachusetts and Vermont. While still productive blends those planted with orchardgrass consistently did better after the first year than any without orchardgrass. The orchardgrass cultivar Extend outperformed all other orchardgrass cultivars. Based on two farmer observations in New Hampshire, it appeared that complex seed mixes did not necessarily improve pasture productivity. Despite there being many different cultivars being seeded, most were not present less two or three years after seeding. Instead, there were two or three dominant species (orchardgrass) in the stand, usually those that were best suited to the soil conditions and management practices.
An initial farmer impact included farmers at a pasture walk in Southern New England who viewed five pasture mixes seeded by a farmer (CT) and heard him enthusiastically express his dairy cows’ preference for grazing the new pastures. This farmer was the person who first suggested this project to the project coordinators on a conference call 7 or 8 years ago. Another farmer cooperator in Massachusetts planted the test cultivars and then proceeded to plant previous corn fields to new pasture blends.
Economic Analysis
Methods:
1.1 Benefit-Cost Analysis:
Benefit-cost analysis uses economic components that influence farm profits. For assessing the profit potential for each blend, revenues are calculated using prices and yield of each pasture system. Price information (Table 6) for Pennsylvania was obtained from National Agricultural Statistical Services (PA Office) publications for years 2008 to 2010. The prices for Massachusetts were obtained from National Agricultural Statistical Service – Crop Values Publications. Since price of pasture system is not readily available, price is imputed from “All Hay” prices using conversion based on Crude Protein factor (CPF). The protein estimate from University of Massachusetts for each Massachusetts blend was used to calculate CPF for Massachusetts. Given that protein estimates were not available for blends from PA at this time, CPF from Massachusetts is averaged by blend number and used in estimating CPF for Pennsylvania. The price of each blend is multiplied with respective yield to obtain revenues. Input cost is assumed to be similar for all pasture systems and do not significantly influence the profits. The “All Hay” level of crude protein is assumed to be at 13% level (Freeman, OSU – Report ANSI 3928).
The revenue estimate for each blend is compared to the least performing blend in calculating revenue advantage. This is calculated using the formula R_b-?Min(R?_i),b?i , where Rb is Revenue of blend b and Ri is set of revenues in set i. This is used in calculating revenue increments for each blend in each year. To quantify long term revenue performance, average of the stream of revenue advantage is used for each state. The long-term revenue is used to rank each blend type for each state.
1.2 Multi-Attribute Analysis:
Multi-attribute analysis incorporates economics, yield, and quality of each pasture blend in estimating these outcomes as combinations. To select pasture blends for multiple objectives, five scenarios are used. Scenario Run A used a balance of all attributes for identifying the best pasture blend (Table 7). Scenario Run B Maximizes yield as criteria for selecting blends. Scenario Run C uses revenue as criteria in selecting blends. Scenario Run D uses species number as a criteria for selection. Run E uses feed quality (High protein, low NDF and low ADF) as criteria for selection. The assigned weights are listed in Table 8.
Economic Analysis Results:
2.1 Benefit Cost Analysis
2.1.1 Massachusetts:
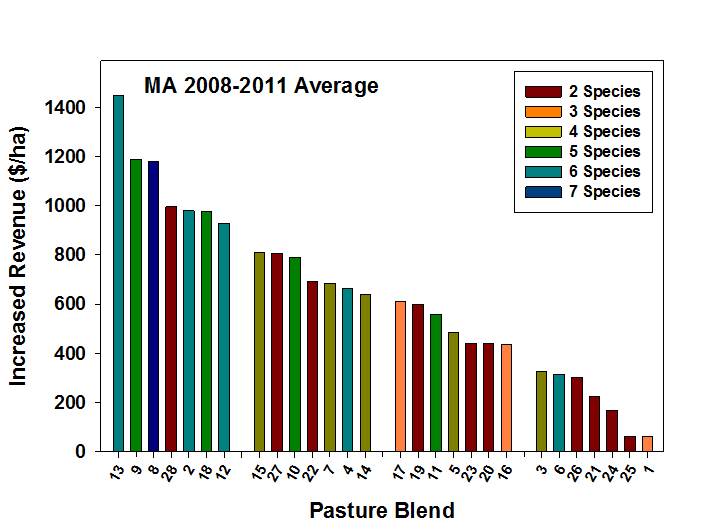
The revenue stream from all pasture blends in Massachusetts is presented in Figure 13. Using four year revenue stream (long term), Blend 13 performed well over all other blends with $1400/ha over the least performing blend. This was followed by Blends 9 and 8 ($1200/ha each). The least performing blends in Massachusetts were Blends 1, 24, and 25.
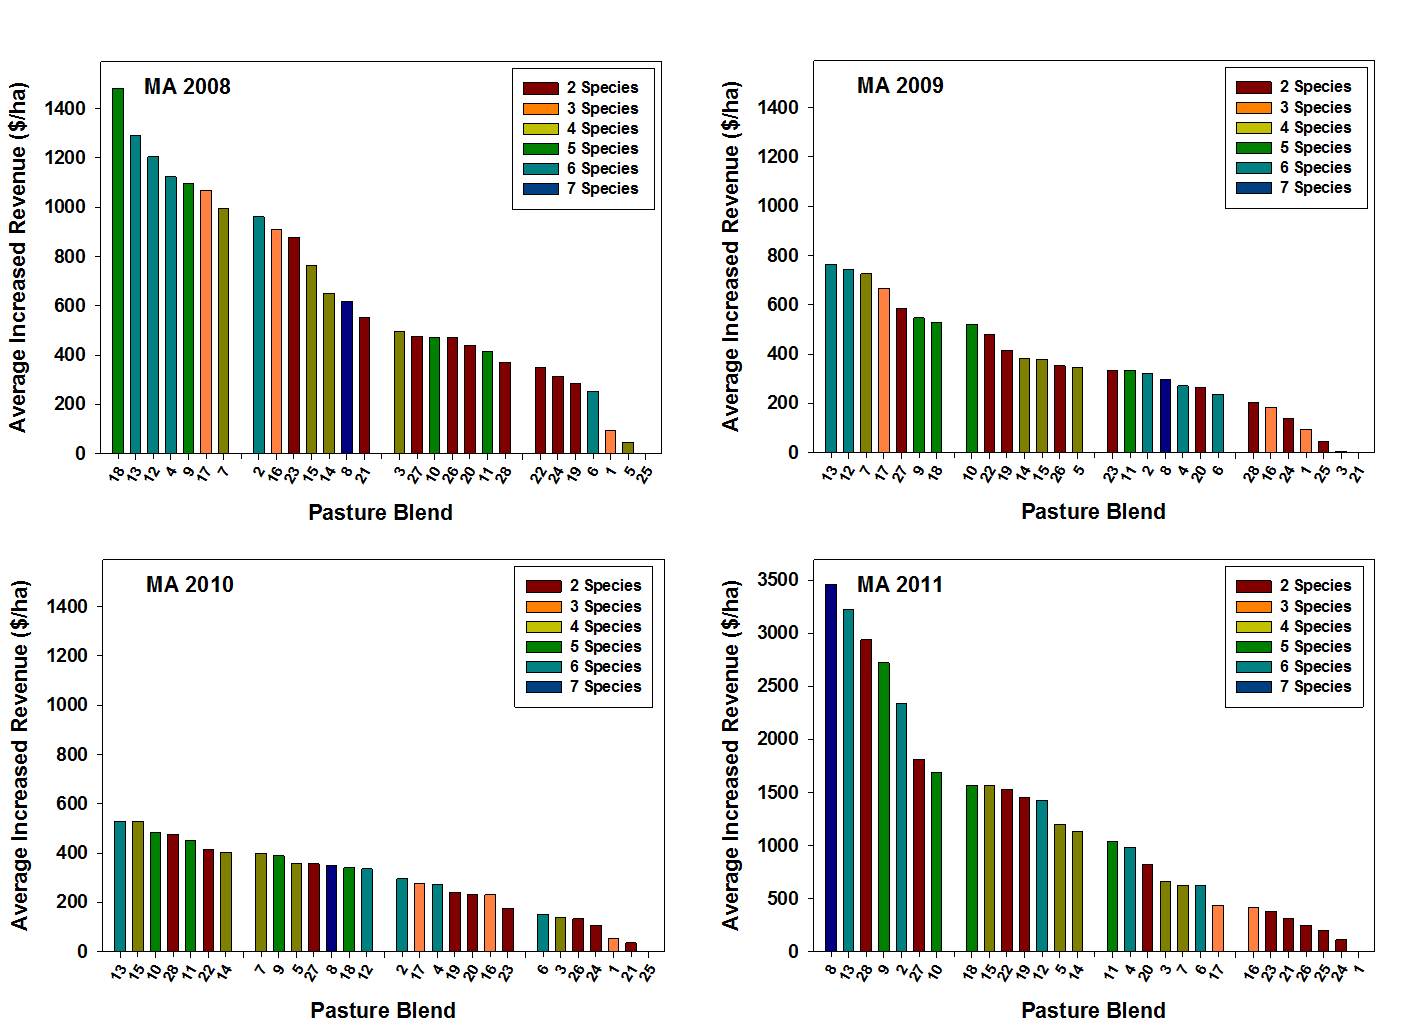
Figure 14 presents revenue performance of each pasture blend each year. In 2008, Blend 18 had the highest revenue (higher by $1500/ha from least performer, Blend 25) compared to all other in Massachusetts. This was followed by Blends 12 and 13 which had incremental revenue of $1200/ha compared the least performer (Blend 25). In 2009, Blend 13 performed well by ($750/ha higher than Blend 21) compared to all other blends. This is followed by Blend 12 that was close to performance of 7 (around $700/ha). In 2010, Blends 13 and 15 had a highest revenue ($525/ha compared to Blend 25). Blends 21 and 25 had the lowest revenue in this year. In 2011, Blend 8, was $3500/ha higher than Blend 1, closely followed by Blend 13 at $3200/ha.
Overall, Blend 13 can be identified as consistent in ranking in the top three revenue generators in all the years. Top performers varied by individual years. Blend 12 performed well in 2008 and 2009 but ranked lower in 2010 and 2011.
2.1.2 Pennsylvania:
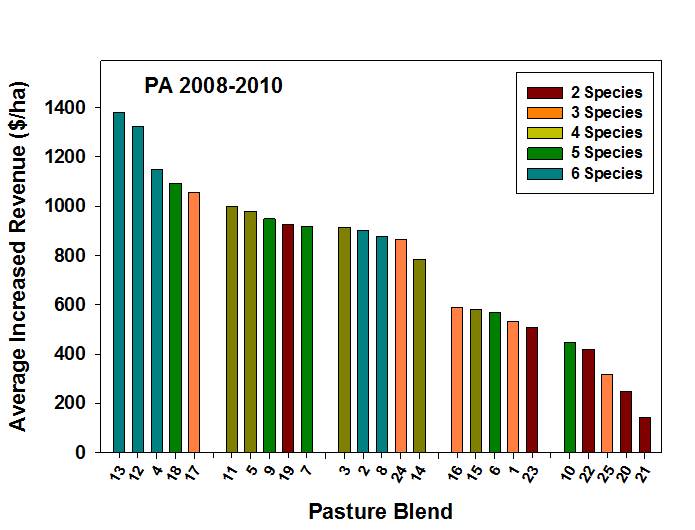
The long-term revenue stream of pasture blends, averaged over three year is presented in Figure 15. Blend 13 ranked the topmost in the long-term by $1400/ha over the least performing Blend 21. Blend 12 ranked close with $1300/ha above the least performer. Blends 25, 20, and 21 ranked the lowest in revenue potential over the three years.
In year 2008, Blends 18 and 4 had the highest revenue at above $1400/ha over Blend 22 (lowest revenue). The least performers were Blends 10, 20, and 22. In year 2009, Blend 13 had the highest revenue of $1700/ha compared to Blend 20. Blends 19 and 12 ranked next with $1400/ha. Blends 20, 21, and 25 had lowest revenues. In year 2010, Blend 12 ranked the highest with $1400/ha compared to Blend 21. Blend 13 and 9 ranked next in the ranking sequence.
Overall, there is no consistent blend that ranked in top 3. Blend 13 had 5th rank in 2008 but performed well in 2009 and 2010. Blend 12 ranked 4th among all blends in 2008, but rose to the top three in 2009 and 2010. Blends 12 and 13 can be chosen as top performers. This is in agreement with long-term revenue calculations.
2.1.3 Vermont:
Using yield estimates of Vermont experiments, one could infer economic benefit of Pasture blends. MA and PA data show a strong correlation between yield and economic gains. Using this principle, one can infer economic performance of pasture blends in VT. General observation is that 2010 performance of all blends dropped by more than 60% of yield levels in 2008 and 2009. This could be explained by the fact that 2010 estimates include only the 2nd harvest while earlier years accounted for all harvests. Thus comparing 2010 values with previous two years need to be done with caution. Further, the Vermont site had increasing weed densities over time and these lead to abandonment of the experiment. Yields presented are for total biomass collect (planted forage plus weeds) thus without further analysis one may be making inferences based in-part on weed effects not the forage blends, especially in later years.
One could still use relative performance (intra-year) to assess multi-year performance in VT. There was no consistent performer (top three) among all blends in VT. The top performer in 2008 is Blend 11 that dropped to 10th rank in 2009 and one of worst two performers in 2010. This could be from lower performance of Blend 11 in second harvest. The top performer in 2009 is Blend 22 that rose from being one of the two worst performers in 2008 and ranked at a median of the range in 2010. Blend 26 was the top performer in 2010 (considering only second harvest), which ranked 4th in 2009, and was the worst performer in 2008 among all other blends. Using “top ten” as criteria for consistency in performance, Blend 19 ranked consistently among the top 10 during all years. All other blends had a high variability in achieving “top 10” status among the three years.
2.2 Multi-attribute Analysis:
The Multiattribute analysis (Table 9) for the balanced scenario (RunA) where all goals need to be balanced, Blend 8 ranked the top. This is followed by Blend 9. Blend 12 had the third rank under this multi-objective scenario. The worst performing blend was Blend 22. Under the yield maximizing scenario (RunB), Blend 13 is the best, followed by Blend 28 and 10. The worst performer in yield is Blend 25.
Under the income maximizing scenario (RunC), Blend 8 ranked the highest, followed by Blends 9 and 12 and then Blend 13. Blend 22 was the lowest ranked. Under the species diversity scenario (Run D), Blend 8 ranked the highest with most number of species. This is followed by Blends 18 and 13. And under the feed quality scenario (Run E), Blend 1 ranked the highest in maximum protein and low NDF and ADF. This is followed by Blends 5 and 20. The least performer in this scenario is Blend 9.
In summary, with a balanced scenario, Blends 8, 9, 12, 13, and 18 are the top 5 blend to achieve a balance in yield, revenue, and feed quality. With a revenue criterion the same blends (8, 9, 12, 13, and 18) can be selected with a similar ranking of first to fifth.
- Tables 6, 7, 8. Prices, Scenarios and Weight used in MAUT
- Fig 13. MA 4-yr economic analysis.
- Fig 15. PA 4-yr economic analysis.
- Table 9. MA MAUT assessment results.
- Fig 14. MA economic analysis 2008-2011.
Farmer Adoption
While not every farmer who planned to be involved in testing actually did a test or had success in establishment, below cite some examples of successful adoption by farmers.
The farmer, first to suggest this project to the project coordinators on a conference call 7 or 8 years ago, spoke favorably to farmers at a pasture walk on his farm in Connecticut, about the five pasture mixes seeded as part of this project. The touring farmers heard him enthusiastically express his dairy cows’ preference for grazing the new pastures. He continues in dairying and continues to value pasture.
The farmer in Massachusetts, who planted the test cultivars, was in the process of changing from dairy to another farm enterprise. In seeing the productivity of these blends on his own farm and from attending field days at the Massachusetts research site he proceeded to plant his previous corn fields to new pasture blends. He changed from dairy production to grass-fed beef with high-end direct marketing beef to restaurants in Boston. Where there were no fences before, now lush pasture grazing beef cattle draw the attention of many passing by.
A Vermont farmer raising Angus beef, pastured poultry, and turkeys seeded several blends in cooperation with this project. He farms more than over 300 acres of pasture and hayland, and more forest, and had not seeded any pastures in more than 5 years, was interested in white and red clover, trefoil and others that will do well on the soils of the farm (soils formed in sandy glacial till). He states “the plot with Haymaster (13#/ac.)...a clear winner as far as production is concerned with a lot of Alfalfa and great orchardgrass”. Two others seeded (Pro Beef Mix and the other Pro Dairy Pasture Mix) were also rated very good, but another (Kings Dairy Plus Mix) was rated poor or “a looser”. In his word “I am very happy with the overall results…” and he plans to seed more pasture using information and experience gained by participating in this project.
A Vermont sheep farmer had tried to improve pastures and has seeded clover in the past 5 years. She has poor soils and wanted to find something that would grow well and survive with more intensive managed grazing and thereby improve the pasture. The initial seeding is still growing and continues to be monitored for animal grazing preference. Information gained from this project has influenced her choice of seed mixes in other pastures she has planted and will for future pasture seeding.
The farm manager at an agricultural school in Massachusetts seeded large strips of 5 blends and has been influential in promoting pasture renewal and in introducing other farmers to new pasture blends.
A Vermont dairy farmer had seeded Alice ladino clover, perennial ryegrass, Kentucky bluegrass, and tall fescue in the last 5 years prior to this project. He stated his interest was in festulolium and no-till seeding of pastures. He still monitors the varieties and stated they seem better than the rest of the field. This farm has a long history of organic production hence productive pastures are important. One important thing he has learned from this project is to have confidence in formulating his own custom blends without the extra expense of purchasing commercial blends.
A Massachusetts farmer grazed fields with pastured poultry and a small flock of sheep. Over three years he concluded orchardgrass was by far the fastest growing species, extremely productive, and thrived in this soil. The sheep loved it, BUT it was horrible for pulling pastured chicken pens over and through because of the clumping nature of the orchardgrass. All the mixtures had their pros and cons. In general the poultry most enjoy clovers and new green growth at a modest height. Running the sheep just ahead of the birds did help bring the pasture height down to an acceptable level for the birds to then consume. In the future if we were just looking to run chickens and a few sheep we would not use orchardgrass, and stick to Alice and other shorter white clovers. The blends of the fescues, ryegrass, and festulolium worked well even in the dry soils.