Final report for LNE13-325
Project Information
Seven farmers from Maine, Massachusetts, and Vermont participated in two years of on-farm trials evaluating in-season diagnostic testing for winter grains. A total of 21 individual trials were conducted (7 in hard red winter wheat, 8 in winter rye, 5 in winter spelt, and 1 in triticale). Advisory teams in each state, comprised of participating farmers, crop advisors, project staff and PIs, met each winter to plan trials, evaluate results, and redesign trials to address new questions. Project PIs also conducted two years of extensive on-station trials at three sites (Maine, New York, and Vermont).
Topdressing at spring greenup (growth stage, GS, 25) increased both spike numbers and grain yield relative to a no-topdress control in the majority of on-farm and research station site-years for both winter wheat and winter rye, while results for winter spelt were inconclusive. C ounting tillers at spring greenup (GS25) shows promise as a tool to guide decisions of when to apply topdress N for winter wheat and winter rye in our region. In situations when farmers plan to apply a single topdress application, tiller density can indicate whether that application should be made at GS25 or postponed until GS30. For winter wheat, yields and profits were optimized by using critical levels of 87 and 84 tillers/ft2, respectively, which are within the 70-90 tillers/ft2 range suggested by current Virginia guidelines for soft winter wheat. Preplant manure application did not appear to influence this critical tiller density. For example, the critical tiller density appears to be lower than for winter wheat. Further trials should be conducted to develop more robust recommendations for critical tiller densities and rates.
Over 500 farmers, agricultural service providers, students, and researchers learned about winter grain nitrogen management from presentations at 16 field days and 8 winter conferences held in Maine, Vermont, New York, New Hampshire, New Brunswick, and Quebec, as well as research reports and newsletter articles. Fifteen winter grain farmers adopted a new N fertility practice as a result of this project, including reducing or eliminating fall N applications and using spring tiller densities to guide spring topdress decisions. Two cooperating farmers who grow winter rye on a total of 800 acres per year increased N use efficiency by 25 to 35% by eliminating fall N applications and relying on spring tiller tests to determine when to apply topdress N. One cooperating winter wheat farmer/miller also adopted the adaptive management approach, reducing fall N applications and using early spring stand assessment to determine spring topdress rates. Increased yield, higher grain protein, and reduced N fertilizer use increased his farm revenue by an average $217/acre affecting 50 acres per year. This project also prompted farmers to make other management changes, such as seeding methods and variety selection, to make the most of their N management.
Introduction:
Small grains have gained importance in New England agriculture over the last decade due to expanding demand for local sources for food and feed. Growers are interested in grains that are planted in the fall (winter wheat, spelt, triticale, rye) because they provide numerous rotational benefits, produce high yields, scavenge residual soil nitrogen (N), and protect the soil from winter erosion. Grower surveys indicated that N fertility management is a key production challenge for winter grains, which involves providing enough N at the right times to optimize yields and, in the case of bread wheat, grain protein. Readily available N applied at planting is subject to over winter losses via leaching and volatilization; and mineralization of organic N sources is difficult to predict and lags behind crop demand in the early spring.
This project used adaptive management to improve N-use efficiency, reduce environmental N losses, and increase revenue for winter grain production. We combined extensive research station trials with participatory on-farm trials to adapt in-season diagnostic testing for conventional and organic winter grain production in New England. Under this strategy growers minimize fall N applications and implement spring tests to guide N topdress rates at two key growth stages. The N rate at spring green-up (Zadok growth stage 25 or GS25) is adjusted based on tiller density to optimize yield; the rate at jointing (GS30) is adjusted based on tissue N concentration to optimize grain protein. This approach is used successfully in other humid regions of the U.S. and had shown promise in local preliminary trials. We engaged a core group of growers and service providers in inquiry-based learning through on-farm testing to develop new N management recommendations and regional expertise. These research efforts were coupled with a variety of educational offerings (on-farm demonstrations, field days, workshops, research reports, and newsletter articles) to help growers increase their understanding of N dynamics in winter grains and their N management skills using an integrated approach that includes rotations, green manures, amendments, N fertilizers, and in-season testing.
50 farmers adopt in-season diagnostic testing for winter grain production on 800 acres, and thus improve nitrogen use efficiency by 30% or more, for bread wheat meet the 12% grain protein standard on 600 acres, and increase the value of their grain by an average of $300/ton, or $180,000/year.
Cooperators
- (Educator and Researcher)
Research
Research objectives for this project were:
- Determine if the critical levels and recommendations for the GS25 and GS30 tests need to be adjusted for our region, and begin building the database to do so.
- Evaluate the performance of the GS25 and GS30 tests for use in organic production.
- Evaluate the performance of the GS25 test for winter grains other than wheat.
We took a two-pronged approach to address our research objectives. On-farm trials were conducted to evaluate the tests’ performance over multiple sites, and extensive research-station trials were conducted to generate multiple response curves for the tests and establish a relationship between test levels and optimum topdress N rates.
On-farm trials
Seven collaborating farmers (3 in ME, 3 in VT, and 1 in MA) implemented a total of 21 trials over two years (8 in winter rye, 7 in winter wheat, 5 in winter spelt and 1 in winter triticale; of which 9 were managed organically). Eight of the 21 trials were either discontinued or not included in this summary due to severe winterkill or uneven plant stands. Results from 6 winter rye, 5 winter wheat, and 2 winter spelt on-farm trials are reported here. Of those, 1 winter wheat and 1 spelt trial were managed organically.
At each site, growers compared their standard fertility practice with a range of spring N topdressing rates applied at GS25 for the rye fields and GS25, GS30, or both for the winter wheat and spelt fields. Specific topdressing rates were selected based on farmer interest and therefore were not the same across sites. Ammonium nitrate was used at the conventionally managed sites and Chilean nitrate was used at the organic sites. Measurements included standard soil tests, plant and tiller counts at GS25, lodging, spike counts at maturity, grain yield, test weight, and, for wheat, grain protein. Data were analyzed by site and year using analysis of variance with means separation by Tukey’s least significant difference. For sites where the treatment structure allowed us to generate N response curves for GS25 topdressing, return over variable costs (ROVC) were calculated using prices obtained from cooperating farmers: wheat for grain and rye for seed selling price at $0.16/lb, nitrogen fertilizer cost at $0.65/lb, and broadcast spreading cost at $2.02/acre. Nitrogen response curves were fit for yield and ROVC using a quadratic or quadratic-plateau model.
Research Station Trials
Research trials were established in Old Town, Maine; Borderview, Vermont; and Willsboro, New York in the falls of 2013 and 2014. The original treatments were a factorial arrangement of two main factors: fall planting methods (seed rates, varieties, preplant N) to achieve different spring tiller densities and spring N topdress rates to generate N response curves for each planting method. Winter wheat was planted with the following treatments: cv Harvard at 200, 300, and 400 seeds/m2 with no preplant N application, cv Harvard at 300 seeds/m2 with preplant manure, and cv Morley at 300 seeds/m2 with no preplant N application. In the spring, these plots were topdressed with ammonium nitrate at a range of four to five N rates from 0 to 120 kg/ha at either GS25 or GS30. Another set of treatments received various combinations of both GS25 and GS30 applications but are not included here. Return over variable costs (ROVC) was calculated as above, and N response curves were fit for yield and ROVC using a quadratic-plateau model. The Vermont and New York research station locations suffered from heavy winterkill loses and highly variable growing conditions so results from those site-years are not reported here. In Maine, winterkill greatly reduced the number of usable plots and hence treatments that could be implemented in 2014 but the full set of treatments was implemented in 2015.
As noted above, winterkill was a major issue preventing the completion of a number of the planned trials. As well, at some of our on-farm sites, data were high variability due to uneven plant stands and weed pressure, making it difficult to detect differences among topdress treatments. On-farm sites with highly variable results are indicated with an asterix (*) in Tables 1-4.
Given the reduction in data and increased interest in winter rye versus winter wheat among cooperating farmers, we chose to focus our efforts on evaluating the GS25 tiller count test. The discussion below summarizes results from both on-farm and research stations trials to answer the three research questions outlined above but phrased slightly differently.
- Did N topdressing increase spike density and grain yield?
- Can we use tiller counts at spring greenup to predict topdress N needs for winter grains?
- Do we need to adjust recommendations for our region and non-wheat crops?
Did N topdressing increase spike numbers and grain yield?
The first step in our analysis was to determine if N topdressing is an effective strategy to increase tillering (evaluated here as an increase in spike density at maturity) and therefore yield. Prior research station trials in Maine and Vermont had shown this to be the case for winter wheat (Mallory and Darby, 2013) but we needed to verify in on-farm conditions and for other crops.
In the on-farm trials, topdressing significantly increased spike numbers relative to the no-topdress control treatment at four of five winter wheat sites, four of six rye sites, and neither spelt site (see Tables 1-3). At three of the winter wheat and one of the rye sites, the highest spike densities were achieved with the highest N rates, whereas at most of the rye sites and one wheat site, spike densities were not affected with N rates higher than 40 or 60 lb/acre. Note that for sites with relatively high initial tiller numbers where topdressing had an effect (sites 1, 8, and 9), final spike numbers were lower than initial tiller numbers. In these instances, topdressing did not actually increase tillering but rather increased the portion of tillers that developed into productive spikes, and therefore helped maintain yield potential.
Topdressing significantly increased grain yields at three of five wheat sites, three of six rye sites, and neither spelt site. Topdressing was a significant effect at one other wheat site (site 5) but in this case N applications actually reduced yields presumably due to more severe lodging (although 100% of plot areas lodged for all treatments). At the other sites, lodging increased with increasing N rates at seven of the sites indicating the importance of identifying the minimum N rate needed to improve yields. At the sites where topdressing increased yields, maximum yield levels were reached with 40 and 60 lb N/acre where tiller counts were low (sites 6 and 7) and at 20 lb N/acre where tiller density was high (sites 1 and 8). Also note that at sites with high initial tiller counts, topdressing at low rates caused more lodging than at sites with low tiller counts.
In the research station trials, topdressing clearly increased winter wheat spike density and grain yield, as shown by the N response curves in Figure 1. The figure isummarized all five planting treatments for 2015 and the cv Harvard at 300 with no preplant N treatment for 2014.
Can we use tiller counts at spring greenup to predict topdress N needs for winter grains?
Our on-farm results suggest that yes, spring tiller numbers can guide spring topdress decisions for winter rye but the data are inconclusive for wheat and spelt. Table 4 shows that at winter rye sites with tiller densities above 50 tillers/ft2, yields maxed out with little or no topdress N (sites 3-6). In contrast, sites 6 and 7 had low initial tiller numbers and required substantially more topdress N to produce maximum yields. The winter wheat sites did not follow this same pattern. For wheat, response to topdress N appears unrelated to tiller density, however results from the one low tiller site are not reliable due to high variability in stands.
Data from the research station trials and on-farm sites 3, 4, and 6-11 were used to evaluate the economic optimum N topdress rate for winter wheat and rye as a function of GS25 tiller density. The quadratic-plateau model fit the N response for wheat and some rye sites best (Fig. 2), whereas the quadratic model provided the best fit for the rye sites where higher topdress rates caused considerable lodging and declines in harvested yield (Fig. 3). The economic optimum N rate was identified as the lowest N rate at which ROVC reached maximum value.
For winter wheat, no relationship was found between the economic optimum N rate and tiller density, over the range of tiller densities that occurred in our trials (Fig. 4). Economic optimum N rates ranged from 54 to 77 kg/ha (48 to 69 lb/ac) regardless of tiller density. However, the range of tiller densities in these wheat trials was relatively narrow (63 to 97 tillers/ ft2) and all were close to or above the range in critical values that other states use for deciding whether to topdress at GS25 to stimulate tillering or wait until GS30 for soft winter wheat. This range is 50 to 70 tillers/ft2 (Alley et al., 2009; Murdock et al., 2009; Weisz and Heininger, 2012) but these recommendations assume additional topdress will be applied at GS30. Our cooperating farmers indicated that they will likely topdress only once, either at GS25 or at GS30 but not both. For single topdress management, Virginia uses a slightly higher critical tiller density (70 to 90 tillers/ft2) and bases actual rates on soil nitrate levels. For our wheat trials, we found no significant relationship between optimum topdress N rate and soil nitrate (data not shown), but again tiller densities for our sites were relatively high and would suggest waiting to topdress at GS30.
For winter rye, there was a larger range of tiller densities and clearer differences among sites in economic optimum N rate than for wheat. The two rye sites with tiller densities around 400 tillers/m2 (37 tilllers/ft2) had an optimum N rates of 94 and 101 kg/ha (84 and 90 lb/ac), whereas optimal N rates at the sites with higher tiller densities were 0 or 36 kg/ha (32 lb/ac).
Do we need to adjust recommendations for our region and non-wheat crops?
As noted before, the tiller density test is commonly used to decide whether to apply topdress N at GS25 to stimulate tillering or to wait until GS30. To evaluate the test for this decision for winter wheat, we calculated the relative yields (or ratio) of plots topdressed at GS25 versus an additional set of plots that were topdressed at GS30. Relative yields above 1 indicate higher yields when topdressing was applied earlier than later.
The relative yield (GS25:GS30) of winter wheat was negatively related to tiller density over the range of tiller densities that occurred (Fig. 5). At tiller densities below 954 tillers/m2 (87 tillers/ft2), yields were higher when topdress N was applied at GS25 as compared with GS30. This relationship did not appear to be affected by preplant manure. A similar approach was used to evaluate the critical tiller density in terms of difference in profits when topdress is applied at GS25 versus GS30 (Fig. 6). In this case, it was more profitable to topdress earlier than later at tiller densities below 906 tillers/m2 (84 tillers/ft2) given the assumed prices for N fertilizer and wheat grain. These values are within the 70 to 90 tillers/ft2 critical range identified in the recommendation from Virginia for single topdress application management (Alley et al., 2009). At tiller densities above 90 it is advised to postpone application until GS30 in order to avoid forming too many tillers and losing N to leaching. While more testing is needed to verify the critical level for topdress timing for wheat in the Northeast, the fact that our results agree with existing recommendations from another region suggests that we may not need to adjust those recommendations very much.
For winter rye, we were not able to conduct a similar analysis of the effect of delaying topdress application because topdress was only applied at GS25 in the on-farm rye trials. However, it appears from the rye data presented in Fig. 4 that winter rye has a lower critical tiller density than wheat when price assumptions are equal, and it would be even lower if rye grain were assigned a lower value depending on the market.
References:
Alley, M.M., P. Scharf, D.E. Brown, W.E. Baethgen, and J.L. Hammons. 2009. Nitrogen management for winter wheat: Principles and recommendations. Virginia Cooperative Extension, Blacksburg, VI.
Mallory, E.B., and H. Darby. 2013. In-season nitrogen effects on organic hard red winter wheat yield and quality. Agron. J. 105:1167-1175.
Murdock, L., J. Grove, and G. Schwab. 2009. Fertilizer management. In: A comprehensive guide to wheat management in Kentucky. The University of Kentucky college of Agriculture, Lexington, KY.
Weisz, R., and R. Heiniger. 2012. Nitrogen management for small grains, p. 27-33, In R. Weisz, ed. Small grain production guide 2011-2012. North Carolina State University, Raleigh.
Table 1. Effects of spring N topdressing rates on winter wheat spike density, grain yield, and lodging in on-farm trials. Site 2 was managed organically.
|
Site# - Crop Location & Year Preplant N |
GS25 N appl. rate |
GS30 N appl. rate |
Spike density at maturity |
Grain yield |
Lodging severity |
|
Tiller # |
(lb/acre) |
(lb/acre) |
(no./sqft) |
(lb/acre) |
(5=worst) |
|
Site 1 – Winter wheat |
0 |
0 |
29 c |
1598 d |
0.0 c |
|
MA 2014 |
30 |
0 |
36 bc |
2855 ab |
2.33 b |
|
Preplant N @ 38 lb/ac |
60 |
0 |
48 a |
3054 a |
4.67 a |
|
71 tillers/ft2 |
90 |
0 |
45 ab |
2963 a |
4.67 a |
|
|
0 |
30 |
37 bc |
2223 c |
0.0 c |
|
|
0 |
60 |
42 ab |
2541 bc |
2.0 bc |
|
|
0 |
90 |
44 ab |
3147 a |
3.67 ab |
|
ANOVA p-value |
|
|
significant |
significant |
significant |
|
|
|
|
|
|
|
|
Site 2* – Winter wheat |
0 |
0 |
18 c |
1342 |
1.0 |
|
ME2014 |
20 |
0 |
25 b |
1285 |
1.0 |
|
No preplant N |
0 |
20 |
23 bc |
1624 |
1.0 |
|
24 tillers/ft2 |
10 |
10 |
33 a |
1777 |
1.0 |
|
ANOVA p-value |
|
|
0.012 |
ns |
ns |
|
|
|
|
|
|
|
|
Site 3 – Winter wheat |
0 |
0 |
45 c |
2263 c |
1.0 |
|
ME2015 |
20 |
0 |
44 c |
3086 b |
1.0 |
|
No preplant N |
40 |
0 |
53 b |
3134 b |
1.0 |
|
65 tillers/ft2 |
60 |
0 |
58 b |
3842 a |
1.0 |
|
|
90 |
0 |
66 a |
4136 a |
1.0 |
|
ANOVA p-value |
|
|
0.001 |
0.001 |
ns |
|
|
|
|
|
|
|
|
Site 4 – Winter wheat |
0 |
0 |
51 b |
2420 b |
1.0 |
|
ME2015 |
20 |
0 |
47 b |
2811 b |
1.0 |
|
Preplant N @ 20 lb/ac |
40 |
0 |
53 b |
3841 a |
1.0 |
|
73 tillers/ft2 |
60 |
0 |
48 b |
4225 a |
1.0 |
|
|
90 |
0 |
66 a |
3969 a |
1.0 |
|
ANOVA p-value |
|
|
0.001 |
0.001 |
ns |
|
|
|
|
|
|
|
|
Site 5* – Winter wheat |
0 |
0 |
55 |
4990 a |
100% of site |
|
MA 2015 |
30 |
0 |
59 |
4114 bc |
lodged |
|
|
60 |
0 |
58 |
2934 e |
|
|
31 tillers/ft2 |
90 |
0 |
68 |
3486 cde |
|
|
|
0 |
30 |
45 |
3955 bcd |
|
|
|
0 |
60 |
61 |
4560 ab |
|
|
|
0 |
90 |
56 |
3778 bcde |
|
|
|
30 |
30 |
64 |
3173 de |
|
|
|
30 |
60 |
60 |
3329 cde |
|
|
|
30 |
90 |
67 |
3437 cde |
|
|
ANOVA p-value |
|
|
ns |
0.002 |
ns |
Averages within a site that share the same letter are not significantly different from one another (using Tukey’s Least-Significant Difference Tests). No letters means the treatment effect was not significant.
Table 2. Effects of spring N topdressing rates on winter rye spike density, grain yield, and lodging in on-farm trials at six site-years. All sites were managed conventionally.
|
Site# - Crop Location & Year Preplant N |
GS25 N appl. rate |
GS30 N appl. rate |
Spike density at maturity |
Grain yield |
Lodging severity |
|
Tiller # |
(lb/acre) |
(lb/acre) |
(no./sqft) |
(lb/acre) |
(5=worst) |
|
Site 6 - Rye |
0 |
0 |
28 c |
1192 d |
1.0 |
|
ME 2014 |
20 |
0 |
34 c |
1595 c |
1.0 |
|
No preplant N |
40 |
0 |
49 b |
2289 b |
1.0 |
|
31 tillers/ft2 |
60 |
0 |
54 ab |
2782 a |
1.7 |
|
|
90 |
0 |
65 a |
2893 a |
1.7 |
|
ANOVA p-value |
|
|
0.002 |
0.001 |
0.099 |
|
|
|
|
|
|
|
|
Site 7 - Rye |
0 |
0 |
42 b |
1423 b |
1.0 b |
|
ME 2014 |
20 |
0 |
40 b |
1365 b |
1.0 b |
|
Preplant N @ 10 lb/ac |
40 |
0 |
45 b |
2500 a |
1.0 b |
|
39 tillers/ft2 |
60 |
0 |
60 ab |
2394 a |
1.7 ab |
|
|
90 |
0 |
64 a |
2876 a |
2.3 a |
|
ANOVA p-value |
|
|
0.091 |
0.011 |
0.002 |
|
|
|
|
|
|
|
|
Site 8 - Rye |
0 |
0 |
24 c |
1296 b |
2.0 bc |
|
ME 2014 |
20 |
0 |
37 b |
2138 a |
1.0 c |
|
No preplant N |
40 |
0 |
42 b |
1887 ab |
1.7 bc |
|
86 tillers/ft2 |
60 |
0 |
43 b |
2075 a |
3.2 ab |
|
|
90 |
0 |
62 a |
1176 b |
4.8 a |
|
ANOVA p-value |
|
|
0.001 |
0.054 |
0.000 |
|
|
|
|
|
|
|
|
Site 9 - Rye |
0 |
0 |
34 b |
1817 |
1.3 b |
|
ME 2014 |
20 |
0 |
38 b |
1771 |
1.3 b |
|
Preplant N @ 10 lb/ac |
40 |
0 |
48 ab |
1480 |
3.7 a |
|
65 tillers/ft2 |
60 |
0 |
62 a |
1211 |
4.7 a |
|
|
90 |
0 |
56 a |
1393 |
4.7 a |
|
ANOVA p-value |
|
|
0.015 |
ns |
0.016 |
|
|
|
|
|
|
|
|
Site 10 – Rye |
0 |
0 |
48 |
2797 |
0.5 b |
|
ME 2015 |
20 |
0 |
47 |
2939 |
1.6 ab |
|
No preplant N |
40 |
0 |
58 |
3028 |
2.8 ab |
|
79 tillers/ft2 |
60 |
0 |
54 |
2957 |
3.9 a |
|
|
90 |
0 |
58 |
3034 |
3.9 a |
|
ANOVA p-value |
|
|
ns |
ns |
0.020 |
|
|
|
|
|
|
|
|
Site 11* – Rye |
0 |
0 |
55 |
1765 |
0.5 b |
|
ME 2015 |
20 |
0 |
44 |
2113 |
1.1 b |
|
No preplant N |
40 |
0 |
44 |
2309 |
1.1 b |
|
127 tillers/ft2 |
60 |
0 |
45 |
2827 |
3.3 a |
|
|
90 |
0 |
53 |
2517 |
4.4 a |
|
ANOVA p-value |
|
|
ns |
ns |
0.001 |
Averages within a site that share the same letter are not significantly different from one another (using Tukey’s Least-Significant Difference Tests). No letters means the treatment effect was not significant.
Table 3. Effects of spring N topdressing rates on winter spelt spike density, grain yield, and lodging in on-farm trials at two site-years. Site 12 was managed organically.
|
Site# - Crop Location & Year Preplant N |
GS25 N appl. rate |
GS30 N appl. rate |
Spike density at maturity |
Grain yield |
Lodging severity |
|
Tiller # |
(lb/acre) |
(lb/acre) |
(no./sqft) |
(lb/acre) |
(5=worst) |
|
Site 12* – Spelt |
0 |
0 |
29 |
2911 |
1.0 |
|
ME 2014 |
20 |
0 |
38 |
3110 |
1.5 |
|
No preplant N |
0 |
20 |
35 |
3009 |
1.5 |
|
52 tillers/ft2 |
10 |
10 |
37 |
3130 |
1.5 |
|
ANOVA p-value |
|
|
ns |
ns |
ns |
|
|
|
|
|
|
|
|
Site 13* - Spelt |
0 |
0 |
58 |
2872 |
0.1 b |
|
MA 2015 |
30 |
0 |
44 |
3384 |
0.4 b |
|
|
60 |
0 |
54 |
2955 |
1.9 ab |
|
31 tillers/ft2 |
90 |
0 |
49 |
3275 |
3.7 a |
|
|
0 |
30 |
44 |
3683 |
0.1 b |
|
|
0 |
60 |
44 |
3211 |
1.8 ab |
|
|
0 |
90 |
57 |
3016 |
1.6 ab |
|
|
30 |
30 |
45 |
3095 |
2.8 a |
|
|
30 |
60 |
44 |
3124 |
2.8 a |
|
|
30 |
90 |
51 |
3342 |
3.2 a |
|
ANOVA p-value |
|
|
ns |
ns |
0.09 |
Averages within a site that share the same letter are not significantly different from one another (using Tukey’s Least-Significant Difference Tests). No letters means the treatment effect was not significant.
Table 4: Average tiller counts and the spring greenup (GS25) topdress N rate that produced maximum yield for the on-farm trials with rye, wheat, and spelt.
|
Site |
Crop |
Average tiller count (no./ft2) |
Topdress N rate when yield maxed out (lbs N/ac) |
|
1 |
Winter wheat |
71 |
30 |
|
2* |
Winter wheat |
24 |
N/A** |
|
3 |
Winter wheat |
65 |
60 |
|
4 |
Winter wheat |
73 |
40 |
|
5 * |
Winter wheat |
31 |
0 |
|
6 |
Winter rye |
31 |
60 |
|
7 |
Winter rye |
39 |
40 |
|
8 |
Winter rye |
86 |
20 |
|
9 |
Winter rye |
65 |
ns |
|
10 |
Winter rye |
79 |
ns |
|
11 |
Winter rye |
127 |
ns |
|
12* |
Winter spelt |
52 |
N/A** |
|
13* |
Winter spelt |
31 |
ns |
* Uneven crop plant stands and weed pressure caused high variability in yields.
** Only one GS25 N rate tested at these sites. Other treatments included GS30 topdressing.
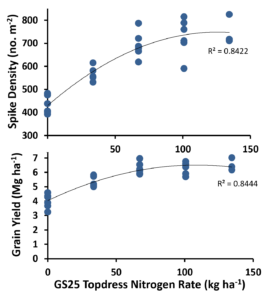
Figure 1. Spike density and grain yield as affected by rate of N topdress applied at GS25 in research station trials conducted in Old Town, Maine in 2014 and 2015. Data points are the average of 5 replicate plots for a variety of seeding rate and preplant nitrogen treatments.
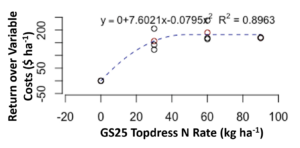
Figure 2. Example of how the economic optimum GS25 N rate was determined by planting treatment or on-farm site using a quadratic-plateau model. Data points are from individual plots for the planting treatment cv Harvard seeded at 200 seeds/m2 with no preplant nitrogen.
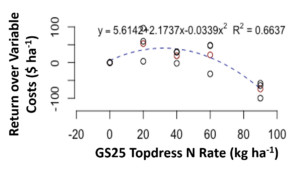
Figure 3. Example of how the economic optimal GS25 N rate was determined by planting treatment or on-farm site using a quadratic model. Data points are from individual plots from site 8.

Figure 4. Economic optimum N rate as affected by GS25 tiller density for winter wheat (blue) and rye (green). For number/ft2, divide number/m2 by 10.8.

Figure 5. Relative yield of topdressing at GS25 versus at GS30 as influenced by tiller density for winter wheat that received no preplant N (dark blue circles) or preplant manure N (light blue diamonds). Data are from the Maine research station trials.

Figure 6. Difference in profits for topdressing at GS25 versus at GS30 as influenced by tiller density for winter wheat that received no preplant N (dark blue circles) or preplant manure N (light blue diamonds). Data are from the Maine research station trials.
- Topdressing at spring greenup (growth stage, GS, 25) increased both spike numbers and grain yield relative to a no-topdress control in the majority of site-years for both winter wheat and winter rye. In instances where GS25 tiller densities were high, topdressing did not necessarily increase tillering but rather increased the number of tillers that developed into reproductive spikes (i.e., reduced tiller loss). Only two trials were conducted with winter spelt and results were inconclusive.
- Counting tillers at spring greenup (GS25) shows promise as a tool to guide N applications for winter wheat and winter rye in our region. In situations when farmers plan to apply a single topdress application, tiller density can indicate whether that application should be made at GS25 or postponed until GS30.
- For winter wheat, our results suggest that current recommendations from southeastern states, which is 70-90 tillers/ft2, may be used to guide the decision of when to topdress. In our trials, yields and ROVCs were optimized by using critical levels of 87 and 84 tillers/ft2, respectively. Preplant manure application did not appear to influence this critical tiller density. Further trials should be conducted to develop a more robust recommendation that includes guidelines for N rates.
- For winter rye, the critical tiller density for deciding whether to topdress at GS25 appears to be lower than for winter wheat, and would be even lower if the price received for rye grain were less than for wheat.
- We did not have enough results from organically managed fields to assess whether the critical tiller density is different for organic versus conventionally managed fields. However, from an economic standpoint we expect it to be different given differences in the prices paid for organic N fertilizer and prices received for organic crops.
- Anecdotally, our results prompted a Maine farmer to test topdressing on an organic winter rye field that had an average tiller density of 452 tillers/m2 (42 tilllers/ft2) in 2017. He topdressed with a pellitized chicken manure product (4% N) at a rate of 2000 lb/acre (approximately 30 lb available N/acre) and increased grain yield by 600 pounds. At $180/ton for the organic fertilizer, he would have needed to receive $0.30/lb for his grain to break even. A cheaper N source, such as Chilean nitrate, could reduce that break-even price to $0.15/lb.
Education
Our educational approach included participatory research that directly engaged cooperating producers, as well as more traditional extension activities designed to reach a broader audience. To develop farmer-based knowledge of in-season N management, each state recruited small grain producers to host on-farm trials. These producers helped design the trials based on their interest and then participated in winter meetings to review research results, discuss implications for using the in-season diagnostics, and determine what further information was needed. Outreach activities that reached a broader audience included on-farm and research station field days; presentations at a variety of grower meetings, crop advisor trainings, and professional meetings; and newsletter articles and research reports.
Milestones
500 producers and crop advisors in New England learn about the project through grower meetings, advisor meetings, websites, and newsletters (fall 2013).
450
50
500
60
October 31, 2013
Completed
March 31, 2014
120 grain producers participate in a survey (online or at meetings) of current fertility practices for winter wheat (fall 2013/winter 2014).
120
43
March 31, 2014
Completed
March 31, 2015
A survey was distributed at the 2014 and 2015 Maine Grain Conferences and online to Vermont grain growers in 2014. Of the 210 farmers (90 in ME; 120 in VT) who received the survey, 43 (20%) responded.
7-10 person advisory teams composed of farmers, millers, bakers, service providers, and project PIs will meet in each state to develop outreach events and discuss research plans, results, and needs (Nov/Dec 2013, 2014, and 2015).
10
6
10
4
November 30, 2015
Completed
April 30, 2015
In Maine, an advisory team comprised of 3 farmers, 1 miller, 1 crop advisor, and 2 project PIs was formed and met on March 27, 2014 and March 24, 2015. In Vermont, the advisory team is comprised of 6 farmers, 3 millers, 2 bakers, 2 service providers, and 1 project PI. This group meets as part of the Northern Grain Growers Association meetings, and discussed this project at their March 2014 and February and November 2015 meetings. In Massachusetts, project PIs met individually with the one participating farmer on March 13, 2014 and April 23, 2015. The Project PIs also communicated with this farmer via email and by phone prior to the meeting. At these meetings, the farmers and PIs reviewed the project and performance targets, planned initial trials, discussed results from the 2014 season, and planned trials for the 2015 based on 2014 results.
3 research station trials (NY, ME, VT) are conducted to evaluate and calibrate in-season nitrogen diagnostic tests and recommendations are developed for growers and service providers (2014 and 2015 growing seasons).
October 31, 2015
Completed
August 31, 2017
Research trials were implemented in the fall of 2013 and completed in July of 2014 at the UMaine Rogers Research Farm, Old Town, Maine; Borderview Research Farm, Alburgh, Vermont, and the Cornell Willsboro Research Farm, Willsboro, New York. At these same sites, repeat trials were established in the fall of 2014 and completed in August of 2015. Winterkill was a major factor in 4 of the 6 site-years, reducing usable plots by 25 to 67%. As well, highly variable growing conditions at the Willsboro and Alburgh sites in both years made it difficult to interpret the resulting data. For the Maine research station sites, data analysis was completed for a reduced number of treatments in 2014 and the full set of treatments in 2015, and results were combined with results from on-farm trials to make recommendations.
At least 9 farmer collaborators implement strip trials of in-season diagnostic testing for winter grains (2014 and 2015 growing seasons).
9
7
October 31, 2015
Completed
August 31, 2015
Completed August 2015. Seven collaborating farmers (3 in ME, 3 in VT, and 1 in MA) implemented a total of 21 trials over two years (8 in winter rye, 7 in winter wheat, 5 in winter spelt and 1 in winter triticale; of which 9 were managed organically). Eight of the 21 trials were either discontinued or not included in this summary due to severe winterkill or uneven plant stands. Results from 6 winter rye, 5 winter wheat, and 2 winter spelt on-farm trials are reported here. Of those, 1 winter wheat and 1 spelt trial were managed organically. In 2017, an eighth grain grower completed an on-farm test of the tiller density test for organic winter rye.
3 farmers host on-farm nitrogen management field days (each summer, 2014, 2015, and 2016).
3
7
August 31, 2016
Completed
August 18, 2016
In 2014, field days were hosted at: the Rogers Research Farm, Old Town, Maine on June 26; Beidler Family Farm, Randolph, Vermont on July 17; Borderview Research Farm, Alburgh, Vermont on July 24; Butterworks Farms, Westfield, Vermont on August 28; Cornell Willsboro Research Farm, Willsboro, New York on July 9
In 2015, field days were hosted at: the Rogers Research Farm, Old Town, Maine on July 16; Rusted Rooster Farm, Parkman, Maine on July 23; Borderview Research Farm, Alburgh, Vermont on June 27 and July 23; Willsboro Research Farm, Willsboro, New York on July 8.
In 2016, field days were hosted at: the UMaine Aroostook Research Farm, Presque Isle, Maine on July 19; Rogers Farmstead, Berlin, Vermont on June 21; Borderview Research Farm, Alburgh, Vermont on June 28; Le Moulin des Cèdres Farm, Les Cedres, Quebec on July 13; Borderview Research Farm, Alburgh, Vermont on July 28; Four Star Farms, Northfield, Massachusetts on August 18.
300 grain producers and agricultural service providers attend on-farm demonstrations, field days, and winter workshops where they increase their knowledge of winter grain nitrogen management and how to use in-season diagnostic testing to improve N-use efficiency, reduce nitrogen loss and increase grain protein (July 2014 – July 2016).
250
50
514
181
July 31, 2016
Completed
February 28, 2017
In 2014, attendance totaled 569 for 6 events held in Maine, Vermont, and New York at which winter grain nitrogen management was discussed. These were: the Maine Grain Conference (83); the Rogers Farm Field Day (44); Vermont’s Annual Grain Growers Conference (125); the Beidler Family Farm Field Day (42); the Borderview Research Farm Annual Field Day (225); the Willsboro Research Farm Field Day (50).
In 2015, attendance totaled 614 for 7 events held in Maine, Vermont, and New York at which winter grain nitrogen management was discussed. Attendees were present from Connecticut, Massachusetts, Maine, New York, Vermont, New Hampshire, and Quebec. These were: the Maine Grain Conference (75); the Rogers Farm Field Day (45); the Rusted Rooster Farm Walk (18); Vermont’s Annual Grain Growers Conference (133); the Borderview Farm Grain Research Tour (42); the Borderview Farm Annual Field Day (236); the Willsboro Research Farm Field Day (65).
In 2016, attendance totaled 484 for 8 events held in Maine, Vermont, Massachusetts, New Brunswick, and Quebec at which winter grain nitrogen management was discussed. These were: 2016 Maine Grain Conference (76); UMaine Aroostook Research Farm Field Day (25); Getting Started with Grains, Rogers Farmstead, Vermont (37); the Borderview Farm Grain Research Tour (39); the Borderview Farm Annual Field Day (185); Hopping and Milling About at Four Star Farms in Massachusetts (53); Organic Wheat Production and Processing in Quebec (24); Atlantic Canadian Organic Regional Network Conference and Trade Show (45).
In 2017, attendance totaled 185 for two presentations given by the PI about winter grain N management and summarizing results from this project. These were: New England Agricultural Service Providers In-Service Training in Portsmouth, NH (60), and the Maine Potato Conference (125).
500 grain producers and agricultural service providers will learn in-season diagnostic testing procedures and results from web resources including videos, factsheets, and a topdress N-rate calculator (Jan 2014 and Aug 2016).
400
100
350
90
August 31, 2016
Completed
November 25, 2017
Two reports, one newsletter article, and one poster presentation were produced, posted online, and distributed that summarize the adaptive nitrogen management approach and results of the 2014 on-farm research trials:
Mallory, E. 2014. Assessing Winter Grain Stands. Maine Grain and Oilseed Newsletter 2(1). Available at: https://extension.umaine.edu/grains-oilseeds
Traclet, L., T. Molloy, E. Cummings, H. Darby, and E. Mallory. 2015. Determining Topdress Nitrogen Needs for Winter Grains: 2014 Maine and Vermont Research Report. University of Maine Extension Research Report.
Darby, H., E. Cummings, S. Monahan, J. Post, and S. Ziegler. 2015. Improving Winter Grain Yields, Quality, and Nitrogen Use Efficiency Using Adaptive Management. University of Vermont Extension Northwest Crops and Soils Report.
Mallory, E. and H. Darby. 2017. Assessing and adapting in-season diagnostic tests to guide winter grain nitrogen topdressing for the Northeast U.S. In Abstracts. ASA-CSSA-SSSA International Annual Meetings, November 22-25, 2017, Tampa, Florida. Poster presentation.
50 farmers will report having implemented in-season diagnostic tests and document changes in nitrogen applications, yields, grain protein levels (for bread wheat), and revenue (by July 2016).
50
15
July 31, 2016
Completed
March 23, 2017
26 farmers who grow winter grains in New England responded to surveys administered at grain conferences held in Maine on March 13, 2017 and in Vermont on March 23, 2017. Of those farmers, 13 (50%) said they had implemented and another 10 (38%) said they intended to implement a new nitrogen fertility practice based on what they had learned from participating in and/or reading the educational events and publications associated with this project. These farmers who said the already adopted a new fertility practice farm a total of 1146 acres, and those who intend to adopt a new fertility practice farm a total of 250 acres. The remaining farmers said they would need more information to make a change. Another two farmers who did not fill out the survey indicated they had adopted in-season assessments to decide when to topdress.
Milestone activities and participation summary
Educational activities:
Participation summary:
Learning Outcomes
Evaluations of farmers conducted during the 2016 summer grain series indicated that approximately 75% of farmers had a better understanding of cereal grain N requirements including rate and timing of applications (n=56). A survey administered at our two winter grain conferences in 2017 verified whether farmers who grow winter grains had either changed or intended to change the following practices, as a result of the educational events and publications we offered over the last 4 years through this project: adopted of new fertility practice, started calculating seeding rate based on a target plant population, and started calibrating their grain drill. 88% of the 26 respondents reported yes, as did two additional farmers who didn’t fill out the survey. We used the adoption of new practices and the intention to adopt as indicators of learning.
Performance Target Outcomes
Target #1
50
adopt in-season diagnostic testing for winter grains production
800 acres
improve nitrogen use efficiency by 30% or more
15
• splitting N applications for winter grains (reducing fall and adding a topdress application)
• using tiller counts to help assess in the spring whether to keep a stand of winter grain, and if yes, whether N topdressing is needed to boost tiller numbers for better yields
• switching from broadcast to drill to get better crop establishment
• calculating seeding rate based on a target plant population
• calibrating their grain drill
• using a lodging-resistant variety when planning to topdress
1846
Rye farmers increased N use efficiency by 25-30% affecting 800 acres; a winter wheat farmer/miller increased revenue by $217 per acre affecting 50 acres per year.
Target #2
Farmers participating in this project gained abundant knowledge in the area of nitrogen (N) management for cereal grain production. Interestingly 82% of farmers surveyed at the 2014 VT field days indicated that they struggle to meet protein standards in their winter grains (n=42). Approximately 50% of these farmers shared that they would like to topdress but were unclear as to how much N would be of benefit to the crop and when was the best time to apply the fertilizer. Evaluations of farmers conducted during the 2016 summer grain series indicated that approximately 75% of farmers had a better understanding of cereal grain N requirements including rate and timing of applications (n=56). Farmers attending a workshop in 2015 learned to calculate N credits from organic sources. This included helping farmers understand the importance of estimating biomass of green manure prior to termination and the implications of weather on N mineralization. 100% of the farmers that answered the survey indicated that they would implement the information they learned. One of the farmers purchased a scale and developed a small sampling system to be able to more accurately predict amount of biomass incorporated into the soil. This farmer has also started to submit green manure samples for N analysis.
26 farmers who grow winter grains responded to surveys administered at winter grain conferences held in Maine on March 13, 2017 and in Vermont on March 23, 2017. Of those farmers, 13 (50%) said they had implemented and another 10 (38%) said they intended to implement a new nitrogen fertility practice based on what they had learned from participating in our educational events and/or reading our publications. The farmers who have adopted a new fertility practice farm a total of 1146 acres of winter grains. Those who intend to adopt a new practice farm an additional 250 acres of winter grains. Two of our cooperating farmers did not fill out the survey, but told us of changes they had made as a result of this project, and so are included in the total number of farmers who made a change.
Two of the collaborating farmers in Maine increased their nitrogen use efficiency for winter rye by 25 to 30% on a total of 800 acres per year. Both growers stopped applying N fertilizer in the fall after seeing no yield benefit in their on-farm trials. Their rye crops follow high N crops (broccoli and potato) so it is likely the 10 lbs N/acre they were applying was lost over the winter due to leaching. Their total N applications are 30-40 lbs/ac, which they now apply all in the spring. Two other cooperating farmers also adopted the adaptive N management approach of split N applications instead of applying all N in the fall. One cooperating winter wheat farmer/miller also adopted the adaptive management approach, reducing fall N applications and using early spring stand assessment to determine spring topdress rates. Increased yield, higher grain protein, and reduced N fertilizer use increased farm revenue by an average $217/acre affecting 50 acres per year.
The spring tiller count test raised farmers’ awareness that their fall planting methods weren’t always achieving adequate plant stands and were limiting their yields. As a result, two of the Maine cooperating farmers adjusted seeding methods and rates for winter rye to improve yields. Of the farmers who filled out the survey, 60% said they had started calculating seeding rates based on a target population and/or started calibrating their grains drills to assure adequate spring plant stands.
Additional Project Outcomes
This project inspired our cooperating farmers who grow winter rye for cover crop seed to explore an additional management practice related to N fertility, variety selection. Aroostook rye is the standard rye variety grown in our region as a cover crop, but it lodges easily. The on-farm trials, which showed that topdressing increased yields but also lodging for Aroostook, prompted the farmers’ interest in other varieties with better standability. As a result, we conducted two winter rye variety trials in Maine to identify varieties that can produce high harvestable yields and also good fall biomass and cover.
One-grain operation that we worked with was highly invested in the project. This farm family attended 85% of all outreach events held in VT during the project period. This farm was extremely committed to improving reliability of grain yield and quality. They were in the process of building a production and mill operation and wanted to implement practices that could help them reduce risk of poor grain crops. It was important to them to build skills and practices to produce the best quality product possible. Prior to changes made in N management and variety selection the farm had winter grain protein concentrations of 8-10% and yields that generally maxed out at 2600 lbs per acre. Their goal was to reliably produce yields of 3000 lbs per acre with protein between 12 and 14%. Old fertility management practices included 90 to 100 lbs per acre N applied in the fall with an additional 50 lbs added at spring green-up (GS25). After attending workshops and speaking with project-PIs fertility management was modified to include 40 lbs of N (as well as other nutrients) applied just prior to planting in the fall. In the spring a quick assessment of plant stand is conducted to determine health of the stand. Stands with high tiller counts (over 70) have an additional 60 lbs of N added in split applications (GS25 and GS30) while low till counts have an additional 90 lbs of N added in split applications. This strategy has helped the farm achieve yields over 3000 lbs per acre in most years as well as protein levels that have ranged from = 11.0 to 12.5% depending on the year. If the farm averages a 400 lb increase in yield as well as a 1% increase in protein the revenue goes up approximately $200 dollars per acre. In addition in most years at least 50 lbs per acre less of N fertilizer are used compared to their old fertility model. This translates into $17 per acre savings. This farm generally grows at least 50 acres of winter wheat per season so total increased revenue would be $10, 850. It is important to remember that the farm is not selling wheat as a commodity and these increases are based on the price the farm is paid from local vendors.
Our project, which promoted an adaptive management approach to N management for winter grains, benefited from an adaptive management approach to the project itself. By engaging a core group of growers in an inquiry-based learning process and integrating flexibility into the structure of the project, we were able to adapt the project to address grower interests and needs as the project progressed. For instance, the focus of the project shifted somewhat based on the relative importance of the particular winter grains being grown. Soon after starting this project, winter wheat acreage declined but winter rye acreage grew. We adapted to this change by increasing our focus on the tiller count test, which has value for winter rye production. As well, we quickly learned through our on-farm trialing that growers needed to address other management issues, such as seeding methods and varieties, to make the most of N management.