Final report for LNE18-363
Project Information
Farmers often apply dairy cow manure in silage corn fields to meet nitrogen (N) needs, but manure contains more Phosphorous (P) than the crop can uptake. Many silage corn fields contain excess P due to accumulation over time. In fields managed this way for many decades, P concentrations may become environmentally concerning. Because P has low mobility in soil, application patterns that vary over many years of applications may result in spatial distribution of P that is difficult to capture using standard soil sampling strategies. We designed this experiment to better understand the temporal and spatial variability of N and P across typical silage corn fields in New England to devise soil sampling strategies to collect more representative soil samples in those fields.
We asked farmers in Connecticut, Massachusetts, and Maine to volunteer at least 2 silage corn fields for research. It was suggested that farmers volunteer a field receiving more manure than average and a field that received less manure than average. Soil nutrients (mostly N and P) were expected to be different in these fields because of manure application patterns. We used soil samples and aerial images to provide farmers with enough data to convince them to apply nutrients more optimally across silage corn fields. Aerial images with dark green corn contrasted with aerial images of yellow corn would likely provide farmers a new perspective on nutrient deficient corn and why it may be worth redirecting nutrients away from fields receiving excess nutrients and into fields with nutrient deficiency. We selected 9 of the 64 fields in the study for a detailed spatial analysis that included 0.5 acre grid sampling across the entire field. This sampling design was used to inform about spatial variability of soil nutrients.
From 2018-2021 we interacted with farmers in their fields and gathered farmers at winter workshops where we discussed results from the previous growing season. Farmers were encouraged to interact with each other to discuss management practices, share stories about notable events during a season, and recommend things to do in the upcoming year. The expected outcome was that farmers would learn from the research and their farmer cohort in ways that encouraged them to adopt conservation practices that would reduce N and P excess in their silage corn fields while improving compliance with nutrient management plans.
Data from the experiment revealed that most silage corn fields in New England have excess N in fall but most fields (>90%) are below the threshold of environmentally hazardous concentrations of nitrate. Soil nitrate concentrations fluctuated annually due to seasonal precipitation and farmers may be better able to respond to weather with soil tests and aerial images that inform about how their corn is performing. Management of P is less dynamic from year to year, but still requires effort because of lasting imprints of previous manure P applications and spatial variability associated with differences in seasonal manure application patterns. To more accurately sample P, farmers should be aware of historical patterns of manure P and use that knowledge to collect soil samples for P that are more representative of a field. With knowledge of the minimum separation distance needed between samples and spatial awareness of past manure applications, farmers can design nutrient management plans that optimize distribution of manure P across all silage corn fields. Not all farmers were convinced to make significant changes to their management during the study, but farmers left the project more informed about possible solutions to the P problem.
27 dairy farmers improve nitrogen management on 1,500 acres of corn (100 fields) by increasing yield, reducing fertilizer rate, or reducing nitrogen losses from planting cover crops by September 15, resulting in a total annual savings of $54,000.
Many dairy farms store cow manure in a centralized area, and must then transport manure long distances in order to spread it among fields at sustainable rates. Transporting manure is resource intensive and economically prohibitive so farmers apply as much manure as possible to fields closer to major operations in order to reduce costs. If moisture conditions are unfavorable in some areas, more manure might be spread in dry areas compared to wet areas, creating an uneven distribution of nutrients within and among fields. When sampling soils for fertility recommendations, this uneven distribution of nutrients may not be apparent in measurements and testing, which results in misleading fertility recommendations for corn fields where manure is applied.
To help dairy farmers in Connecticut, Massachusetts, and Maine improve nutrient management on corn fields, we collected soil from multiple fields in those states and presented results to participating farmers. We measured standard nutrients, fall nitrate, CO2 burst, and Solvita labile amino N. We also captured aerial images of fields in mid summer during the peak of vegetative growth for silage corn. A 9 field subset from the group was selected for extensive sampling for spatial variability of nutrients. Each field in the subset was partitioned into 0.5 acre (150 x 150 ft) grids and sampled along the grid pattern. After each season of soil collection, we conducted workshops with farmers to have direct discussions about the implications of our results and encourage farmers to optimize nutrient management in their silage corn fields.
Cooperators
- (Educator)
- (Educator and Researcher)
- (Educator)
- (Researcher)
- (Educator and Researcher)
- (Researcher)
Research
1. Soil chemical and biological test results from manured corn fields differ between wet and dry areas in the fields.
2. Current soil sampling protocols do not adequately describe the variability of soil nutrients in manured corn fields.
3. Revised soil sampling protocols for manured corn fields will indicate a minimum distance between soil samples that would provide independent chemical and biological test results.
4. Sampling of partitioned manured cornfields based on drainage and revised soil sampling protocols will result in less variable soil test results and more accurate fertilizer recommendations.
Farmer recruitment
Farmer recruitment was a coordinated effort between extension at University of Connecticut, University of Massachusetts, and University of Maine. Extension programs in each state contacted farmers that previously participated in extension activity and seemed like reliable participants for this research. Farmers and agricultural consultants were all recruited in fall 2018. In order to participate in the project, farmers were asked to allow us to survey 2-3 of their silage corn fields receiving dairy cow manure.
Experimental design
Project 1: N and P concentrations across multiple years (education portion)
Silage corn fields throughout Connecticut, Massachusetts, and Maine were selected for the research based on existing soil nutrient concentrations and management history with dairy cow manure applications. We specifically requested from farmers, one field that typically receives less dairy cow manure than average and another field that receives more dairy cow manure than average. In any given year from 2018-2020, there were between 60-65 fields involved in the research.
Project 2: Spatial variability of nutrients in silage corn fields receiving dairy cow manure
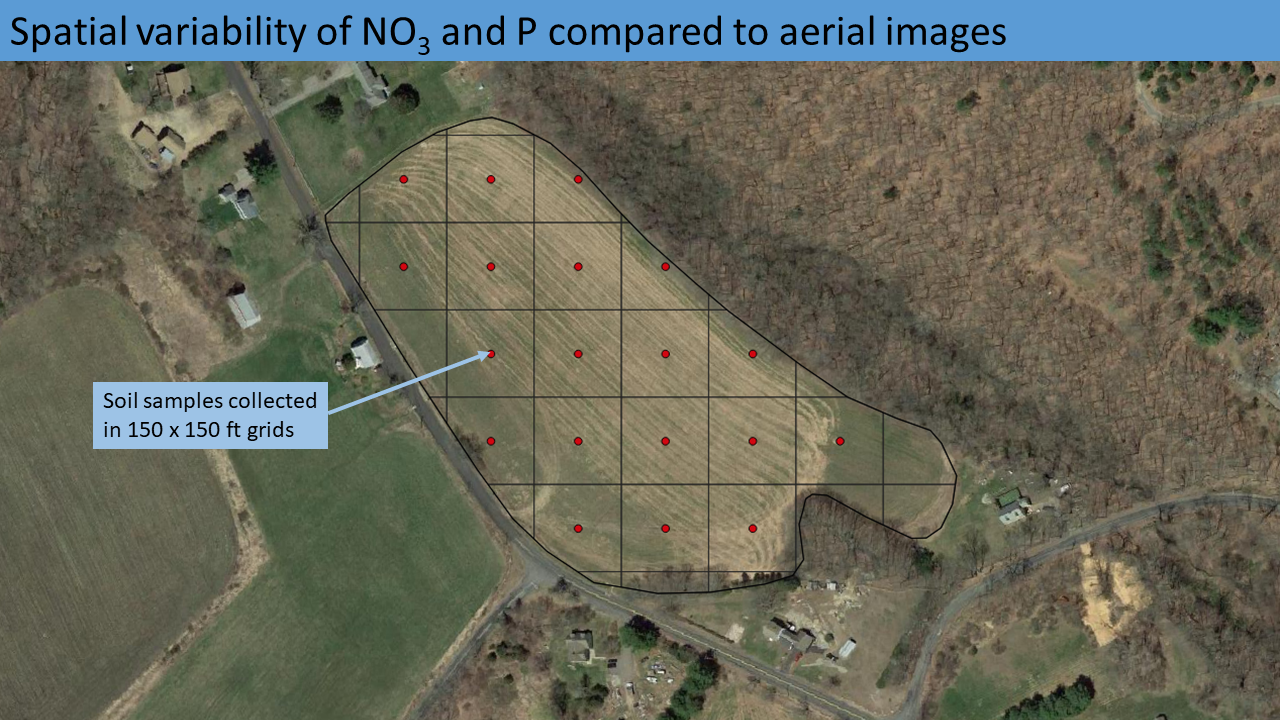
Among fields volunteered for the project, we selected nine fields for a detailed analysis of the spatial distribution of nutrients. Fields were selected to fulfill a diverse range of sizes, nutrient concentrations, and conservation practices. In these fields, we sampled in grid patterns with a grid-cell size of 150 x 150 ft, which is approximately 0.5 acre. The number of grid cells varied based on the size of the field. We then used farmer recommendations to select two grid cells in each field that have been managed differently in the past based on the amount of manure applied. Within the selected grid cells we conducted intensive sampling in transects through the center lines going North-South and West-East through the grid.
Soil Sampling and analysis
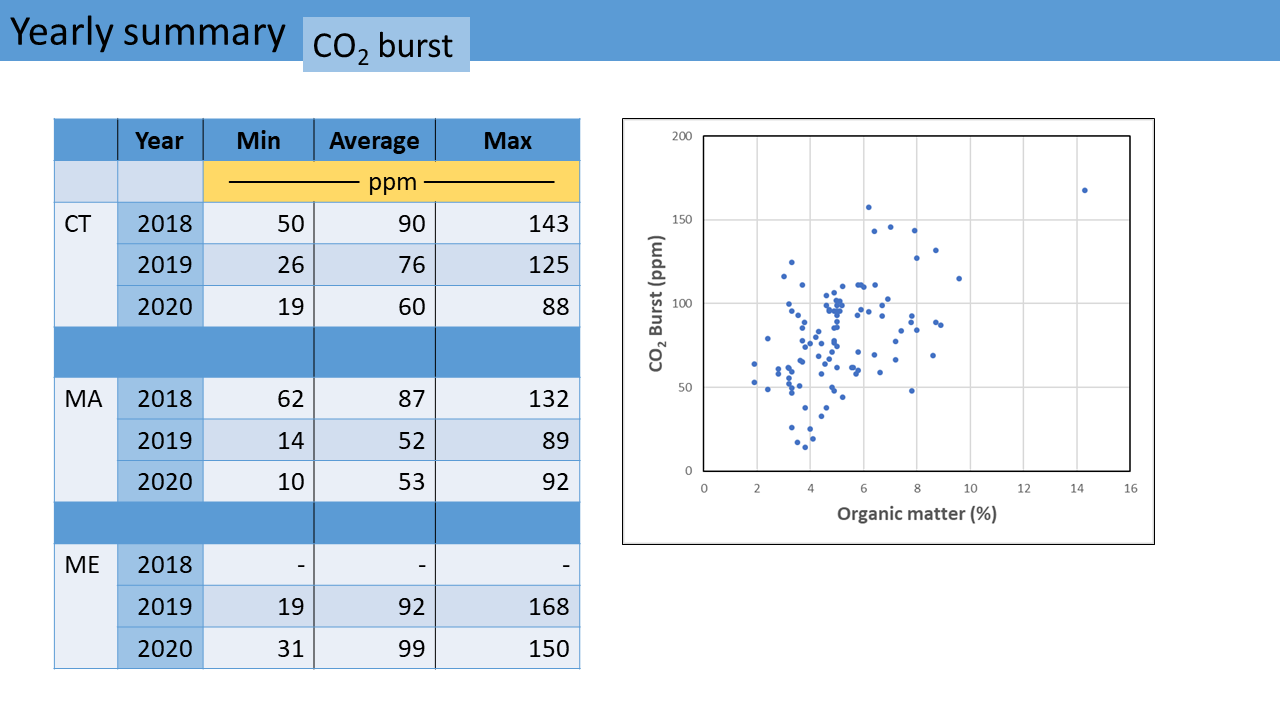
We collected soil samples in fall of each year after corn was harvested. Soil samples were collected using a 2-inch diameter auger to a depth of 6 inches. All soils were air-dried and sieved through a 2-mm mesh. Soil nutrients were measured in two ways, after extraction with the Modified Morgan procedure, and after extraction with the Mehlich 3 procedure. Soil nitrate was measured independently. In addition to nutrient measurements, we measured Carbon (C), N, organic matter, and used two biological tests referred to as the CO2 burst and Solvita® labile amino N.
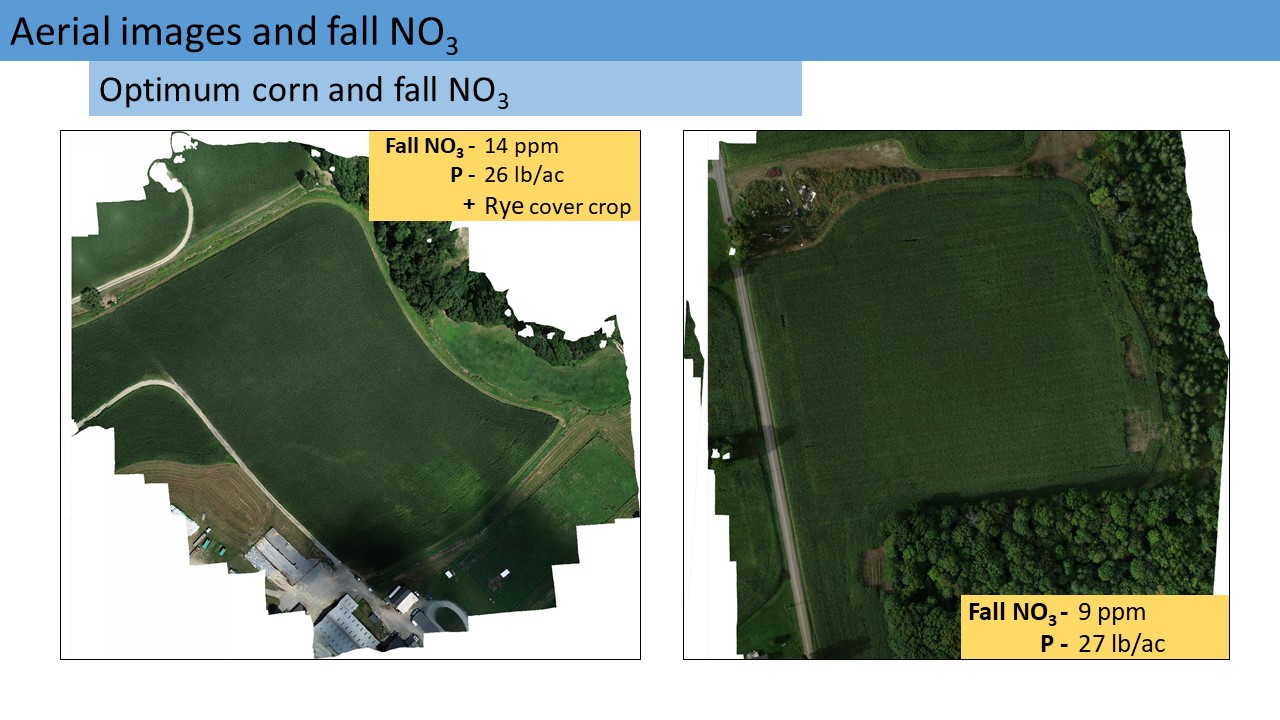
Aerial images
Aerial images of fields were collected when silage corn was at peak stages of the transition from vegetative growth to reproductive growth. Most images were collected in either August or early September of the year. Images were captured using an automated drone flying 400 ft above ground. The images were composited and shared with farmers for reference.
Workshops
Workshops were conducted in winter 2019, 2020, and planned for a virtual workshop in winter 2021. During the workshops we start off by asking farmers to complete a survey about their field activities for the previous corn season. Their surveys are then used to explain observations from soil sample data and aerial images. During workshops farmers interacted with researchers, educators, and each other in conversations attempting to convince farmers to manage nutrients from dairy cow manure more efficiently among their fields. If farmers decided to make changes to management of the fields, we would consult with them and effects from the changes would likely be captured in soil samples and aerial imagery the next year.
Project 1: N and P concentrations across multiple years (education portion)
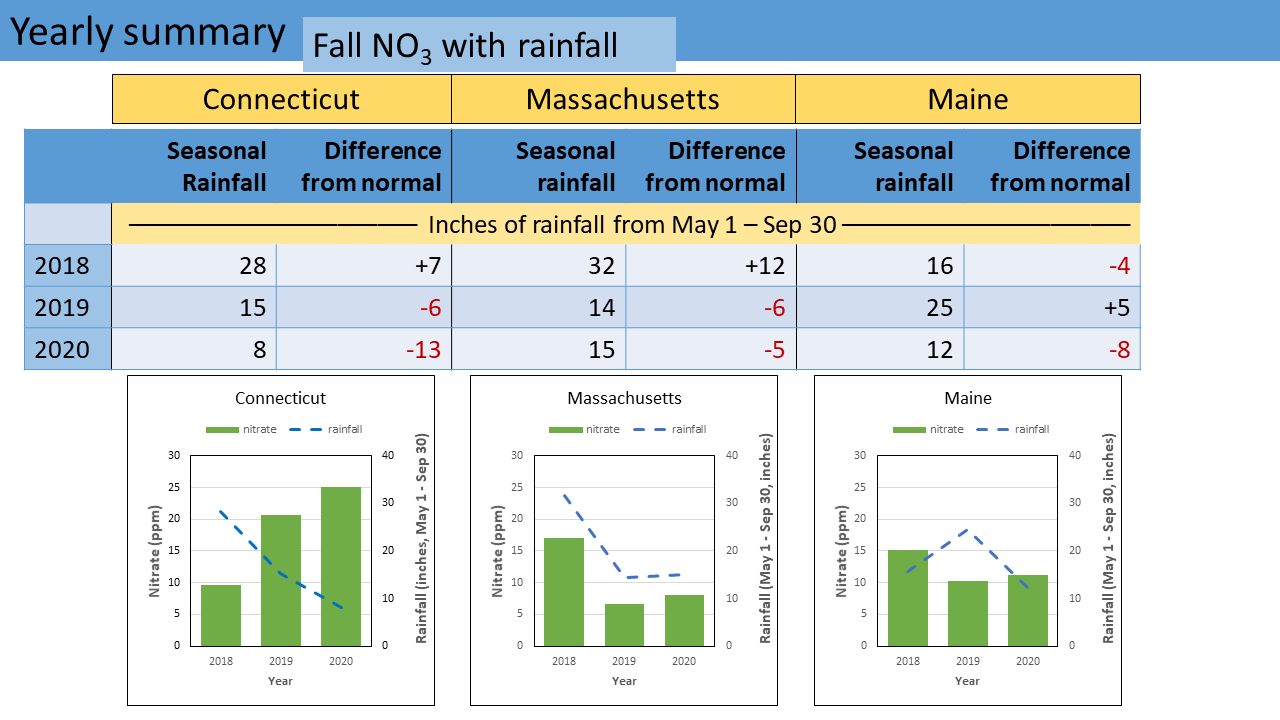
Our data showed clear trends between available soil nitrate and rainfall during the growing season. In Connecticut and Maine, when rainfall was greater, less nitrate was available in soil and when rainfall was less, there was more nitrate available in soil. We did not observe this trend in Massachusetts, which had more rain and more soil nitrate in 2018. It is unclear why this occurred. We had initially used the Adapt-N model to track nitrate throughout the growing season, but the program was not as well received by farmers as conventional soil sampling data. The fall soil nitrate results provide farmers with clear numbers showing them how they should be managing nitrate to respond to weather each year and should influence farmers to take more steps to actively manage N with more confidence.
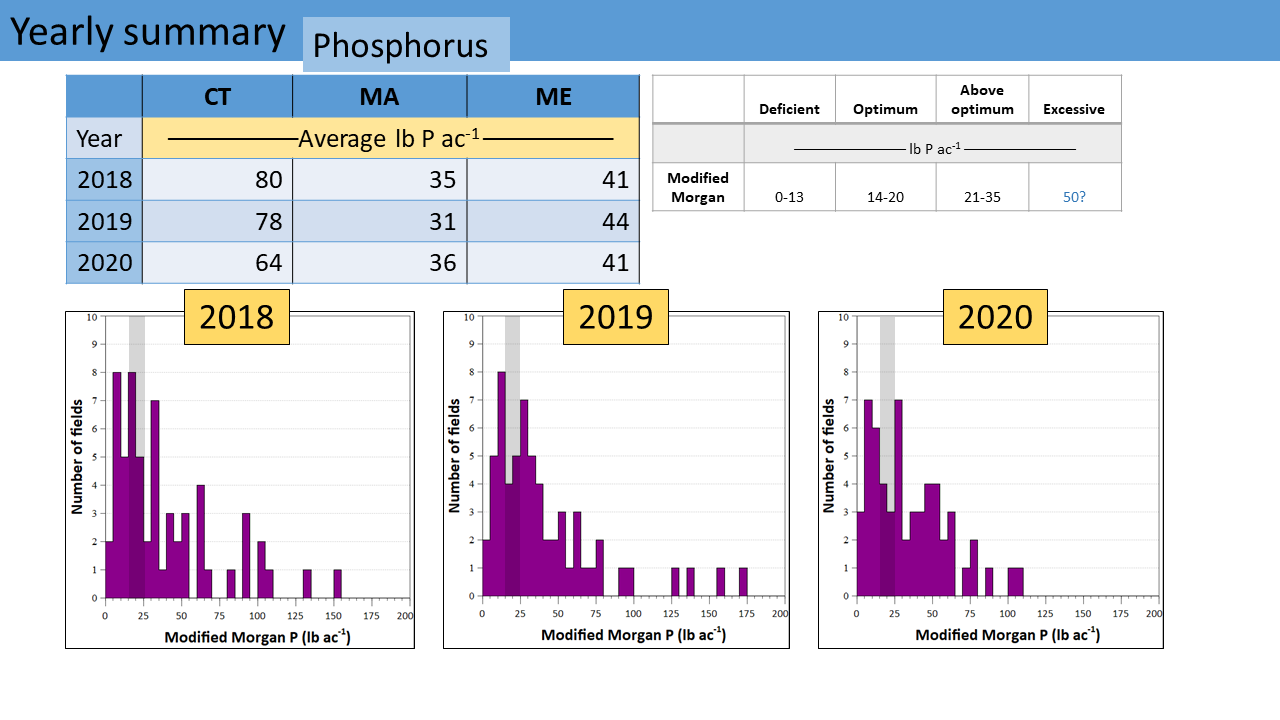
Soil P was also a large issue among silage corn fields. Optimum P for silage corn growth is between 14-20 lb P ac-1 based on Modified Morgan extraction. In our study, over 70% of fields are above that optimum range and have more P than needed. We suspect this is because farmers generally apply manure to match crop N needs, and as a result, they apply more P than corn uptakes. Based on our data, P will be a significant concern in the future if farms do not distribute P more optimally across their fields.
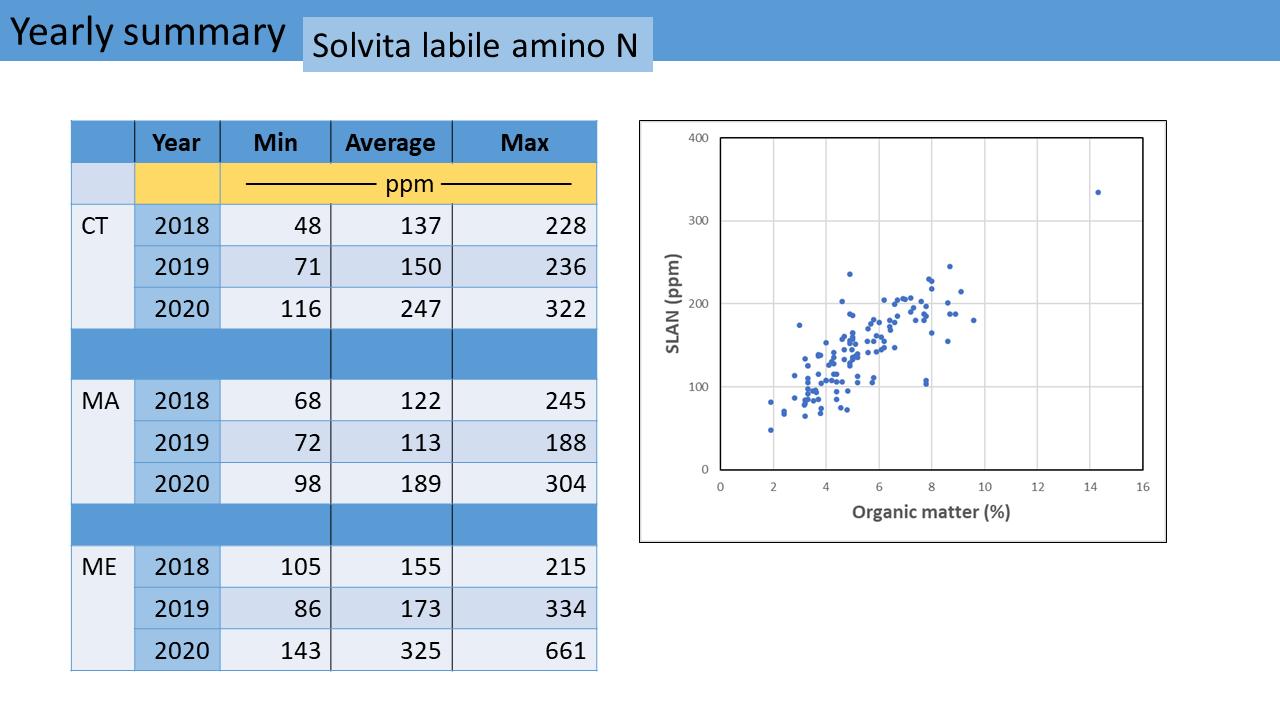
Biological tests were used to better understand the “activity” of organic matter in silage corn fields. Dairy farms add lots of organic matter to silage corn fields in the form of dairy cow manure, and inside that manure is stored nutrients that could be mineralized into available nutrients for corn. Our use of SLAN implies that more N is mineralized when there is more organic matter present. The CO2 burst test shows how easily mineralized some organic matter is. When painting the full picture, this data shows that organic matter comes in different forms. When farmers increase labile C in their fields by using cover crops or no-till agriculture, the organic matter is easier to convert to plant-available nutrients.
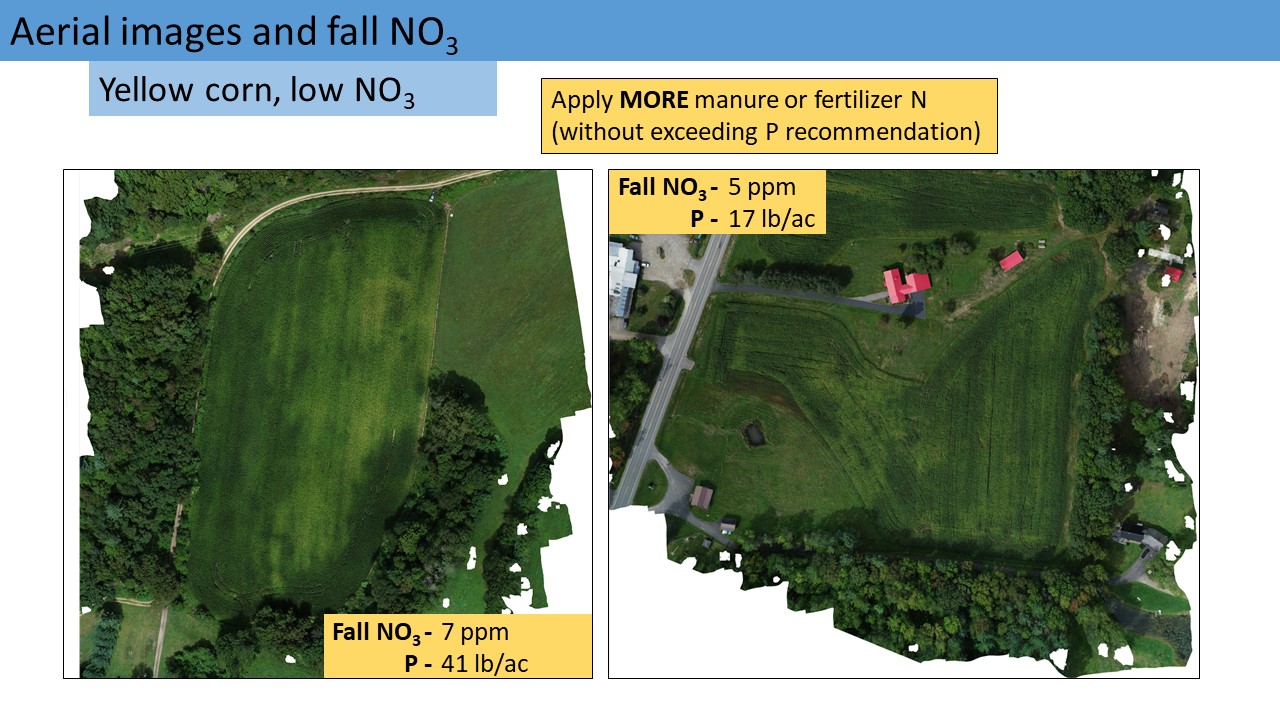
We compiled aerial images into a presentation to show farmers during workshops. We had back and forth discussions with farmers about ideal situations for managing manure and being able to use nutrients more efficiently. The images showed aerial perspective of healthy corn and N deficient corn. Giving farmers this perspective informed them of inefficient management practices that they could probably afford to improve upon and might also encourage farmers to embrace new practices in their fields. During some meetings, farmers that implemented conservation management practices in their fields like no-till and cover cropping spoke with other farmers about the benefits and detriments of conservation management. Getting farmers to discuss these practices more openly was a nice bonus to our workshops and may help gain support for more workshops in the future.
Project 2: Spatial variability of nutrients in silage corn fields receiving dairy cow manure (research portion)
Grids established in silage corn fields to measure spatial variability were successful in all fields with slight adjustment. Some fields were shaped in ways that made the grid process difficult, and in those fields the grid was adjusted to accommodate a 0.5 acre centroid within available space. In most fields, we were able to create approximately 20 centroids, which matched our goal due to silage corn fields in New England having an average size around 10 acres (10 acres with 0.5 acre grid spacing = 20 centroids per field).
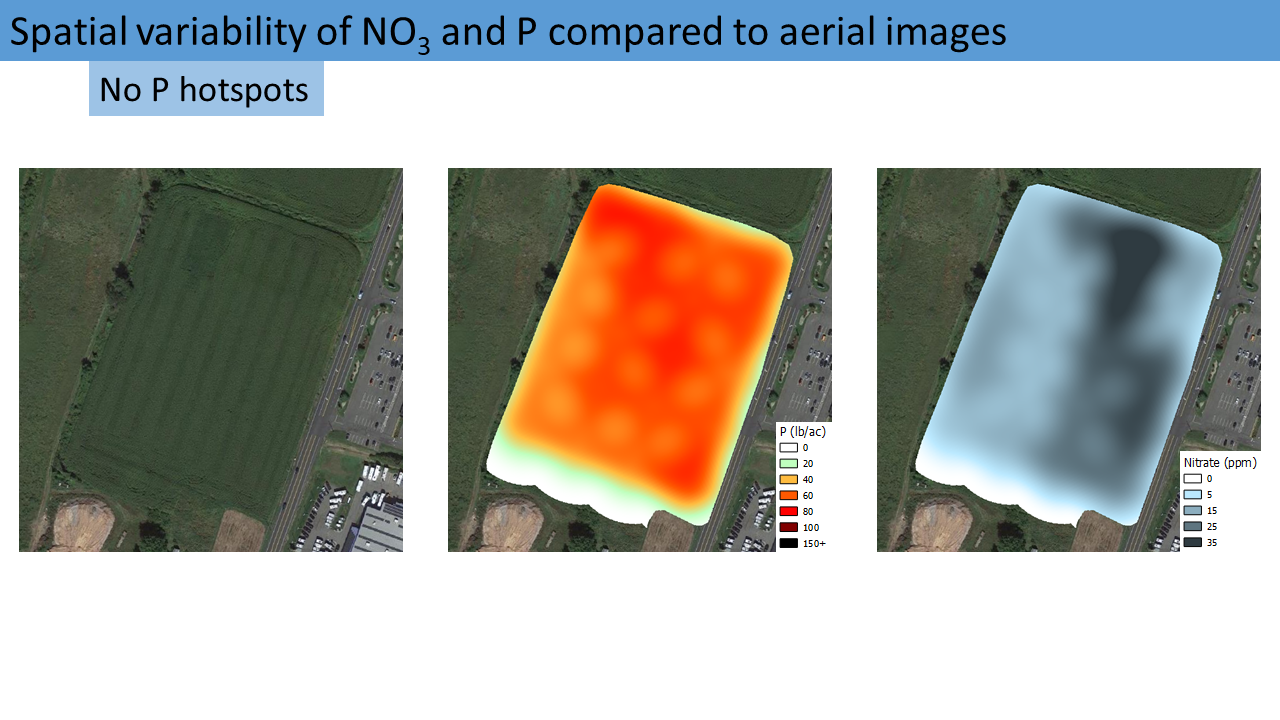
Because many silage corn fields in New England have received dairy cow manure for many decades if not more than a century, we expected P concentrations to follow patterns associated with where manure has been applied over time. In fields where farmers stack manure in a specific spot each year, we expected to observe P hotspots. In fields where farmers applied more manure in certain areas due to either topography or soil moisture, we expected to see more P in areas where the field is drier and less manure in areas where the field has more moisture throughout the year. Soil nitrate is more dynamic in how it moves through the environment, but may still be closely associated with P hotspots.
Across the 9 fields, there were different patterns in P concentration. Some fields showed evidence of hotspots and a history of uneven manure application rates, but others showed either even distribution of P or variability without a specific pattern. The next step for the study, which will be conducted later, is a statistical analysis to calculate the minimum distance needed to collect P soil samples that are independent of each other. Because these silage corn fields did not have a consistent P patterns, the minimum distance may vary depending on history of manure applications, but we are confident that the distance can be captured within the 150 ft grid spacing used in this study.
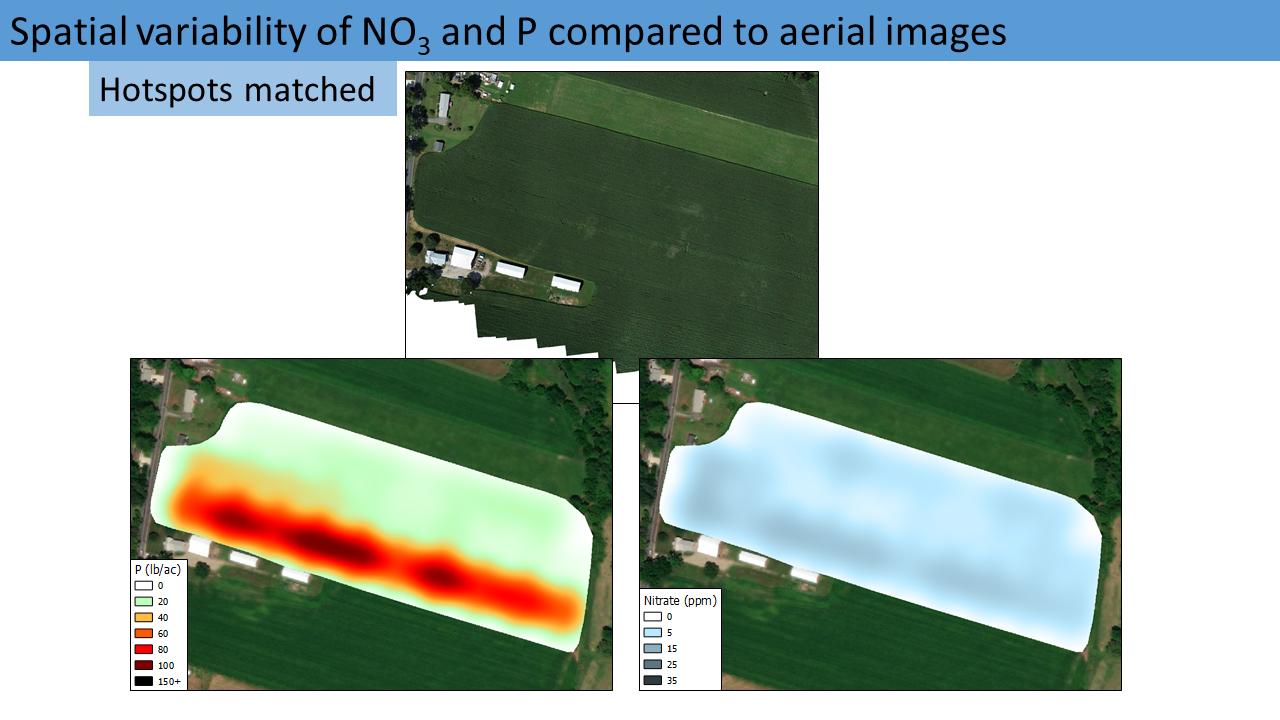
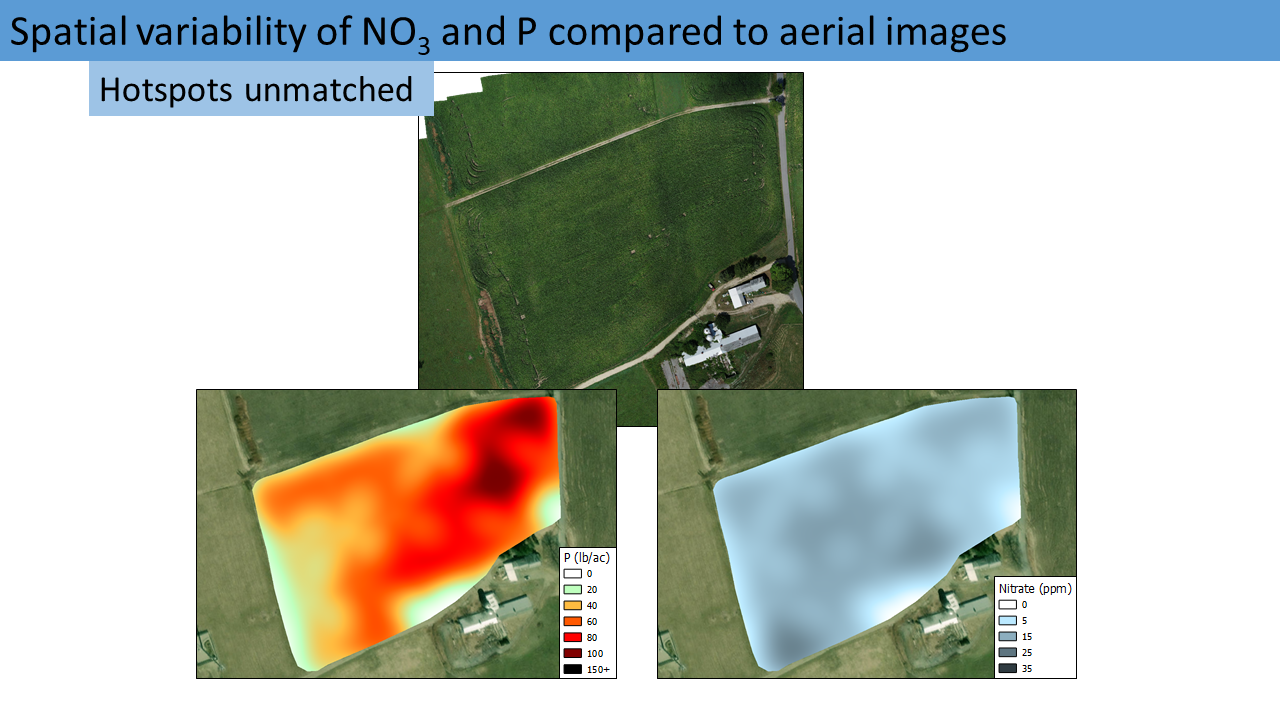
Patterns of nitrate in the field also tended to vary. In some fields a hotspot of nitrate was associated with a P hotspot, but the two nutrients were not always connected. Patterns of soil nitrate are more dynamic than P from year to year, and predictions of nitrate variability may need more information such as seasonal weather and recent N application pattern.
This project validated many of our assumptions about silage corn fields receiving dairy cow manure. Soil N and P accumulate in silage corn fields from manure applications, but P has a longer lasting impact while N impacts vary depending on other environmental factors like precipitation. In years where rainfall was more abundant, there was generally less nitrate available in soil due to leaching, and when there was less rainfall, more nitrate was generally observed in soil. Most fields contained optimum levels of nitrate for the growing season, but may have excess nitrate in fall. Combining aerial images during the growing season and soil nitrate will likely help farmers reduce excess nitrate in their fields. In contrast to soil nitrate, soil P did not change much over the three years. Spatial variability data from this experiment shows that farmers should be mindful of P patterns in their fields so they can collect more representative soil samples and more optimally distribute manure P in the future. With many silage corn fields above the optimum P concentration for silage corn growth, soil P is a looming problem for many fields in New England.
Objective 1: Results from 0.5 acre grid samples revealed that P in some fields is distributed based on wet and dry areas of the field, which means that these areas likely became different over time because of farmers applying more manure and stacking manure in dry areas of fields.
Objective 2: Most soil sampling protocols recommend walking across a field in a zig-zag pattern and collecting random samples along the way. Our spatial variability maps show that this tactic is not an accurate representation of P concentration in corn fields where manure has been unevenly spread in the past.
Objective 3: More statistical analysis is needed to prove our assumption, but based on preliminary observations of data, we are confident that the minimum distance between soil samples can be estimated using our 0.5 acre grid samples. Because we did not see consistent variability between our 9 fields, we may need to consider different minimum distances.
Objective 4: A supplemental analysis of our data revealed that the average of soil tests from partitioned fields was similar to the average of randomly sampled fields approximately 50% of the time. The accuracy of fertilizer recommendations will likely be a result of whether a farmer has enough time and resources to partition their field. The effort may be worth it in corn fields with high P concentrations in known areas of the field.
Education
Our educational approach included regular visits to farmers during the growing season and workshops with large farmer groups during winter.
In winter 2019 we conducted 3 separate workshops in the 3 states involved in the project. Workshops were lead by the dairy farm externsion expert in each state. Workshops involved a general presentation to all farmers where we showed aerial images and data from soils collected the previous fall. The general presentation was followed by group discussions about management practices farmers were concerned about. Slides from one of these presentations can be found here: https://projects.sare.org/media/pdf/m/a/i/maine-cca-2021.pdf
In winter 2020, we conducted workshops similar to those in 2019, expect in this year we were able to engage with farmers more because of the aerial photographs of their fields that had been captured the previous summer. During this workshop, we educated farmers about how the aerial images related to management practices recorded for their fields. Farmers also talked to each other about how conservation management practices had affected their efficiency in the past. Slides from these presentations are found here: https://projects.sare.org/information-product/phosphorus-spatial-variability-in-silage-corn-fields-receiving-dairy-manure/
In winter 2021, the Covid-19 pandemic was still occurring and we did not conduct workshops. Instead we met individually with or called many of the farmers to share results with them.
Milestones
Farmers and Service Providers were recruited in each state by email, phone or in person using existing contacts from previous collaborations and by contacts made at certified crop advisor (CCA) meetings. One service provider and 12 farmers from each state agreed to work with project. 9 of the farms agreed to intensive sampling of one corn field.
36
3
32
3
September 01, 2018
Completed
November 30, 2018
Progress on this and other milestones was delayed because of heavy rainfall throughout the months of September and October 2018. More than 10 inches (254 mm) of rain was recorded in September, which is more than twice the historical average of rainfall for the month.
Despite delays, 32 farms (64 fields) across the three states agreed to participate in this research. Soil samples from farm fields were collected by the end of November 2018 and are currently being analyzed using standard nutrient analysis and biological assessments using Solvita® CO2 Burst and labile amino nitrogen.
36 farmers, 12 each state, and 3 service providers, 1 each state, attended a half-day, first-year workshop in each state (2 identical workshops in each state each winter to reduce travel by farmers) to learn protocols/use of tools: aerial images, Adapt N, fall soil nitrate concentrations, the SLAN soil biological test and other soil biology tests, soil sampling procedures, and effect of planting date on recovery of residual nitrate by cover crops.
32
3
20
3
January 31, 2019
Completed
March 14, 2019
During Winter 2019 one workshop was conducted in Maine on February 20, one workshop in Massachusetts on March 11, and workshops in Connecticut on March 13 and March 14. 20 of the 32 farmers involved attended workshops. We informed farmers about results for their soils that were sampled in Fall 2018. Farmers attending meetings had already volunteered fields they believed were low in P and fields they believed were high in P. We presented information about standard nutrient tests with a focus on N and P, and we also included information about CO2 respiration and N mineralization to incorporate biological components of soil nutrient management.
We presented farmers with information about potential future nutrient management challenges for dairy farms in New England and juxtaposed that with current nutrient results for their fields. Farmers asked for comments about their existing management practices and wondered how likely existing practices would be able to sustain without causing concern. After the presentation and discussion we asked farmers to consider volunteering fields for intensive sampling study, and we were able to obtain enough fields for that part of the research. As of November 2019, 9 corn silage fields managed by dairy farms (5 in Connecticut and 4 in Massachusetts) were intensively sampled to analyze nutrient variability and the samples are being processed in the UConn soil nutrient analysis laboratory.
Farmers were informed about plans for winter 2020 meetings at the end of the winter 2019 meeting.
30 Farmers create a learning plan for themselves and a nitrogen management plan for the 4 fields they enroll in the program in the winter meetings. January 2019.
30
11
January 31, 2019
Completed
May 30, 2020
This part of the research proved to be too ambitious as most farmers make decisions based on the amount of time and money they have in the moment. We coordinated with some farmers during spring and summer 2019 to assist in their N management decisions using the Adapt-N software, but in most cases farmers ultimately decided to either follow their previous plans or use a hired consultant to manage nutrients throughout their fields. Farmers also preferred to move manure from their pits when and where it is convenient for them rather than waiting for software to inform them of that decision. We were not successful at convincing farmers to follow specific plans for these four fields during the 2019 corn season, but data presented at successive workshops at least made farmers more aware of how certain management practices could be improved to be more efficient.
In 2020, many farmers adjusted farm management practices to account for losses in revenue and resources during the covid-19 pandemic. Although the change in management planning was not intentional, data from 2020 gave us a chance to show farmers data from their fields in years when they allocate resources more efficiently (or with more frugality).
Farmers will inform about the growth stage of their corn so that aerial images of corn during mature vegetative growth can be captured. This will provide farmers with new perspective of their corn fields so that they better understand the effect of nutrient concentrations and distributions across the field.
30
32
3
July 15, 2020
Completed
September 30, 2020
We collected aerial photos in summer 2019 and summer 2020 with assistance from farmers who informed us about the status of their corn. Photos from 2019 were shared with farmers during Winter 2020 workshops and photos captured in 2020 were shared with farmers during casual visits in 2021 (due to covid-19 pandemic, we did not conduct a group workshop). During workshops and visits farmers expressed interest in seeing the photos and wanting to know more about how their soil analyses compared to the photos.
33 farmers/3 service providers meet in winter in each state in second year to review concepts and discuss results of objective tests from their individual fields, from their state, and aggregate results from the three states in first year. Based on the new knowledge the farmers learn from this meeting, learning plans and nitrogen management plans are updated by farmers in consultation with project team. January 2020.
33
3
32
3
August 31, 2020
Completed
February 14, 2020
Farmer meetings were completed in February 2020. We discussed aerial images with farmers as well as different nutrient deficiency or nutrient excess issues that fields in the project seemed to have. Agricultural consultants were present at meetings and we advocated for consultants to adopt more top-down strategies for nutrient management whenever possible. Many farmers had not yet seen aerial images of their corn fields, and were open to making changes to manure management. Some farmers made changes in 2020, but their changes were more because of a challenging business year due to covid-19 restrictions. Overall, the year of difficult management challenges was tough to parse because of a mixture of external factors unrelated to the project.
5 farmers make changes to their nitrogen management; 3 farmers plant cover crops by September 15 to ensure good recovery of residual nitrate. April to September 2019.
5
7
1
September 30, 2020
Completed
February 14, 2020
After showing farmers 2 years of soil data and 1 summer of aerial images, there were trends to show that nitrate was in excess in some fields and deficient in some fields. We had 7 farmers across the 3 states agree to shift their manure rates to place more manure in areas where P is at lower concentrations. We complemented nitrate data with P data to show farmers whether their fields had enough residual nutrients after many years of dairy manure applications.
3 of the farmers followed through with their planned changes and were satisfied with results. Other farmers modified their plans due to management and financial restrictions encountered during the covid-19 pandemic. Overall we still convinced farmers that changes in manure management should and could be made with resources already available to them.
30 farmers/3 service providers meet in winter in each state in third year to review concepts and discuss results of objective tests of the nitrogen status of their individual fields, results from their state, and aggregate results from the three states in first and second year. Based on the new knowledge the farmers learn from this meeting, learning plans and nitrogen management plans are updated by farmers in consultation with project team. January 2021.
30
3
16
1
January 31, 2021
Completed
February 26, 2021
Due to the covid-19 pandemic, we were unable to schedule in-person meetings with farmers for winter 2021. Our universities were not allowing in-person meetings. Many of the dairy farmers in our project do not have access to a sufficiency fast Internet connection, so we called 16 farmers and discussed their soil testing data and aerial images of their fields. We also discussed the implications of their results and what practices could be changed to improve nitrogen management on their farms.
30 Farmers review their nitrogen management plan with the project leader in their state either through phone calls or email. March 2021.
30
3
11
March 31, 2021
Completed
March 31, 2021
Farmers did not develop N management plans specific for the project, but many agreed to reduce or increase manure application by an unspecified amount to 1 of their 2 fields based on aerial images collected during the 2019 corn season. We have kept regular communication with farmers in each state about nutrient inputs to their fields through yearly surveys and checking in before and after the corn season.
This milestone was combined with the previous milestone because with confusion caused by Covid and delays in obtaining soil test results due to Covid, our winter meetings were completed by telephone in March of 2021. We discussed both the farmers' soil test results and possible management changes on the same phone call.
An additional 15 farmers make changes to their nitrogen management and 5 plant cover crops by September 15. April to September 2020.
15
9
September 30, 2020
Completed
September 30, 2020
Nine farmers made changes to their nitrogen management, but none of the farmers agreed to plant cover crops. Although some of the farmers already plant cereal rye on their corn fields in the fall.
12 Certified Crop Consultants from New England learn about objective tests and the results of the project at the annual CCA meeting in New Hampshire in late January 2021.
12
120
January 31, 2021
Completed
January 28, 2021
We presented our results of our 2018-2020 soil analysis and imagery compilations during the 2021 Maine In-service training for agricultural service providers, which was a virtual event in 2021. There were 40 certified crop consultants in attendance. We have also presented the data to an audience of 80 certified crop consultants who attended the 2020 New York certified crop advisor training, which was a virtual event in December 2020.
Milestone activities and participation summary
Educational activities:
Participation summary:
Learning Outcomes
Our meetings with farmers went very well because we had soil analyses and aerial images. The aerial images were very convincing physical evidence of certain management patterns that farmers preferred to avoid. During our sessions with observed nutrient deficient corn fields, nutrient excessive corn fields, and some that were between then two. With this evidence and testimony from other farmers, we convinced other farmers that it would be worth exploring their options for cover crops and no-till farming.
There was one agricultural service provider present who had not explored adding cover cropping as a service, but we believe that this service provider will open his business up to adding cover cropping as a nutrient management service in the future.
Performance Target Outcomes
Target #1
27
increasing yield, reducing fertilizer rate, or reducing nitrogen losses from planting cover crops by September 15,
1,500 acres of corn (100 fields)
total annual savings of $54,000
9
Increases and decreases in manure and fertilizer nitrogen rates on corn fields
563 acres
The measurable benefit was $17,906.
We surveyed farmers either by phone or in-person to obtain outcomes from our educational efforts. We contacted 24 farmers and three farms went out-of-business in the third year of this project. That makes a total of 27 farms contacted or were out of business of the 32 farms that participated in the project. A majority of the farmers surveyed, 15 of the 24 farmers or 62%, made no change to their nitrogen fertilizer or manure management. The main reason given by the farmers for not changing their nitrogen or manure management was that the soil test nitrate values in the fall provided by the project indicated that no change was needed.
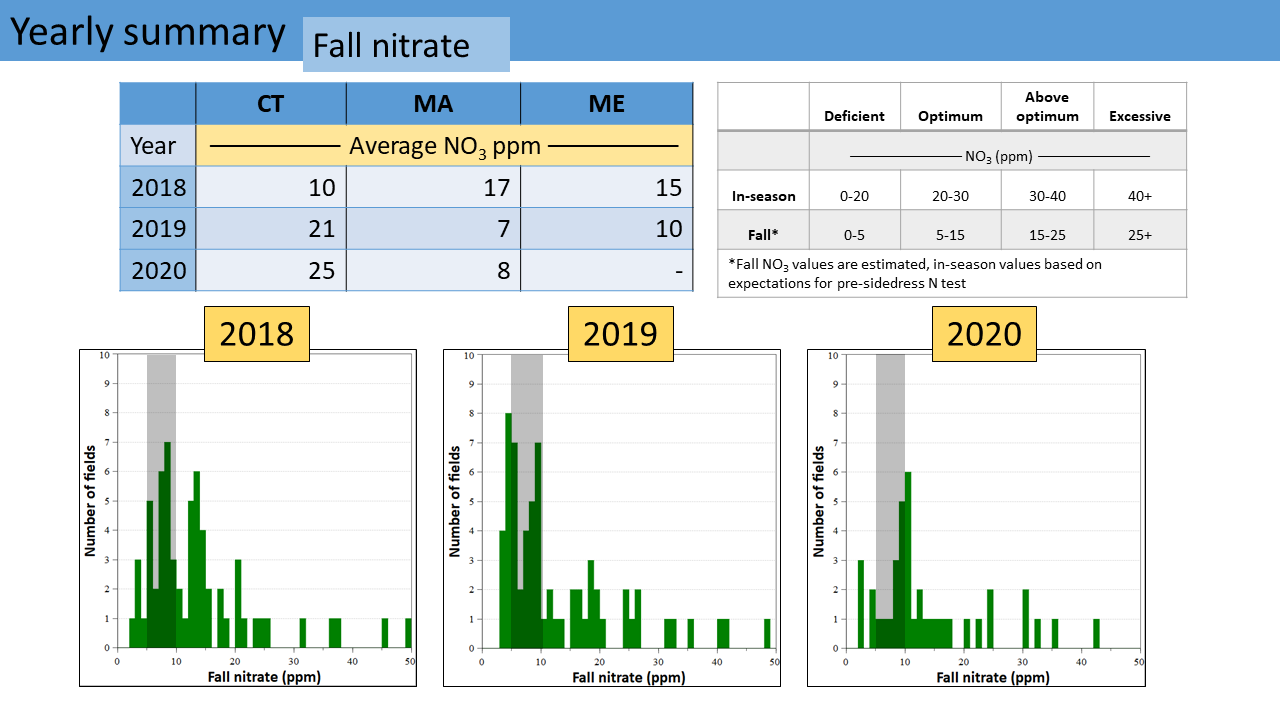
The soil nitrate results from soil samples collected in the fall across three years on these 64 fields showed that only a small minority of the fields tested in the excessive category. The percentage of fields testing in the excessive category (>25 ppm nitrate-N) was: In 2018, 9%; in 2019, 14%; and in 2020 16%. This was a surprising result because the perception is that farmers routinely apply rates of nitrogen that are excessive. The number of fields that tested in the below optimum category was also low with only 14% of the fields over the three years of the project testing below 5 ppm nitrate-N. Therefore, an overwhelming majority of the fields, 73% on average, had soil nitrate concentrations in the fall in the optimum or above optimum categories. These results indicate that farmers have learned over the years how to manage their nitrogen applications so that their rates are neither too high nor too low.
One farmer during the final interview about outcomes for the project described his process of refining his nitrogen management over the past 20 years this way (we paraphrase his story here): I used the pre-sidedress soil nitrate test (PSNT) and cut way back on my nitrogen. But I started seeing yellow corn in too many fields, so I increased the rate to less than in the past but higher than recommended by the PSNT. Then I used the stalk nitrate test that showed I was still applying too much nitrogen so I cut back a small amount. Now I am happy with my rate and my yields, the stalk test, and greenness of my corn at harvest all tell me I have the nitrogen rate about right on most fields in most years. This farmer was happy to see that his soil nitrate concentrations in the fall also showed that he was choosing the correct rate of nitrogen for his fields.
The nine farmers who made a change to their nitrogen fertilizer or manure management made a wide range of changes. Some moved manure from a field testing high for fall soil nitrate to another field, some kept their manure rate the same and reduced their nitrogen fertilizer rate, some kept their manure rate the same and increased their nitrogen fertilizer rate. One farmer learned from the aerial images of one of his corn fields and from estimates of yield loss we made in the field that he needed to improve his spreading of nitrogen fertilizer. The field had alternating strips of yellow and green corn with a substantial reduction in yield in the areas where the corn was yellow. He fixed the problem with his spreader, and the aerial image in the next year showed a uniformly green field, which means no reduction in yield from nitrogen deficiency.
The biggest barrier to better outcomes in this project was the Covid pandemic cancelling our final and third year’s meetings with the farmers. At those meeting we had planned to review each farmer’s soil test and aerial image results and ask them about how they might use the results to improve their nitrogen management. With three years of soil testing results, farmers’ confidence in the results increases exponentially. Without the opportunity to meet face-to-face with the farmers to answer questions and bolster their confidence in the significance of the results from their fields, we lost the critical interaction that typically results in greater learning and changes in behavior.
There was one other additional barrier to quantifying the benefits to farmers’ changes in manure and nitrogen management practices. The farmers were unable to accurately measure changes in silage corn yield in the fields where they made changes to their nitrogen management. Some farmers reported increases in silage corn yield but they were uncertain if the increases were due to their management changes or to weather. We did not include changes to silage corn yields in our calculations of the benefit from the farmer’s management changes except where we had measured yield results, for example, we measured silage yields in the green and yellow corn in the field where the farmer corrected the problems with his fertilizer spreader. We did use the farmer-reported increases and decreases in nitrogen fertilizer applications to calculate the benefits to the farmers’ changes in management.
Additional Project Outcomes
One outcome of this project that does not fit into the Performance Target is the request by two farmers with large acreages of corn (~3,000 acres between the two of them) for help establishing nitrogen strip trials in their fields in 2022. This project made them question how well they were managing their nitrogen rates on the fields not tested by the project, which is almost all their corn fields because we tested only two of their fields. The extension educator involved with this project has agreed to work with these farmers to help them design and manage a large number of replicated strip trials with different nitrogen rates on the farmers’ corn fields in 2022.