Final report for LNE18-367
Project Information
This project conducted on-farm soil sampling in Pennsylvania and Maryland to measure soil carbon, nitrogen, and phosphorus (C-N-P) dynamics under a wide range of crop rotations and management practices. The results were used to calibrate the carbon cycling algorithms in the Cycles agroecosystem model, which was then used to evaluate C-N-P dynamics under 6 different crop rotation systems paired with with cover crop usage, tillage or no-tillage soil management, and manure usage at P- and N-balanced rates.
The results from the on-farm soil sampling and Cycles modeling of soil C, N, and P dynamics highlight a number of important considerations for optimizing system management. Crop rotation type had a strong effect on soil profile C balances, with the potential to double soil profile C content from the lowest performing rotations, which were continuous corn silage or corn-soy grain rotations, to the highest performing rotations of corn silage-alfalfa rotations. Increasing the prevalence of deep, high biomass rooting systems, such as occur with perennial alfalfa crops or cover crops that are fertilized and allowed to grow larger because they will be harvested for forage, is a key factor in increasing soil profile C levels. Importantly, the contributions of deep rooting systems to soil C storage may often go undetected when soil C levels are only measured in the surface 0-8” segment, as is customary for routine soil fertility sampling. Crop rotations that maintain high subsoil C contributions from root systems can also mitigate the effect of soil C saturation that occurs at the soil surface in no-till systems, which poses a limitation to the potential for soil C sequestration in no-till management.
The effect of tillage on soil profile C balances had several interactions with crop rotation and climate. These interactions are primarily driven by the extent to which the surface layer of soil becomes saturated by high C inputs. In rotations and management scenarios with limited crop residue inputs, soil profile C was greater under no-till management because of reduced decomposition rates in no-till. However, in rotations and management scenarios with high surface layer organic matter inputs, specifically rotations with corn grain plus manure additions, and where the average climate temperatures were cooler and decomposition rates were slower, the surface 0-2" soil layer accumulated enough carbon to approach saturation. In these scenarios, annual tillage increases soil profile C because mixing of residues and homogenization of soil C concentration throughout the plow layer alleviated C saturation and allowed for greater C stabilization. Soils in warmer regions may also experience a greater acceleration of decomposition due to tillage than soils in cooler climates, where cool soil temperatures help to constrain microbial decomposition rates.
No-till management generated a number of tradeoffs in regard to soil profile C storage, soil P balance, and N losses when manures are applied at rates to meet the N requirements of crops. These tradeoffs were a result of the significant ammonia N volatilization losses occurring with surface applied manures. These volatilization losses are an environmental concern directly through their contribution to air pollution, but also have a secondary effect of leading farmers to apply much higher manure rates in order to supply enough available N to meet the crop requirements. These increased manure application rates lead to significant P excesses and contribute to high residual manure organic N pools which mineralize asynchronously with crop demand, resulting in high nitrate leaching losses. These results point to the importance of limiting manure application to P-balanced rates in no-till management. Alternatively, mechanical manure injection techniques in no-till systems could be used to reduce the manure rates required to meet the N needs of crops through more effective ammonia conservation in the soil.
The educational component of this project consisted of delivering three conference presentations to agricultural service providers, developing an online interface for the Cycles Agroecosytem Model, and developing soil carbon benchmarks for representative regions and soils in Pennsylvania and Maryland which will be distributed through a fact sheet. Of the ag service providers attending the conference presentations, 99 increased their knowledge of the forms of carbon in the soil, 122 increased their knowledge of factors affecting carbon stabilization, 128 increased their knowledge of methods to measure soil carbon, and 104 increased their knowledge of management practices to increase soil carbon. 99 attendees reported that their likelihood to discuss soil carbon management with their farmer clientele increased as a result of attending the presentation. Following up with the ag service providers one year after the conference presentation, we verified that service providers shared information about soil carbon management with 140 farmers managing 54,200 acres, producing grain, hay, dairy and other livestock, potatoes, and mixed vegetables. The ag service providers reported that 8 farmers made a management change as a result of information received, affecting 8,100 acres. The management changes included implementing no-till, growing cover crops, and adding a hay crop in rotation, resulting in 19,135 tons of new carbon sequestered in the soil and 19,400 lbs of N leaching reduced per year.
Fifty agronomic crop farmers implement a cropping system management change to optimize soil C-N-P dynamics on 5,000 acres, increasing soil C by 5 tons/acre in the long-term while reducing nitrate-N leaching by 12 lbs/acre/yr and P runoff by 1 lbs/acre/yr (a 50% reduction of both).
Agricultural soils in the Chesapeake Bay watershed are losing an average of 2 lbs/ac/yr phosphorus (P) in runoff water and 23 lbs/ac/yr N in nitrate leaching, causing severe water quality issues in the Bay. At the same time, soil carbon (C) levels are declining by 95 lbs/ac/yr, negatively impacting soil health and contributing to global climate change. Elemental C-N-P cycles are inextricably linked through the process of growing crops, feeding livestock, and applying manure to agricultural lands, but optimizing the management of these cycles to achieve high soil C levels while minimizing N and P losses is fraught with tradeoffs in heavily concentrated areas of livestock production. This project engaged agronomic crop farmers and their ag service providers in Pennsylvania, New York, and Maryland to learn about, evaluate, and improve C-N-P management on their farms. We conducted research at 12 farms and a long-term research station experiment to identify combinations of management practices, such as planting cover crops, harvesting cover crops for forage, and strategic use of tillage and manure injection, that optimize C-N-P dynamics to achieve high soil C levels while minimizing N and P losses. Pairing the dataset collected from research sites with a cropping system computer model, we also identified region- and soil-specific benchmark soil organic matter levels that can be achieved under optimal C-N-P management. To supplement our education program of workshops, field days, and webinars, we developed an online simulation tool for farmers to compare C-N-P dynamics under different management scenarios.
Research
We hypothesize that: (1) there is an upper bound to soil organic matter (SOM) levels that can be achieved when appropriate nutrient management practices limit manure application rates to environmentally safe levels; (2) the upper bound for SOM levels will vary based on soil texture and climatic controls on the SOM decomposition rate, resulting in site-specific targets for SOM levels that farmers can use to evaluate soil management practices; (3) there are specific combinations of management practices that can raise the upper bound for SOM levels by allowing greater manure application rates and decreasing SOM decomposition rates.
This project used on-farm measurements of soil carbon, soil nitrate and ammonium, and soil test phosphorus (Mehlich 3) at multiple depths of the soil horizon (0-5cm, 5-10cm, 10-20cm, 20-40cm, 40-60cm, and 60-80cm) to assess how carbon (C), nitrogen (N), and phosphorus (P) dynamics are coupled. Soil measurements were paired with detailed soil management records to determine how the management practices were related to the measured C-N-P dynamics. We also used results of the measured soil C concentrations to recalibrate the Cycles agroecosystem model to predict soil C storage based on different simulated management practices. Through on-farm soil sampling, we assessed C-N-P dynamics on 58 fields from 12 different farms in Maryland and Pennsylvania. At each farm, 4 to 8 fields were sampled representing a variety of management practices within and across farms. Farms were chosen to span a gradient of management practices from conventional tillage to long-term no-tillage, from manure use at various rates to fertility management purely with synthetic fertilizers, cover cropping and no cover cropping, and from simple to diverse rotations. Within each farm, fields were selected for sampling that showed some within farm contrast, such as phase of the crop rotation, cover cropped or non-cover cropped, different fertilizer rates used, etc. We expected the across and within farm variability to generate a broad spectrum of management practices that will allow results to be extrapolated to the majority of agronomic crop production in the northern Chesapeake Bay watershed.
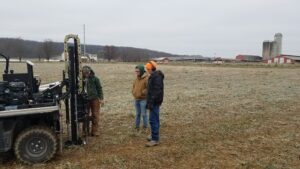
Soil sampling for each field was conducted with a hydraulically powered soil probe (Figure 1, Ag Probe 9100, AMS, Inc.) that retrieved a soil core to >80cm deep. Four cores were collected from each field in random locations but all from within the same dominant NRCS soil map unit. The soil sampler retrieved each core inside a plastic sleeve so that the intact core could be removed from the sampling tube and transported to the lab while protecting soil horizonation and bulk density of the core. Following soil sampling, the plastic sleeves were cut open and each soil core was cut into depth increments of 0-5cm, 5-10cm, 10-20cm, 20-40cm, 40-60cm, and 60-80cm. The depth increments from the four cores taken in each field were composited to create a single sample per horizon per field. The total mass of fresh soil was recorded and a subsample was dried for determination of gravimetric moisture content. A subsample of the fresh soil was immediately extracted for nitrate and ammonium concentrations. Soil samples were then dried, flail milled, and sieved to <2mm. The rock weight in the sieved material was recorded to adjust the soil bulk density. Dried and sieved soil were measured for Mehlich 3 extractable P and total soil organic carbon.
Soil management practices that were documented for each field for the previous 10 years include the crop rotation, crop planting and harvest dates, average crop yields, crop residue removal practices, fertilizer and manure applications (include rate, form, time and method of application), and tillage practices. Management prior to 10 years in the past was documented in generalized form, including crop rotation, use of manure vs. fertilizer, and tillage practices.
Management practices collected about each farm were used in the Cycles agroecosytem model to simulate the impacts that crop management have on C and N cycling dynamics. We used the measured on-farm soil data to check the accuracy of the Cycles model at predicting C and N dynamics, and then recalibrated the carbon cycling algorithms in the model to improve the accuracy. After the recalibration of the parameters in the Cycles soil carbon algorithm, we developed a set of simulations to determine benchmark soil carbon levels that could be achieved under different management practices. We developed simulations for 6 crop rotations that are common within the Chesapeake Bay watershed: continuous corn grain, corn grain rotated with soybean, continuous corn silage, continuous corn silage with a harvested rye cover crop, corn silage rotated with alfalfa, and corn silage rotated with alfalfa with a harvested rye cover crop between corn plantings. Within each type of crop rotation, we evaluated the effect of tillage through management scenarios that were either continuous no-till or with annual tillage. Within each tillage type, we then tested a baseline scenario where crops were managed with nitrogen fertilizer, a scenario that added a cereal rye winter cover crop, and scenarios that added the cover crop and either manure applied to meet the P removal of non-legume crops in the rotation or manure added to meet the N requirement of non-legume crops in the rotation.
We took a systems approach to determining the manure types and application rates used in the different rotations and tillage scenarios. In the corn grain and corn-soybean rotations we used poultry litter, because cash grain operations in this region are often producing grains for the poultry industry. In the corn silage and corn silage-alfalfa rotations we used dairy manure, since these crop rotations are primarily used on farms with dairy herds. The nitrogen, phosphorus, and potassium content of the manures were based on typical nutrient values contained in the Penn State Agronomy Guide. The fraction of ammonium N and organic N in each manure type was based on an analysis of a historical manure sample databased from the Penn State Agricultural Analytical Services lab, resulting in a distribution of 20% ammonium N and 80% organic N for poultry litter and 50% ammonium N and 50% organic N for dairy manure. The carbon content of manures was also estimated based on an analysis of the Penn State Agricultural Analytical Services lab manure database, resulting in a relationship where the carbon concentration is 35% of the dry matter content of the manure. In our simulations, poultry litter had 67% dry matter and dairy manure had 7.5% dry matter based on typical values in the Penn State Agronomy Guide.
To determine P-based manure application rates to non-legumes in the rotation, we used typical P2O5 removal values for different crops from the Penn State Agronomy Guide and applied a manure rate to match the P removal based on the manure P2O5 analysis. The N availability from manure applied at the P-based rate was determined using ammonium N and organic N availability factors from the Penn State Agronomy Guide, which account for volatilization losses of the ammonium content and partial decomposition of the organic N content in the year of application. For scenarios with annual tillage, the ammonium N availability factor for incorporation after 1 day was used, while no-till scenarios used the ammonium N availability factor for no incorporation. Because P-based manure rates typically do not supply enough N to the crop, we calculated the additional amount of N fertilizer needed to meet the crop requirement after accounting for the N available in the manure applied and any N credits for a previous legume crop and the residual manure history of the previous five years, using legume and historical manure N credits from the Penn State Agronomy Guide. Because no-till management of manures typically have greater volatilization losses of ammonium, the N fertilizer required to meet the crop needs was always greater in the no-till scenarios.
To determine N-based manure application rates to non-legumes, we calculated the net crop N requirement based on N fertilizer recommendations in the Penn State Agronomy Guide and subtracting N credits for a previous legume crop in rotation and the frequency of manure applications in the last 5 years. The net crop N requirement was then fulfilled with manure application rates calculated to supply the necessary quantity of available N, using ammonium N availability factors based on 1 day incorporation for tillage scenarios and no incorporation for no-till scenarios. Using this systems approach to manure application rates, manure applied to meet N requirements in the no-till scenarios was always greater than in the tillage scenarios, because manure that is not incorporated has greater volatilization losses and less available N compared to manure that is incorporated. The increased manure application rates in no-till scenarios also result in increased carbon and phosphorus applied relative to tillage scenarios. This is an important point to remember when interpreting and comparing the outcomes of no-till and tillage scenarios.
In our scenarios we chose to only apply manure to non-legumes in the rotation, because legumes in the rotation would not benefit from any N contained in the manure. For each scenario, we calculated the system level annual P balance as manure P applied to non-legumes over the rotation minus crop P removal by all crops in the rotation, divided by the number of years in the rotation. In scenarios without manure applied, the system level P balance is always negative, reflecting the potential for crop P removal to draw down soil P levels. In P based manure scenarios, rotations with only non-legumes will have a zero P balance because manure rates are applied to meet the P removals of non-legumes. Rotations with legumes that are managed with P-based manure rates in our scenarios will have a negative P balance due to the additional P removal of the legumes. System level P balances in the N-based manure scenarios are dependent on the manure rates needed to achieve N requirements for the non-legumes and the extent of legume crop P removal in the rotation.
The Cycles agroecosystem model operates by taking management practices specified by the user, such as crop rotation, tillage, fertilizer and manure applications, and implementing them on a daily time step. Users also specify a soil profile description with varying soil depth segments that have a specific sand, silt, and clay content. The lowest depth segment represents the bottom of the soil profile, and is the furthest extent to which roots can grow and to which water, carbon and nitrogen can be stored. Water and nitrogen that drains out of the last layer is lost from the system as leaching. Deeper soil profiles can generally support higher crop yields due to available water holding capacity and can achieve a higher soil profile C mass from the contribution of increased subsoil C. Cycles uses a historical weather file to determine temperature, humidity, rainfall, solar radiation and wind speed on each day of the simulation. We generated weather files from the NASA National Land Data Assimilation System database that span from 1980 to 2020 for the five representative locations: Tioga, Union, and Lebanon counties in Pennsylvania and Carroll and Caroline counties in Maryland. Based on the weather that occurs and the management practices specified by the user, Cycles calculates crop growth, crop nutrient and water uptake, crop residue recycling, and transformations of carbon and nitrogen in each soil layer each day. Detailed outputs from the model for crop growth and soil carbon and nitrogen pools are available on daily and annual time scales.
In our benchmarking results, we report soil organic C concentration (%) in 0-2”, 2-4”, and 4-8” depth segments of the topsoil to illustrate issues of stratification in no-till systems, as well as a weighted average soil C concentration of the 0-8” layer, which can be compared to typical soil sampling depths used for soil fertility monitoring. We also report the entire soil profile C storage, which is a measurement of soil C concentration (%) multiplied by the soil mass of each layer, summed to the bottom of the soil profile. This value represents the potential for different management systems to sequester C in the entire profile, which is the most relevant metric for soil C sequestration to mitigate climate change. Finally, we report the system level annual P balance, calculated as previously described, and the annual nitrate leaching and ammonia volatilization rates as calculated by the Cycles model.
On-Farm Soil C, Mehlich 3 P, Nitrate, and Ammonium
Over the course of the project, 58 fields at 12 farm locations in Pennsylvania and Maryland were sampled to measure soil C, N, and P dynamics. An example of the C, N, and P data that were collected in each field are shown in Figures 2 and 3.
Figure 2 is data from a long-term no-till dairy farm. At this farm, two of the sampled fields were during the corn phase of the rotation and two fields were during the hay phase of the rotation. The corn fields had a cereal rye cover crop planted and the hay fields were dormant alfalfa/orchardgrass. Both fields had manure spread on them two days before soil sampling. At this farm, the soil test P and soil C were stratified at the soil surface due to long-term no-till management. The overall soil test P levels were not excessive, however, owing to the judicious use of manure. In the plow layer, the soil test P levels are within or slightly above the optimum agronomic level according to Penn State soil test interpretation guidelines. Although this is a large dairy farm (1,000+ cows), soil test P levels have not accumulated to excessive levels because the farm has a large land base to distribute the manure across and manure P levels have been reduced through solids separation. Soil nitrate levels in the profile would be considered moderately low relative to previous experience sampling at this time frame. This may be because the farmer uses lower than recommended rates of N fertilizer on his crops, which he has determine are feasible without losing crop yield based on his experience using adaptive N management practices, such as nitrogen fertilizer rate strips. Soil C concentration is quite high in the 0-5cm depth increment and quickly drops off due to stratification. This is common in no-till soils and may limit soil C accumulation due to soil C saturation in the surface layer where organic inputs are deposited.
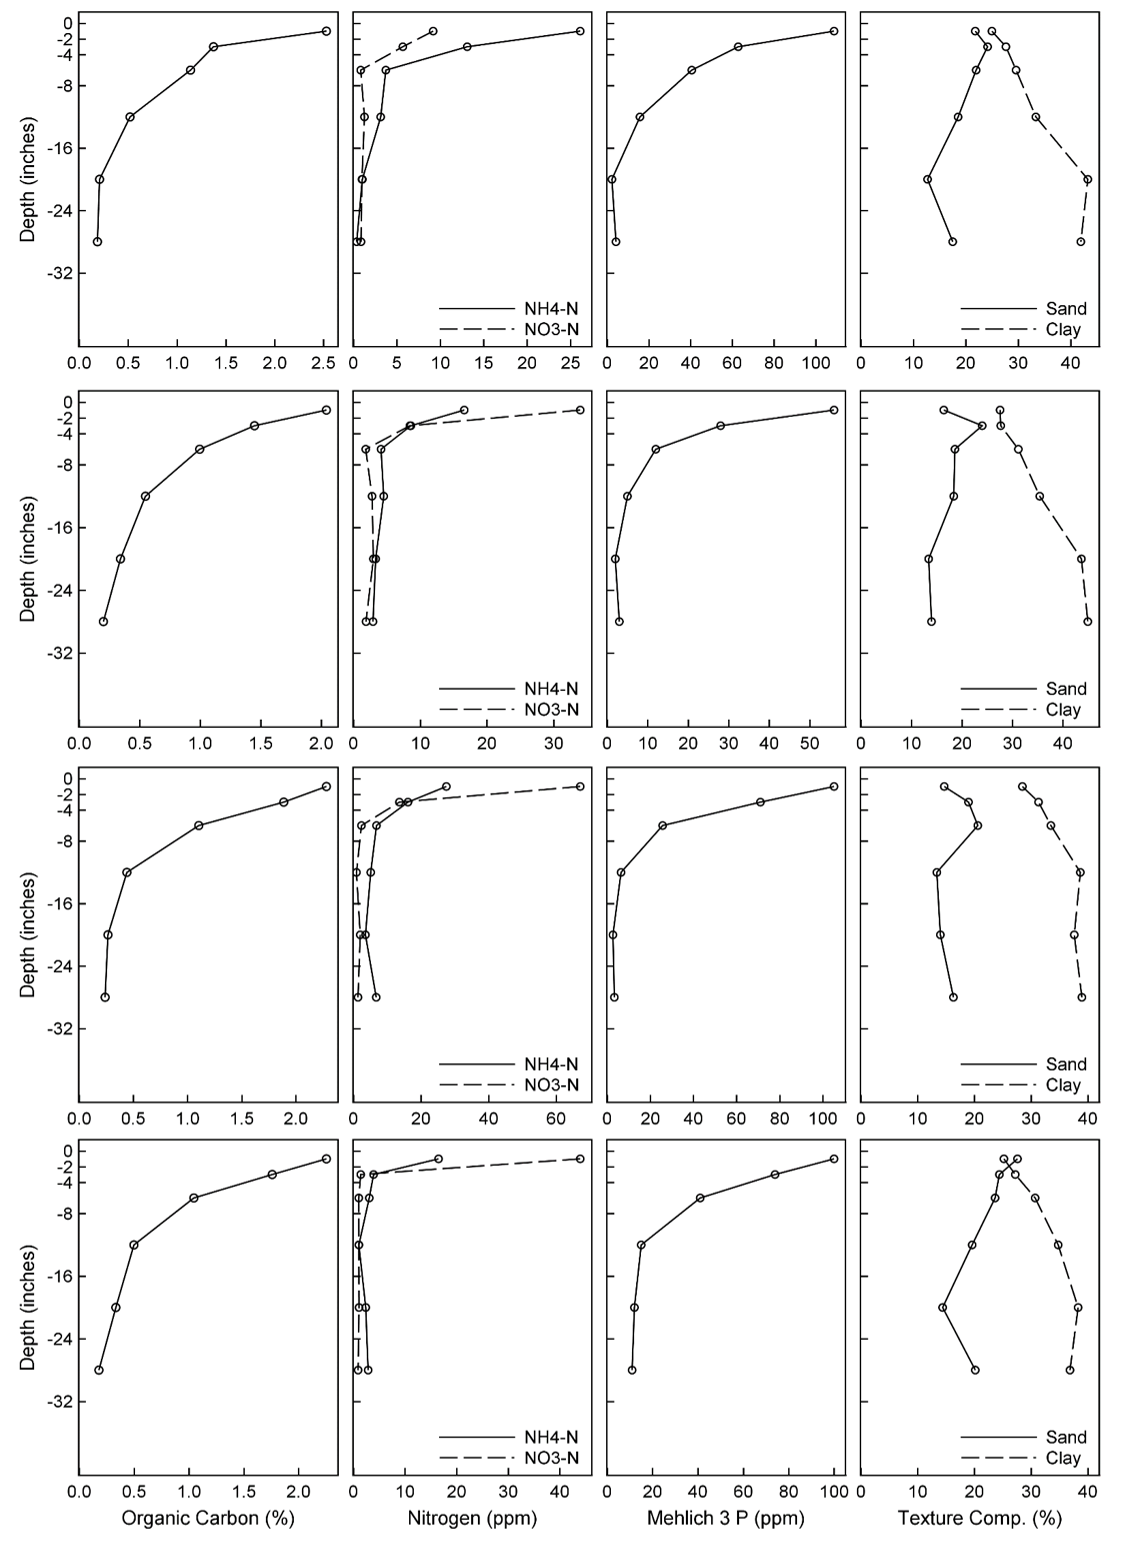
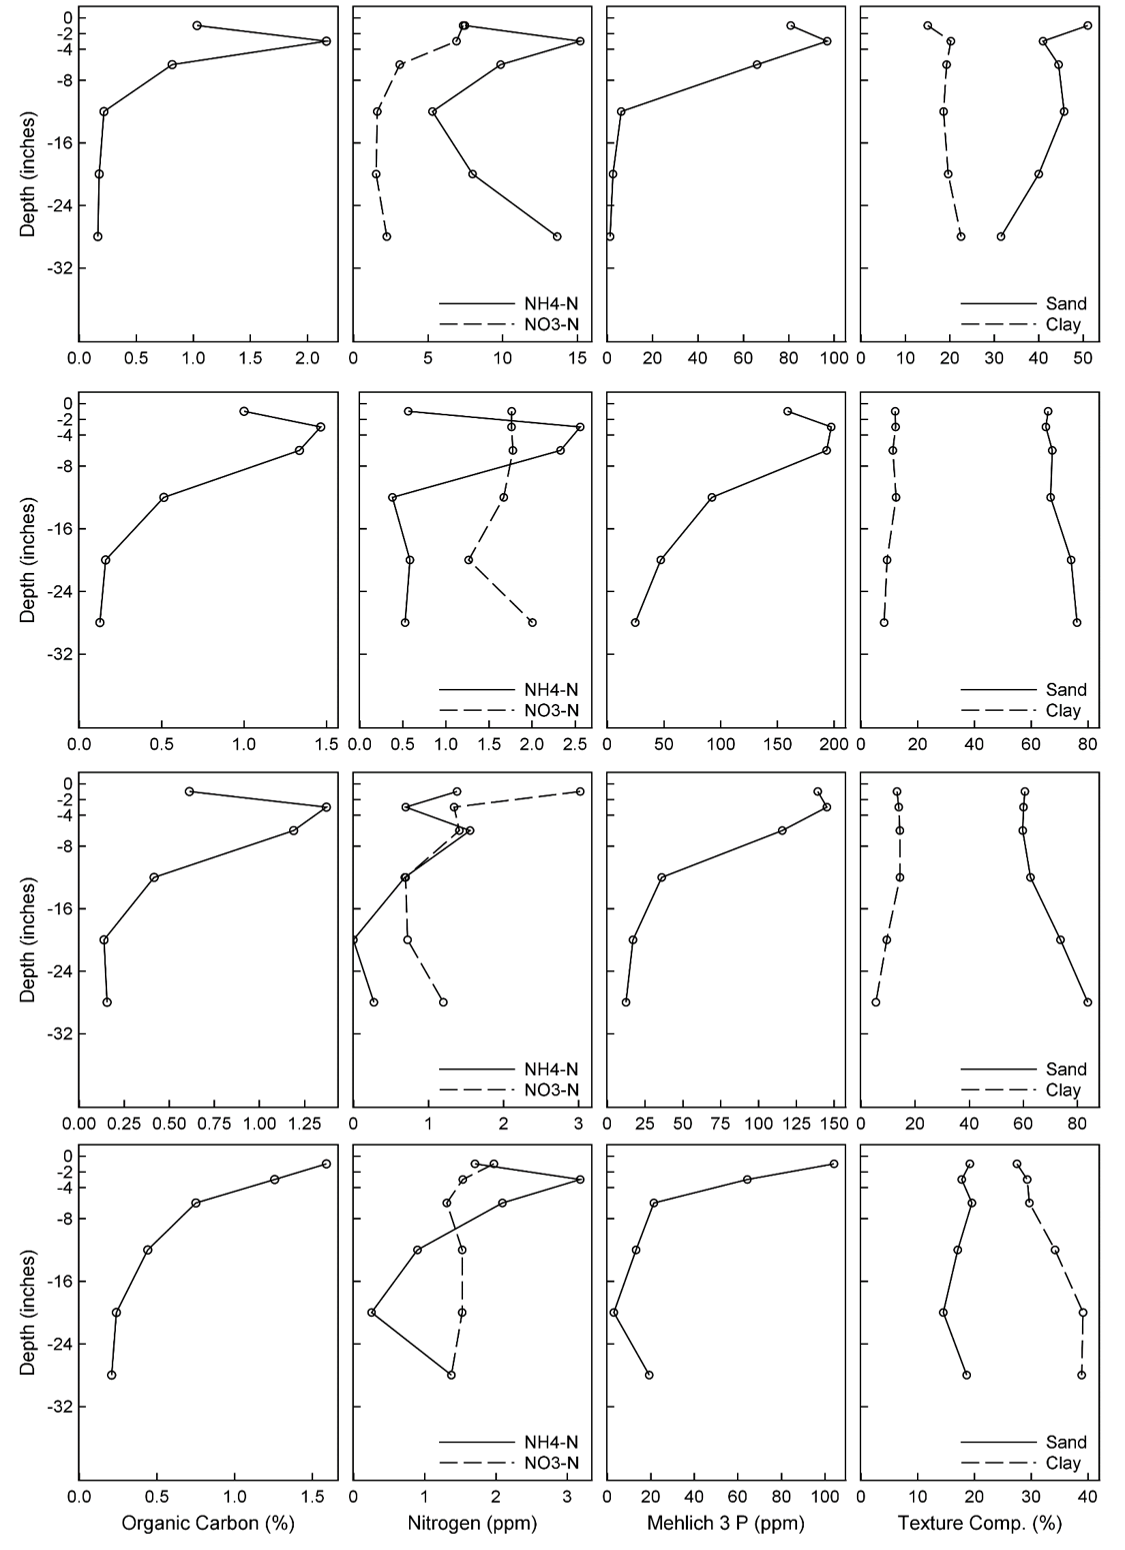
Figure 3 is data from an organic farm with a diversified agronomic rotation of corn, wheat, soybeans, and hay. The farm reliably cover crops, performs tillage annually in between crops, and uses poultry litter as a supplemental nitrogen source. The farm has fields that have been under organic management for different periods of time, with the most recently acquired fields transitioning from continuous no-till production to organic management within the last 5 years. At this site, soil C concentration was greater in the topsoil than the subsoil, and more homogenously distributed through the plow layer than at the no-till site. Soil nitrate levels throughout the profile did not show any obvious bulges of nitrate at depth and overall nitrate concentrations were relatively low. One field had very high ammonium levels throughout the soil profile, which is difficult to explain, but it occurred in the field with the longest history of organic management. Soil test P was well-above the agronomic optimum at all sites owing to the historically heavy use of manure in the crop rotation. However, soil test P levels have been managed to remain below the 200ppm threshold that triggers additional nutrient management restrictions in Pennsylvania.
Soil samples collected from the additional farms were measured for soil C, Mehlich 3 P, and extractable nitrate and ammonium. The results of each farm field were used to help calibrate the Cycles agroecosystem model's carbon cycling algorithms and to help interpret the effects of different management practices on the interrelated C-N-P dynamics.
Cycles Agroecosystem Model C-N-P Benchmarking
The Cycles Agroecosystem Model was used to develop soil organic carbon benchmark levels for different crop rotations and management practices in five representative locations of the Chesapeake Bay watershed in Pennsylvania and Maryland. One of the goals of the benchmarking was to use the model outputs to identify combinations of management practices that optimize for high soil carbon, low N losses in leaching and volatilization, and balanced P inputs. A secondary goal was to provide target soil organic carbon levels that could be achieved under different management practices so that farmers could have a reference point for interpreting their own soil C levels and determine the potential room for improvement.
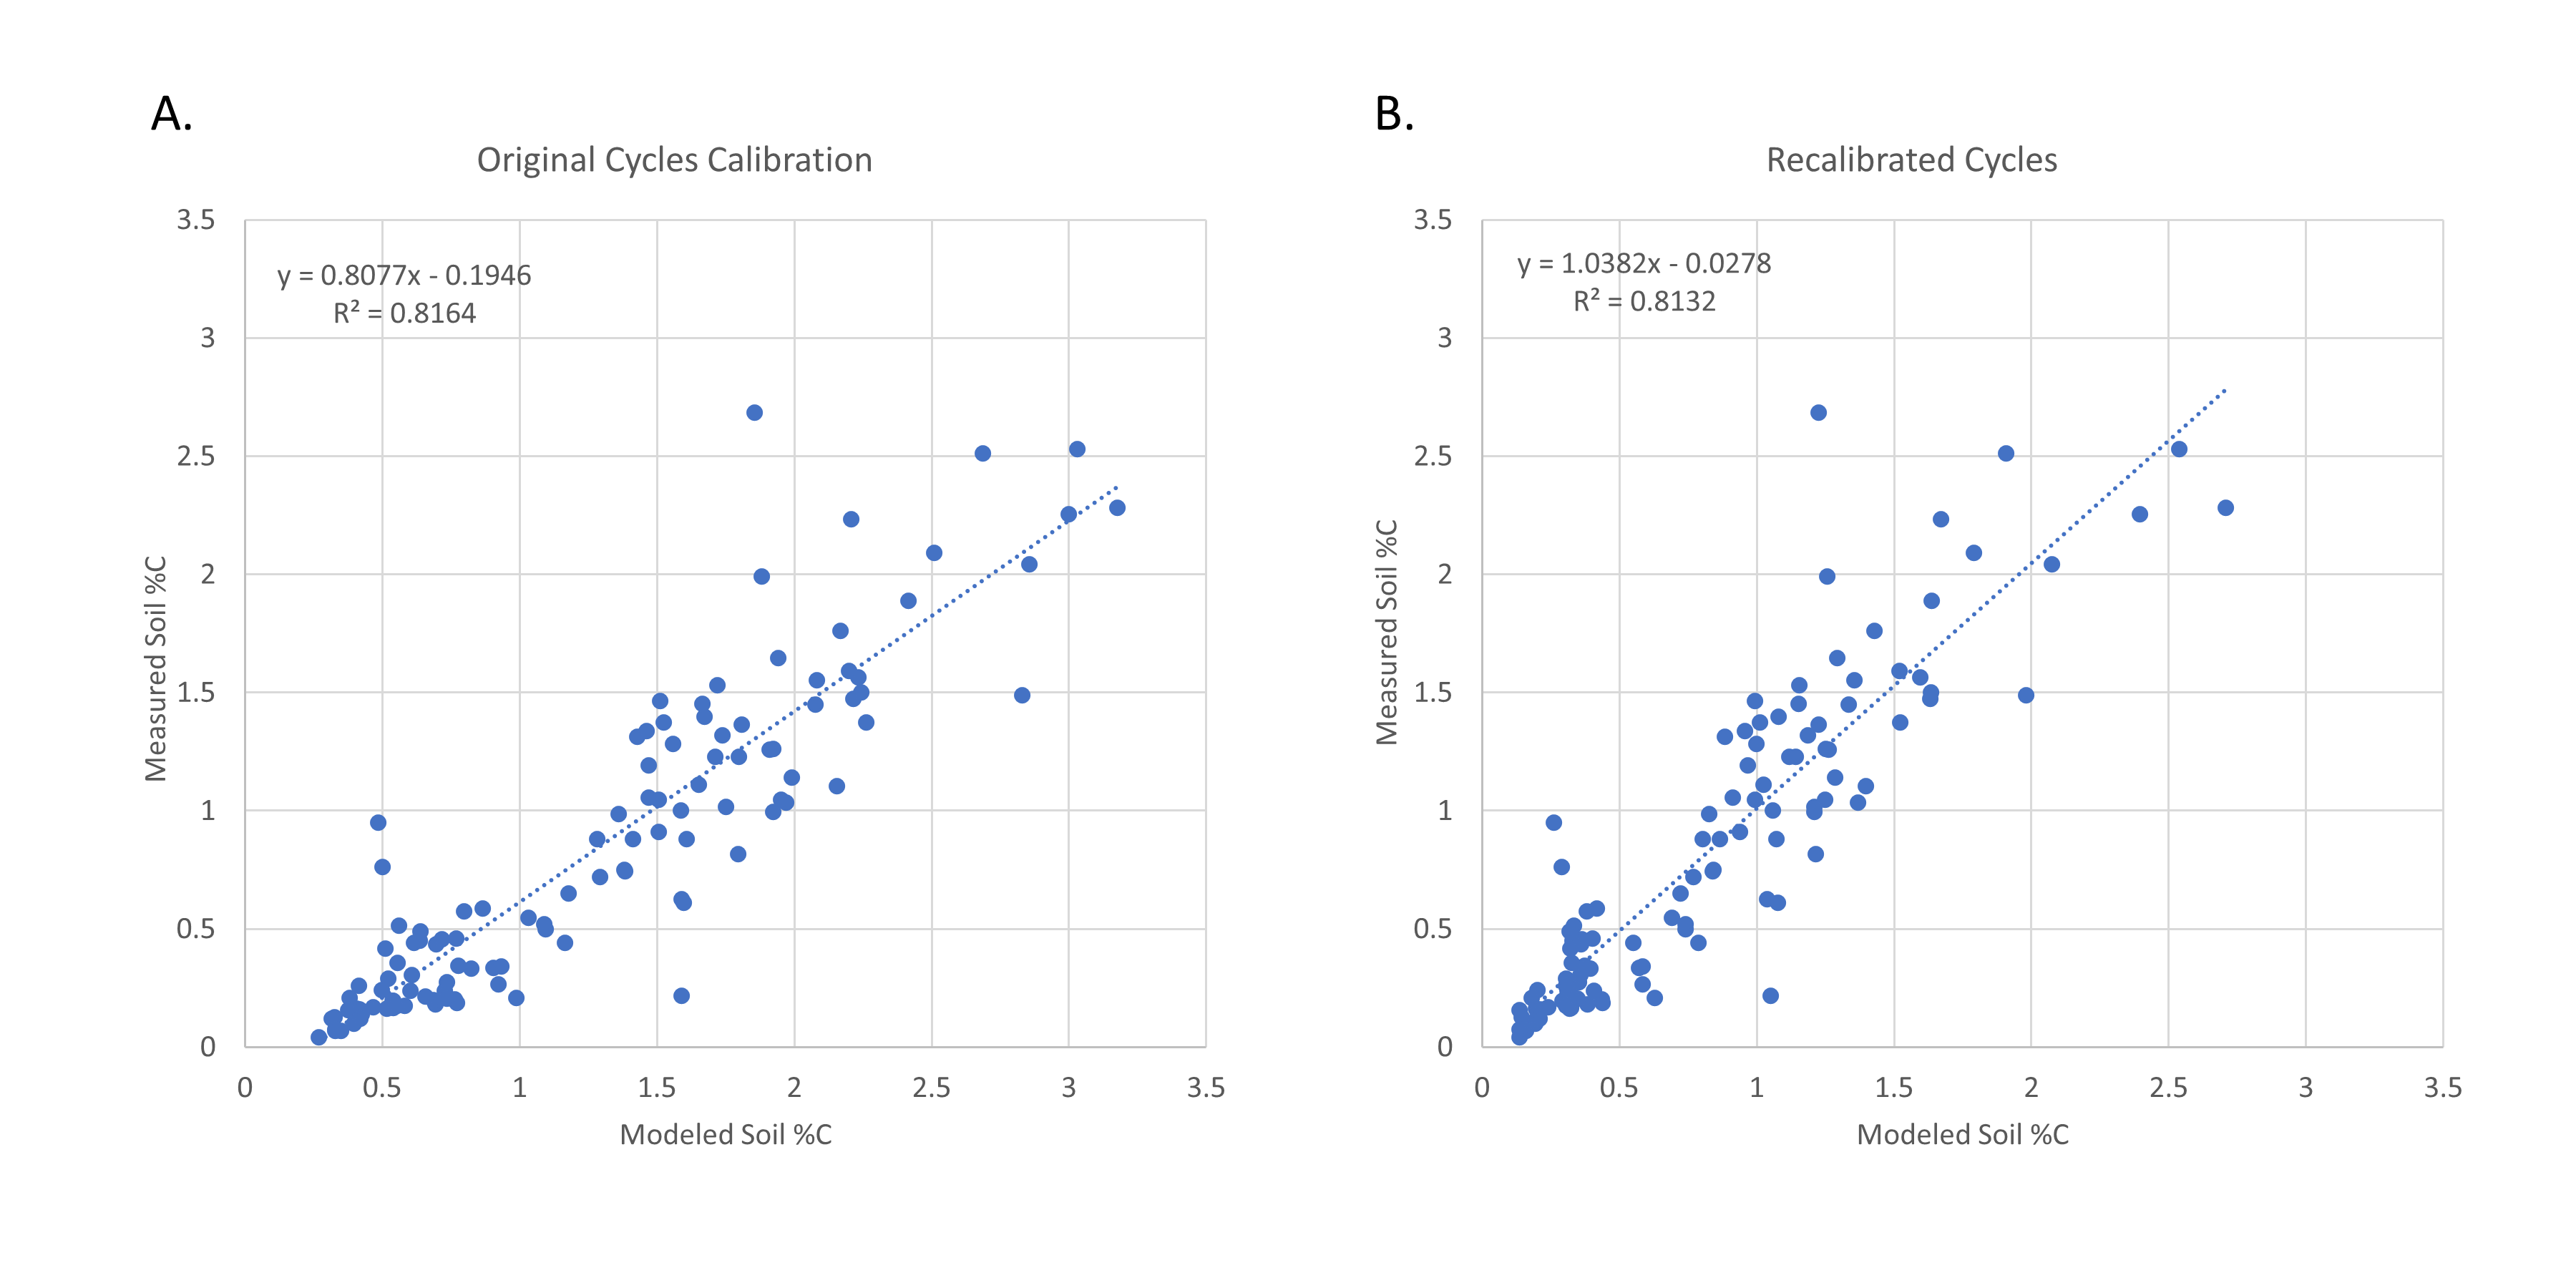
Prior to running the benchmark simulations in Cycles, we used soil organic carbon data measured from on-farm locations in Pennsylvania to recalibrate parameters of the soil carbon cycling algorithm used inside the Cycles model. Using the original parameterization of Cycles, soil C concentration was overpredicted by the model as compared to the measured C concentration from on-farm samples (Figure 4A). We manually adjusted parameters of the soil C algorithm, effectively increasing the decomposition rate and fine-tune the relationship between soil C saturation and decomposition rate. The recalibrated parameter values improved the prediction of soil C concentration by Cycles model to a 1:1 relationship with observed values (Figure 4B).
Crop Rotation Effect on Soil C
Full results from the benchmarking simulations conducted in the five representative locations are reported in the Soil Carbon Benchmarks Appendix. The following results are primarily based on the simulations developed for the Union County location, but similar patterns emerged in the other locations, except where noted. Soil carbon levels were affected by a number of interactions among crop rotation type, tillage, cover cropping, and level of manure usage. Averaged across the tillage, cover cropping, and manure scenarios, the crop rotations ranked in order of soil C storage were Corn Silage-Alfalfa-Harvested Cover Crop > Corn Silage-Alfalfa > Corn Silage-Harvested Cover Crop > Corn Silage > Corn Grain > Corn-Soy. These average results for crop rotation are a function of the level of cropping system intensity, especially with regards to the prevalence of deep rooting crops in the rotation and the type of manure used. The rotations with alfalfa had substantially higher soil profile C content than other rotations, with an average increase relative to other rotations of 62% to 22%. Although these rotations are harvested for forages, which entails relatively few crop residue returns to the soil, the prevalence of deep perennial root systems and high rates of manure additions led to high profile soil C concentrations. The continuous corn silage rotations had moderate levels of soil profile C storage, with the rotation containing harvested cover crops having 15% greater soil C storage than the rotation where cover crops were left to return to the soil. This is a surprising result considering the harvesting of cover crops leaves less aboveground crop residue behind than returning the cover crops. However, to maximize the growth of the cover crop in the harvested cover crop rotation, the cover crops received fertilizer or manure additions and were allowed to grow for an additional two weeks. This system-level change in cover crop management appears to have stimulated enough additional root growth, leading to soil C stabilization in the subsoil, to compensate for the aboveground residue removals. The grain crop rotations, on average, had the lowest level of soil profile C, with the corn-soy rotation having 12% less soil profile C than the continuous corn grain rotation. The lower soil profile C levels of the grain crop rotations may have to do with the lack of perennials, limited opportunities for cover crop growth given late corn and soybean harvest dates, and possibly interactions with the poultry litter manure which may have had less carbon content per unit of nutrient availability. Among the grain rotations, the greater soil profile C content of the continuous corn rotation is likely due to corn contributing greater amounts of crop residue to the soil than soybeans, and also because the corn rotations receive manure annually as opposed to every other year.
Cover Crop and Manure Management Effects on Soil C
While the average effect of crop rotation illustrates important concepts of soil C stabilization, several management interactions appear when evaluating the crop rotations within effects of annual tillage versus no-tillage and addition of cover crops, P-balance manure rates, and N-balanced manure rates. In the baseline scenario without cover crops or manure additions, the corn silage-alfalfa rotation still had the greatest soil profile C content, and was followed by corn grain, corn-soy, and corn silage rotations. This highlights the effect of crop residue returns to the soil, where the system with perennial alfalfa and corn grain, which have high levels of above or below-ground residues, performed better than the systems with soy or continuous corn silage.
Adding cover crops to a system increases the crop residue inputs, which resulted in a 9% increase in profile C storage in the corn-silage alfalfa and continuous corn silage rotations, a 6% increase in the corn-soy rotation, and only a 1% increase in the continuous corn rotation. With the addition of cover crops, crop rotations maintained their same rank order of soil profile C storage as in the baseline scenarios. However, it is notable that the effect of adding a cover crop is greatest in rotations with corn silage and soybean, crops that have lesser amounts of aboveground biomass returns. The limited impact of cover crops in continuous corn rotations may be due to the late planting date of cover crops following corn leading to relatively low cover crop biomass, or that surface soil layers in continuous corn rotations are already saturated with soil C due to high rates of corn residue additions.
Adding P-balanced rates of manures to the crop rotations increased soil profile C storage in all rotations, but with different relative magnitudes. The greatest relative increases in soil profile C due to manure P rates were in the corn silage rotations with and without harvested cover crops, with 36% and 39% increases respectively. Soil profile C increases due to manure P rates in the corn silage-alfalfa rotations were 9% and 8% in the rotations with and without harvested cover crops. In the corn grain and corn-soy rotations, manure P additions only increased soil profile C by 6% and 2% respectively. The dramatic increases in corn silage rotations may have been due to the relatively low starting point for soil C in these rotations, or that dairy manure has a relatively higher dry matter and carbon content per unit of P compared to poultry litter. Furthermore, continuous corn silage rotations receive manure P rates annually, whereas the rotations with legumes do not receive manure in the legume years.
The effect of N-based manure rates compared to P-based manure rates was generally less than the relative increases that were observed between fertilizer usage and P-based manure rates in the forage rotations using dairy manure. Increasing to N-based manure rates raised soil profile C by 10% in the corn silage rotation and 8% in the corn silage with harvested cover crops rotation. In the corn silage-alfalfa rotations, increasing to N-based manure rates only increased soil profile C by 4% and 3% in the with and without harvested cover crop scenarios respectively. In the grain rotations, increasing to N-based manure rates raised soil profile C by 11% in the continuous corn rotation and by 5% in the corn-soy rotation. The greater increase in the continuous corn rotation is because of manure applications to corn occurring in every year and because the every-other year application to corn in the corn-soy rotation is slightly less because of the soybean N credit to corn.
The effect of adding cover crops to a rotation but harvesting them as forages varied based on the crop rotation, fertility management, and tillage system. In the corn silage rotations, harvesting cover crops compared to letting residues return to the soil most often led to increases in soil profile C storage. The one exception where soil profile C storage decreased due to harvesting cover crops was in the no-till N-based manure scenario. The relative increase due to harvesting cover crops was greatest in the tilled manure P and tilled manure N scenarios, with 11% increases in each scenario. It is unclear what set of interrelated processes lead to this particular effect within tilled systems, but it points to an important management practice that tillage-based corn silage systems could utilize to increase soil C content. The effect of harvesting cover crops in corn silage-alfalfa rotations was generally rather limited and was not consistently positive or negative across the different scenarios. This may be because in these rotations the presence of cover crops is much more limited (only two out of 6 years) and the major effect of alfalfa in the rotation masks the effect of increased cover crop rooting from the harvested cover crop.
Tillage and Sampling Depth Effects on Soil C
The effect of annual tillage as compared to continuous no-till had pronounced effects on redistribution of soil C throughout the topsoil layers (0-8” depth). In no-till systems, soil C concentration was very strongly stratified. Depending on the level of C inputs to the soil surface from crop residues and manures, the 0-2” soil C concentration was 2 to 5 times greater than in the 4-8” depth segment in no-till scenarios. In tilled systems, the soil C concentration across 0-2”, 2-4” and 4-8” segments was rather uniform due to annual mixing of the soil profile through the tillage operations. In terms of whole soil profile C content, annual tillage increased whole profile C compared to no-till in the corn grain and corn-soy systems in Tioga, Union, and Lebanon County simulations, which are located in Pennsylvania. In these locations, the increase C storage from tillage grew larger as organic matter inputs increased with cover crops and increasing manure rates. This may be because the high rates of crop residues and poultry litter applied to the soil surface in these rotations was saturating the C storage capacity of the 0-2” layer, and C inputs could not be stabilized. In fact, the no-till corn grain and corn-soy rotations had some of the highest soil %C concentrations in the 0-2” layer of all the scenarios.
The only forage rotation to have greater soil profile C under tillage was the corn silage-harvested cover crop rotation when manure was used at P- or N-based rates, and this only occurred in Tioga, Union, and Lebanon County sites, in Pennsylvania. The harvested cover crop in this rotation adds an additional nutrient demand compared to the forage rotations where cover crops are not harvested, and this rotation also has a greater need for manure additions than the alfalfa-corn silage rotations due to annual cropping with corn and cover crops and no legume credits. The fact that this rotation had greater soil profile C storage in the tillage management when manure was added supports the concept that rotations with high organic matter inputs at the soil surface may experience C saturation in no-till management, limiting C sequestration potential.
The result of tillage increasing soil profile C storage in systems with high rates of C inputs to the soil surface only help up in the three locations in Pennsylvania, which had cooler climates than the locations in Maryland. In Maryland, soil profile C storage in the corn grain and corn-soy rotations was greater under no-till management than with annual tillage, except for the N-based manure corn grain rotation in Carroll County, which is the rotation scenario with the greatest surface C inputs. In these warmer locations, soil C levels in the 0-2" layer may not have become as saturated due to faster decomposition rates and overall lower soil C concentrations. Furthermore, the effect of tillage in a warmer climate may have accelerated decomposition rates more so than regions with cooler climates, where cool soil temperatures constrain decomposition rates. Therefore, in warmer regions that have surficial soil layers which are less saturated in carbon, no-till soil management appears to maintain a benefit for soil C storage.
The corn silage and corn silage-alfalfa rotations had greater soil profile C in the no-till scenarios across all climate regions. These rotations have much less crop residue additions to the soil surface due to harvesting of the whole aboveground plant biomass for forage, and the 0-2” layer may not have been approaching carbon saturation. In these cases, tillage decreased soil profile C storage, most likely due to increased decomposition rates.
In many scenarios, increased soil profile C content can be attributed to C storage in the subsoil. The contribution of subsoil C storage is evident by comparing the 0-8” soil %C and whole profile C across different rotations. For instance, in the Union County, PA results, 0-8” soil %C was 1.4% in both the corn silage-alfalfa no-tillage manure P rotation and the continuous corn silage manure P rotation. But the whole profile C level was 99 Mg/ha C in the rotation with alfalfa and only 79.4 Mg/ha C in the continuous corn rotation. These disconnects between 0-8” C content and whole profile C content highlight the importance of soil sampling depth, where deeper depths reveal a different picture than surficial sampling. They also highlight the importance of subsoil C storage processes, and the benefit of systems that maintain abundant deep root systems, such as perennial alfalfa in the rotation and maintaining high biomass cover crops through fertility amendments and increased growth durations.
Optimizing Soil C and Soil P Balances
While the results for soil profile C storage are informative in identifying management practices that maximize soil C sequestration, the effects of manure additions on soil P balances need to be evaluated. Rotations and management practices that can lead to high soil C while maintaining balanced soil P levels, or even net soil P drawdown (negative balances) would be particularly desirable to balance the need for C sequestration and maintenance of water quality. Figure 5 illustrates the soil profile C content (y-axis) and soil P balance (x-axis) of each of the 44 management scenarios evaluated in Cycles. Overall, there is a loose correlation where soil P balances increase with soil profile C content. This is caused by the higher profile C content in N-based manure rates generally causing P additions to exceed crop removal rates. However, within this loose correlation, management systems can be identified that are particularly high performers, leading to high profile C with neutral or negative P balances. Systems that illustrate tradeoffs between C storage and P excesses can also be identified, as well as systems that are particularly poor performers with P excesses and low C storage.
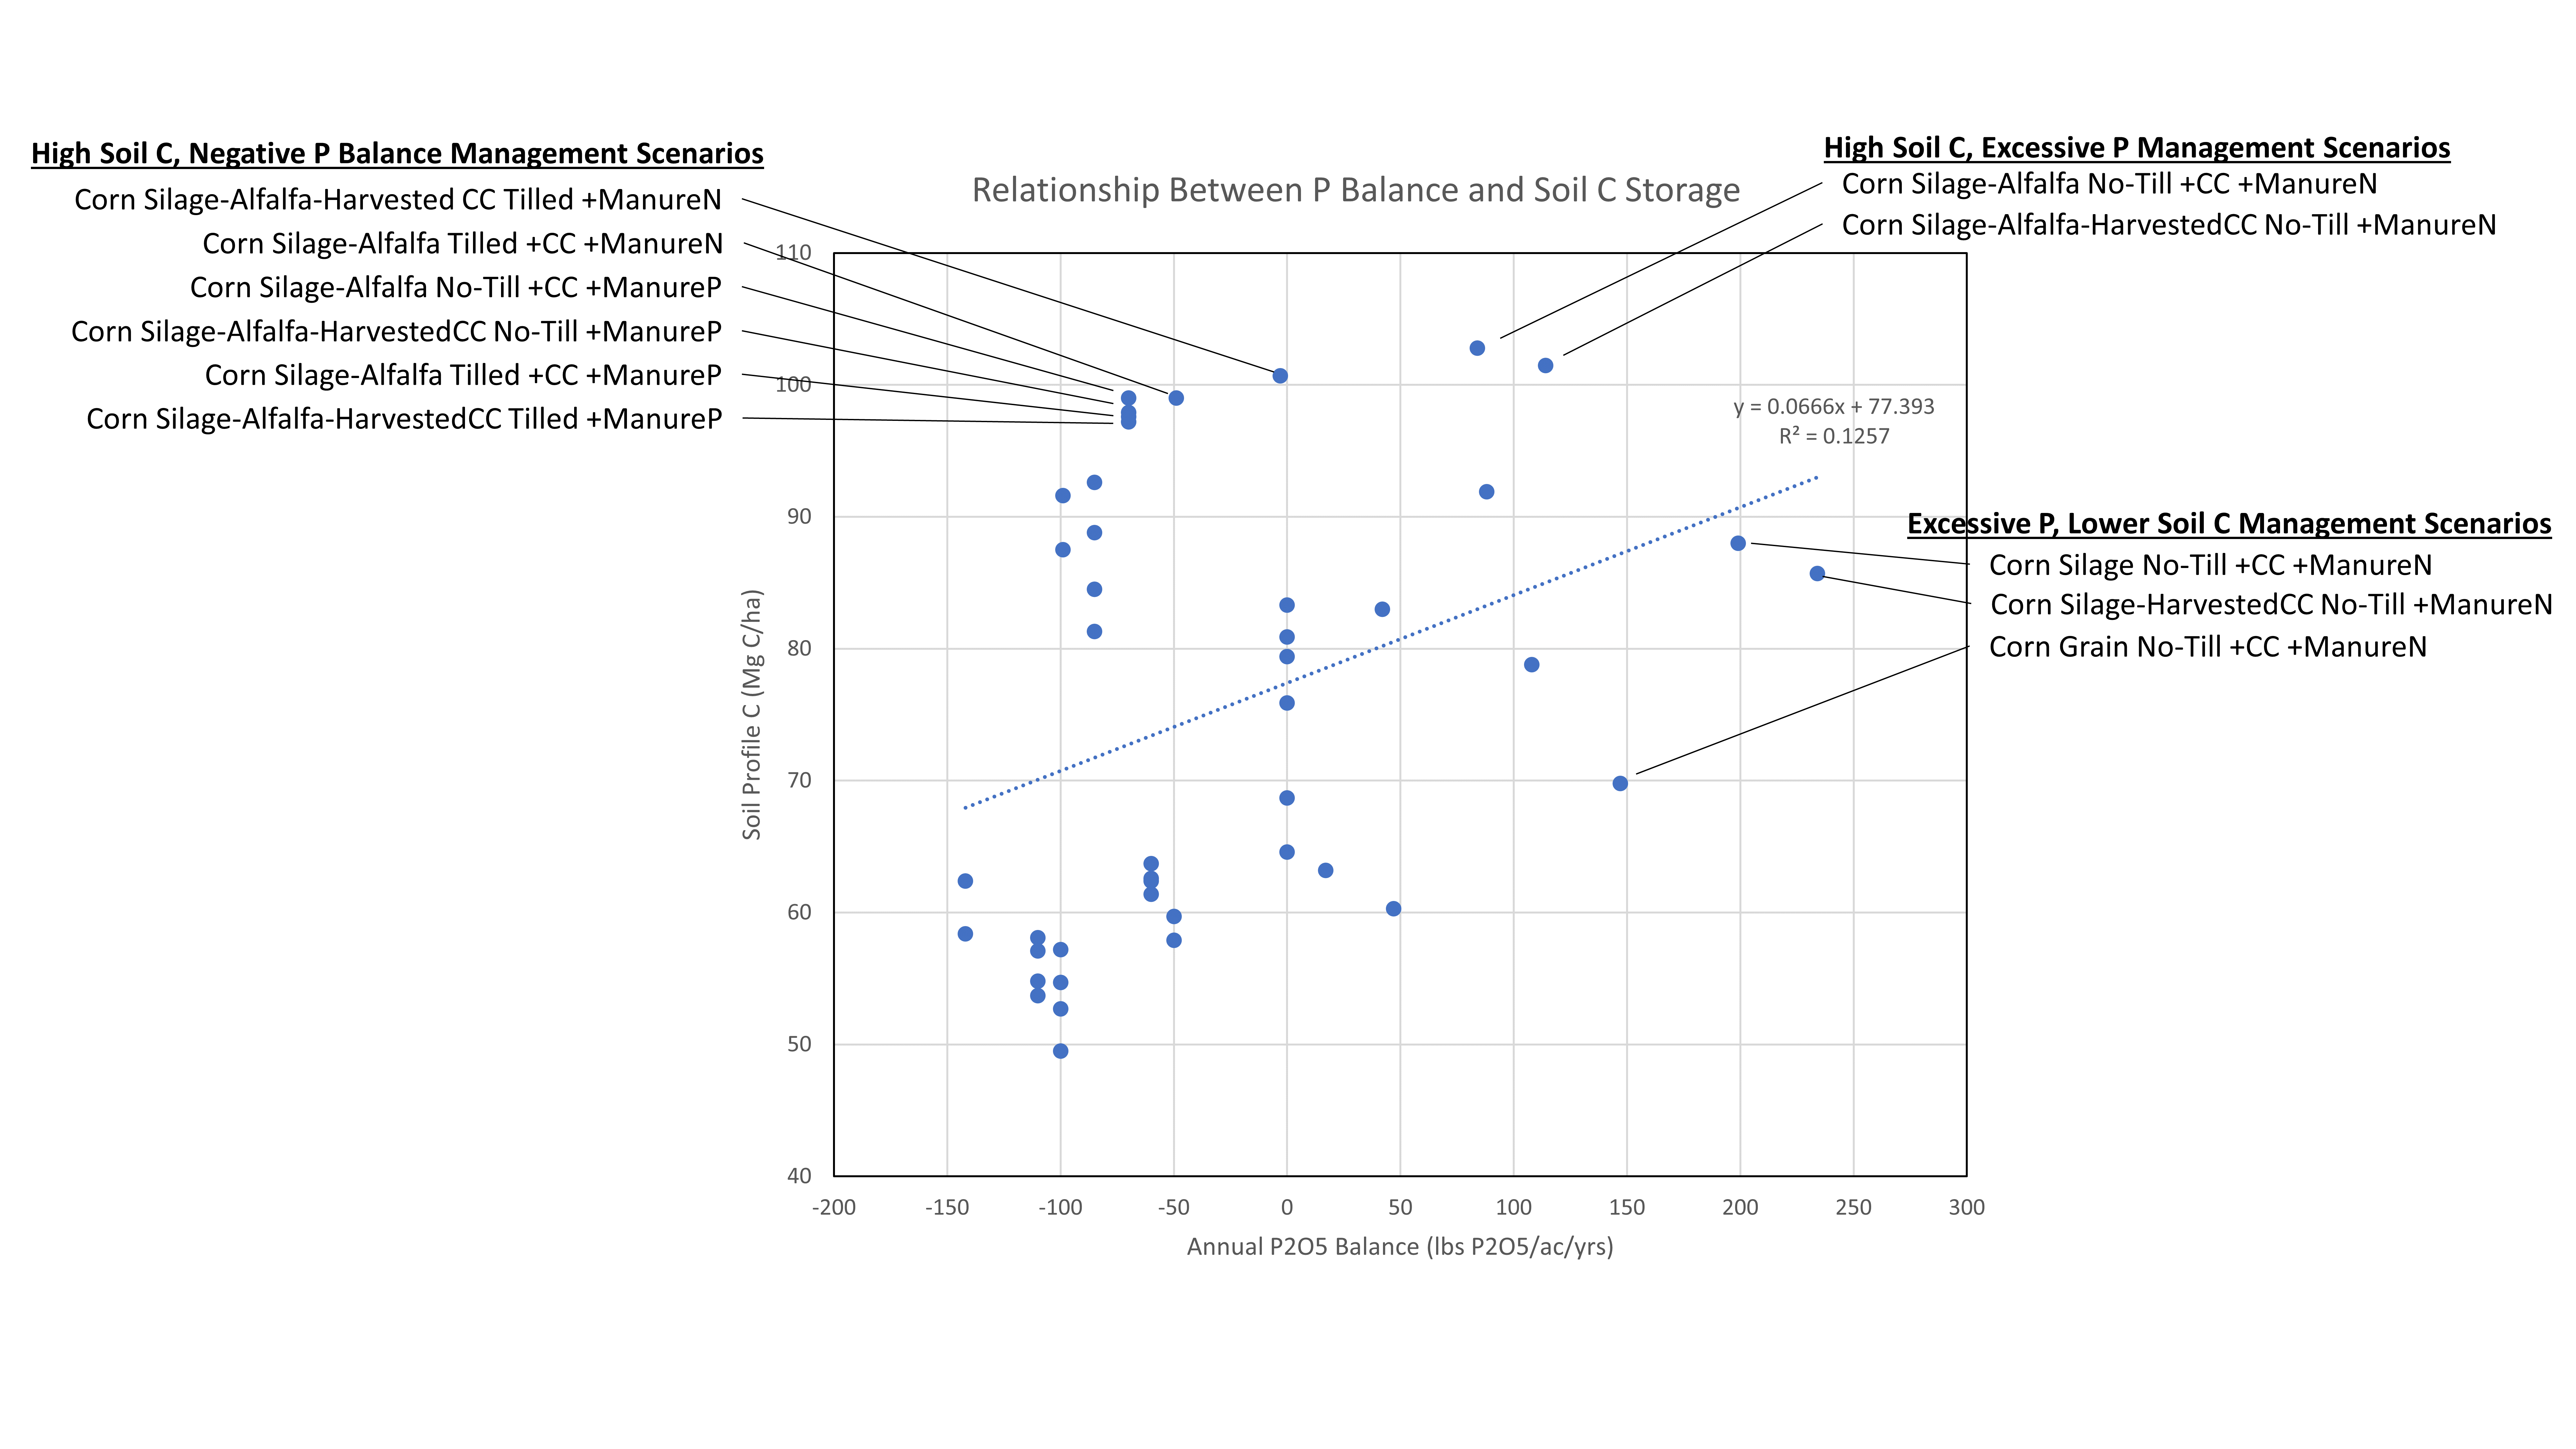
The best performing systems, with a high soil profile C and neutral or negative P balances were all corn silage-alfalfa rotations with manure used as a nutrient source. The corn silage-alfalfa rotation using P-balanced manure rates, including scenarios with and without harvested cover crops and with and without tillage were among the scenarios with high soil profile C and maintained significantly negative P balances due to P removals from the legume alfalfa crops, which did not receive manure.
Among the corn silage-alfalfa rotations that received N-balanced manure rates, there were meaningful divergences in the relative performance of C and P based on tillage method. The tilled corn silage-alfalfa N-based manure rotations maintained high soil C while also maintaining neutral or negative soil P balances. However, the no-till N-based manure corn silage-alfalfa rotations had soil P balances of +84 and +114 lbs P2O5/ac/year, with only minor gains in soil profile C compared to the other corn silage-alfalfa rotations. The substantial P excesses in these no-till rotations are due to the very high manure rates that are needed to meet the N requirements of crops when the majority of N contained in no-till applied manure volatilizes into the atmosphere.
Other rotations and management scenarios that were noteworthy poor performers due to very high excess P balances and only moderate soil C storage were the N-based manure no-till corn silage and corn grain rotations. These rotations had the highest excess P balances because of annual manure applications to corn, and because the manure rates were very high to meet the available N requirements of the crop when a significant quantity of manure N is lost due to volatilization.
Optimizing for Soil C Storage and Low N Losses
Cropping system management has the potential to create synergies or tradeoffs between soil C sequestration and N losses. The inclusion of perennials and cover crops that can take up nutrients during the shoulder seasons (fall, winter, and spring) can help reduce nitrate leaching. Tillage can have either positive or negative effects for soil profile C storage, as described previously, but no-till application of manure generally creates greater ammonia volatilization losses than manure that is quickly incorporated with tillage. The results from the Cycles simulations demonstrate several management systems that create synergies between soil C sequestration while also identifying systems that create tradeoffs and overall low performance. Figure 6 presents the management systems in rank order of their soil profile C content and plots average annual nitrate leaching losses and ammonia volatilization from each system. There was a weak trend where systems that had greater soil profile C storage had increased N losses. This is most likely related to systems with N-based manure rates having greater soil profile C storage but also causing greater N losses from those manure additions.
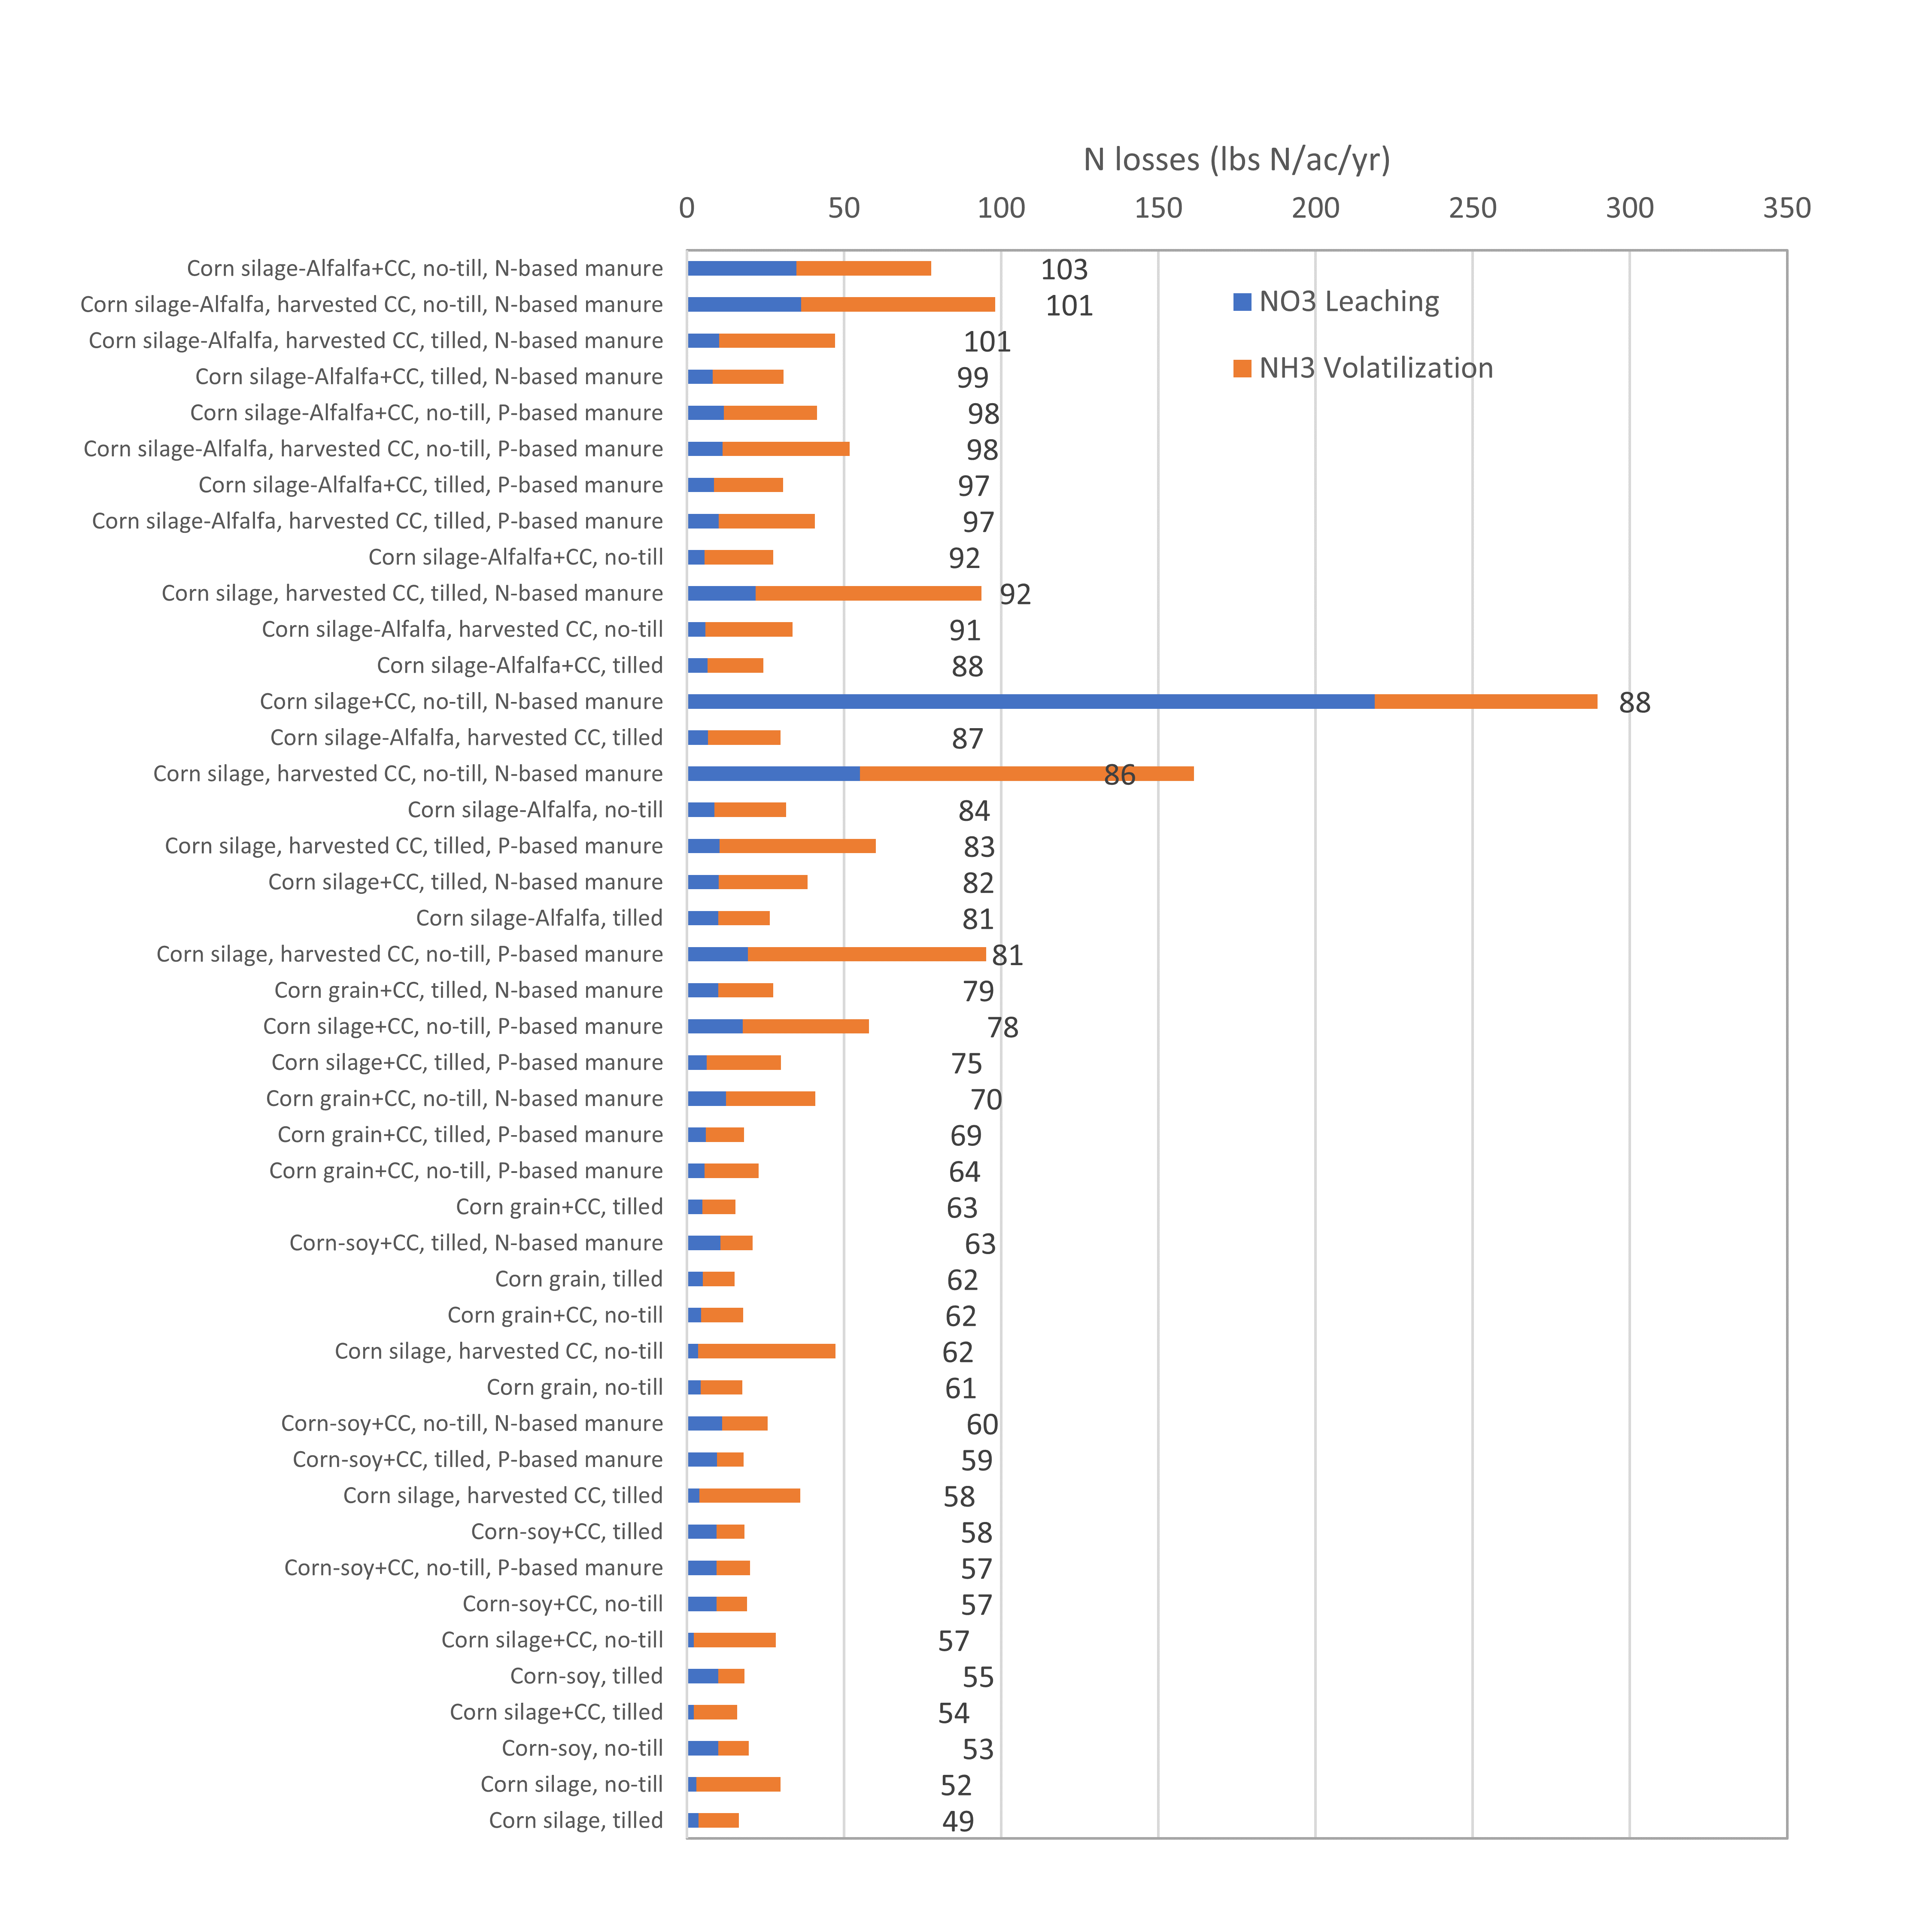
Within the weak trend, however, some systems created a high soil profile C while maintaining relatively low N losses. Corn-silage alfalfa systems managed with fertilizer, P-balanced manure rates, or N-balanced manure rates with tillage incorporation of manure generated high profile C with moderate to low N losses.
Some management systems led to high soil profile C at the expense of generating high N losses, however. For instance, the corn silage-alfalfa systems with no-till management of N-based manure applications generated the highest soil C storage, but were among the highest systems for N losses as both leaching and volatilization. Continuous corn silage rotations receiving N-based manure applications with no-till management and the tilled continuous corn silage rotation with a harvested cover crop receiving manure N all had moderately high soil profile C but very high N losses. The volatilization losses are from no-till applications of manure in the corn years of these rotations. In the tilled continuous corn silage rotation with harvested cover crops, the significant volatilization losses are from late fall applications of dairy manure to the cover crop forage, which were not incorporated with tillage. In the systems that were no-till managed, the high leaching losses may be a result of asynchrony between mineralizable N and crop demand in the corn years of the rotation. Because of the low availability of ammonium N in the no-till applied manure, manure application rates in these no-till systems had to be much greater than in the tilled systems. This leads to a significant addition of manure organic N, of which only 35% is available to the corn crop during the growing season. The remainder builds soil organic N pools, which continue to mineralize throughout the whole year. While some of this excess N may be recovered by corn through luxury uptake of N or cover crops growing during the winter, it appears that the organic N additions that occur through such high manure application rates are exceeding the capacity of the crops in the rotation to scavenge and recover N against leaching losses. Current N fertilizer recommendations only credit the residual history of continuous manure applications with 35 lbs/ac of available N, which may be too low in scenarios where significant organic N accumulations occur because of very high manure application rates.
The results from the on-farm soil sampling and Cycles modeling of soil C, N, and P dynamics highlight a number of important considerations for optimizing cropping system management. Crop rotation type had a strong effect on soil profile C balances, with the potential to double soil profile C content from the lowest performing rotations, which were continuous corn silage or corn-soy grain rotations, to the highest performing rotations of corn silage-alfalfa rotations. Increasing the prevalence of deep, high biomass rooting systems, such as occur with perennial alfalfa crops or cover crops that are fertilized and allowed to grow larger because they will be harvested for forage, is a key factor in increasing soil profile C levels. Importantly, the contributions of deep rooting systems to soil C storage may often go undetected when soil C levels are only measured in the surface 0-8” segment, as is customary for routine soil fertility sampling. Crop rotations that maintain high subsoils C contributions from root systems can also mitigate the effect of soil C saturation that occurs at the soil surface in no-till systems, which poses a limitation to the potential for soil C sequestration in no-till management.
The effect of tillage on soil profile C balances was varied. In rotations and management scenarios with limited crop residue inputs, soil profile C was greater under no-till management because of reduced decomposition rates in no-till. However, in rotations and management scenarios with high organic matter inputs, soil profile C was greater under tillage management because mixing of residues and homogenization of soil C concentration throughout the plow layer alleviated C saturation and allowed for greater C stabilization.
No-till management generated a number of tradeoffs in regard to soil profile C storage, soil P balance, and N losses when manures are applied at rates to meet the N requirements of crops. These tradeoffs were a result of the significant ammonia N volatilization losses occurring with surface applied manures. These volatilization losses are an environmental concern directly through their contribution to air pollution, but also have a secondary effect of leading farmers to apply much higher manure rates in order to supply enough available N to meet the crop requirements. These increased manure application rates lead to significant P excesses and contribute to high residual manure organic N pools which mineralize asynchronously with crop demand, resulting in high nitrate leaching losses. These results point to the importance of limiting manure application to P-balanced rates when manure is not incorporated, such as in no-till systems. Alternatively, mechanical manure injection techniques in no-till systems could be used to reduce the manure rates required to meet the N needs of crops through more effective ammonia conservation in the soil, which would have a benefit of reducing P excesses and nitrate leaching.
The results of our benchmarking simulations support our original hypotheses, as they revealed sustainable limits to soil C storage when also considering potential for P excesses and N losses, as well as regionally-specific combinations of management practices that optimize soil C-N-P functioning. In scenarios where no-till management led to greater soil C storage, N-based rates of manure led to severe P excesses and N losses. In these cases, the upper bound of sustainable soil C storage would be that which can be achieved under P-based manure rates. As a benchmark target, the soil %C in the 0-8" layer under the best performing rotation with no-till, manure P based management was 0.9% in Caroline County, Maryland, 1.2% in Carrol County, Maryland and Lebanon and Union Counties, Pennsylvania, and 1.3% in Union County Pennsylvania. The soil C benchmark targets varied based on climate and soil texture, with variation in soil texture being a stronger driver than climate. The Caroline County site had both the warmest climate and sandiest soil texture, which are both factors that reduce the C stabilization capacity. More refined analyses of a broader range of soil textures within each climate regime would help to identify soil C benchmarks in a wider range of soil textures. In the cooler climates where tillage incorporation of C inputs to the soil surface can alleviate C stratification, manure N-based rates can be used sustainably in some rotations because there is less N volatilization and consequently manure rates used to meet N needs are lower than in no-till production, leading to a better P balance. The particular combination of tillage and N-based manure rates in corn-alfalfa rotations raised the sustainable soil %C targets by 0.1 percentage points in the Pennsylvania locations. N-based manure rates in the continuous corn silage, corn grain, and corn-soy rotations still led to excess soil P balances.
Education
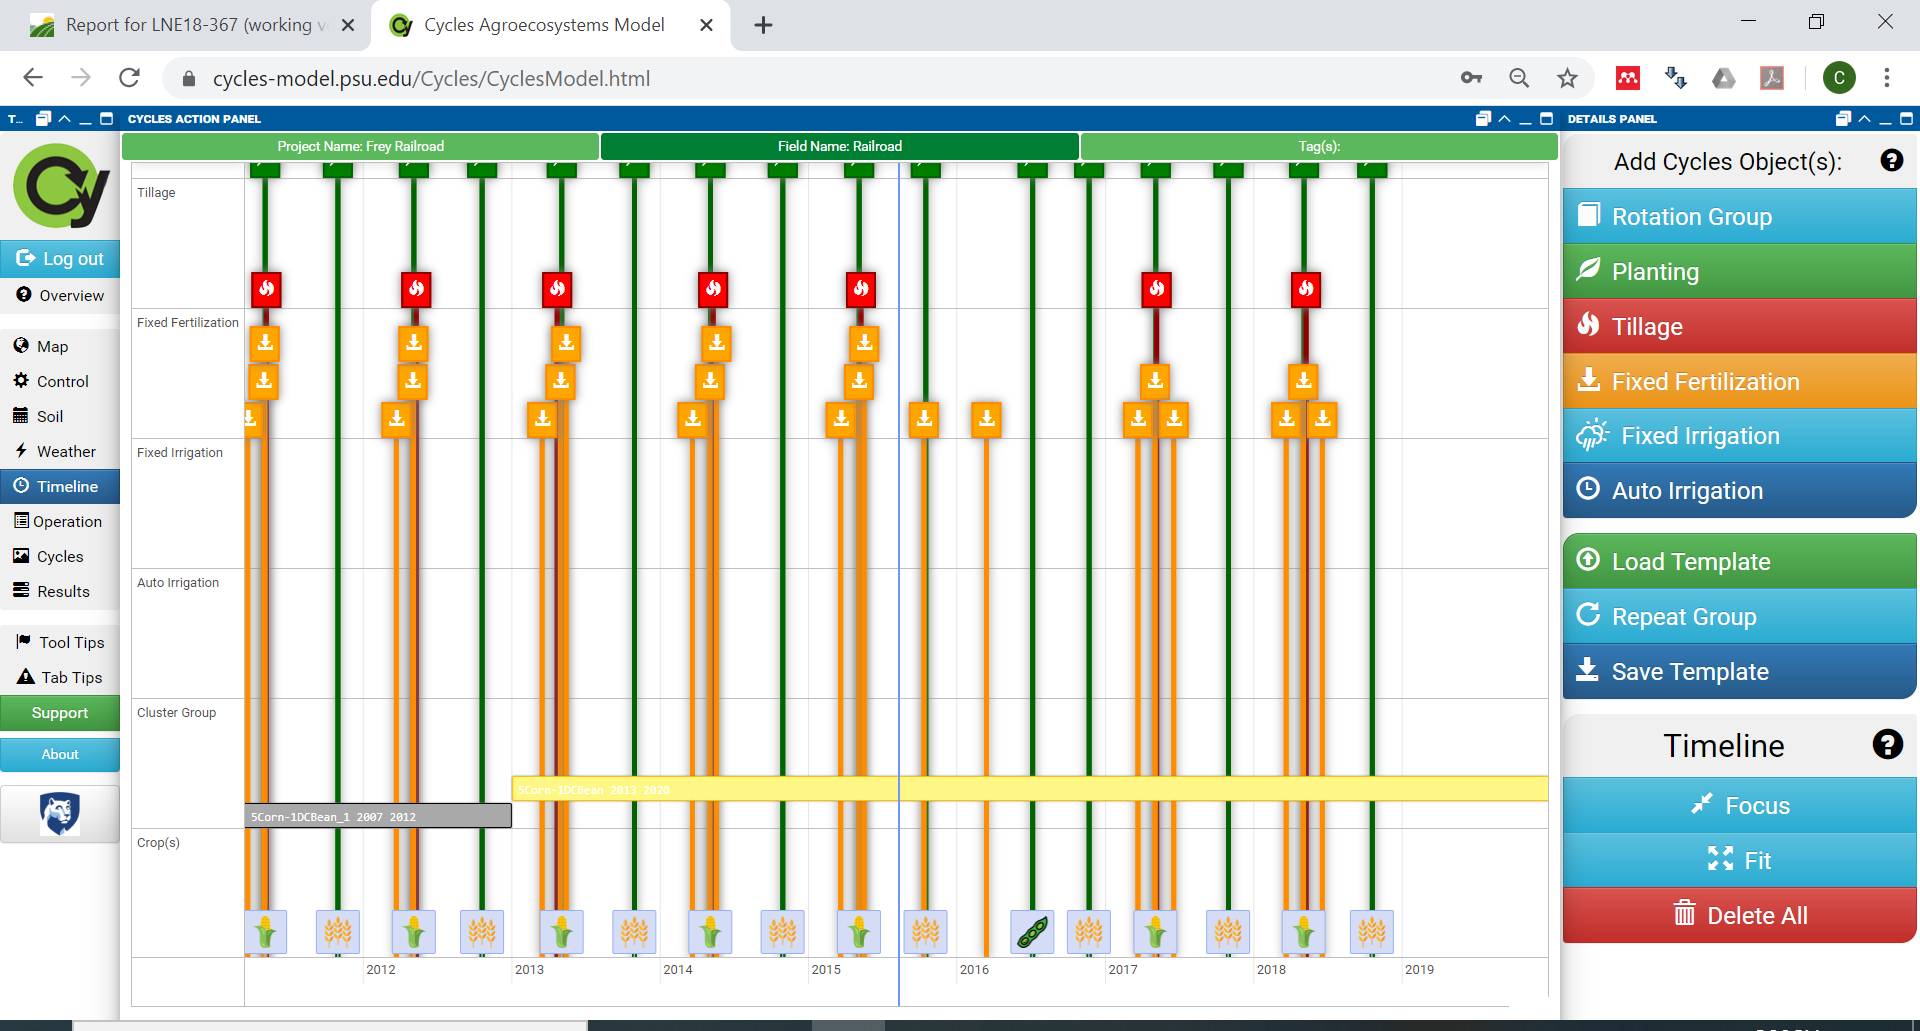
An important component of our initially planned educational outreach was to train farmers in the use of the Cycles cropping system model. We dedicated a significant amount of project resources in 2019 to creating an online interface for the model (find the tutorial for use of the Cycles Online Interface here). Figure 7 shows the timeline feature, one part of the current interface, which allows users to drag and drop different management practices, such as crop planting, tillage, fertilizer, and manure additions onto a calendar. Farmers select the location of the field on a map and the interface will load the soil type for the farm as well as the weather history back to 1980. Users can than "submit" the management scheme created in the timeline to the model and then evaluate the output through various figures that depict soil C and N cycling processes over time.
We had planned to use the online model for a series of small farmer trainings in late-March 2020, however those meetings were canceled at the last minute due to the COVID-19 outbreak. The pandemic restrictions on in-person educational programming set us back significantly in planned educational outreach for this project. We were able to provide a one hour educational training through an online presentation at the 2020 Mid-Atlantic Crop School in November 2020. This training session did not teach the audience how to use the model, rather a short demonstration of the online interface was provided to demonstrate the capabilities. Results of simulations done with the model were then shared through PowerPoint slides. The Ag Service Providers attending the session had positive reviews of the content and expressed interest in attending a more in depth training session about the online model interface. However, due to an inability to schedule in-person training sessions during the pandemic prevented us from initiating training sessions to use the model.
Concurrently with the restrictions on in-person activities, we learned from informal conversation with extension educators and farmers that access to running a cropping system model was of limited interest due to lack of computer skills and little time available for such involved computer endeavors. Rather, our audience preferred to read fact sheets about soil carbon cycling processes and see the distilled results of model simulations for different common management practices to determine how they affected soil C, N, and P dynamics. This desire to see results from simulations that were already run fit well with the objectives of our soil C benchmarking, so we abandoned the idea of hosting workshops on using the model in favor of using our project resources to complete the soil C benchmarking and developing a fact sheet to disseminate those results.
While we worked on the soil C benchmarking simulations, we also gave conference presentations about soil C dynamics to audiences of certified crop advisors at the University of Maine Lunch and Learn webinar series in March 2021 and the Keystone Crop and Soils Conference in Grantville, PA in October 2021. Finally, we will be giving presentations about results from the project at two farmer-oriented conferences in Lebanon, PA and Westmoreland, PA in winter/spring of 2022, which we recognize are outside the period of performance for the project.
Milestones
1. 1,000 agronomic crop farmers learn about the project to optimize soil carbon, nitrogen, and phosphorus (C-NP) inputs and losses and receive an invitation to participate in the educational program and on-farm soil sampling and data collection. (August 2018)
1000
4000
4000
August 31, 2018
Completed
October 29, 2019
On October 29, 2019, we published a newsletter article in the Penn State Extension Field Crop News describing the research project and inviting farmers to contact us to participate in soil sampling activities and attend educational workshops. The newsletter article was sent to a list-serv of 8000 individuals, which is a composite of farmers and ag service providers. We estimate that 4000 of the list-serv members are farmers. We also promoted the project at a soil health breakfast meeting in Clinton County, PA on January 4, 2020 attended by 12 farmers.
2. 200 farmers sign-up to the project e-mail list to receive notifications of educational events and reports of project results; 20 farmers respond to invitation for on-farm soil sampling and data collection. (October 2018)
200
12
2
October 31, 2018
Incomplete
We received a very tepid response to our newsletter announcement about the project, unfortunately. Only two individuals, both ag service providers, responded directly to our newsletter article inviting participation in the project. However, through word-of-mouth interactions we were able to promote the project to farmers and recruit interest in soil sampling activities. Through local extension educator and the personal networks of project personnel, in Pennsylvania we recruited twelve farmers to participate in soil sampling over the duration of the project.
3. 50 farmers attend an on-farm field day (November 2019) and 50 farmers attend a workshop (February 2020) where they learn how C-N-P cycles are coupled, how to evaluate C-N-P dynamics on their farm with soil testing, and how to optimize C-N-P dynamics through cropping system management.
50
February 29, 2020
Incomplete
We had to cancel the two workshops that were planned for March 2020 due to the onset of the COVID-19 pandemic. Due to the technical nature of teaching the simulation model, we did not try to pivot these workshops to an online format. Due to the unresolved nature of the COVID-19 pandemic through the remaining duration of the project, we did not attempt to reschedule these workshops. We also learned through further communication with our stakeholders that interest in learning to run the Cycles computer model was low and did not warrant investment of time in developing a workshop. Rather, we focused our time on running a set of predetermined cropping system simulations to distill the results for farmers into a written fact sheet that they can learn from.
4. 50 farmers attend a webinar and learn how to use an online cropping system model to simulate management effects on C-N-P dynamics. (March 2020)
50
250
March 31, 2020
Completed
January 31, 2022
We provided a one hour presentation during the 2020 Mid-Atlantic Crop School which was attended by 194 ag service providers. The presentation gave a demonstration of the online tool and discussed how to manage soil carbon in relation to nitrogen and phosphorus. We also gave a one hour presentation to 40 Certified Crop Advisors at the Lunch and Learn Webinar Series hosted by the University of Maine Extension in March 2021. Finally, we gave a one hour presentation to 16 Certified Crop Advisors at the Keystone Crop and Soils Conference in October 2021.
Originally the webinar in this performance target was planned to be delivered to farmers, but we realized in the process of developing the online model that it may be too difficult for farmers to learn to use the model remotely. Instead, we had an opportunity to provide a training to ag service providers at the Mid-Atlantic Crop School, the Maine CCA Lunch and Learn Webinar Series, and the Keystone Crop and Soil Conference, which served as a gauge to test the reception of the model. The presentations were well received, particularly regarding learning about the fundamental processes of soil C stabilization.
Of the Mid-Atlantic Crop School webinar attendees, 99 increased their knowledge of the forms of carbon in the soil, 122 increased their knowledge of factors affecting carbon stabilization, 128 increased their knowledge of methods to measure soil carbon, and 104 increased their knowledge of management practices to increase soil carbon.
99 attendees reported that their likelihood to discuss soil carbon management with their farmer clientele increased as a result of attending the presentation, and they expected to share information from the presentation about soil carbon management with 3,324 farmers managing 2,377,804 acres during the next year.
5. 25 farmers contact a project team member to receive technical support on how to monitor and manage C-N-P dynamics on their farm. (July 2020)
25
1
2
July 31, 2020
Incomplete
We had a meeting with TeamAg consulting in Spring 2021 to discuss how to measure soil carbon dynamics as part of the regenerative farming business plans they are developing for their customers. We had hoped that through this partnership we would be able to reach farmers with managing C, N, P dynamics on their farms but we lost touch with TeamAg. We were also approached by the farm managers of Penn State Farm Services, the commercial farming operation that managements 2,000 acres of cropland owned by Penn State about how to increase soil C storage as part of the university's strategic plan to reach net zero carbon emissions. We had several meetings with these farm managers in 2021 and are planning to share results of the soil C benchmarking simulations done with the Cycles model with this group in 2022. The limitations posed by the COVID-19 pandemic on interacting with our farmer audience hindered our ability to complete this milestone successfully.
6. 75 farmers evaluate their soil organic matter levels using an interpretation key (e.g. low, medium, high levels) that accounts for climatic and soil textural controls on soil C storage. (December 2020)
75
December 31, 2020
Incomplete
We were only able to complete our soil C benchmarking simulations, which provide a context to interpret soil C levels, in January of 2022. Given the late delivery of this product, we were not able to engage with farmers in sharing these benchmarks during the project period. However, we have two farmer workshops scheduled for Spring 2022 where we will be sharing this information, and we are planning to develop a fact sheet with results from the project. We expect that there will be durable educational resources developing from this project that will ultimately lead to success of the overall performance target. But we cannot claim completion of this milestone within the official performance period of the grant.
7. 25 farmers use an online cropping system model to simulate management effects on C-N-P dynamics. (December 2020)
25
December 31, 2020
Incomplete
As described earlier, through conversations with farmer and service provider stakeholders, we realized that there is little desire amongst the target audience of practitioners to actually use a computer simulation model directly. While the importance of simulation models in evaluations soil C, N, and P dynamics is appreciated by these audiences, they would prefer that trained researchers run and evaluate the model outputs, and distill these results into a written fact sheet that they can learn from. After realizing this, we switched our efforts into develop a robust set of simulations that cover common management practices and are distilling the results into a fact sheet that can be share with the target audience.
Milestone activities and participation summary
Educational activities:
Participation summary:
Learning Outcomes
99 ag service providers increased their knowledge of the forms of carbon in the soil, 122 increased their knowledge of factors affecting carbon stabilization, 128 increased their knowledge of methods to measure soil carbon, and 104 increased their knowledge of management practices to increase soil carbon.
99 ag service providers reported that their likelihood to discuss soil carbon management with their farmer clientele increased as a result of attending the presentation, and they expected to share information from the presentation about soil carbon management with 3,324 farmers managing 2,377,804 acres during the next year.
Performance Target Outcomes
Target #1
50
implement a cropping system management change to optimize soil C-N-P dynamics
5,000 acres
increasing soil C by 5 tons/acre in the long-term while reducing nitrate-N leaching by 12 lbs/acre/yr and P runoff by 1 lbs/acre/yr (a 50% reduction of both).
8
implementing no-till, growing cover crops, adding a hay crop in rotation
8,100 acres
19,135 tons of new carbon sequestered in the soil. 19,400 lbs of N leaching reduced per year.
Although we had limited engagement directly with farmers due to meeting restrictions during the COVID-19 pandemic, we did three high impact presentations to an audience of certified crop advisors in Pennsylvania, Maryland, and Maine. To assess the performance target, in January 2022 we surveyed 134 of the participants from these workshops to determine the extent to which they shared information from the project with their farmer stakeholders, and the extent to which those farmers made management changes based on the information the service providers offered them.
Of the 134 service providers receiving the survey, we received 12 responses. Of these respondents, four indicated they shared information about fundamental carbon cycling processes, seven indicated they shared information about management practices affecting soil carbon, and two indicated they shared information about methods to measure soil carbon. The survey respondents together shared information from the project to 140 farmers managing 54,200 acres. The types of farmers receiving this information were grain and hay producers, dairy and other livestock producers, potato producers, and mixed vegetable producers.
Three of the ag service provider respondents indicated that they were aware of farmers who made a management change based on information that was provided to them. In total, the survey respondents identified 8 farmers who made a change on 8,100 acres. This included implementing no-till on 7,500 acres, cover cropping on 7,000 acres (also included in the no-till acres), and integrating hay into the rotation on 500 acres. One survey respondent accounting for 100 reported acres of management change did not report the specific change that was made.
We used results from our C-N-P benchmarking to estimate the environmental effect of these management changes. For soil C sequestration, we found that the effects of no-till management varied based on the management context, with sometimes positive effects and sometimes negative effects. Without more detailed information about the management context of the 7,500 acres of reported no-till implementation, we cannot assign a soil C value to those practices. Our benchmarking indicated that cover cropping increased soil C levels of the soil profile by 1.78 tons/ac, on average. Multiplying 7,000 acres of new cover cropping by this value yields 12,460 tons of soil carbon sequestered due to cover cropping. For the 500 acres that implemented a hay crop in the rotation, our benchmarking indicated an average increase in soil carbon of 13.35 tons C/acre, for a total of 6,675 tons of soil carbon sequestered by the hay crop.
For reductions in nitrate leaching, our benchmarking simulations indicated that the addition of cover crops under fertilizer managed systems reduced nitrate leaching by 1.2 lbs N/ac/year. In our benchmarking, cover crops were added as the first of a suite of stacked management practices, and we did not isolate the effect of cover crops alone in manured systems. Because manured systems experience greater N losses, we expect the nitrate leaching reductions due to cover crops to be greater when implemented in manured systems. Therefore, we feel our value of 1.2 lbs N/ac leaching reductions is a conservative estimate. Multiplying this effect by 7,000 acres of new cover crops results in nitrate leaching reduction of 8,400 lbs/ac/yr. Adding a perennial hay crop to a rotation also reduced nitrate leaching. Our benchmarking simulations indicated that on average, a hay crop reduced nitrate leaching by 22 lbs N/ac/yr compared to rotations with only annual crops. Multiplying 500 acres of hay crop additions by 22 lbs N/ac/yr leaching reductions yields 11,000 lbs/ac/yr of nitrate leaching reductions.
Additional Project Outcomes
The following is a quote from the performance target verification survey filled out by ag service providers who attended one of the three presentations we gave as part of the educational component of the project:
"Dr White's presentation on how organic matter (OM) builds in soil has completely changed how I present OM management with my farmers. For years I told them that it was slow to degrade lignins and cellulose type compounds that build up. I also taught them that it was always best to only go no till and never till a soil. After watching Dr. White's presentation, I now better understand better how OM builds in soil, and I teach OM management differently. I teach them that you can occasionally till a soil and it brings up fresh mineral surfaces for OM to adsorb to. I now understand why my two farmers, a dairy and potato farmer who share 860 acres of land have increased OM in their soils faster than any other farmers even though potatoes are in the rotation ever third or fourth year. Thank you Dr. White!"