Final report for LNE19-374
Project Information
Lowbush (wild) blueberries are grown commercially on 41,000 acres in Maine by 485 farmers. The price of conventional frozen wild blueberries reached a record low $0.27/lb in 2017, a price that does not justify crop maintenance. Meanwhile the crop grown organically can be sold frozen for $1.00 to $1.35/lb and sells for at least $5.00/lb fresh. Small organic growers are stuck with low yields and large organic-transition farms will struggle with low prices until effective organic fertility and weed management strategies are developed and disseminated effectively. At a pH of 4.0, most soil applied fertility is not available for blueberry plants and the nutrients fuel weed species to be more competitive. The weed management tools available for organic growers are limited to sulfur applications, weed whacking, and hand weeding. Furthermore, the shallow blueberry root system and very well draining soils are susceptible to drought conditions that non-irrigated fields have experienced over the last five seasons.
This project studied tine weeding and winter-kill cover cropping as organic weed management tools and organic soil amendments to boost organic fertility on four farms in randomized complete block designs, replicated 8 times. Nineteen organic farms (1,000 acres) adopted a weed management practice including sulfur application, prescribed burning, and/or mulch application. Additionally, 19 of 39 (49%) of organic and conventional respondents to a 2023 survey indicated that they adopted an organic weed management tool over the last 5 years. Our research determined that tine weeding disturbed wild blueberry rhizomes too much but that two passes disturbed cool season broadleaf weeds best. Common oats were the more successful cover crop species and a seeding rate above 1,000 lbs/ac was needed to grow a good coverage cover crop in this system due to the low germination rate in acidic soils. The fertility research aspect of this project determined that applying any form of organic mater (mulch, compost, soil) was beneficial to wild blueberry. Organic matter applications reduced leaf spot disease and increased bud counts per stem and stem heights. Twelve organic educational sessions were held over the course of this project at in-person field days and virtual webinar series that reached a total of 483 people. Participants, agricultural service providers and researchers are now able to access an updated wild blueberry production guide and two published papers as a result of this project.
Partially as a result of this project, the number of certified organic wild blueberry acres in Maine has increased from 1,800 acres in 2018 when the total organic yield was 740,000 (411 lbs/acre) to 3015 acres in 2022. In 2021, total organic yield was 1.5M lbs on 2,636 acres (569 lbs/acre).
Fifty blueberry growers in Maine will adopt at least one new weed, nutrient, or irrigation management practice on a total of 500 acres. Among these growers, 5 managing certified organic farms will increase their average yield by 500 lbs/acre on a total of 100 acres. Additionally, 500 acres of conventional blueberry land will adopt practices necessary to transition to certified organic production.
Project A: Nutrient Management
Given the significant market declines for wild blueberries in the U.S. conventional market (USDA NASS 2018), interest in organic production was growing when this project began and continues to do so. Growing wild blueberries under certified organic standards is challenging because there are a limited number of fertilizer and pest management tools approved for use.
The effects of various organic amendments applied in wild blueberry systems have been previously studied. These included manure (Warman 1987), papermill sludge (Gagnon et al. 2003), gypsum (Sanderson and Eaton 2004), biosolids (Lafond 2004), municipal solid waste (Warman et al. 2009) and seafood-waste compost (Mallory and Smagula 2014). However, these studies produced variable results regarding blueberry productivity and marketable yield with few significant effects on soil organic matter or leaf nutrient concentrations. These studies demonstrated the need to investigate other organic alternatives at different rates and timings to better understand their cost-effectiveness and ability to aid in water retention and nutrient availability.
Factors that affect nutrient uptake in wild blueberries include weed presence, soil pH, water availability, and the presence of soil nutrients (Drummond et al. 2009). Wild blueberries compete with weeds for space, water, and nutrients, which can result in reduced crop yields and limited blueberry spreading if left unmanaged. Insects and disease pests can also benefit from nutrients applied to wild blueberry and in turn increase damage caused in blueberry plants. The low soil pH (4.0-4.5) of commercial wild blueberry fields does not allow critical nutrients like nitrogen, phosphorus, and potassium to be readily available to wild blueberry plants (Peterson 1982). Therefore, organic growers rely on soil biology to break down applied organic matter in order to increase nutrient availability in crop fields. This study aimed to identify materials that improve soil water holding capacity and nutrient availability for wild blueberries.
In this study we evaluated the efficacy of four organic soil amendments and one foliar spray treatment for their impact on wild blueberry growth and pest presence. This study focused primarily on enhancing nutrient availability in organic wild blueberry systems rather than applying methods to directly manage pest populations. Because the materials applied may have benefited pests, pest monitoring was a key aspect of this study. We sought to develop a better understanding of the relationship between wild blueberry nutrient inputs and pest presence in order to aid future recommendations for organic wild blueberry growers.
Project B: Weed Management
Due to the low prices of conventional frozen wild blueberries (2014-2018 mean = $0.40/lb) and increasing demand for organic wild blueberries, there are now 52 certified organic wild blueberry farms in Maine. While this group only accounts for 11% of all Maine wild blueberry farms, they are able to sell frozen berries at a higher price ($5.00 - $19.80/lb). Finding cultural and mechanical methods of weed management is important for all wild blueberry growers whether they are considered small, large, organic or conventional. Small organic growers were stuck with low blueberry yields because they did not have effective OMRI approved herbicides. Large organic-transition and conventional farms were in search of transition methods and low residue practices due to market demand.
To date, the University of Maine has found that removing weeds from a wild blueberry field can double yield in the conventional system (Yarborough 1997). Applying sulfur to reduce soil pH to 4.0 in the wild blueberry system is a very effective way of culturally reducing grass species (Saunders 2016 and Yarborough 1997). Soil pH reduction is a slow process which takes 2-3 years and one that does not reduce woody weeds as well as grasses. Removing woody weeds three times per season via mowing, weed whacking, and/or hand pulling is the most effective method of mechanical weed management to date (Drummond et al. 2012).
This four-year study explored tine weeding and winter-kill cover crops as mechanical and cultural weed management tools for the wild blueberry system. A flex-tine weeder is a tractor attachment with metal fingers called “tines” that drag through the top one inch of soil dislodging weed seedlings (Figure 1). Tine weeding is used on vegetable and small grain farms in early spring just as the first winter annual weed seedlings emerge. The stiffness of tines allows them to break through the soil crust and the vibration of tines uproots weed seedlings (Bowman 1997). Flex-tine weeders were designed to dislodge white thread stage weeds when the machine is run at a “fast” speed.
Cover cropping is defined as the planting of another plant species among or alternating with the cash crop. There are numerous benefits of cover cropping, a few of which include weed suppression, erosion management, soil organic matter builds up, increased soil water holding capacity, and habitat for natural enemy and pollinating insects. Several species of cover crop have been explored to meet the needs of different cropping systems. In wild blueberry production, planting a cover crop that would then become a weed would not be wise. Therefore, we were interested in “winter-kill” cover crop species that are planted in the late summer and die over the winter such as common oat (Avena sativa) or sorghum-sudan grass (Sorghum × drummondii). As the cover crop species grows in late summer through early fall, organic matter was created. After the cover crop died, it fell to the ground creating a vegetative mat with the potential to suppress weeds (Clark 2007).
Cooperators
- (Researcher)
- (Researcher)
Research
We hypothesize that the execution of timely organic nutrient and weed management strategies will increase wild blueberry yields. In turn, this will improve the economic and environmental sustainability of this native crop. We seek to build upon recent research conducted (FNE14-808, ONE14-222) and expand our knowledge of the organic wild blueberry system for the long-term benefit of all berry growers in the Northeast.
Project A: Nutrient Management
This project is replicated at three farm locations that were selected to represent three scales (small, medium, and large) and the three major wild blueberry growing regions (Mid-coast, Ellsworth, and Downeast) in Maine. The experimental design is a randomized complete block replicated six times. Each plot is 6’ by 30’ (180 ft2). A total of 54 plots and 9 treatments are located at each site (Table 1). The foliar fertilizer and chicken manure were applied at the recommended time and rate according to the label and company representative instructions. The Cobscook blend, mulch, and compost were applied according to recommendations from University of Maine Extension Educator Mark Hutchinson (personal communication, 2019). All products were applied one time except for the foliar fertilizer which was applied multiple times as recommended by the manufacturer.
All products were applied during the prune cycle of 2019. The foliar fertilizer was applied three times – once during the emergence, tip dieback, and bud development stages of wild blueberry growth at each site. It was applied on: June 19th, July 15th, and August 27th in Hope; June 24th, July 19th, and August 28th in Columbia Falls; and June 4th, July 18th, and August 30th in Surry. Chicken manure was applied on June 4th in Surry, June 5th in Hope, and June 12th in Columbia Falls. The Cobscook blend was applied on June 20th in Hope, June 24th in Columbia Falls, and June 26th in Surry. Mulch was applied on July 23rd and 24th in Columbia Falls and Surry, respectively. UMaine compost was only applied in Hope on June 19th. See Table 1 for product details.
Table 1. Treatments tested at each of three organic farms in a randomized complete block design with 6 replicates.
|
Product |
Rate |
Rate Type |
Crop Cycle |
% NPK |
|
Control |
N/A |
N/A |
N/A |
N/A |
|
North American Kelp Co. Seacrop16 Foliar Fertilizer |
1.2 L/242 gal. H2O/A |
N/A |
Prune |
0.18% N 6.37% P 4.89% K |
|
N/A |
Crop |
|||
|
North Country Organics Cheep Cheep Chicken Manure 4-3-3 |
1089 lbs./A |
Low |
Prune |
4% N 3% P 3% K |
|
2178 lbs. /A |
High |
Prune |
||
|
Coast of Maine Cobscook Blend Garden Soil |
7.5 yd3/A |
Low |
Prune |
0.4% N 0.14% P 0.12% K |
|
15 yd3/A |
High |
Prune |
||
|
*Mark Wright Disposal Dark Brown Mulch |
7.5 yd3/A |
Low |
Prune |
N/A |
|
15 yd3/A |
High |
Prune |
||
|
**University of Maine Compost |
7.5 yd3/A |
Low |
Prune |
0.41% N 0.11% P 0.10% K |
|
15 yd3/A |
High |
Prune |
*Only applied at Columbia Falls and Surry locations, % NPK analysis not completed
**Only applied at Appleton location
NPK represented as total nitrogen, phosphorus as P2O5, and potassium as K2O
Data Collection
Physiology and Morphology
All four years of this project, at each site, six stems from each plot were randomly selected to measure their leaf chlorophyll concentrations and photosynthetic electron transport rates on June 10 – 12, 2022. Chlorophyll concentration was measured by a CCM-200 plus chlorophyll content meter (Opti-Sciences, Inc., Hudson, NH, USA). Photosynthetic electron transport rates were measured in leaves from six stems in each plot by a Y(II) meter (Opti-Sciences, Inc., Hudson, NH, USA) on June 10 – 12, 2022 between 10:00 and 2:00pm.
Eight random stems from each treatment plot were collected to quantify the number of leaves on each stem, leaf size, dry biomass, and nutrients. Leaf area of three leaves at three different positions (top, middle, and bottom) from each of those stems was determined using a LI-3000A area meter (Li-Cor, Lincoln, NE, USA). All the leaves from those eight stems were combined with other leaves from those eight stems, oven-dried at 70°C to constant mass and weighed, then were ground and sent to the University of Maine Soil and Plant Tissue Testing Laboratory in Orono, Maine for nutrition analysis. Leaf mass per area (LMA) was calculated by dividing leaf dry mass by leaf area (g/m-2).
Pest Presence
Insects, weeds, and disease were monitored in the same 0.37 m2 quadrats (two per plot) throughout each field season. In the 2019 prune year, pest scouting occurred once each in July, August, and September at each of the three locations. In the 2020 crop year, pest scouting occurred once each in May, June, and July at each of the three locations. In 2021, pest scouting occurred once each in June, August, and September at each of the three locations. In 2022, pest scouting occurred in Appleton and Surry in May and June and at Columbia Falls in May and July.
Pest severity for weeds, insects, and disease were quantified as percent cover using equal interval ranks between 0 and 6, where: 0 = not present, 1 = ≤1%-17%, 2 = 17%-33%, 3 = 33%-50%, 4 = 50%-67%, 5 = 67%-83% and 6 = 83%-100%. In 2020 - 2022, the number of wild blueberry stems with insect or disease damage were also identified and counted in addition to ranking severity using the same equal interval ranks.
In 2019, weeds were classified into two categories (grass or broadleaf) and in 2020 - 2022, weeds were identified by genera and counted to obtain weed number per quadrat. Insects were counted when an individual or their distinctive damage was observed. Diseases were similarly identified by distinctive characteristics. Fruit flies (BMF and SWD) were not quantified.
Crop Productivity
Blueberry cover was quantified at the same time as each pest scouting by using the same 0-6 equal interval ranking. In the 2019 prune year, stem heights and the number of buds per stem were recorded for eight random stems per plot at all locations late August to early September. This was done again in the 2021 prune year, with measurements recorded in late September. In the 2020 crop year, fruit-set and fruit-drop were monitored with repeated measures on the same four stems per plot. In the 2022 crop year, bud development, fruit-set, and fruit-drop were monitored with repeated measures on the same three stems per plot. The stems monitored in 2022 were not the same stems as were monitored in 2020.
The 2020 harvest took place on August 3, 6, and 11 in Appleton, Surry and Columbia Falls, respectively. The 2022 harvest took place on July 26, 28, and August 3 in Appleton, Surry, and Columbia Falls, respectively. In both 2020 and 2022, yield weights, Brix measures, and 100 berry counts were collected.
Data Analysis
The effects of the applied organic treatments on soil moisture, physiology (chlorophyll concentration and photosynthetic electron transport rate), and morphology (leaf size and leaf mass per area) of wild blueberry plants were statistically compared using a general linear model followed by LSD (least significant difference) post-hoc test in SPSS software (α = 0.05). In this model, the main effects of applied treatments were considered as a fixed factor, experimental blocks as a random factor, and a Bonferroni correction was also applied for confidence interval adjustment. Each site (Appleton, Surry, and Columbia Falls) was analyzed individually over 2 crop years (2020 and 2022).
Ranked blueberry cover and pest cover data were transformed to their corresponding percent mid-point. Ranked blueberry cover, pest cover and pest counts (#/m2) were compared across all years (2019 – 2022) using a full-factorial repeated-measures mixed model design, followed by a Tukey’s Pairwise Comparison in JMP (JMP®, Version 15.2, SAS, Cary, NC, USA). Here, the full factorial tested the effects of date, treatment, and any interaction between date and treatment for the ranked response variables. Additionally, crop phenology, harvest yield and berry quality measures were compared across the two crop years (2021 and 2022), full-factorial repeated-measures mixed model design.
Due to the nature of count data collected in the field (which often has a high number of zeros creating a skewed distribution) much of our data failed the assumptions of normality and equal variance often required to run parametric statistical tests. All data were transformed with a square root transformation prior to any statistical testing. Ranked data and pest count data, as well as harvest yield and phenology count data visually improved following transformation, but the data continued to statistically fail for normality. Statistical tests were carried out despite non-normality after establishing there were no serious problems with the data. Quality measures of sugar content (Brix) and 100 berry counts were normally distributed and did not require transformation prior to analysis.
Project B: Weed Management
In April 2019, the site location for this study was selected at Blueberry Hill Farm in Jonesboro, ME. This ongoing trial is a randomized complete block design replicated six times with 6’ by 30’ plots and 3’ wide buffers between plots. The trial is located on one acre that is now managed organically although it is not an organically certified piece of land. One soil sample was taken of the site location before the project began.
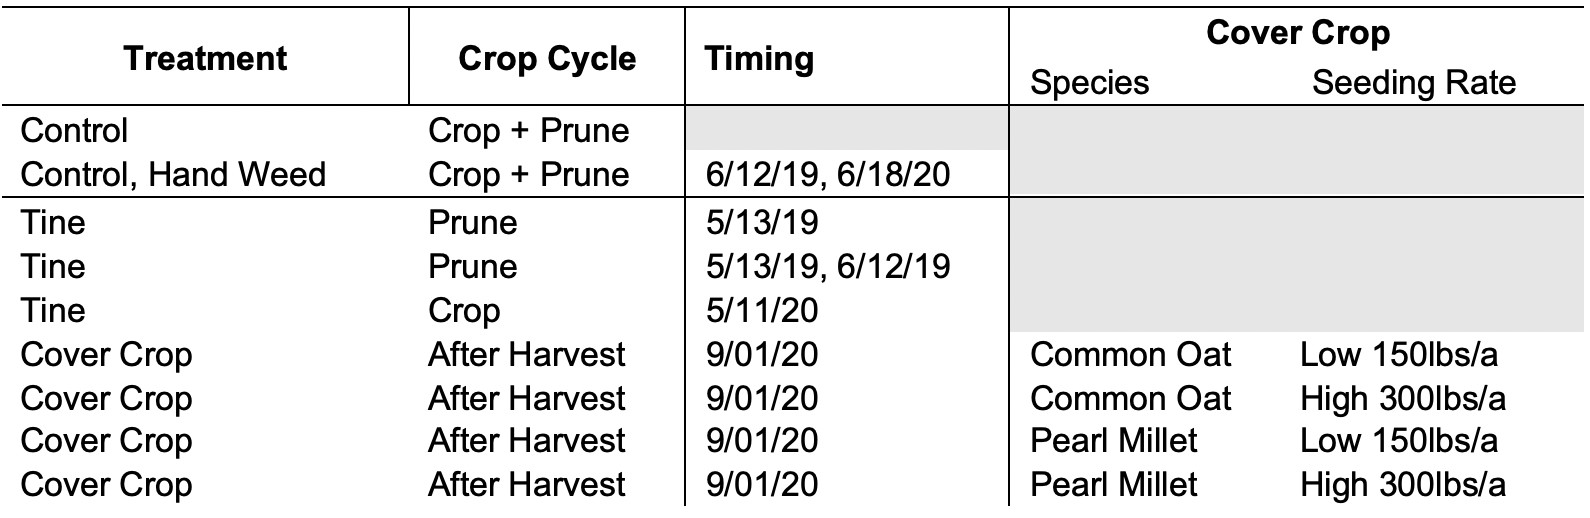
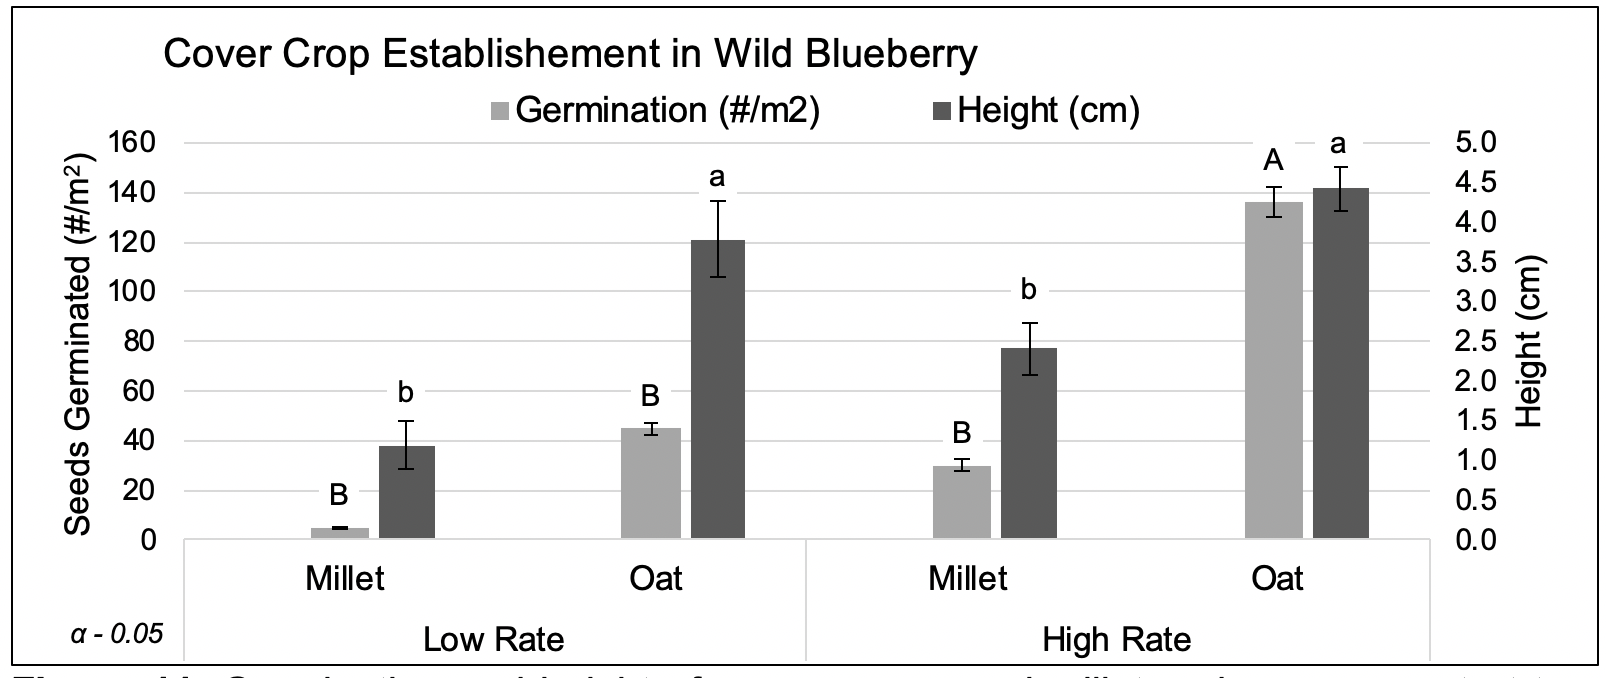
In March 2020 we conducted a lab experiment to test the ability of cereal cover crop species to germinate in acidic wild blueberry soil. The effects of low pH were tested using a water and buffer solution. In the lab, common oat (Avena sativa, Blue Seal) and pearl millet (Pennisetum glaucum F1, Johnny’s Selected Seeds) were germinated in petri dishes (100 seed/dish) with 4 watering treatments: a control using distilled water only (pH: 7.0) and 3 water/buffer solutions (pH: 4.0, 4.5 and 5.0) . Each watering treatment was replicated 3 times for each species. Seeds were sprayed daily using a spray bottle for 5 days. The number of seeds germinated per petri dish was recorded and average percent germination was calculated. Because successful germination occurred in the lab, common oat and pearl millet cover crop seed was planted via broadcast in the field on September 1st, 2020 after harvest. Four cover crop treatments were planted: common oat and pearl millet each at a low and a high rate (Table 1).
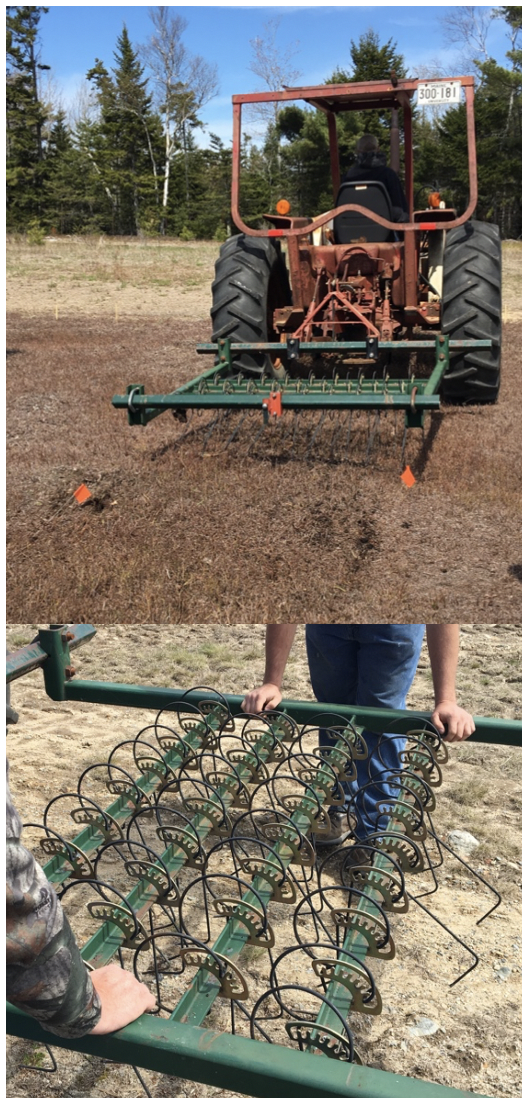
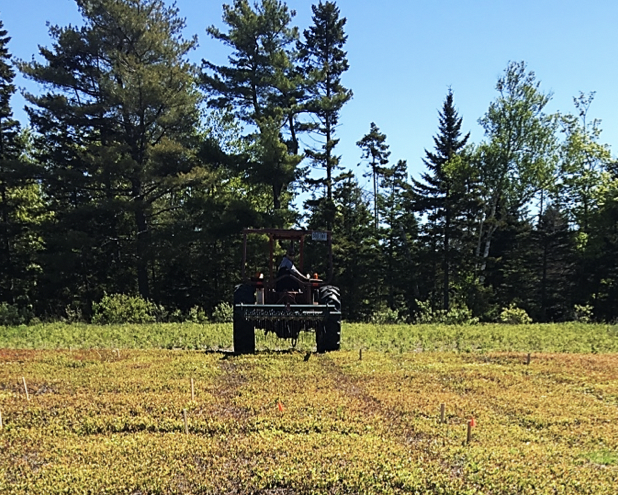
Treatments are listed in Table 2. Two controls were employed; no weeding and hand weeding on one date. On May 13th and June 12th prune year tine weeding treatments were completed. Tines on a Williams flex-tine weeder were set to have the greatest down pressure (setting 8)(Image 1). The tractor was run slower than recommended at 1 mph due to the bumpy field and our learning curve. The hand weeded treatment was completed on June 12th.
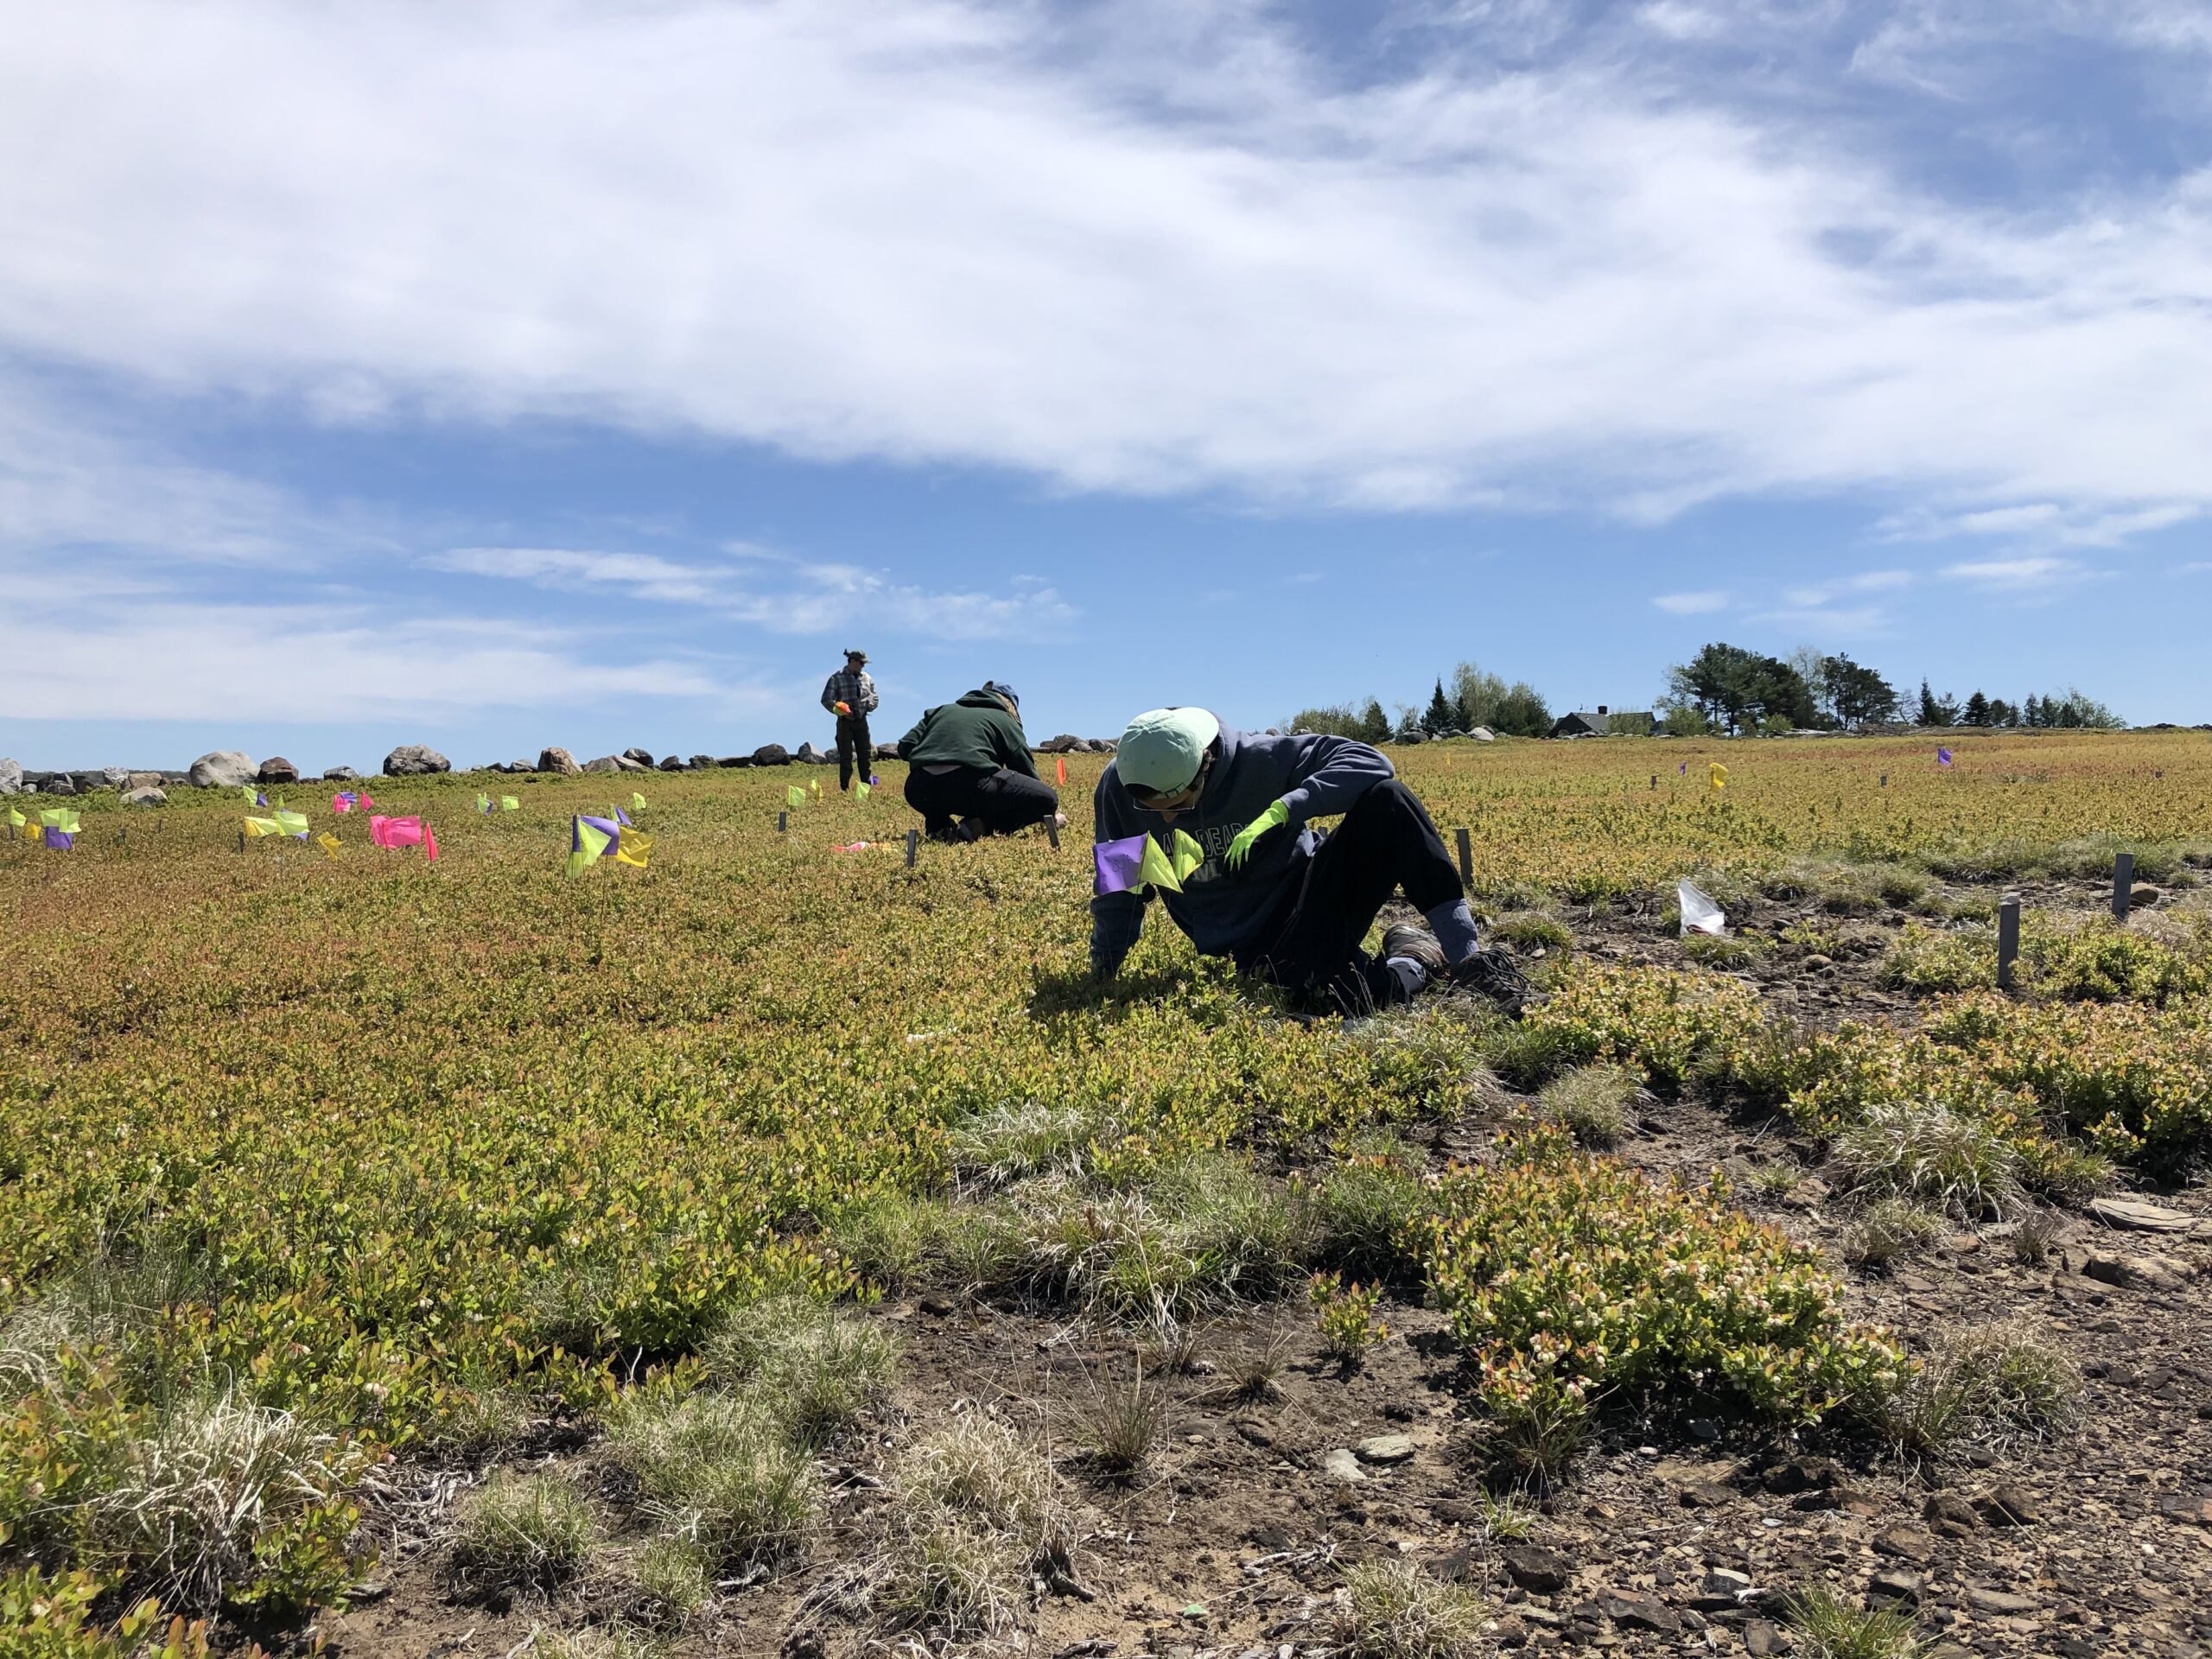
Measures of weed and blueberry crop growth were collected using two 0.5m x 0.5m quadrats per plot. Two quadrats were placed per plot and flagged for repeated measurements in the same locations throughout the study.
Weed control efficacy was evaluated within each quadrat by ranking overall weed cover using the Daubenmire scale of 0-6 (Table 3). In 2019, weeds were identified into two groups; grass and broadleaf, each of which were also given a severity rating on the same 0-6 scale and sampled twice throughout the season (June 27th and August 28). In 2020 we took a slightly different approach by counting the total number of weeds per quadrat with an overall rank of cover using the Daubenmire scale and listing the top three weeds that covered the most area within each quadrat. These measurements were taken three times throughout the 2020 crop-year (May 14th, May 27th and July 2nd).
The response of the blueberry plant to tine weeding in 2019 was monitored through repeated observations of blueberry cover as well as physical measures of stem height, bud number per stem and ramet density (Figure 2). In 2020, six random stems were flagged per treatment and monitored repeatedly for fruit-set and fruit-drop for the 3 tine weed treatments and the 2 controls. Fruit-set measures included bud counts in the late spring, flower counts at peak bloom, green fruit counts prior to ripening, and blue fruit counts during ripening. Percent fruit-set was calculated from the number of green fruit and the number of flowers per stem, while fruit-drop was calculated from the number of blue fruit and the original number of green fruit observed for each stem.
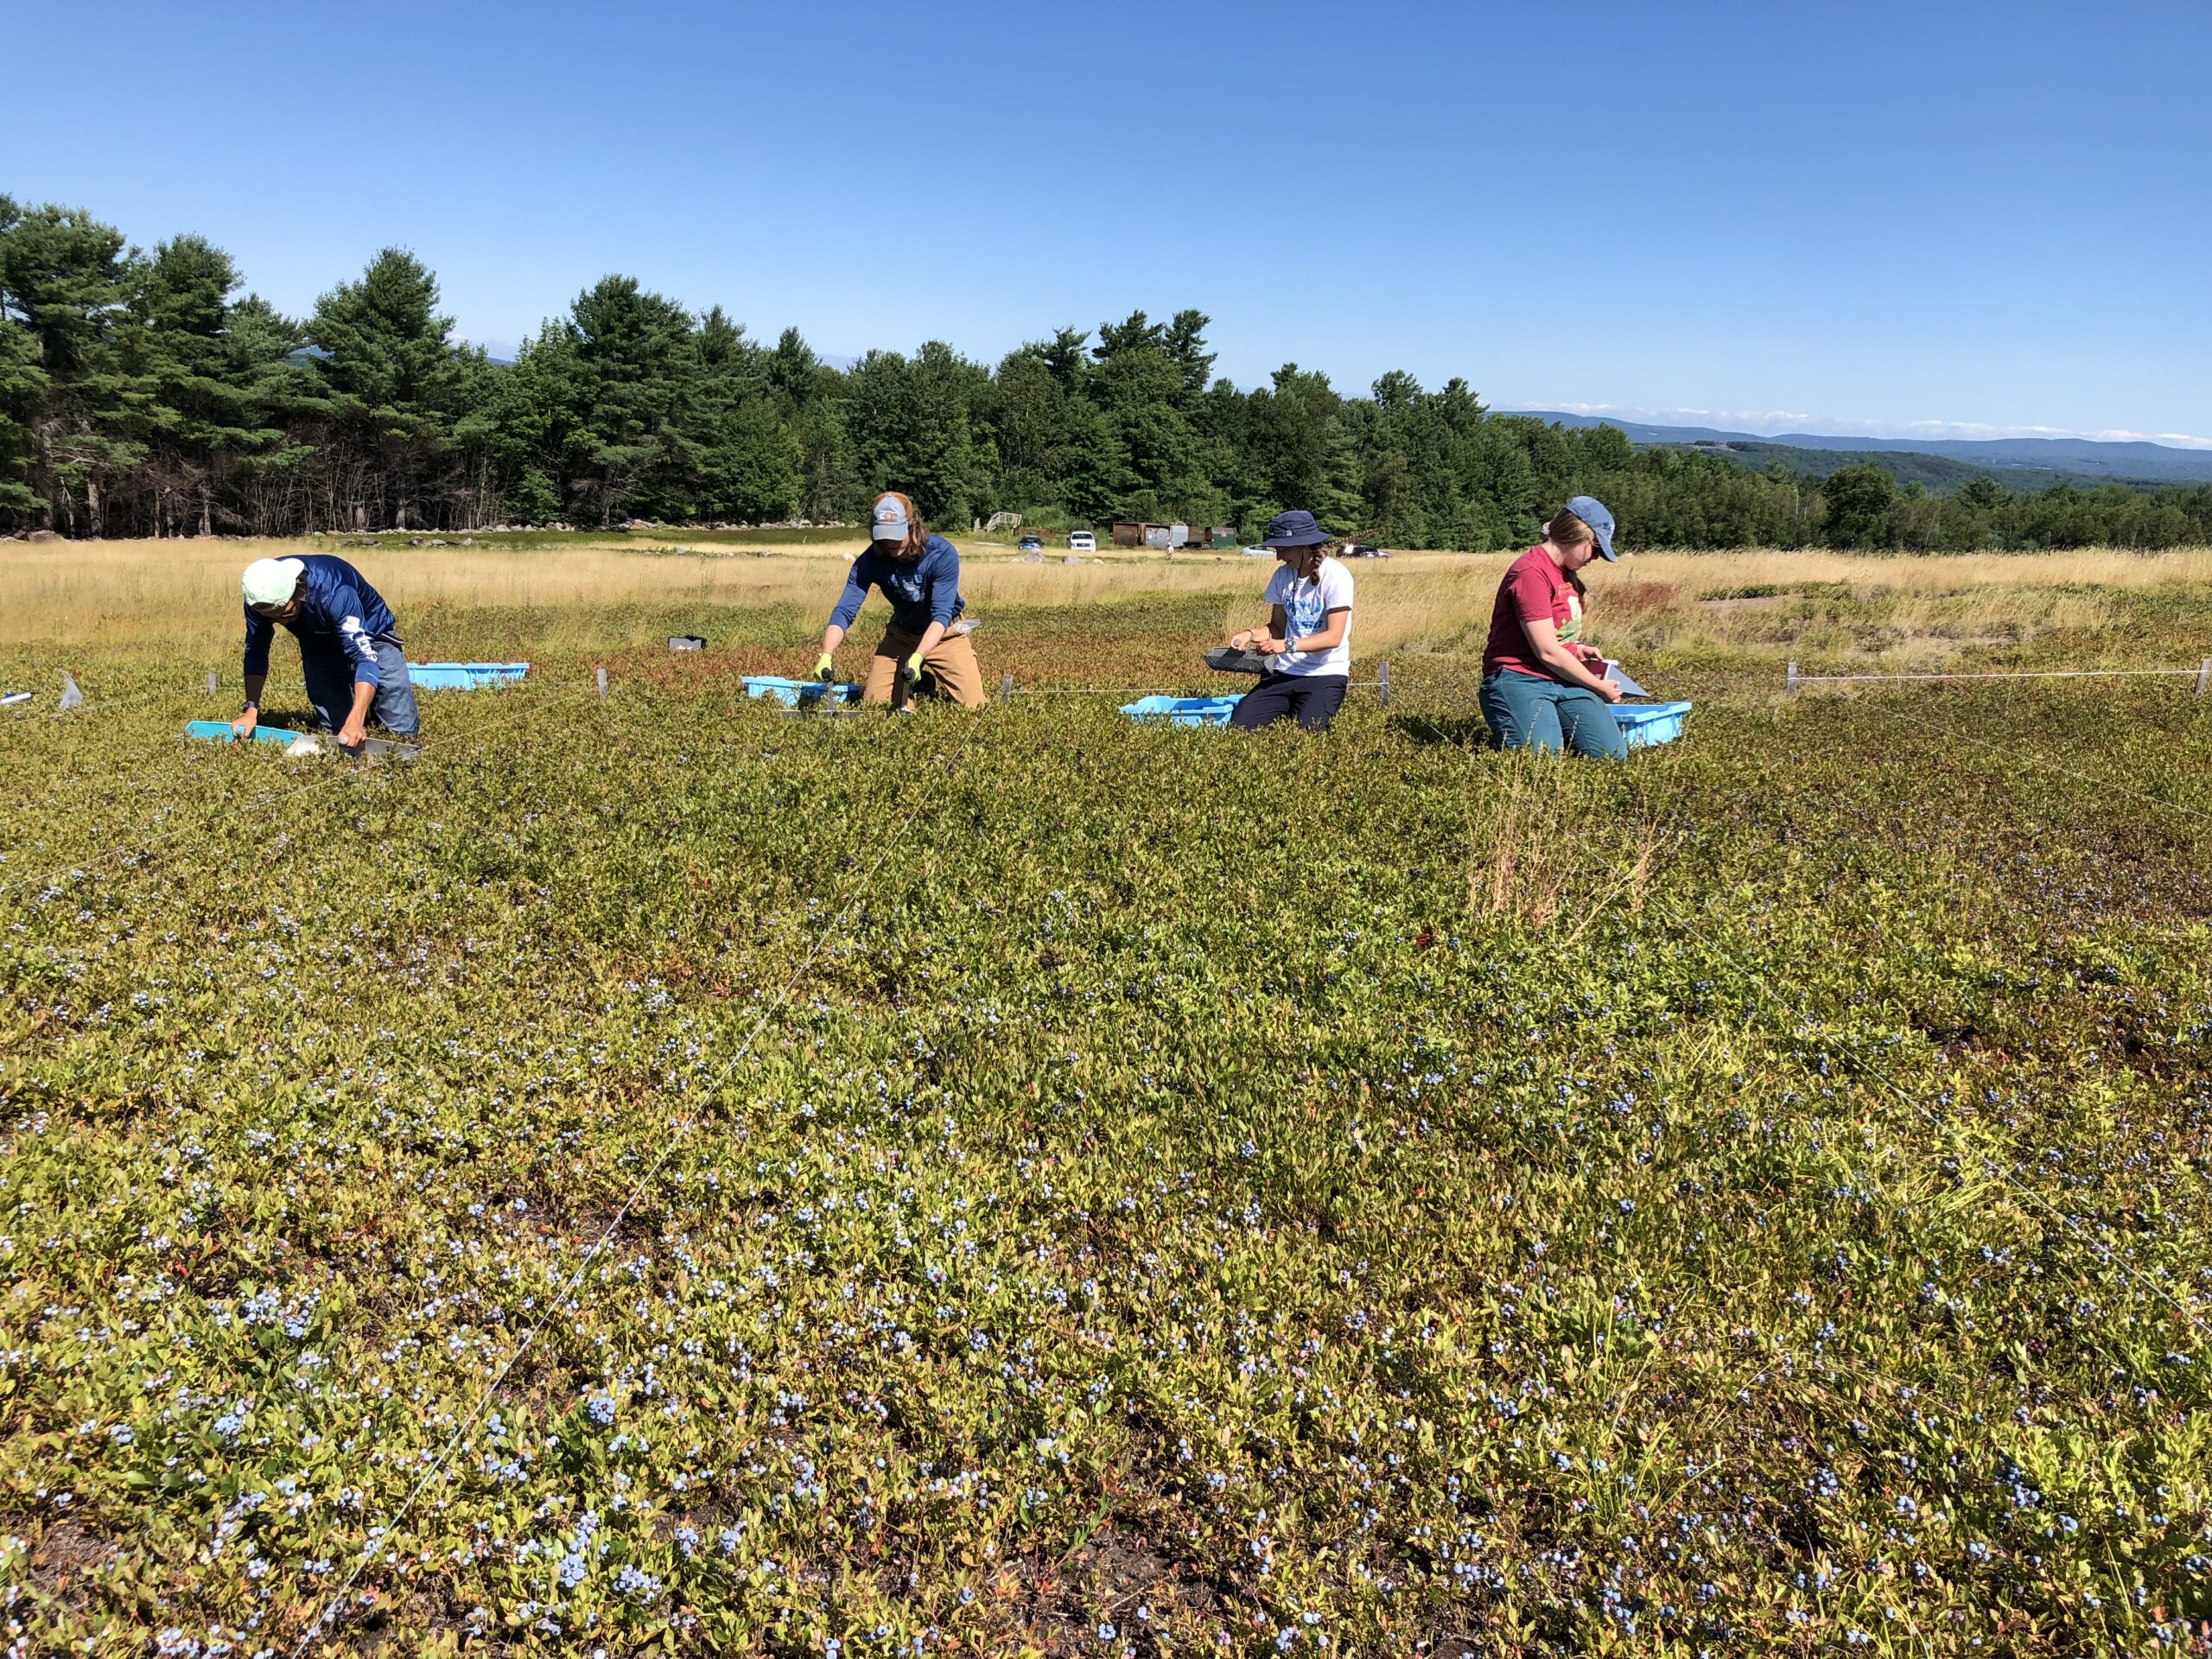
Harvest occurred on August 17th, 2020 for the tine weed treatments and both controls. Harvest procedure included hand raking exact quadrats in the flagged locations where repeated measurements were taken throughout the season. Then a walk behind harvester, harvested a 3ft strip down the center of each plot. The two modes of harvesting provided an ‘exact’ yield and a more ‘realistic’ yield (accounting for % loss that may occur with a mechanical harvester) for each treatment. Quality measures were also taken for each treatment including 100-berry weight to quantify average berry size and a brix measure of the relative sugar content using a hand-held Atago brix-acid meter.
Cover crop emergence was evaluated on October 9th, 2020 by counting the number of emerged plants within two quadrats/plot and measuring the heights of 6 random cover crop plants per plot.
Table 3. Daubenmire ranking scale (1-6).
|
|
Percent Coverage |
|
|
Rank |
Range |
Midpoint |
|
1 |
0-5% |
2.5% |
|
2 |
5-25% |
15.0% |
|
3 |
25-50% |
37.5% |
|
4 |
50-75% |
62.5% |
|
5 |
75-95% |
85.0% |
|
6 |
95-100% |
97.5% |
Data Analysis
Blueberry health and recovery after tine weeding were evaluated using blueberry stem height, bud counts (per stem), blueberry plant cover and number (ramets/m2). The continuous data (stem height, plant and bud number) were evaluated using a one-way ANOVA with a Tukey’s Pairwise comparison in JMP (JMP®, Version 14.3) across all weed management treatments (α = 0.05). Ranked (ordinal) data for blueberry plant cover and weed severity by type (broadleaf and grass) were compared using Chi-Squared test in JMP across all treatments (α = 0.05).
Project A: Nutrient Management
Soil Moisture
Overall, no significant differences were found in soil moisture among the treatments in any location. At Appleton, soil moisture was higher in the high rate of Cheep Cheep treatment than the control and other treatments. At Surry, average soil moisture was higher in the mulch treatments compared to the control and other treatments. At Columbia Falls, average soil moisture was higher in the mulch and both Cheep Cheep treatments compared to the control and other treatments.
Physiology and Morphology
Overall, no significant differences were found in leaf chlorophyll concentration among the treatments applied in any location. At Appleton and Surry, the average leaf chlorophyll concentration was higher in the high rate of Cheep Cheep compared to the control and other treatments. At Surry, average leaf chlorophyll concentration was lower in all treatments compared to the control. At Columbia Falls, average leaf chlorophyll concentration was higher in both rates of Cheep Cheep and the low rate of Coast of Maine compared to the control and other treatments.
No significant differences were found in leaf photosynthetic electron transport rates among the treatments applied in any location. At Appleton, average leaf electron transport rate was higher only in the low rate of Coast of Maine treatment compared to the control and other treatments. By contrast, at Surry, average leaf electron transport rate was higher in all treatments except SeaCrop16 applied in the crop year. At Columbia Falls, average leaf electron transport rate was lower in all the treatments compared to the control.
No significant differences were found in the wild blueberry leaf sizes among the applied treatments in any location. At Appleton, average leaf size was smaller in all treatments compared to the control. At Surry, both Cheep Cheep treatments had larger leaf sizes than the control and other treatments. At Columbia Falls, all treatments averaged larger leaf sizes than the control. Similarly, no significant differences were found in leaf mass per area (LMA) of the wild blueberry plants among the applied treatments in any location. At Appleton, average LMA was higher in the high rate of University Compost and high rate of Cheep Cheep compared to the control and other treatments. However, at Surry, average LMA was lower in all treatments compared to the control. At Columbia Falls, average LMA was higher in all treatments compared to the control.
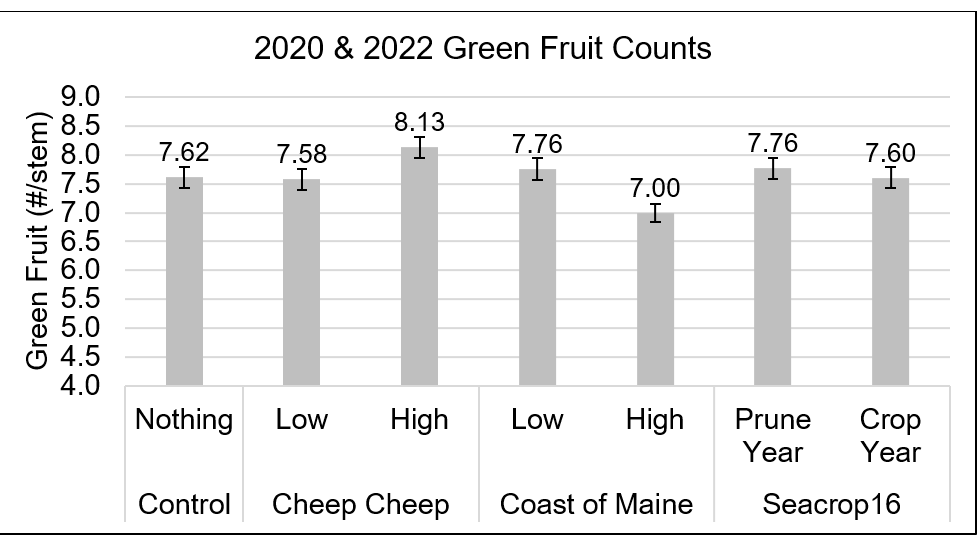
Blueberry cover also did not show any significant differences; however, a trend was present. Treatments including all rates and timings of Cheep Cheep, Coast of Maine Compost, and SeaCrop16 improved blueberry cover more than did the control (Figure 1). Blueberry cover ranged from 64% in the control to 68% in the treatments where SeaCrop16 had been applied (both prune and crop). Blueberry cover in treatments where Cheep Cheep had been applied (67% at both rates) was close to the cover under SeaCrop16, 68%.
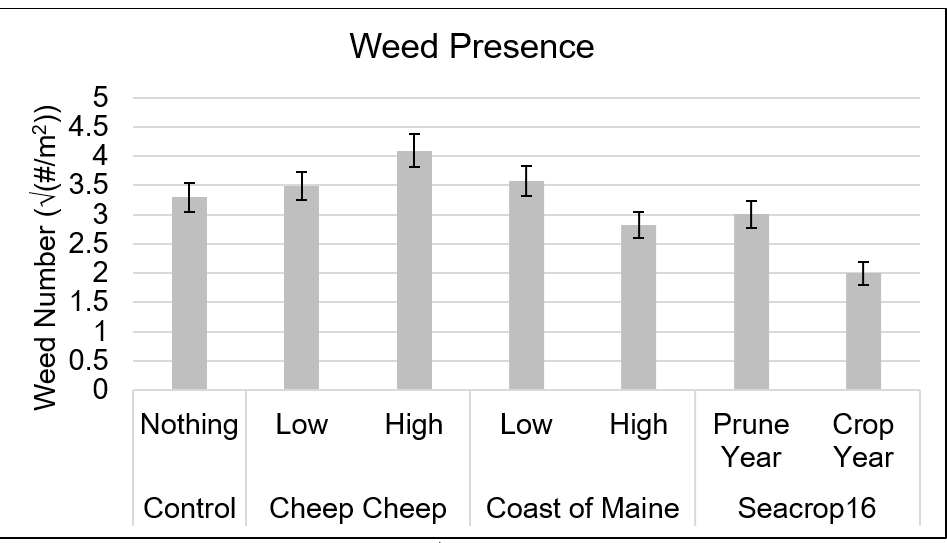
The average number of green fruit per stem was averaged across both crop years, 2020 and 2022 (Figure 2). The most green fruit were observed in the high rate of Cheep Cheep (8.13 green fruit/stem), and the fewest green fruit were observed in the high rate of Coast of Maine (7.00 green fruit/stem). The control averaged 7.62 green fruit/stem, which was only slightly higher than the crop year application of SeaCrop16, the low rate of Cheep Cheep, and the high rate of Coast of Maine.
Pest Presence
Treatment differences in weed presence (#/m2) over three years of this study (2020 – 2022) were not significant, however, interesting trends were present (Figure 3). Weed presence was highest under high rate of Cheep Cheep (#/m2), followed by low rate of Cheep Cheep (#/m2), and low rate of Coast of Maine (#/m2). Weed presence was lowest where SeaCrop16 was applied during the crop year. Site-specific differences were analyzed to compare the efficacies of University Compost (only applied at Hope) and mulch (applied at Columbia Falls and Surry). At Hope, the high rates of Coast of Maine and University Compost both had significantly lower weed cover than the control. Interestingly, at the Columbia Falls and Surry locations, the SeaCrop16 applied in the crop year and high rate of mulch had significantly lower weed cover than the control.
Insect coverage, a spatial measure of insect presence generally indicated by pest damage to leaves or observation of the actual culprit, was significantly higher in the low rate of Cheep Cheep (13%/m2) relative to the control (10%/m2; Figure 10). Over the four years of study, all other treatments were not significantly different from one another. Top insects included: tip midge, red striped fireworm, and flea beetle. Disease coverage, including leaf spot species, mummy berry, and phomopsis, as indicated by a spatial measure of disease presence, was relatively similar across all treatments except for the high rate of Cheep Cheep (12%/m2), which exhibited significantly less disease presence than the control (14%/m2).
Crop Productivity
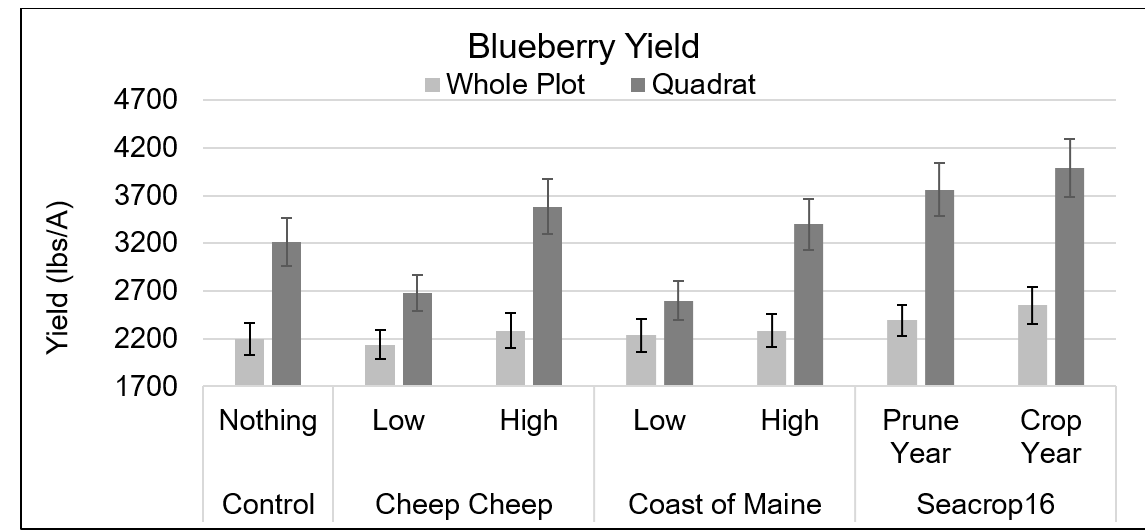
Treatment differences in harvest yield were not significant across both crop years (2020 and 2022) and all locations, however, there are interesting trends worth noting (Figure 4). Blueberry yields were higher in the quadrat subsamples compared to whole plot yields. Whole plot yields are more susceptible to variation between clones and the physical loss that occurs when harvesting a larger area (16.7 m2). The quadrat yields are more representative of the crop potential by thoroughly capturing a small area (0.37m2).
In addition to the yield differences by sampling methods (quadrat vs. whole plot), there were notable yield differences by treatment. Both whole plot and quadrat yields were highest for the SeaCrop16 applied in the crop year (2552 lbs/A and 3988 lbs/acre), followed by the SeaCrop16 applied in the prune year (2391 lbs/A and 3762 lbs/A), with the third highest yield occurring with high rate of Cheep Cheep (2283 lbs/A and 3585 lbs/A). Quadrat yields from plots treated with SeaCrop16 crop year, SeaCrop16 prune year and the high rate of Cheep Cheep were 24%, 17% and 12% greater than the quadrat yields in the control (3214 lbs/A).
Project B: Weed Management
Impact of Tine Weeding
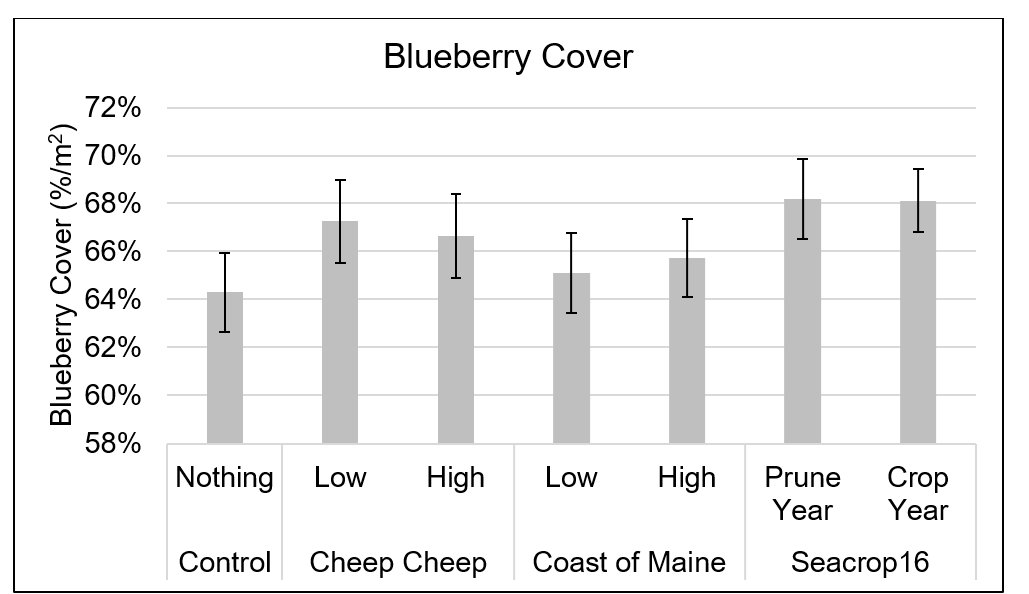
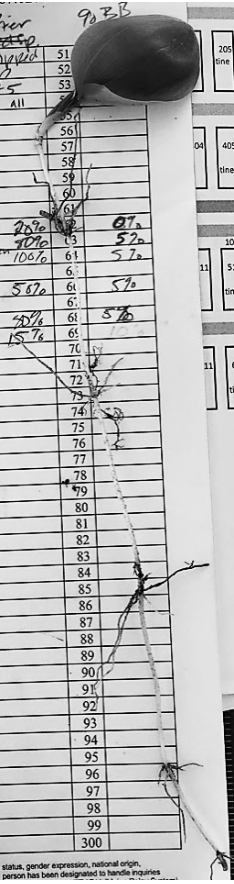
Observationally, we saw that two tine weed passes were more effective than one pass per date at uprooting white thread stage weed seedlings. The first pass loosened up the soil required to then dislodge weeds in the second pass. Preliminarily, Canada mayflower, horse weed, and red sorrel were uprooted (Image 2). Loose and dead wild blueberry ramets were pulled up in some cases. The most damage to wild blueberry occurred from driving over the field on the second tine weed date, June 12th (Image 3). On the first tine weed date, May 13th, wild blueberry leaves were not out yet and therefore less damage to wild blueberry from tractor tracks was observed.
Blueberry Health
Post-tine weeding blueberry cover and blueberry stem number measured across 2020 and 2021 showed a reduction with increased passes with the tine weeder (Figure 5). Blueberry cover was significantly greater in the control than both tine weed treatments by as much as 10% and 17% compared to the tine with two passes and with four passes, respectively. Blueberry stem number showed significant reduction with four passes of the tine weeder relative to the control. Here, four passes with the tine weeder resulted in 20% fewer stems.
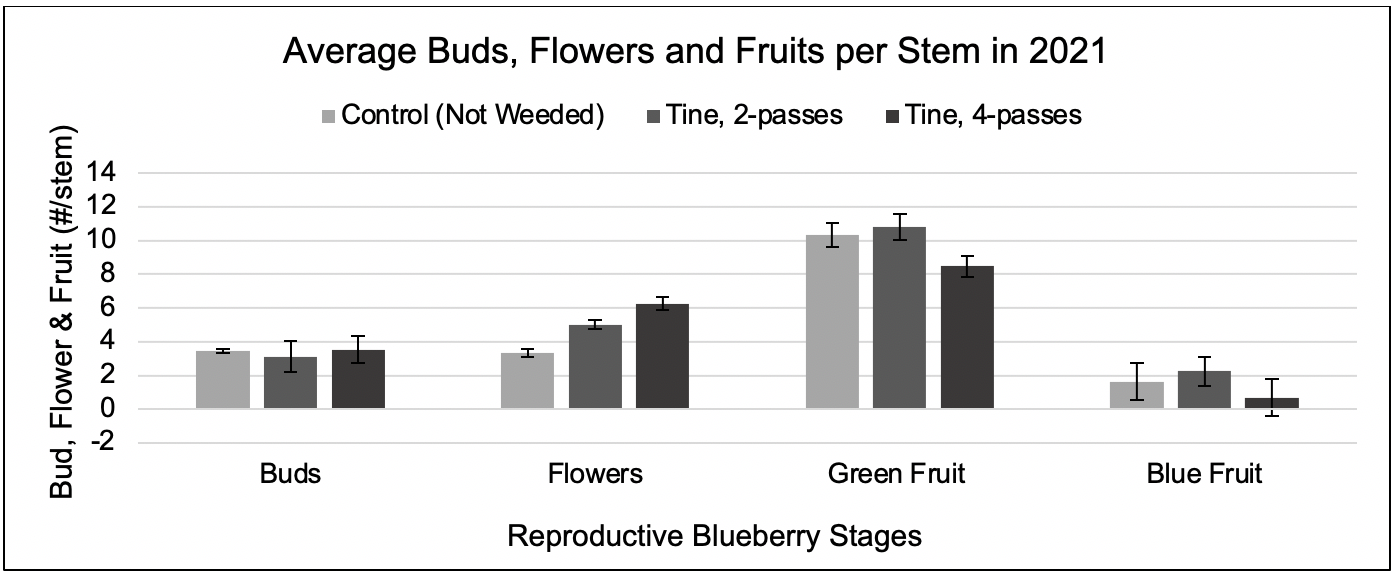
Average total bud number in the spring of 2021 presented little difference in bud number between treatments with a slightly larger standard error in the tine weeded treatments, meaning greater variation in bud numbers between stems. Other reproductive stages varied by treatment with the greatest average flower number and the lowest green fruit occurring in the tine treatment with four passes, perhaps suggesting poor pollination in this treatment or a more likely scenario being reduced nutrient or water availability. Green fruit and blue fruit counts were highest on average in the tine treatment with two passes, possibly reflecting differences in development rate.
Fruit development (% stage by treatment), evaluated for July 29, 2021 (the day of harvest), suggests the fruit developed slower in plots tine weeded with two passes than plots tine weeded with four passes relative to the control. This is clear through the ratio of green fruit to blue fruit on the day of harvest.
Comparing Before and After Tine Weeding in 2020
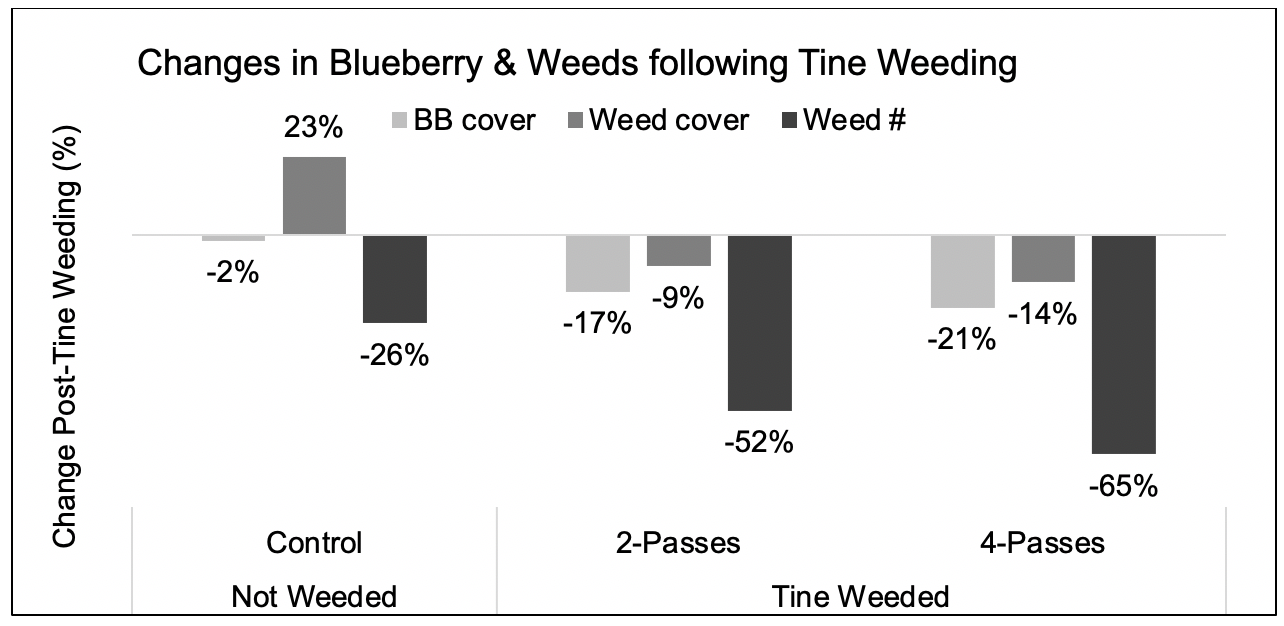
When comparing the single date pre-tine measures to the average post-tine measures collected throughout the season, a percent change can be generated to show the difference between the two time periods by treatment. Here, comparing pre- and post-tine measures for 2020, there was little difference in blueberry cover in the control (-2%), while the tine weed treatments exhibited a 17% and 21% decrease in blueberry cover for treatments that received two passes and four passes, respectively (Figure 6). Weed cover increased by 23% in the control treatment as weeds emerged throughout the season, but weed number decreased (see discussion). Both tine weed treatments experienced a decrease in weed cover and weed number with the greatest decrease in the tine treatment with four passes. Here, more passes with the tine weeder led to a 14% decrease in weed cover and a 65% decrease in weed number (#/m2) following tine weeding.
Effects of Tine Weeding on Weed Pressure
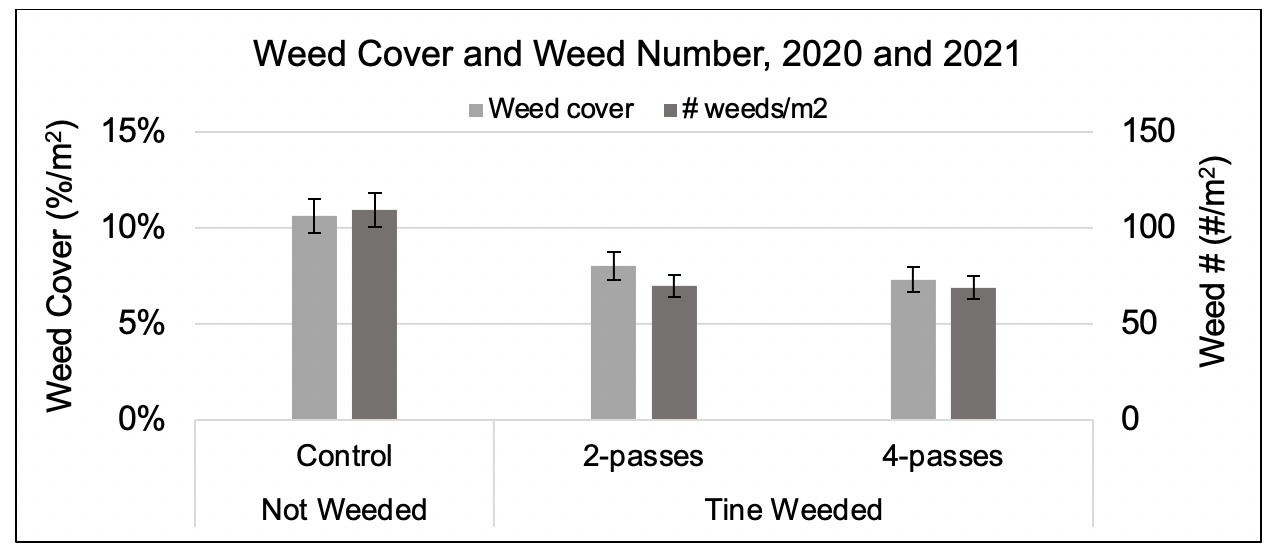
When comparing the types of weed species present across treatments, tine weeded with four passes had the lowest diversity of weed species present but the highest occurrence of grass. Tine weeded treatments had a higher percentage of broadleaf weeds than the control. Overall, red sorrel was the top broadleaf species in all treatments (post-tine weeding), followed by St. John’s wort and violet (Figure 7). When evaluating weed presence by life cycle, treatment differences were non-significant, but an interesting trend occurred. Tine weeding resulted in a visible increase in annuals and grasses while exhibiting a decrease in perennial weeds relative to the control. This shows that tine weeding may impact weeds differently based on their growth and reproductive patterns. When evaluating the effect tine weeding on weed cover and weed number there is a visible reduction with the increasing number of passes when compared to the control. In 2020, weed numbers (#/m2) were significantly less in the 2 and 4 pass treatments relative to the control. When evaluating 2020 and 2021 together, both weed cover and weed numbers are not significantly different between treatments suggesting the weed pressure may have rebounded slightly in 2021. Overall, weed presence was considerably less in the plots that were tine weeded relative to the control. Compared to the control, weed covers (%/m2) were 25% and 31% less and weed numbers (#/m2) were 36% and 37% less with 2 passes and 4 passes, respectively.
In 2020, preliminary results on cover crop establishment showed the oat outperformed the millet in height (for both rates) and germination (high rate only). In August 17, 2021 two high rates of common oat were applied (500 and 1000 lbs/ac) and results will be shared in the 2022 report (Figure 8).
Project A: Nutrient Management
DISCUSSION
Over the past 4 years, this project and others on mulching indicated that adding any organic matter to wild blueberries will improve plant heath and therefore yield and quality. While not significant, all treatment rates and timings of Cheep Cheep, Coast of Maine, and SeaCrop16 had greater blueberry coverage than the untreated control, indicating that the additional nutrients provided by each of the treatments was successful in increasing plant health and vigor. The treatments did not indiscriminately "feed the weeds”, as we often say happens in the wild blueberry system. The weed coverage varied by location and treatment. Low weed coverage at Surry and Columbia Falls under high rates of mulch reinforce the knowledge that mulch applications confer many benefits, particularly the suppression of weeds (Gumbrewicz & Calderwood, 2022).
While all treatments saw a trend towards increased blueberry cover, not all treatments saw an increase in green fruit numbers. The high rate of Cheep Cheep produced the greatest number of green fruit across both crop years, indicating there may be a relationship between the high rate of nitrogen in this treatment (4%, the highest of all treatments) and the resulting green fruit produced. We are still waiting for the 2022 foliar nutrient sample analysis which may prove or disprove this.
Higher insect presence in both rates of the Cheep Cheep and Coast of Maine treatments compared to the control indicates the wild blueberry plants were appealing to the insects, indicating a fairly healthy plant. The slightly lower rates of disease in the treated plots compared to the control indicate that the soil or mulch treatments provided a barrier to spores splashing from the ground to the plants. The rates of both insect and disease as observed in this study may be limited by identification methods. Structures such as tip midge galls on the tips of stems and mummy berry spores allowed for easy identification of the perpetrators. More general damage, such as chewed segments of leaves, was likely not attributable to a specific pest and so that pest’s presence may not be appropriately recorded.
Based on the four years of data collected during this study, some soil amendments such as Cheep Cheep and mulch may be able to improve soil moisture availability and physiological performance of wild blueberry plants. Cheep Cheep and mulch treatments accumulated comparatively higher levels of soil organic matter (“SOM”) and major nutrients (N, P, K, Ca) in soil at the studied sites as found from the soil testing results in the fourth and final year of this study. Hence, Cheep Cheep and mulch applications appear to have increased water holding capacity in the soil by adding and protecting SOM (Gould, 2015; Bot and Benites, 2005).
This increase in water-holding capacity and SOM might have contributed to the slightly higher leaf chlorophyll concentrations that were observed in Cheep Cheep treatments. The higher nitrogen content in Cheep Cheep products may also have increased soil nitrogen levels, thereby benefitting the wild blueberry plants. As nitrogen is the most important nutrient for building leaf chlorophyll, increasing the availability of this nutrient improves plants’ photosynthetic performance and improves crop production (Taiz et al., 2015). Cheep Cheep had the highest macro- and micronutrient concentrations where N-P-K is 4-3-3 and Fe, Cu, S, Ca, Mg, Zn, and Mn are present. These ten nutrients comprise 40% of the product and the remaining 60% is organic matter. Despite the available nutrients from the applied treatments, photosynthetic electron transport rates showed rather contradictory responses from leaf chlorophyll concentration responses to the applied treatments. The reasons behind such contradictory results can be better explained with the leaf nutrient concentration information from this season which are still being tested (waiting on 2022 sample results).
In 2022, the final year of this study, the effects of treatments seemed to wane somewhat as there were declines in soil moisture and there were no significant differences in wild blueberry physiology and morphology across treatments. This could mean that treatments applied at the rates described here should be applied every few years to achieve consistent improvements in plant physiology, morphology, and yield.
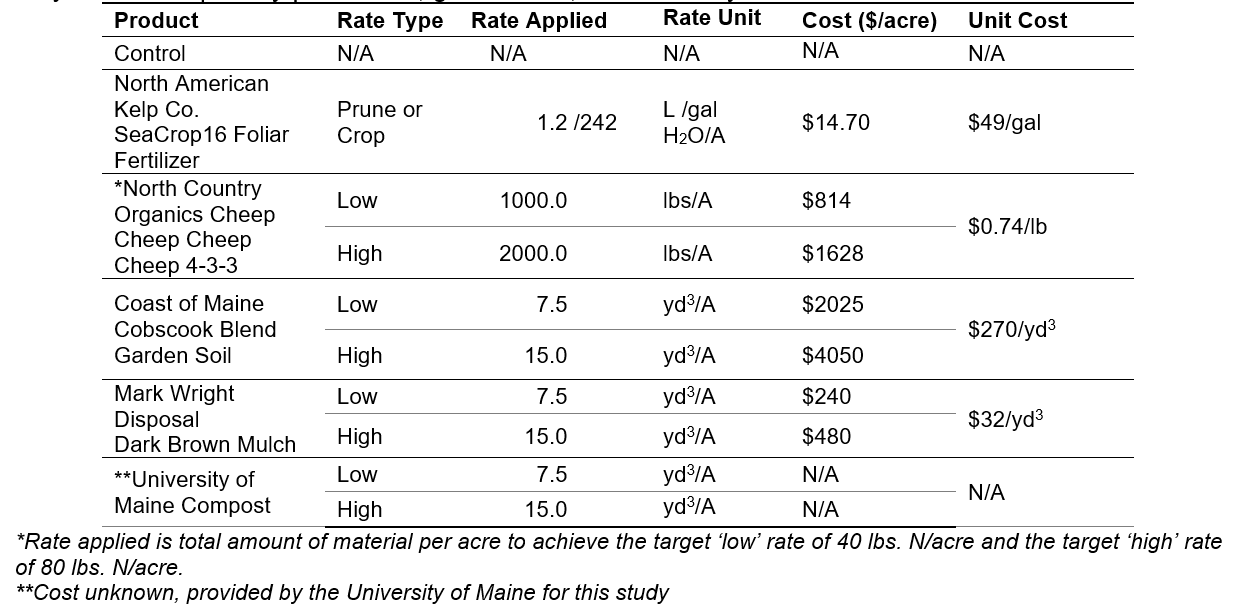
Product Costs
The cost of products used plays a critical role in implementation by wild blueberry growers (Table 4). The Coast of Maine Cobscook Blend was the most expensive product, followed by North Country Organics Cheep Cheep. Both the North American Kelp SeaCrop16 foliar fertilizer and Mark Wright Disposal mulch had lower costs per unit and were also applied at lower rates compared to the Cheep Cheep, thus resulting in overall lower costs compared to all other treatments. No cost was given for compost because it was donated by the University of Maine for this study.
Recommendations to Growers
- Organic growers should apply any affordable and available source of organic matter as this benefited wild blueberry
- Chicken manure can be applied at a rate of 700lbs/a IF good weed management practices are already in place. 2,000 lbs/a increased weed presence.
- The effects of fertilizer waned in year four. Consider this when scheduling applications.
Cost of Products
The cost of products used plays a critical role in implementation by wild blueberry growers (Table 4). The Coast of Maine Cobscook Blend was the most expensive product, followed by North Country Organics Cheep Cheep. Both the North American Kelp Seacrop 16 foliar fertilizer and Mark Wright Disposal mulch had lower costs per unit and were also applied at lower rates compared to the chicken manure, thus resulting in overall lower costs compared to all other treatments. No cost was given for compost because it was donated by the University of Maine for this study.
Project B: Weed Management
Our comparison of blueberry cover, weed cover, and weed numbers before and after tine weeding showed that this method was an effective weed reduction technique. Two passes with the tine weeder controlled certain weeds, yet wild blueberry yield and blue fruit count was not significantly different than the control.
The control plots saw an increase in weed cover (but not number) as the weeds in these plots were not stressed by the tine weeding. Both two and four passes with the tine weeder reduced weed cover by 9-14% and weed number 52-65%. It also reduced blueberry cover by 17-21% for two and four passes, respectively. These reductions prove the hypothesis that multiple passes with the tine weeder effectively dislodge and remove more and more weed roots with each pass; reasonably, rhizomes of wild blueberry are also dislodged, particularly with multiple tine weeder passes.
Effect of Tine Weeding on the Crop
Disturbance stimulates wild blueberry growth, and this knowledge has been integrated into crop management in the form of mowing or burning to prune the plants and encourage future growth in addition to some more advanced methods of disturbance on some farms (DeGomez, 1988). One of our hypotheses was that tine weeding would stimulate wild blueberry plant production. Over the course of two tine weeding trials in both cycles over 3 years we can conclude that this type of disturbance does not increase plant production. We did see an increase in flower number when prune plants were tined twice and four times yet this increase did not continue into green fruit and blue fruit at harvest. There were significantly more green fruit at harvest indicating that fruit development was delayed in tined plots. We saw a decreasing trend towards smaller berry size, lower Brix content, and lower yield from control to two and four passes. These delays may be due to a “late pruning” event or from dislodged rhizomes that reduced the plants’ ability to take up nutrients and water.
Effects of Tine Weeding on Weed Presence
Comparison of which weed species were present across treatments made clear that four passes with the tine weeder decreased diversity of weed species present. This may be due to some weed species being more susceptible to tine weeding than others. Interestingly, the most frequently identified top broadleaf species under each of the treatment conditions were exactly the same: red sorrel, St. John’s wort, and violet. The tine weed treatments presented a higher occurrence of broadleaf weeds relative to the control suggesting greater species diversity and more consistent presence across all plots and sample dates. The average occurrence of the annual violet species were 3x higher in tine weeded plots relative to the control. Annual plants may have been planted by the tine weeder, which moved seeds from parent plants and dropped the seeds in the top layer of duff, where they lay dormant until the right conditions occurred. Grasses and broadleaf perennials may have grown more numerous as the tine weeder physically broke apart clusters of grasses and rhizomes, thereby stimulating more growth.
Recommendations to Growers
Generally, we do not recommend tine weeding because our study has found a decrease in several wild blueberry health parameters even though yield itself did not significantly decrease the year after tine weeding. Growers seeking to manage weeds using tine weeding will find two passes with the tine weeder sufficient for reducing perennial broadleaf weeds in their fields, IF the field is level, with minimal adverse impacts on fruit yield and quality. Tine weeding is not recommended for growers with grasses and annual weeds. The speed and pressure settings for the tine weeder will need to be adjusted based on localized conditions, such as field rockiness and levelness. Growers interested in tine weeding are encouraged to do an assessment of what weeds are present in their fields prior to tine weeding in order to make sure tine weeding is right for their field and to measure the impact of tine weeding at your location.
Education
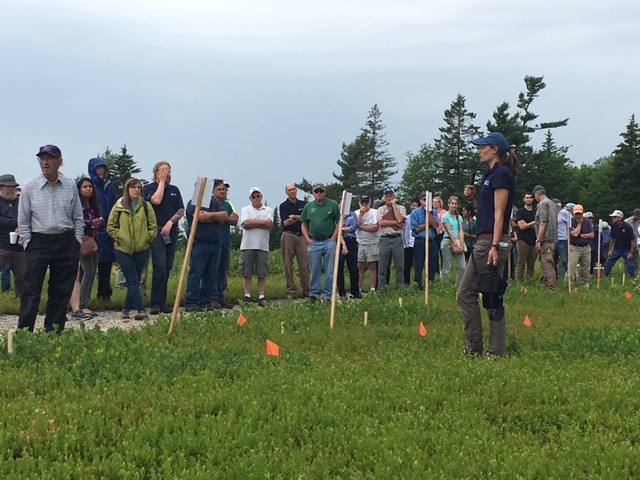
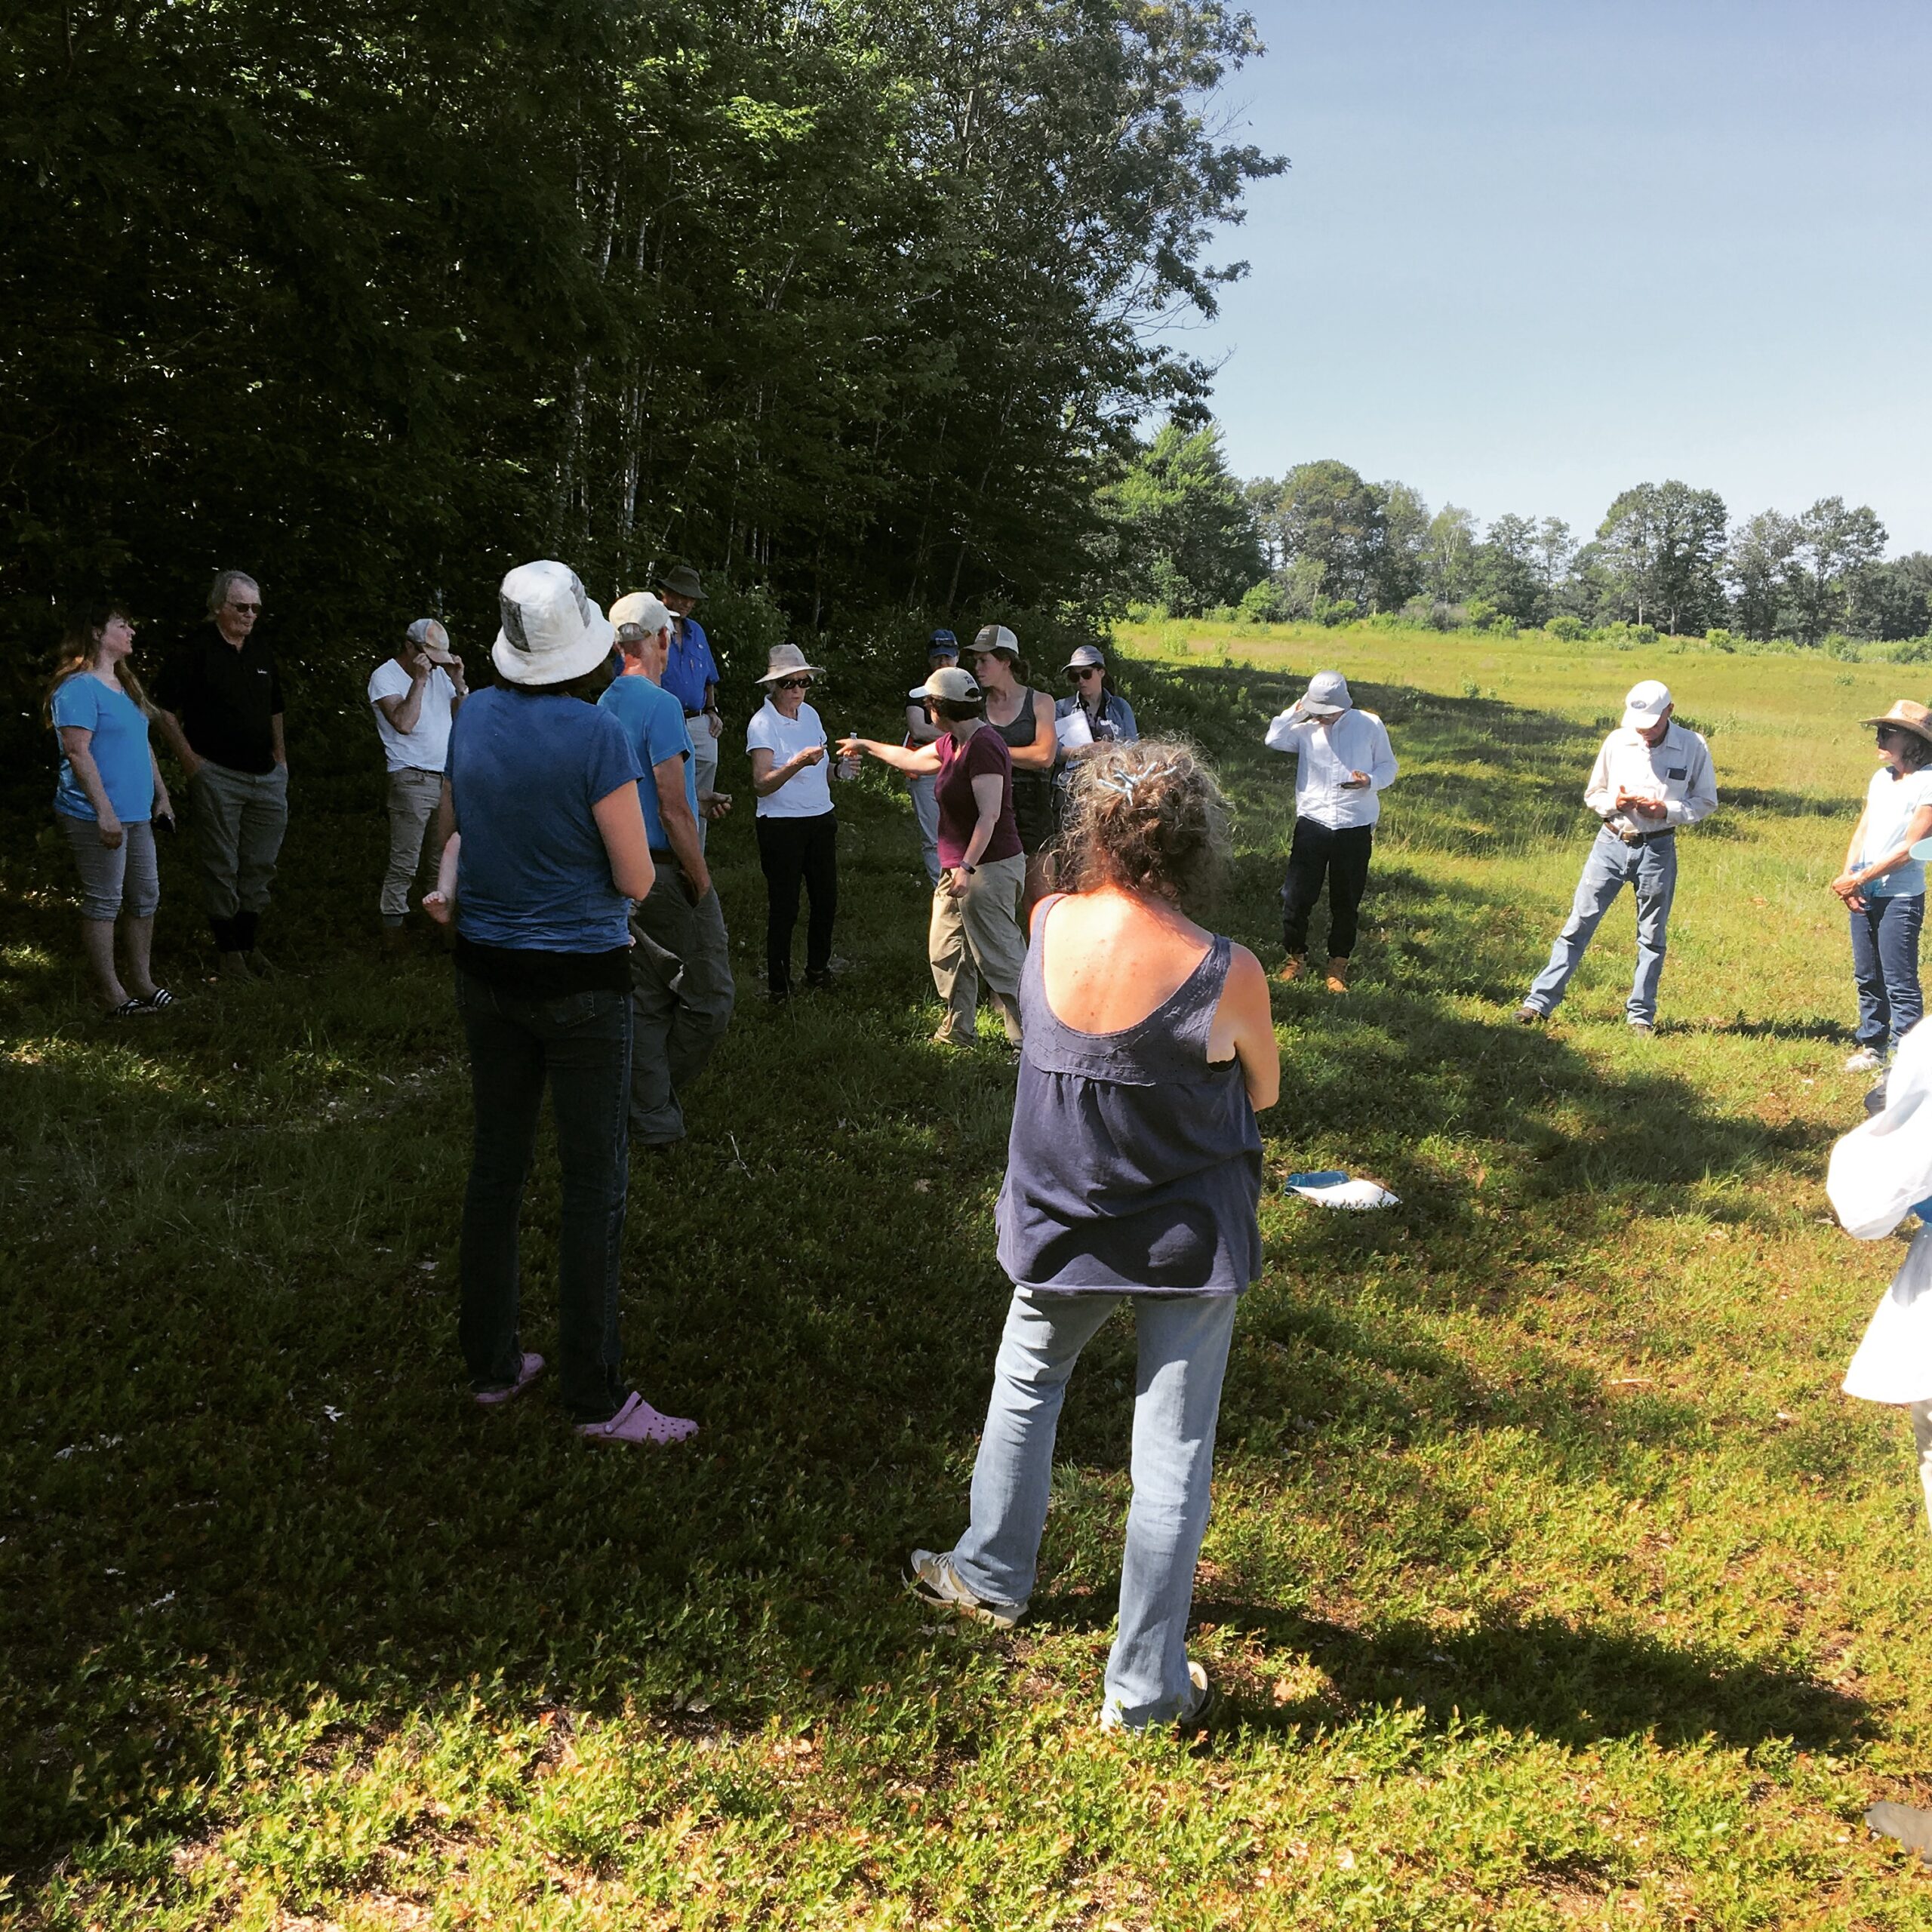
A collaborative research and outreach program continues to reach both organic and conventional wild blueberry growers. In the first year of this project, the research team worked with collaborating farmers to finalize treatments and set up research trials on three farms. In 2019 we shared this project at the Annual Wild Blueberry Field Day held in Jonesboro ME (91 attendees), Organic Wild Blueberry Growers Field Day in Dresden ME (20 attendees), and Western Maine Wild Blueberry Field Meeting in Otisfield ME (14 attendees).
First year results were presented at the 2020 Wild Blueberry Conference which was held in Bangor ME on February 22 which had 90 attendees, 45% of which identified as organic. Throughout the winters of 2020 and 2021 education and outreach related to this project had to be conducted virtually due to the Covid-19 pandemic. In the spring of 2020, from April through June on Friday mornings "Wild Blueberry Coffee Hours" were held as a way to engage growers and allow for further education as the season began (34 total attendees). Four virtual field days were held in July 2020 that covered disease, insect, weed, and nutrient management for both organic and conventional growers (61 total attendees). In September 2020 we were able to hold 2 in-person field meetings that were socially distanced and with masks where results from this project were shared on big posters outside (24 total attendees). Our wild blueberry newsletter regularly reaches 735 recipients (486 online and 249 in print) where important project updates are shared.
In 2021 the Wild Blueberry Conference was held virtually and included an Organic Wild Blueberry Production session which can be found here (February 24 video). 56 attendees called into the organic session on February 24. Over the summer of 2021 five field meetings were held for organic and conventional growers where organic weed and nutrient management were topics covered. In 2021 there were a total of 169 attendees in person.
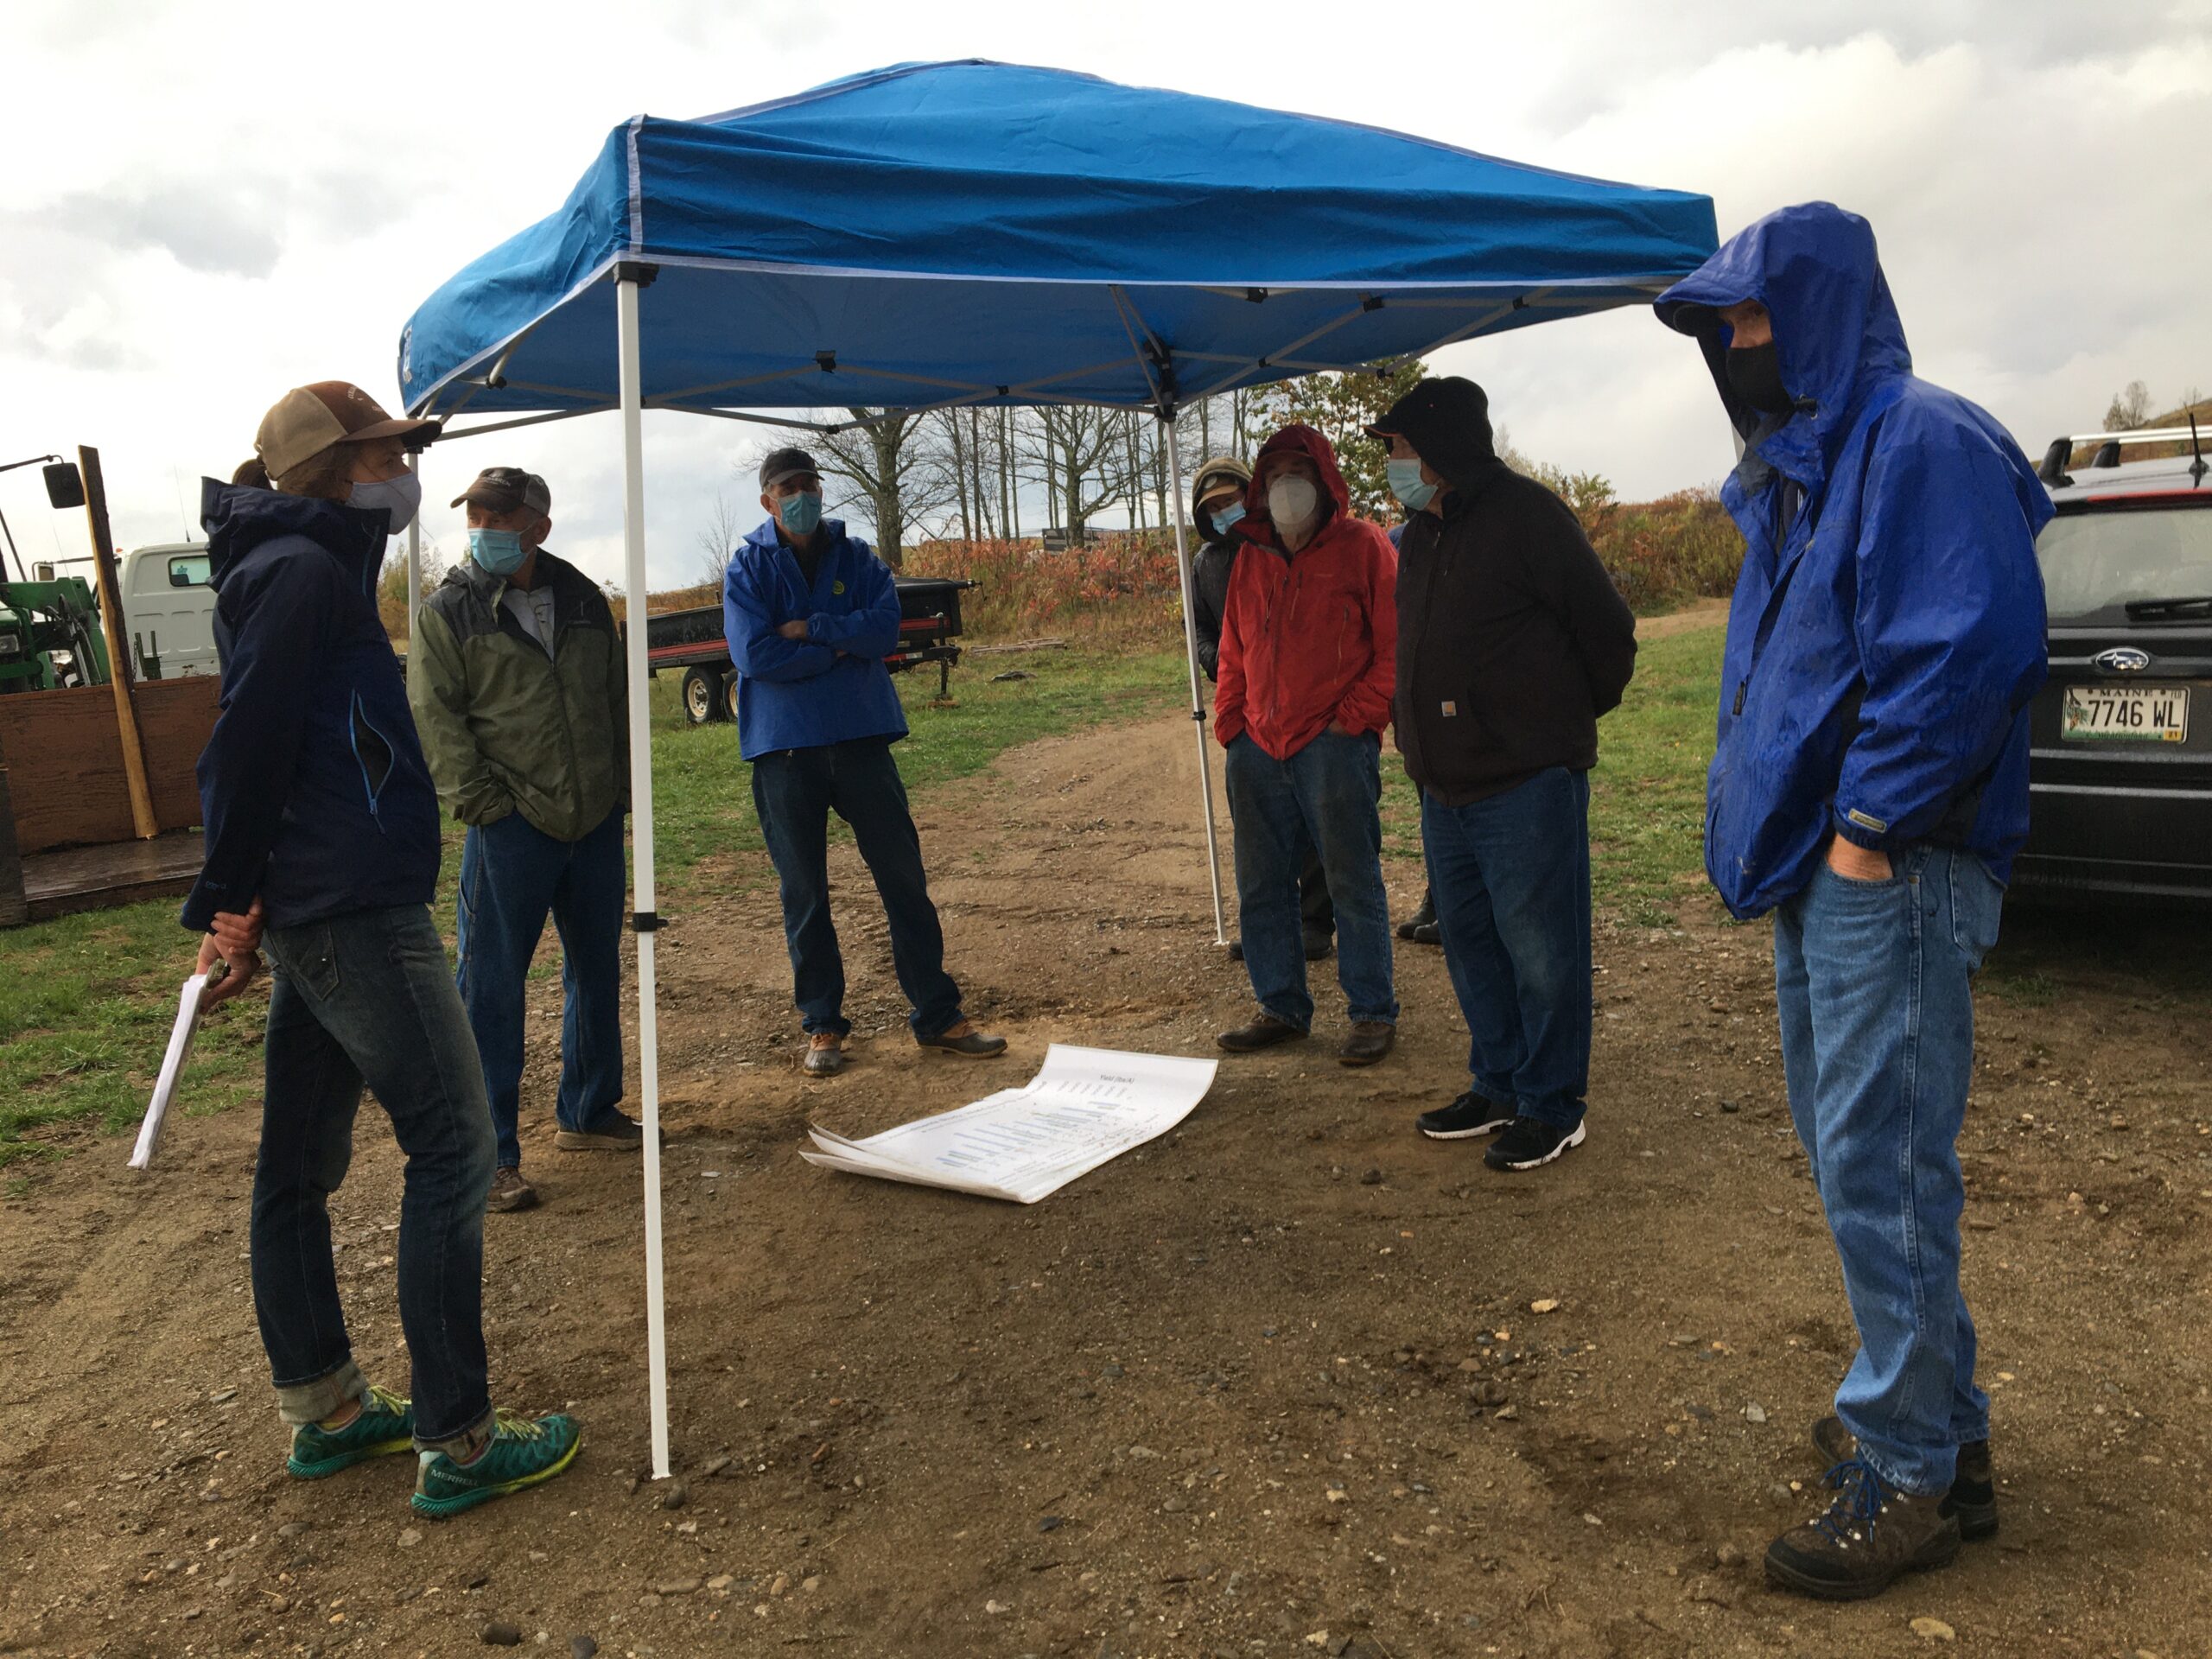
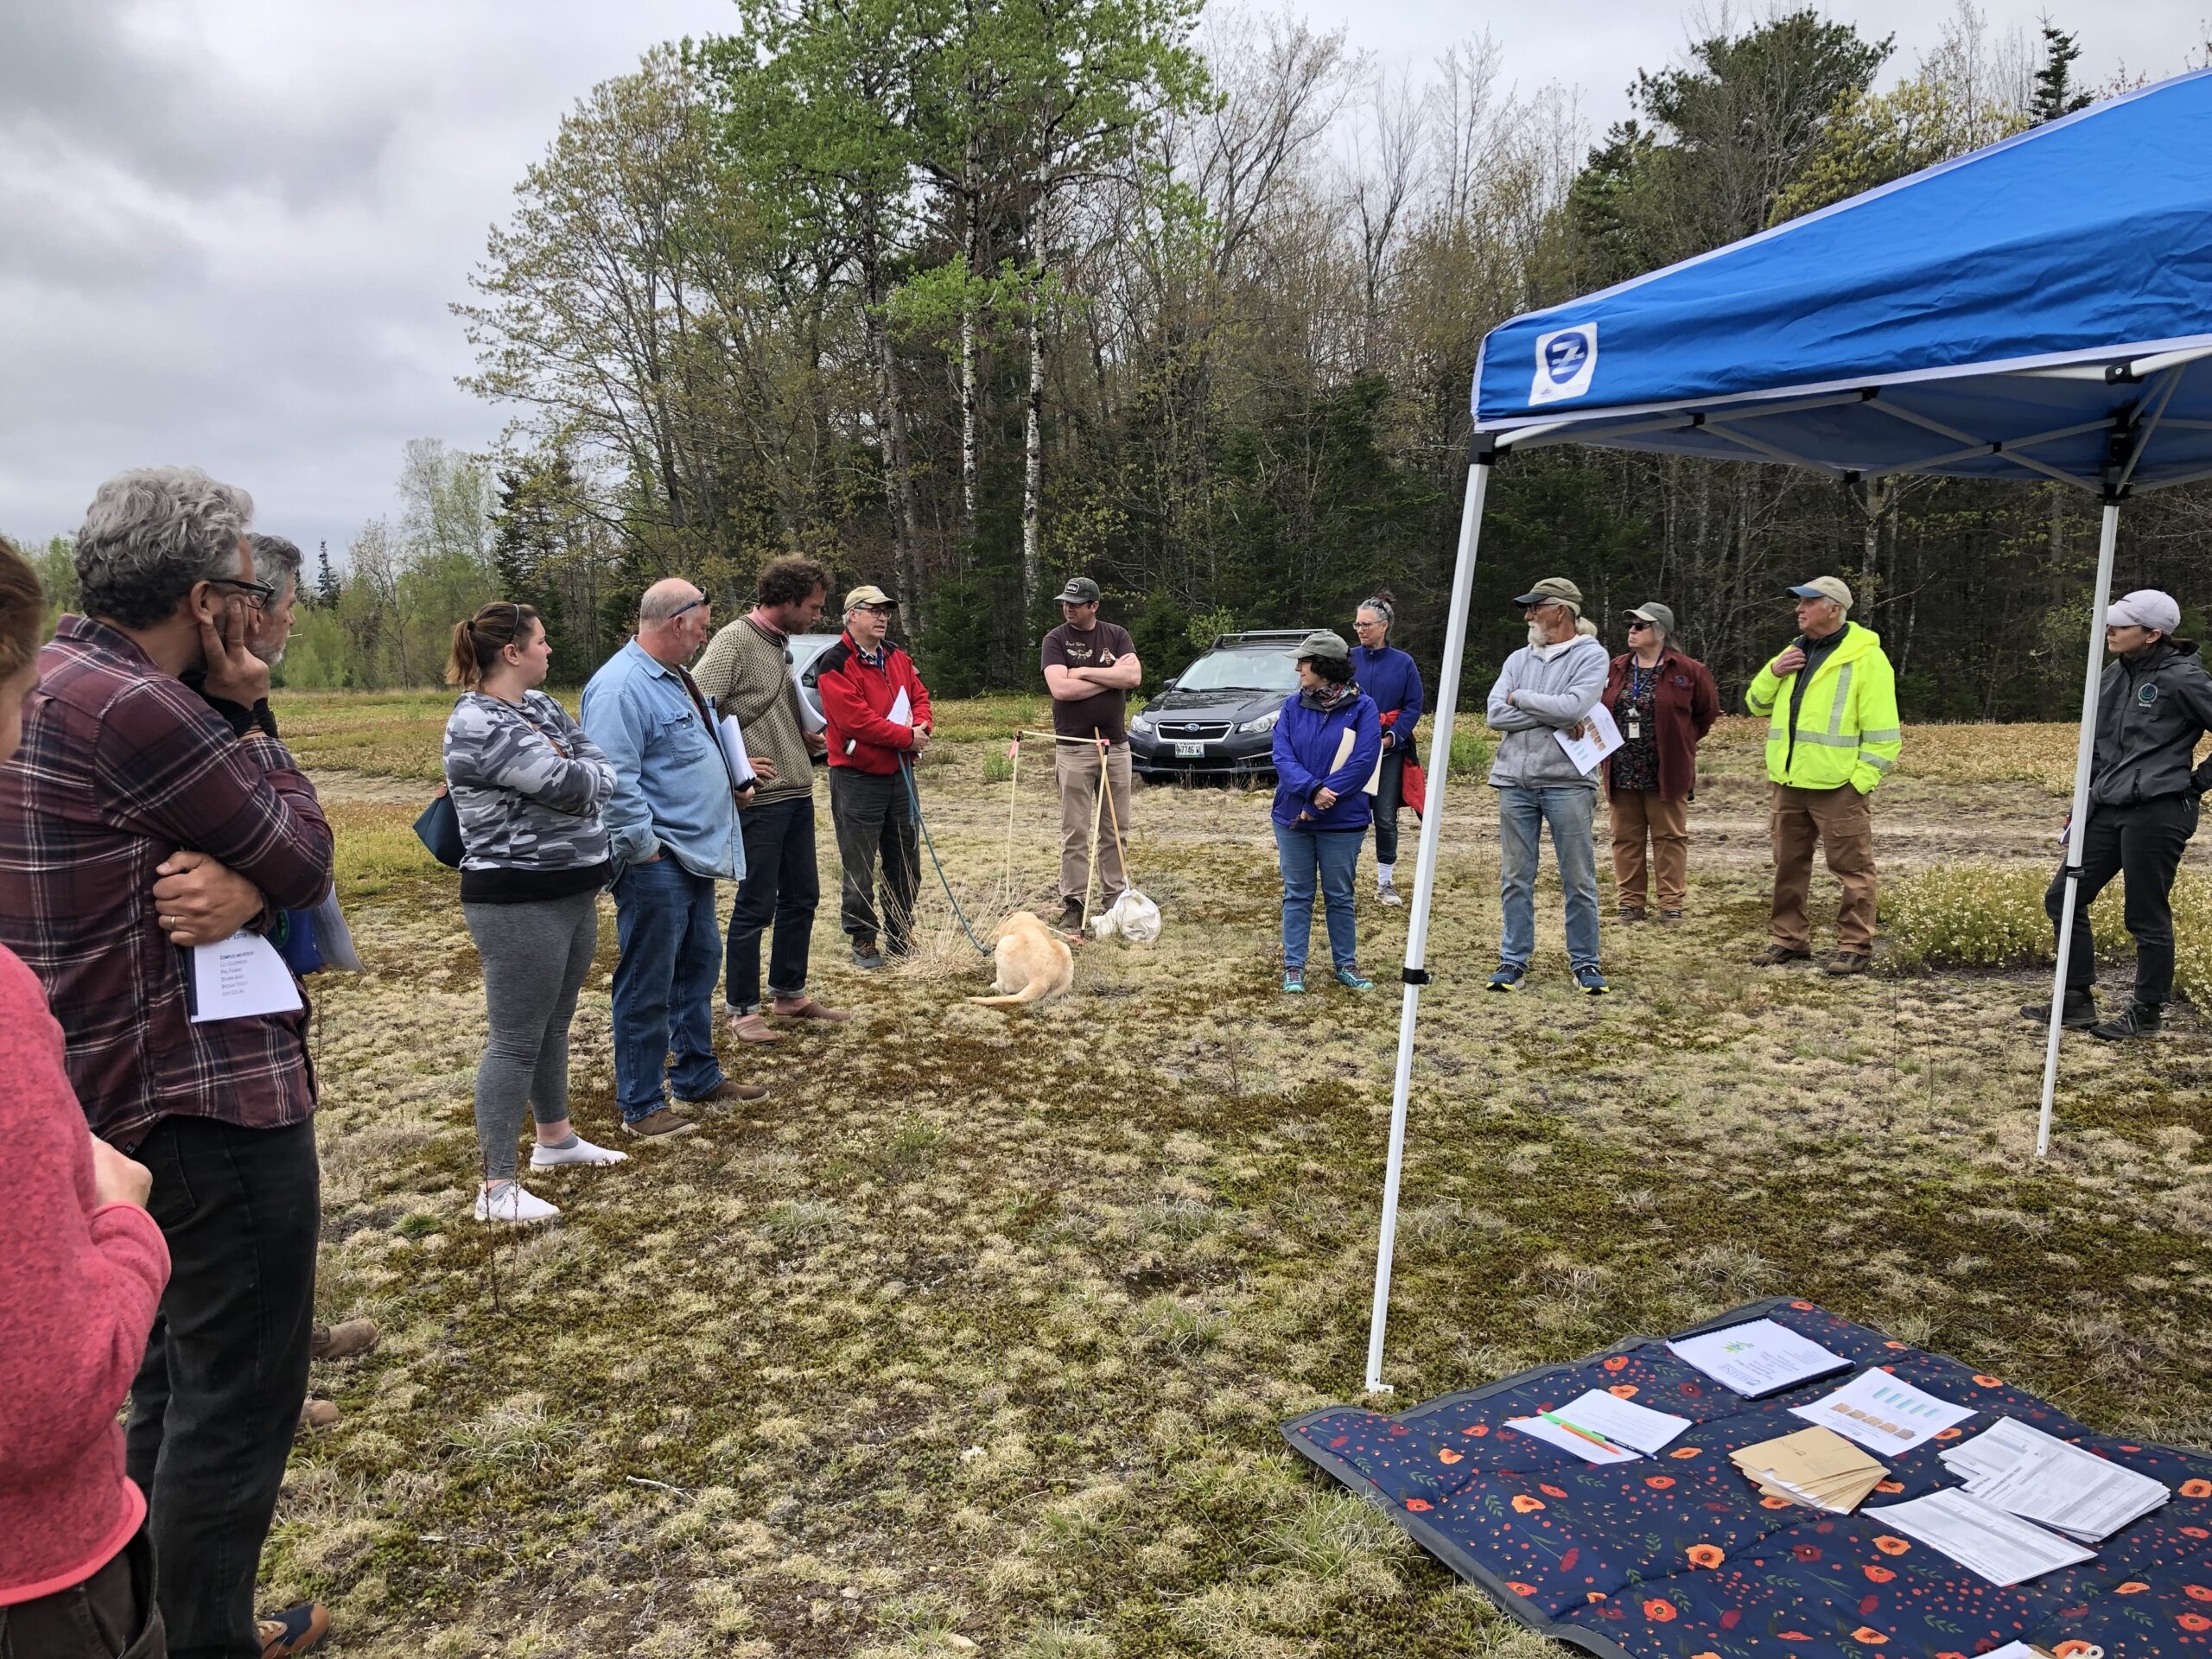
In 2022 the Wild Blueberry Conference was held virtually again and included a research update on this project and a weed management session which included organic management practices. Recordings can be found here. These two sessions (March 8 and 15) had a total of 98 attendees. On May 20, 2022 an organic field meeting was held in Surry which had 25 attendees. Our wild blueberry newsletter regularly reaches 750 recipients (500 online and 250 in print) where important project updates are shared.

Milestones
1. Four farmers give feedback on research trial design and treatments.
4
4
5
July 31, 2019
Completed
August 01, 2021
From discussion with members of the advisory group the chicken manure treatments of the fertility trial are of interest and further study was suggested to look at lower rates of chicken manure which may cause less of a weed problem. Mulch is also a material of great interest after the 2020 drought conditions. Without water, plants can't take up the nutrients they need.
Findings on tine weeding experiment are not promising for reliable weed management. Advisory group was pleased that mechanical weeding was looked at in this manner. "It is valuable to know that tine weeding reduced perennials. Those are the most common weeds in my fields but I have a bumpy field so it might not be the best option" - Wild Blueberry Farmer
2. Three farmers host the three replications of the nutrient research trial on their farm.
4
1
4
4
August 31, 2019
Completed
August 31, 2021
Trials were established in 2019 and continued through 2021. The trials will remain in place for reduced data collection and harvest in 2022.
The 4 farm locations as planned hosted research trial replications (Jonesboro, Surry, Appleton, and Columbia Falls). An additional mulching trial began in 2020 as a spin off from this project with the goal of understanding what particle size of mulch would be best for nutrient and water holding capacity in wild blueberry. The funded grad student on this project also worked on the mulching project which was held at yet another organic wild blueberry field in Stockton Springs, ME.
3. One farmer hosts the irrigation demonstration.
15
5
85
15
September 30, 2021
Completed
July 08, 2021
An irrigation demonstration was competed at the UMaine Wild Blueberry Field Day in Jonesboro, ME on July 8th 2021. This is our biggest field day with the most attendance from both farmers and ag service providers. Attendees found it very helpful to see the current irrigation system at the UMaine farm. The above ground piping is typical of what some wild blueberry farms in Maine currently have. Moving forward newer irrigation technology will be discussed. Irrigation is seldom used on small and medium wild blueberry farms yet recent drought conditions have forced the topic to surface again. New irrigation systems would have to be partially funded by NRCS or another federal agency as this infrastructure is too expensive for most family farms to invest in. Therefore, it was especially valuable to have NRCS present at this demonstration to share how wild blueberry can be irrigated and have farmers who attended demonstrate the need for irrigation.
This demonstration spurred a later Ag Service Provider event specific to irrigation at Wyman's of Maine. Wyman's - a large wild blueberry company- does irrigate using several different guns and water sources. People who attended included myself (UMaine Extension), Eric Venturini (Wild Blueberry Commission of Maine), Amanda Beal, Commissioner of Ag (State of Maine Dept of Agriculture), Wyman's agronomists, and several District Conservationists from NRCS in addition to Tony Jenkins the Resource Conservationist.
4. Four trial host farmers collect production and sales data and report their 2018, 2020, and 2022 average blueberry yield/acre and average price (excluding trial plots, organic acres).
3
3
November 30, 2019
Completed
January 31, 2023
Yield is reported for 3 of the farms for the 2020 and 2022 harvests in the table below. Yield did not only increase because of this project but can be assumed to be partially responsible. Pollination and drought were major differences between years and farmers that impacts yield.
| Field | Yield/ac 2020 | Yield/ac 2022 |
| Hope | 14770.96 | 17795.96 |
| Surry | 3123.59 | 22568.74 |
| Columbia Falls | 6569.85 | 38720.00 |
The number of certified organic wild blueberry acres in Maine has increased from 1,800 acres in 2018 when the total organic yield was 740,000 (411 lbs/acre) to 3015 acres in 2022. In 2021 (most recent numbers), total organic yield was 1.5M lbs on 2,636 acres (569 lbs/acre).
Organic wild blueberries are sold for $13.00/lb fresh and $5.00/lb frozen (average market values) and it costs approximately $3.00 to produce each pound with an average yield of 2,000lbs/acre.
For organic growers who sell their berries to the organic frozen commodity market in Maine, prices were $1.64/lb in 2017 and are $1.34/lb in 2022. This decline is more due to the lack of marketing. However, the demand for organic wild blueberries is high. RAS Wines, a large local purchaser of organic lowbush blueberries, increased their annual purchase from 18,000 lbs in 2020 to 32,000-40,000 lbs in 2021. Three prominent organic farms in Maine have already begun to engage with the trends, making online sales of organic lowbush frozen berries, powder, chips, and tea, where 12oz of powder is sold for $64.00 ($5.30/oz).
5. 10 farmers receive individual assistance with adoption of a new management practice through phone
consultations and/or site visits.
10
19
1
December 31, 2019
Completed
January 28, 2022
Calderwood has documented individual consultations with 19 organic growers or interested-in-organic growers over 3 years of this project. Communicating best organic management practices with these 19 producers impacts the management of 1000 wild blueberry acres in Maine.
6. 200 blueberry farmers attend the Maine Wild Blueberry Conference.
200
400
33
March 31, 2022
Completed
March 17, 2022
In 2019 there were 160 attendees at the UMaine Wild Blueberry Conference.
In 2020 there were 90 attendees at the UMaine Wild Blueberry Conference.
In 2021, the conference occurred virtually for two hours on Wednesdays and Fridays from January-March. A total of 1168 attendees signed on for all sessions but these are repeated people. 200 individuals attended at least one conference session in 2021 with 183 people attending sessions that specifically covered organic crop management.
7. 40 blueberry farmers from ME, MA, NH, and Canadian provinces who attend at least one of two field days or the conference report learning about a new management practice.
40
326
10
December 31, 2020
Completed
July 08, 2021
20 organic growers attended the 2019 Organic Field Day in Dresden ME.
91 growers attended the 2019 Annual Wild Blueberry Field Day in Jonesboro ME (approximately 20% were organic)
61 growers attended the 2020 Virtual Wild Blueberry Field Meetings (approximately 30% were organic)
30 growers indicated that they learned about weed management at the 2021 Wild Blueberry Field Day (2021 Field Day Survey)
17 growers indicated that they learned about weed management at the Virtual Wild Blueberry Conference in 2021 (Conference Survey)
An additional 17 growers indicated that they learned about nutrient and pH management at the Virtual Wild Blueberry Conference in 2021 (Conference Survey)
9. 200 blueberry farmers from ME, NH, MA, and Canadian provinces watch at least one of 6 webinar/conference videos posted to our YouTube channel.
200
130
12
November 30, 2022
Completed
January 28, 2022
10. 600 Northeast (ME, NH, MA, and Canadian provinces) blueberry farmers receive the Lowbush Blueberry Management Guide.
600
300
100
November 30, 2022
Completed
January 31, 2023
Print copies can be requested via UMaine, and the digital file can be found here: https://projects.sare.org/?post_type=information_product&p=971080
10. 1000 Northeast (ME, NH, MA, and Canadian provinces) blueberry farmers receive blueberry newsletter and factsheets.
1000
March 31, 2021
In Progress
11. 40 blueberry farmers attend at least one of two field days held in 2021 and report learning about a new management practice.
40
September 30, 2022
In Progress
12. 30 blueberry farmers from ME, NH, MA, and Canadian provinces attend some or all of three webinars and report learning about a new management practice
30
December 31, 2021
In Progress
13. Ten farmers receive individual assistance with adoption of a new management practice through phone consultations and/or site visits.
10
December 31, 2021
In Progress
14. 30 blueberry farmers attending at least one of two field days held in 2022 report learning about a new management practice.
30
November 30, 2022
In Progress
15. 30 blueberry farmers ME, NH, MA, and Canadian provinces attend some or all of three webinars and report learning about a new management practice.
30
November 30, 2022
In Progress
16. 200 blueberry farmers from ME, NH, MA, and Canadian provinces watch at least one of 6 webinar videos posted to our YouTube channel.
200
November 30, 2022
In Progress
17. Three trial host farmers collect and submit their 2020, 2021, and 2022 average blueberry yield and average price data, excluding trial plots
3
November 30, 2022
In Progress
18. 600 Northeast (ME, NH, MA, and Canadian provinces) blueberry farmers receive the Lowbush Blueberry Management Guide.
600
November 30, 2022
In Progress
19. Ten farmers receive individual assistance with adoption of a new management practice through phone consultations and/or site visits.
10
November 30, 2022
In Progress
Milestone activities and participation summary
Educational activities:
Participation summary:
Learning Outcomes
23 new and transitioning growers asked about managing wild blueberry organically in 2019 - 2022.
11 organic growers contacted me about learning how to manage fields that they had recently begun managing. Wild blueberry fields that have not been managed in a few years are over grown, making weed management very important. These growers gained knowledge, skills, and awareness of weed, nutrient, and soil management.
One wild blueberry grower wanted to discuss the difficulty in getting a farm loan for wild blueberry due to the lack of market for wild blueberry in general.
One grower wanted to learn more about managing pollinator habitat on organic wild blueberry land.
Service providers ask about mulching, applying sulfur for weed management, and if burning actually helps to manage mummy berry.
Survey data provides the # who gained knowledge and those who planned to change a management practice. Totals are above and breakdown is below.
| 2020-2023 Survey Data |
| Documented Gaining Knowledge |
| 2020 conference - 47 weeds (47) |
| 2021 conference - 17 weeds, 15 mulch, organic 9 (41) |
| 2021 field day - 30 weeds, 28 mulch (58) |
| 2022 conference - 4 weeds, 5 nutrients, 4 mulch (13) |
| 2023 conference- 27 weeds, 30 mulch (57) |
| Documented that they Plan to Implemented Something Learned |
| 2021 conference - 16 org weeds, 10 fert, 13 mulch (39) |
| 2021 field day - 20 weeds, 13 mulch (33) |
| 2023 conference- 15 weeds, 16 mulch (31) |
Performance Target Outcomes
Target #1
50
adopt at least one new weed, nutrient, or irrigation management practice
500
5 managing certified organic farms will increase their average yield by 500 lbs/acre on a total of 100 acres
19
Adopted weed management especially, how and when to apply sulfur to reduce soil pH which is a known grass management tool. Adopted different burn-pruning practices that allow for mummy berry management while saving organic matter. Applied Entrust as organic SWD control around field edges rather than whole field.
1,000 acres
Yield increased from 2020 to 2022 (the two harvest years) at research sites. More importantly our education efforts paid off in that the number of certified organic wild blueberry acres in Maine has increased from 1,800 acres in 2018 when the total organic yield was 740,000 (411 lbs/acre) to 3015 acres in 2022. In 2021, total organic yield was 1.5M lbs on 2,636 acres (569 lbs/acre).
Yield increased from 2020 to 2022 (the two harvest years) at research sites. This data is in our research reports (UMaine SARE Org. Amend. 2020 Calderwood and UMaine SARE organic amend 2022_Calderwood).
The number of certified organic wild blueberry acres in Maine has increased from 1,800 acres in 2018 when the total organic yield was 740,000 (411 lbs/acre) to 3015 acres in 2022. In 2021, total organic yield was 1.5M lbs on 2,636 acres (569 lbs/acre). This data is from MOFGA (Maine Farmers and Gardeners Association).
Additional Project Outcomes
Information Products
- 2022 Research Update Webinar
- Comparison of Wood Mulch Particle Sizes for Wild Blueberry Management in a Changing Climate
- Field Guide to Wild Blueberry Production and Integrated Pest Management (IPM)
- Tine Weeding as a Weed Management Tool for Wild Blueberry (Vaccinium angustifolium) Growers in Maine
- 2022 Research Report: Effects of Organic Soil Amendments on Physiology and Pests