Final report for LNE19-384R
Project Information
Biochar, a carbon-rich material intended for soil and environmental applications, is a relatively new product for the ornamental horticulture industry with applications and understanding of the impacts of biochar to field and container nursery crops limited. This study aimed to address questions from nursery growers on recommended field and container rates of biochar as well as enhance understanding of biochar’s potential to improve nutrient and water retention in field and container nursery production. Our study evaluated the impact of a hardwood biochar applied at three rates on nutrient availability, soil water retention, and plant response in commercial field production of California privet (Ligustrum ovalifolium) and Douglas fir (Pseudotsuga menziesii), and container production of switchgrass (Panicum virgatum ‘Heavy Metal’), Japanese forest grass (Hakonechloa macra ‘Aureola’), and boxwood (Buxus x ‘Green Mountain’) over a three-year period. Study results showed that hardwood biochar applied to both container and field-grown ornamental plants had a variable impact on water retention and nutrient leaching. No consistent positive impacts were observed with increasing biochar application rate in any of the trials. While few increases in tissue nutrient levels in aboveground biomass were observed with increasing biochar rates, there was significant variability. This study supports the need for biochar to be inoculated with a nutrient rich material prior to use and incorporated into the soil to prevent loss, but no concrete recommendations can be provided on application rate due to variable results.
The Covid-19 pandemic greatly limited our outreach potential for in-person contact during the course of the project. In fall 2020, we offered a 4-part biochar webinar series that was very successful and reached an international audience. As of October 2022, total viewings for the series were nearly 80,000. Further, conversations with farmers and agricultural educators revealed that this project increased awareness of what biochar is, its benefits, where to purchase it (e.g., suppliers), and its practical applications (e.g., pre-treatment needs and methods of application). Farmers are increasingly asking about and using biochar in their production systems as well as trying to produce it themselves.
This is an innovative project that aims to enhance understanding of biochar’s impact on both field and container nursery production. Working directly with nursery growers in Suffolk County, our goal is to evaluate if biochar can contribute to on-going agricultural stewardship efforts by increasing nutrient availability and soil water retention, and decreasing leaching losses. The knowledge gained would increase accuracy of biochar use recommendations and rates for nursery producers both within the County and regionally.
Less than 50 miles east of New York City is Suffolk County, New York (NY). Suffolk County is home to more than 550 agricultural and horticultural producers - covering over 34,000 acres of farmland- and is the leading NY County in total value of horticultural products sold. The intensity of agricultural production and the region’s sandy soils, however, make the ground and surface waters of Long Island vulnerable to contamination. Producers must adopt best management practices that minimize potential agricultural inputs to waters to ensure the sustainability of agriculture in the region. Biochar, a carbon-rich material intended for soil and environmental applications, is well known to decrease soil bulk density, increase porosity, and enhance water and nutrient retention. However, it is a relatively new product for the ornamental horticulture industry with applications and understanding of the impacts of biochar in field and container nursery crops limited. This study aimed to address questions from nursery growers on recommended field and container rates of biochar as well as enhance understanding of biochar’s potential use in field and container nursery production. Our study evaluated the impact of biochar type and application rate on nutrient availability, soil water retention, and plant response in commercial field production of California privet (Ligustrum ovalifolium) and Douglas fir (Pseudotsuga menziesii), and container production of Switchgrass (Panicum virgatum), Japanese forest grass (Hakonechloa macra ‘Aureola’), and Green Mountain Boxwood (Buxus x ‘Green Mountain’). We hypothesized that biochar type and rate would impact moisture status and nutrient uptake by the crops and that nutrient retention would increase as biochar application rate increased, thus increasing soil water retention and decreasing leaching losses.
Cooperators
- (Educator and Researcher)
Research
The goal of this study is to investigate the effects of biochar on nutrient availability and uptake and soil water retention in field and container nursery production. We hypothesize that biochar amendments will enhance moisture status and nutrient uptake by the crops, and hence, decrease runoff and leaching losses ultimately contributing to on-going agricultural stewardship efforts in Suffolk County. We also hypothesize that biochar application rate will impact soil water and nutrient retention, with retention increasing as biochar application rate increases.
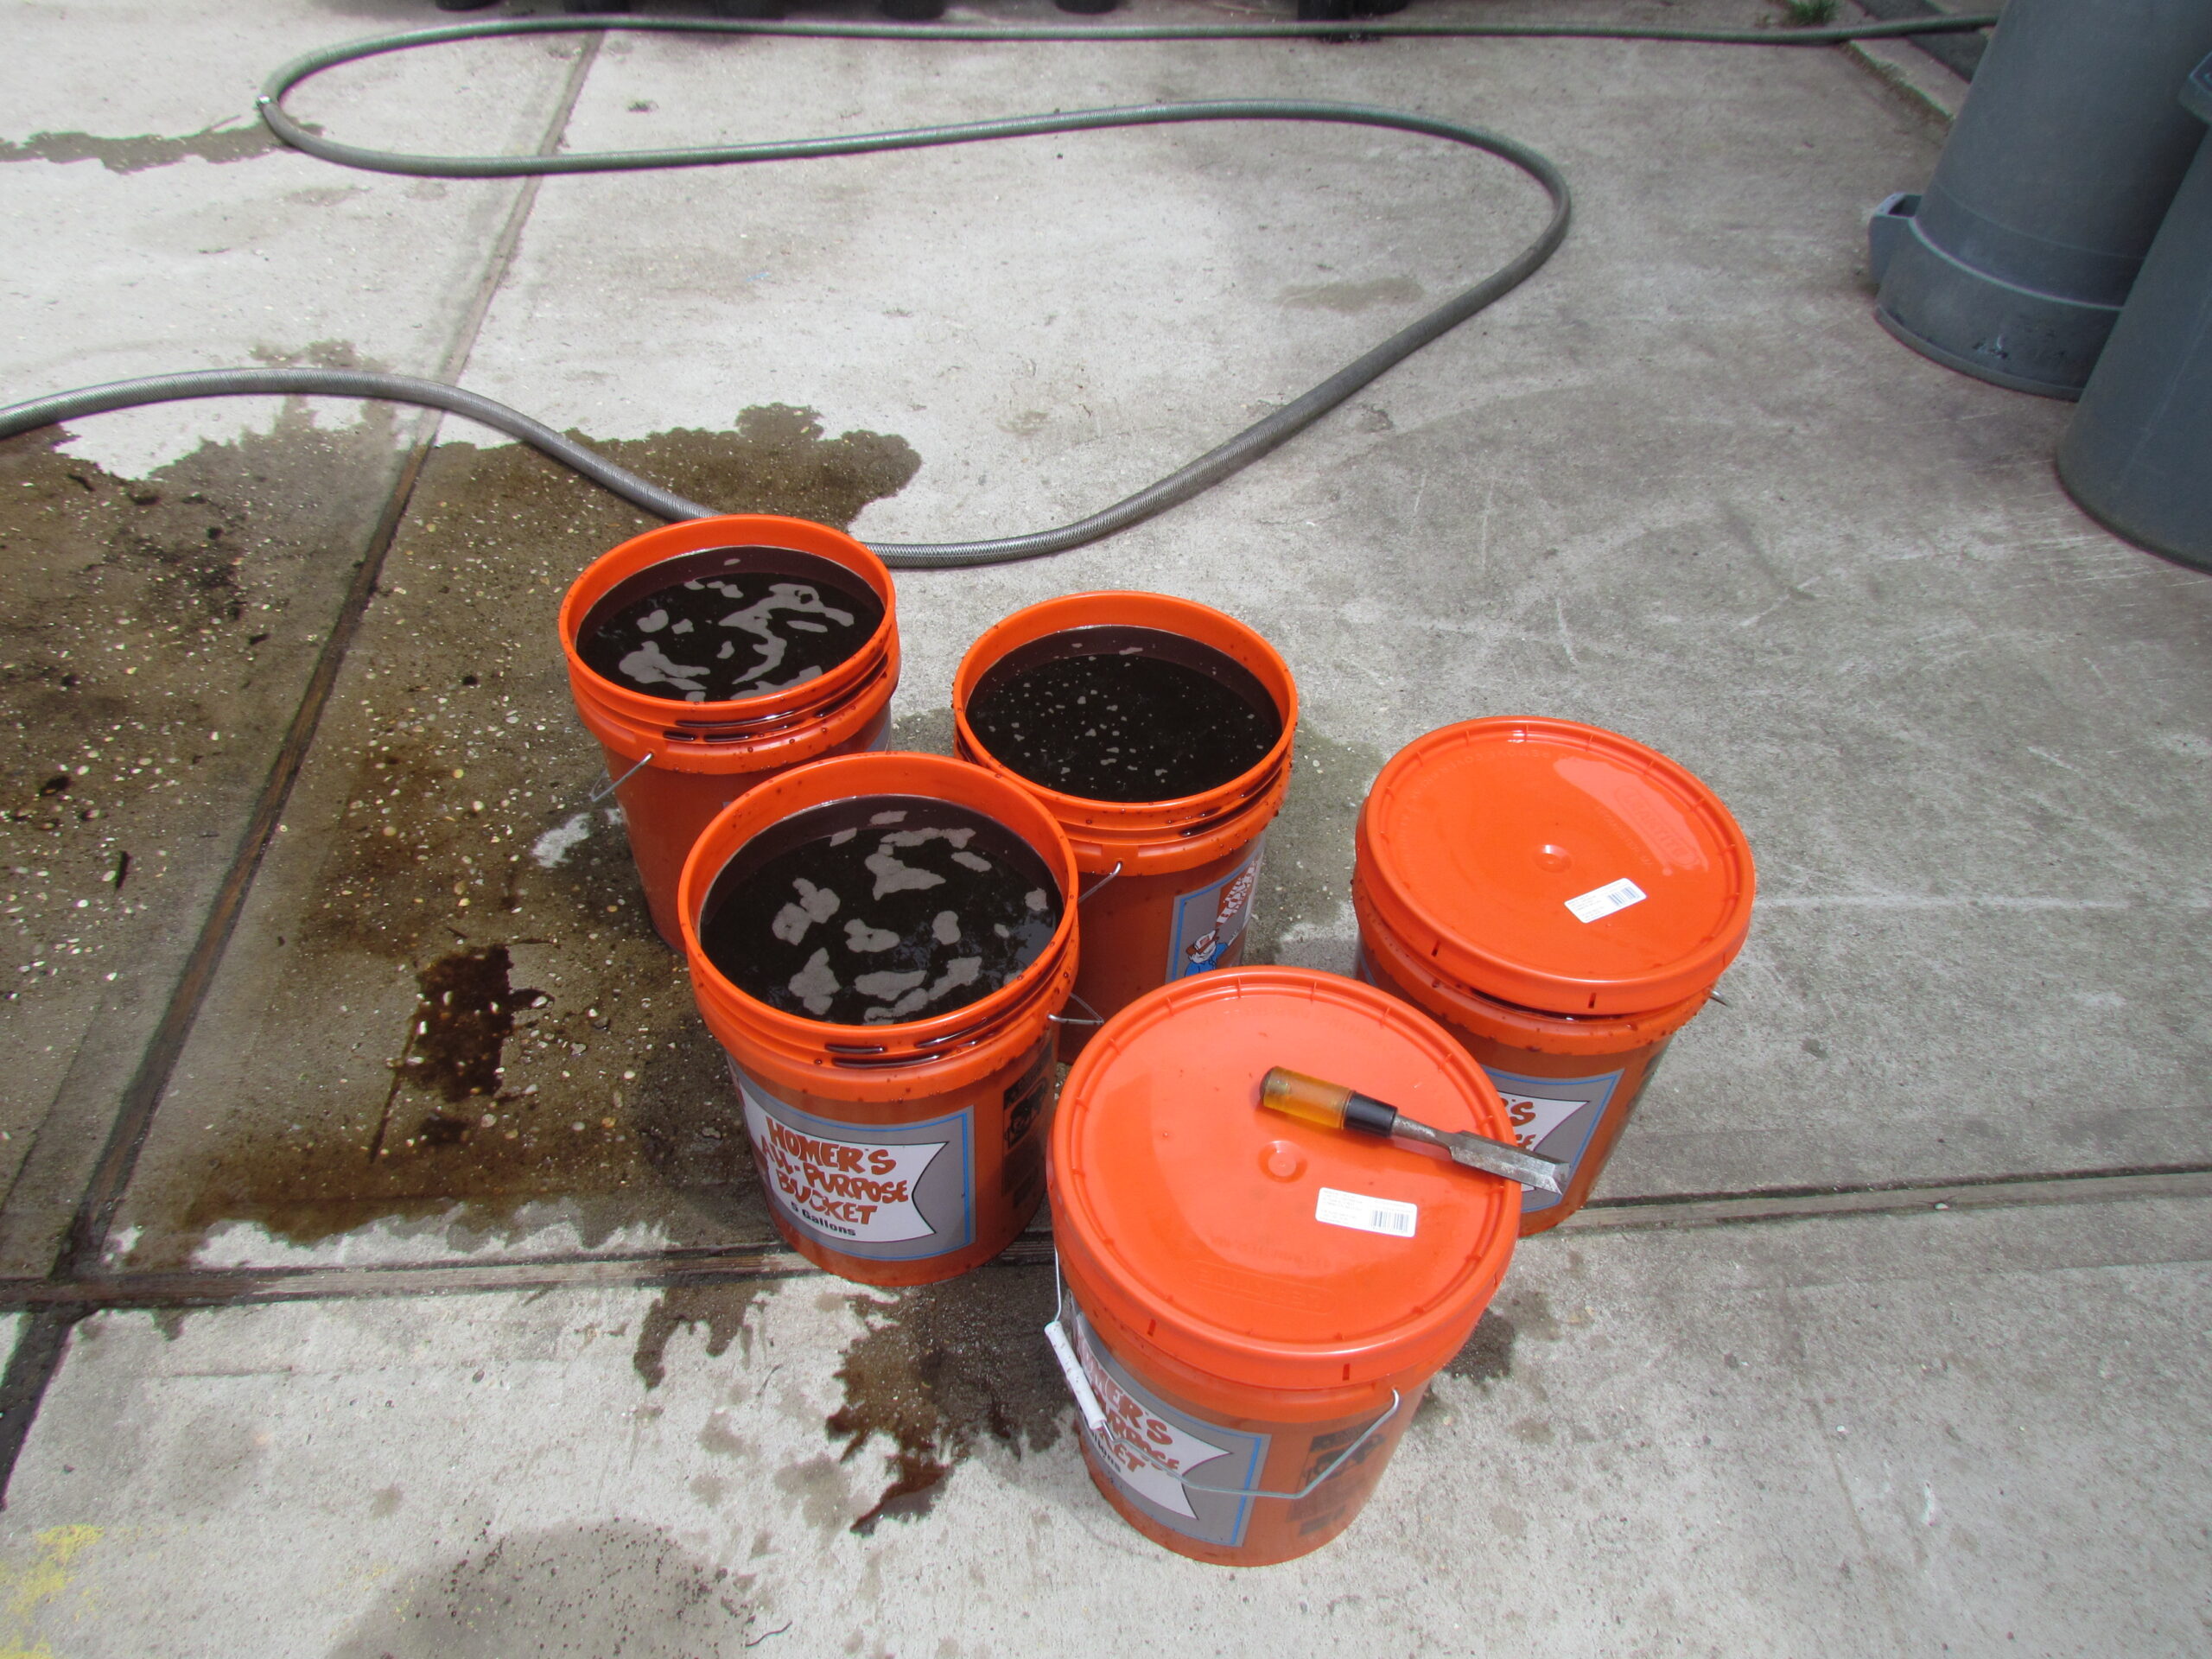
Field experiments were established at a privet nursery in Riverhead, NY and a Christmas tree farm in Cutchogue, NY in 2019. A third field trial was established at another privet nursery in Baiting Hollow, NY in 2020. Container experiments were established at the Cornell University Long Island Horticultural Research and Extension Center (LIHREC) in Riverhead, NY, and a local nursery specializing in container production in Cutchogue, NY in 2019. In April 2019, a preliminary biochar column test was conducted using four different biochar types and a typical sandy loam soil from Long Island to determine which biochar type led to the greatest water retention. Results of this preliminary column test supported the use of an oat hull biochar. But our grower collaborators preferred the use of a hardwood biochar based on previous studies they had read as well as a future local supply. We thus selected to use a hardwood biochar for both the field and container trials. The hardwood biochar came from ARTiChar – Advance Renewable Technology International (Prairie City, IA). The biochar material was inoculated for five days in a compost tea solution prior to application. In June 2019, both the container and field trials were established. The same biochar was used in the field and container trials. Only a oat hull biochar was added for the container trials in year 3.
Container Trials:
Year 1 – 2019 Container Trials
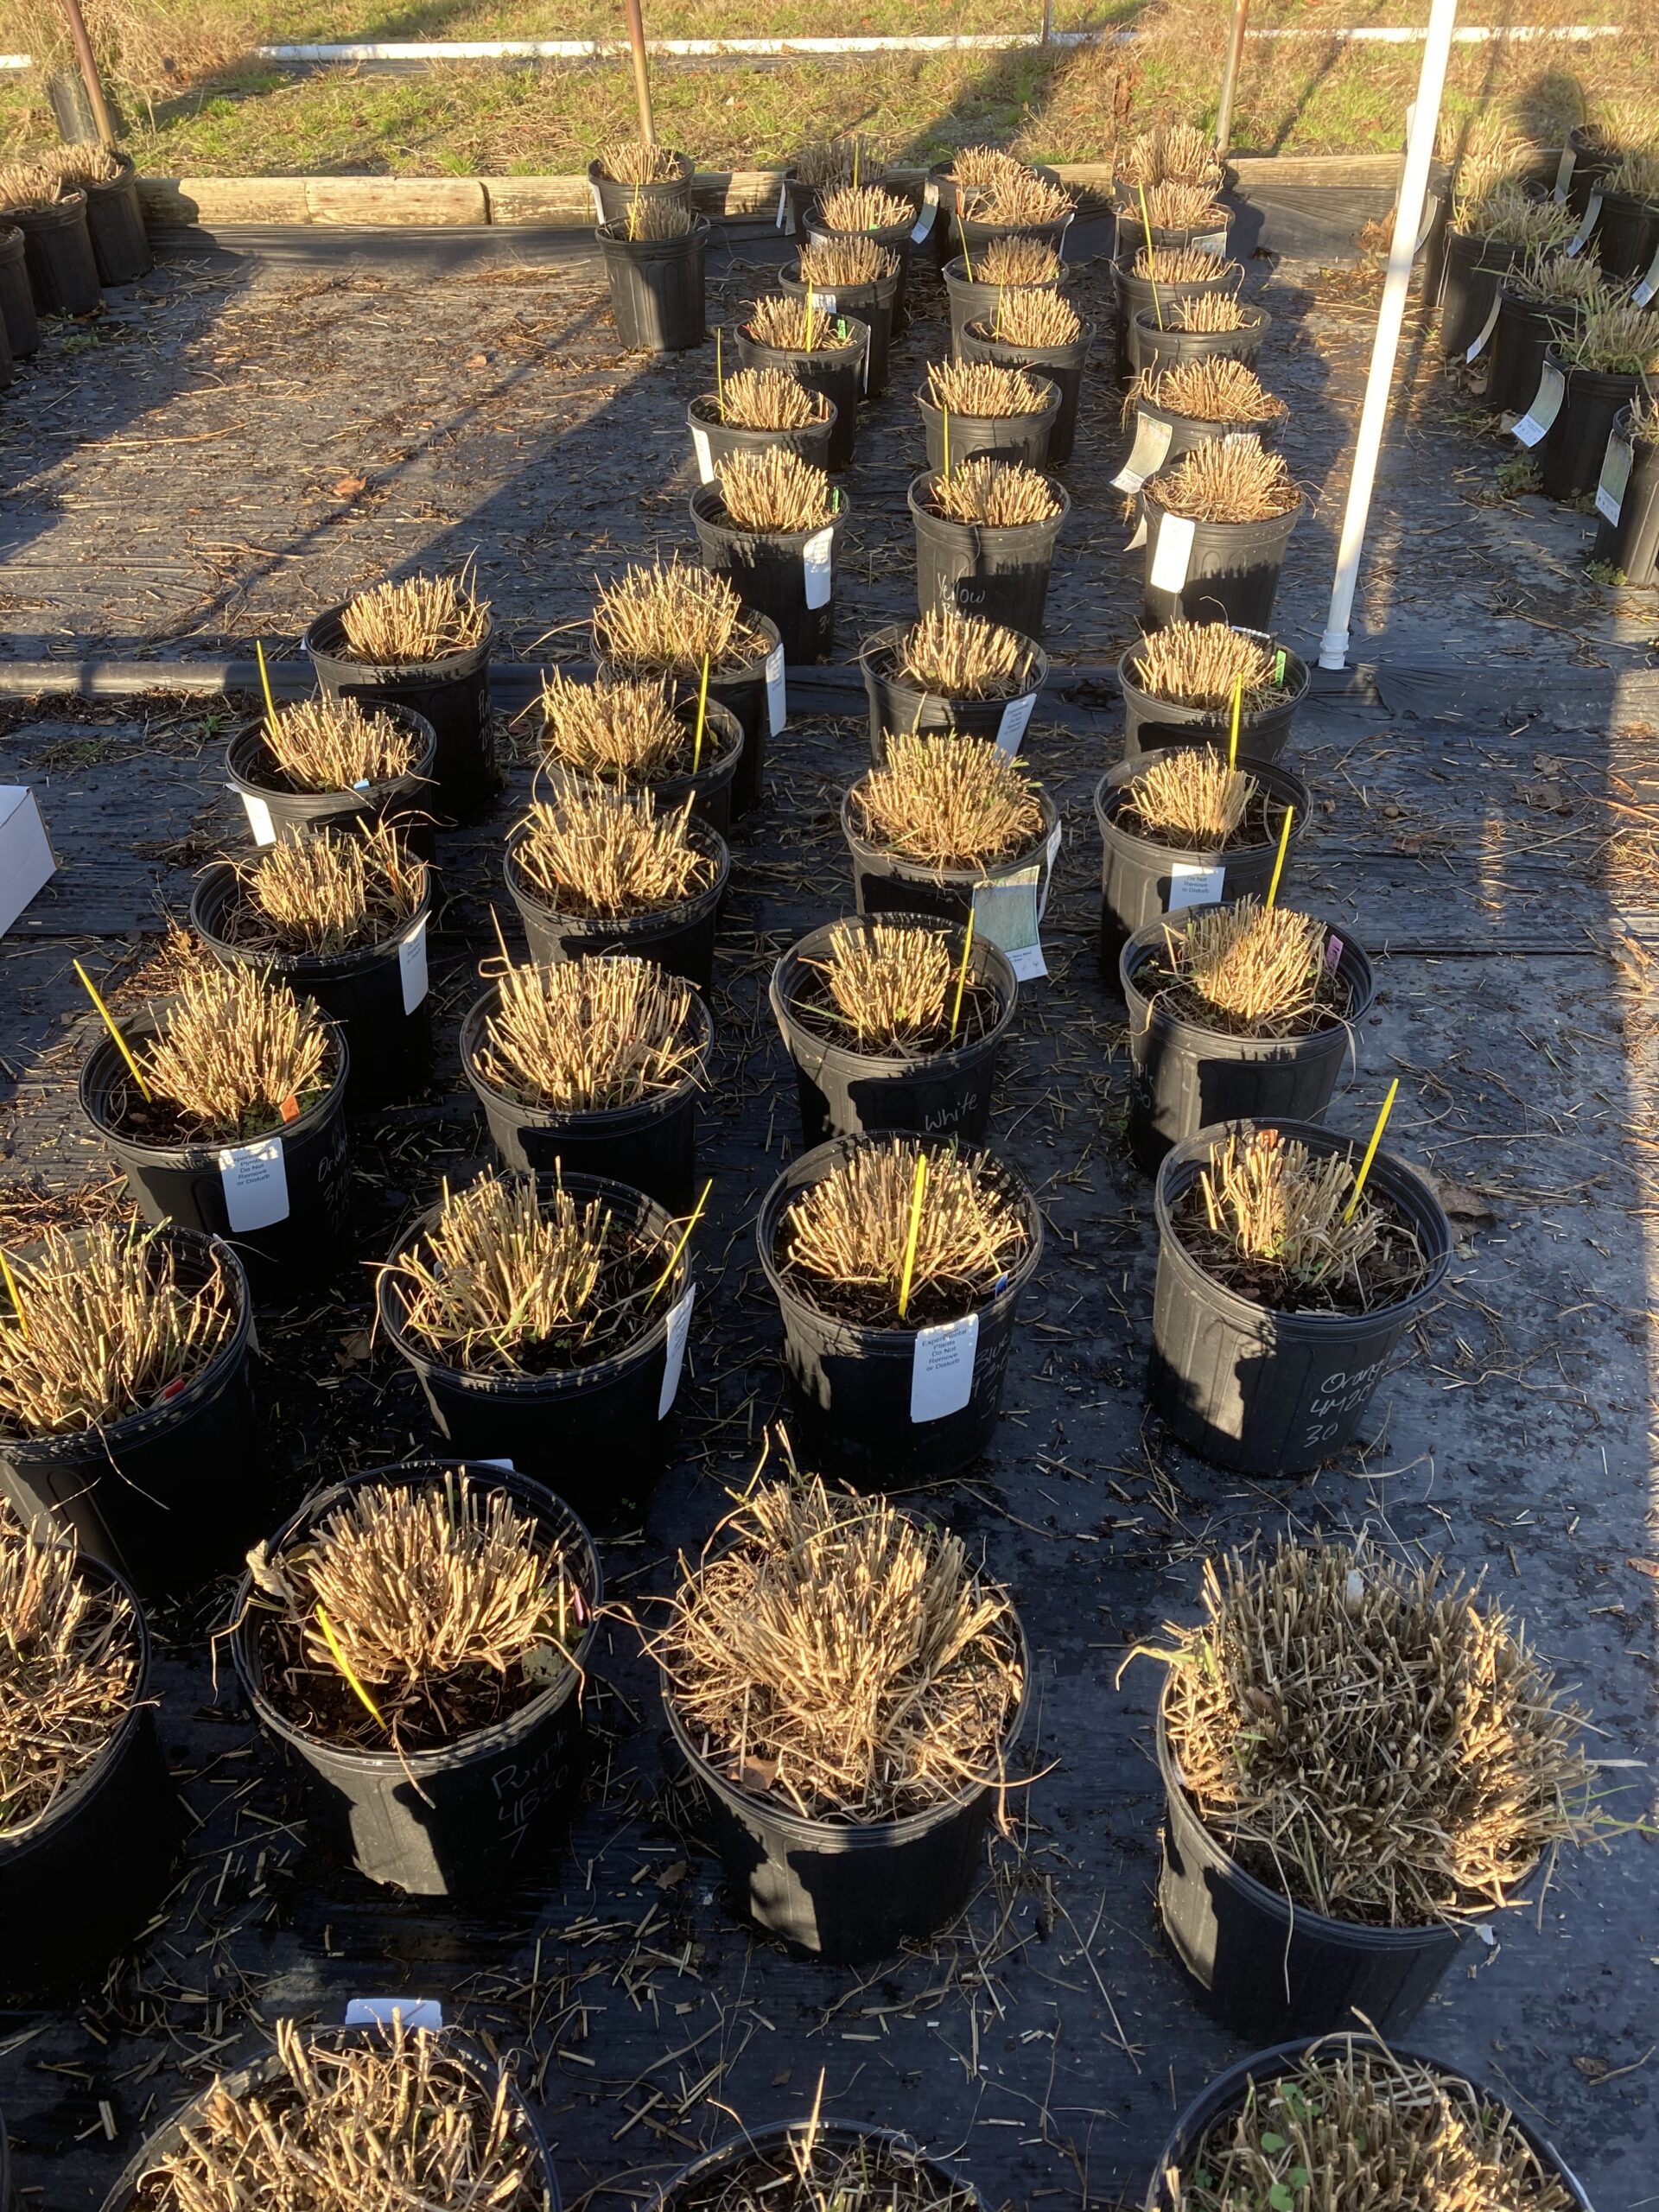
Biochar was substituted into a bark-based growing media at rates of 10, 20, and 30% by volume. Biochar was incorporated using two different methods (mixed versus layering at the bottom of the substrate). Containers with no biochar served as the control. Treatments were marked as: B10 (biochar at bottom 10%), B20 (biochar at bottom 20%), B30 (biochar at bottom 30%), C (no biochar control), M10 (biochar mixed into media at 10%), M20 (biochar mixed into media at 20%), M30 (biochar mixed into media at 30%). The experiment was arranged as a completely randomized design with each container serving as the experimental unit. Plants studied at the LIHREC included boxwood (Buxus x Green Mountain), California privet (Ligustrum ovalifolium, 2021 only), and switchgrass (Panicum virgatum “Heavy Metal”). Only switchgrass (Panicum virgatum “Heavy Metal”) was trialed at the local nursery in Cutchogue. Biochar treatments were applied at the time of planting into 1.5-gallon plastic containers June 2019 for the switchgrass, July 2019 for the privet, and into 3-gallon containers for the boxwood. The media was a professional grow mix of two grades of pine bark. The nursery grower provided the fertilized and limed media blend used in our trials every year. Irrigation at the LIHREC was done using spray stakes and with overhead micro-irrigation at the local container nursery.
The PourThru procedure (LeBude and Bilderback, 2009) was conducted weekly on all container plants from mid-June through the end of September to monitor leachate pH and EC levels; testing pH and EC was levels was done in-house. Leachate samples collected mid-summer were sent to Brookside Laboratories, Inc. (New Breman, Ohio) for complete nutrient analysis. Additional leachate samples were sent to Brookside Labs for total nitrogen analysis (nitrate and ammonium nitrogen) in late September and October. Plant heath evaluations of the boxwood plants occurred once per month during the summer on 7/15/2019, 8/19/2019, and 9/9/2019. Data on pest and disease prevalence were collected and an overall plant health rating was given on a scale of 1 to 5. Plant heath evaluations of the switchgrass plants occurred approximately every 30 days during the summer months. Data on number of flower stems per plant, disease, chlorosis, and overall plant health were collected. Destructive sampling of the switchgrass containers at the LIHREC occurred mid-September to evaluate differences between treatments on shoot and root growth in year one. Tissue nutrient analyses were collected from all container trials and analyzed by Brookside Laboratories, Inc.
Year 2 – 2020 Container Trials
In March 2020, an initial PourThru was conducted on the overwintering (2019) boxwood and switchgrass plants prior to fertilizing them for the season. PourThrus were conducted every two weeks to monitor EC, pH, and N levels, and periodic plant health evaluation data were collected on the 2019 plants until they were destructively sampled in mid-June; at that time, data were collected on root ball and shoot dry weight.


Image: Example of a switchgrass root ball with the 30% mixed vs. bottom biochar treatments and control. Photo taken June 2020.
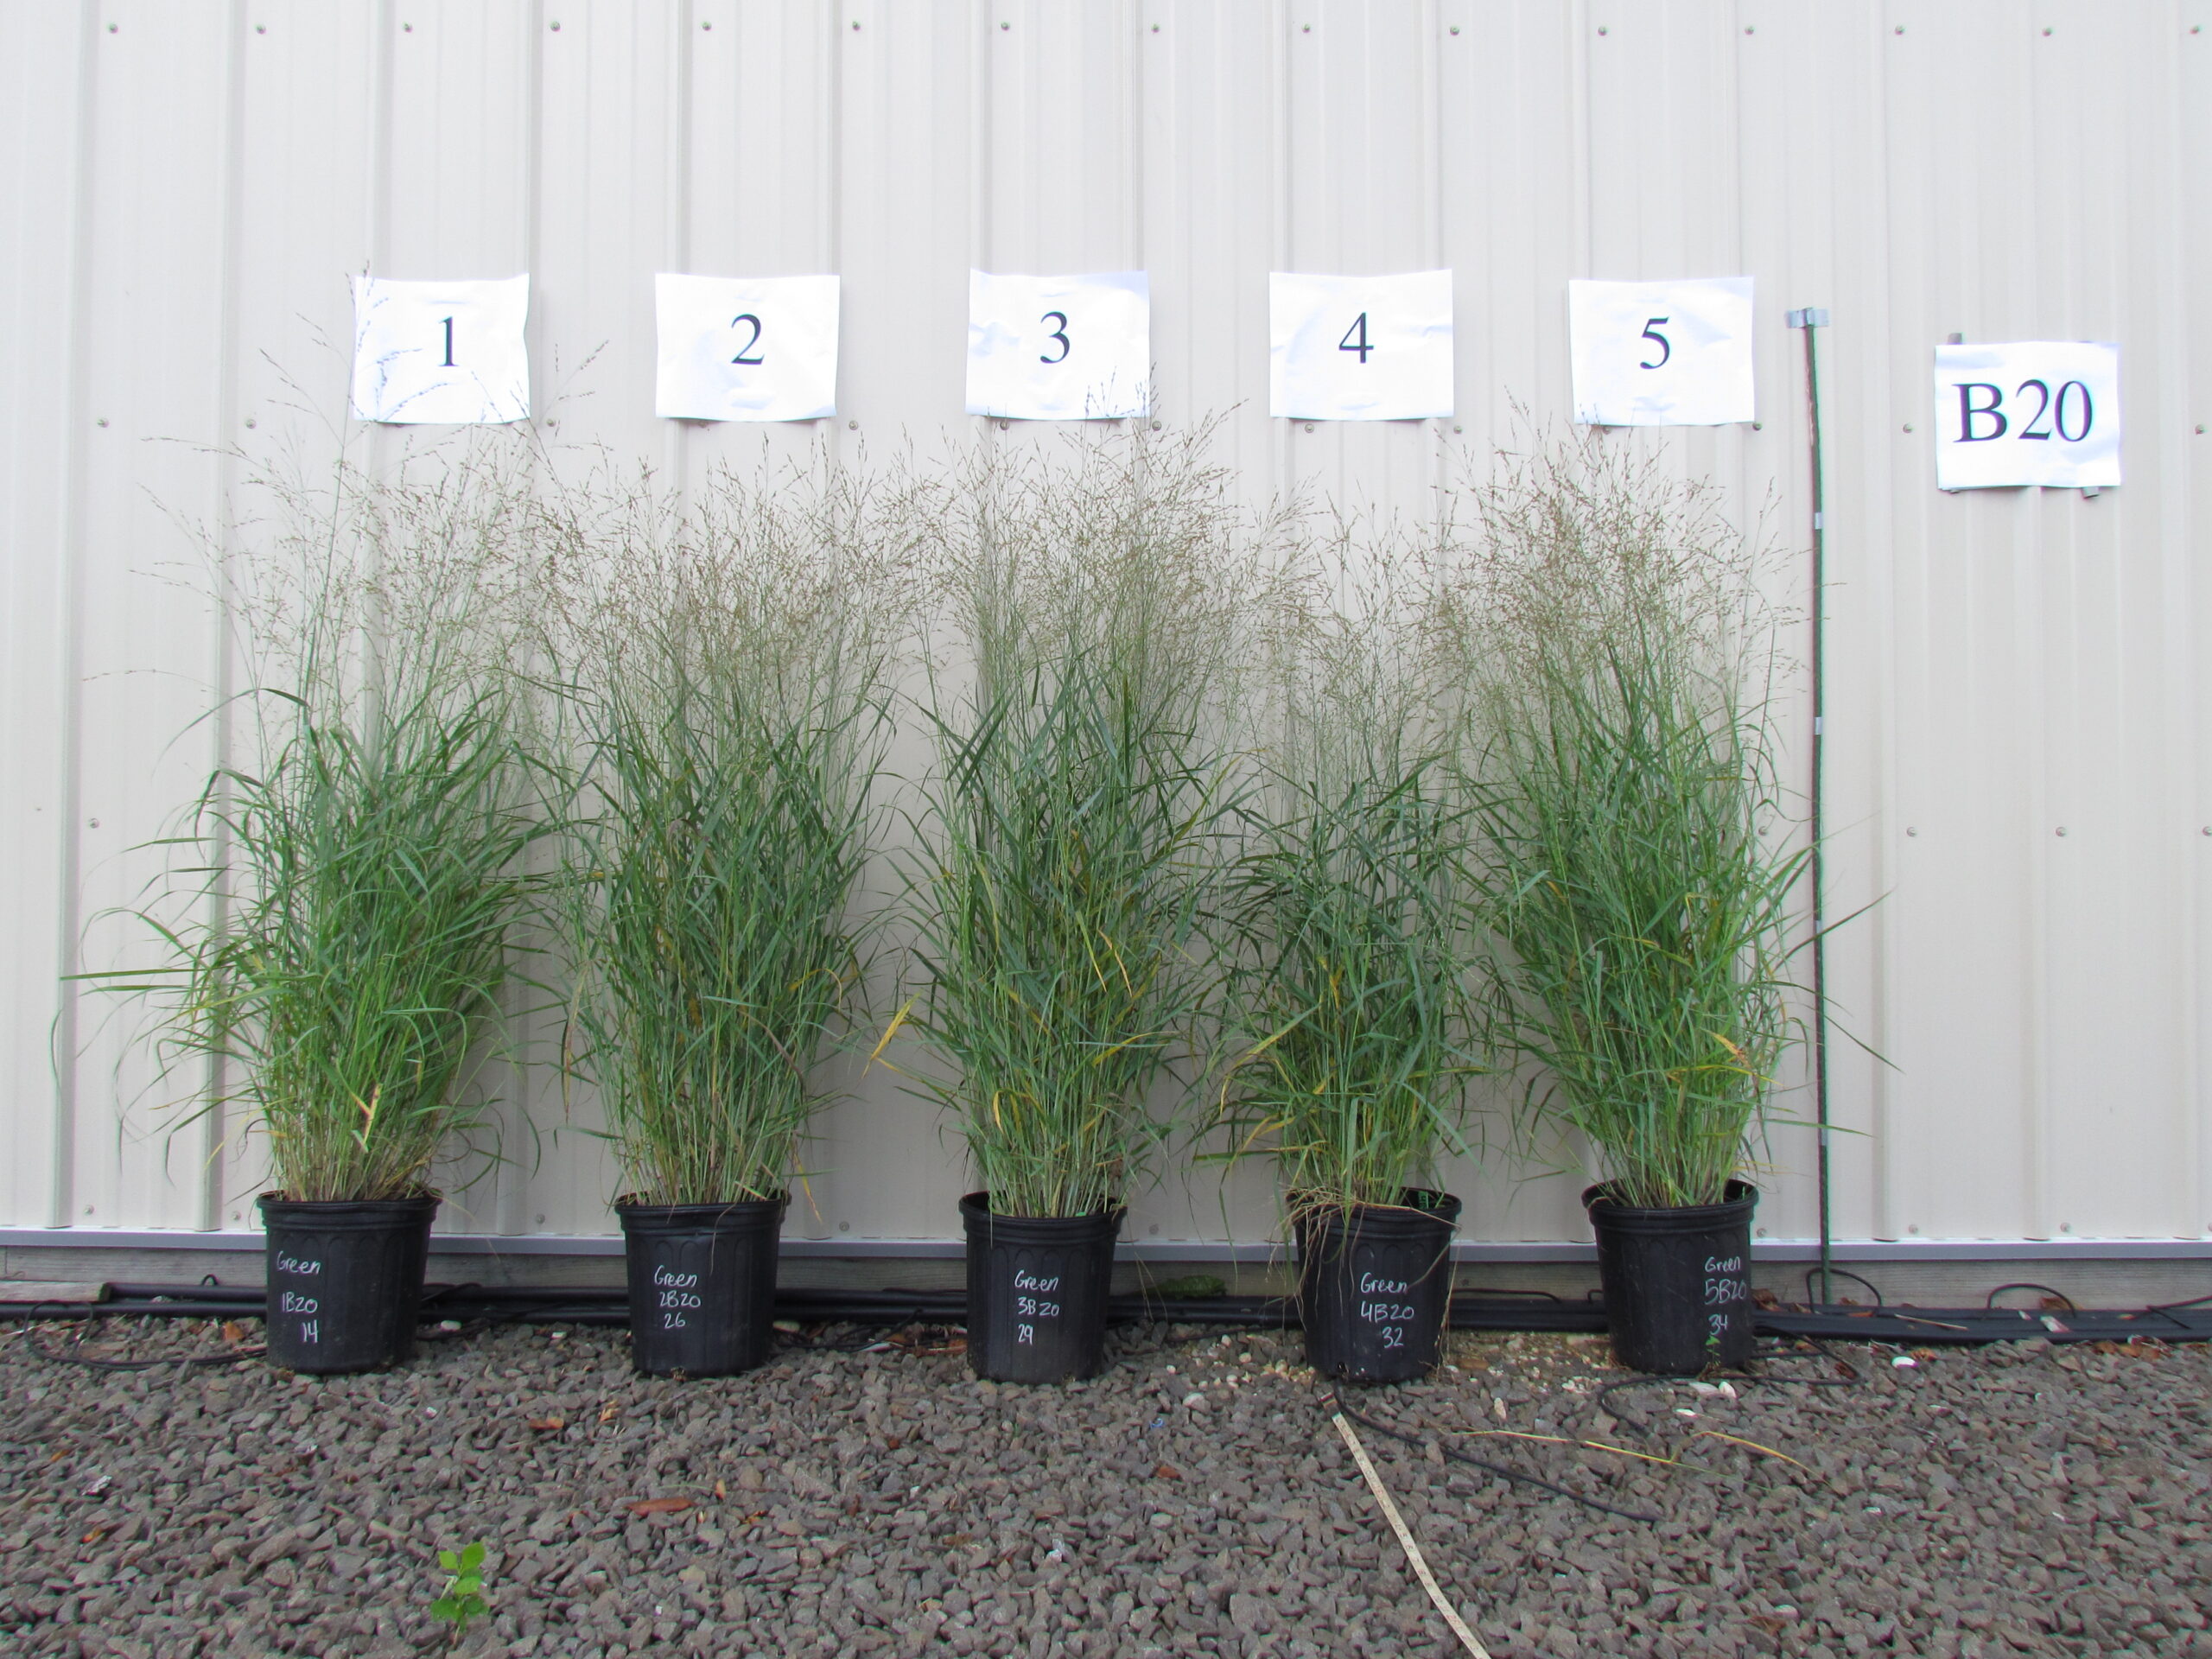
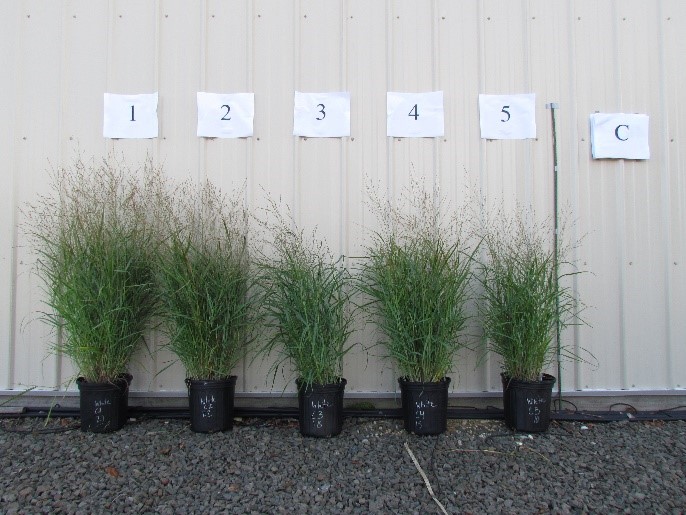
Image: Visual comparison of the LIHREC switchgrass shoot growth for the biochar 20% bottom treatment (left) and control plants (right). Photo taken September 2020.
On May 8th, new switchgrass plugs were potted up at both the LIHREC and on-farm nursery site. Again, PourThrus were collected every two weeks and monthly plant health evaluations were conducted until September. The LIHREC trial plants were destructively sampled in early September, and root and shoot dry weights were measured. Switchgrass plants at the on-farm nursery site were again left to overwinter in a covered hoophouse. At the on-farm nursery, Hobo waterproof temperature sensors were installed in 3 of 5 containers per treatment to continuously monitor container temperature of the substrate through winter and spring until the plants were destructively sampled in mid-June.
In September 2020, switchgrass shoot samples were collected from the Cutchogue nursery container plants. Five samples per treatment were collected, except for the control treatment where only four were collected because a plant died. Samples were weighed after being oven-dried for five days at 60 °C.
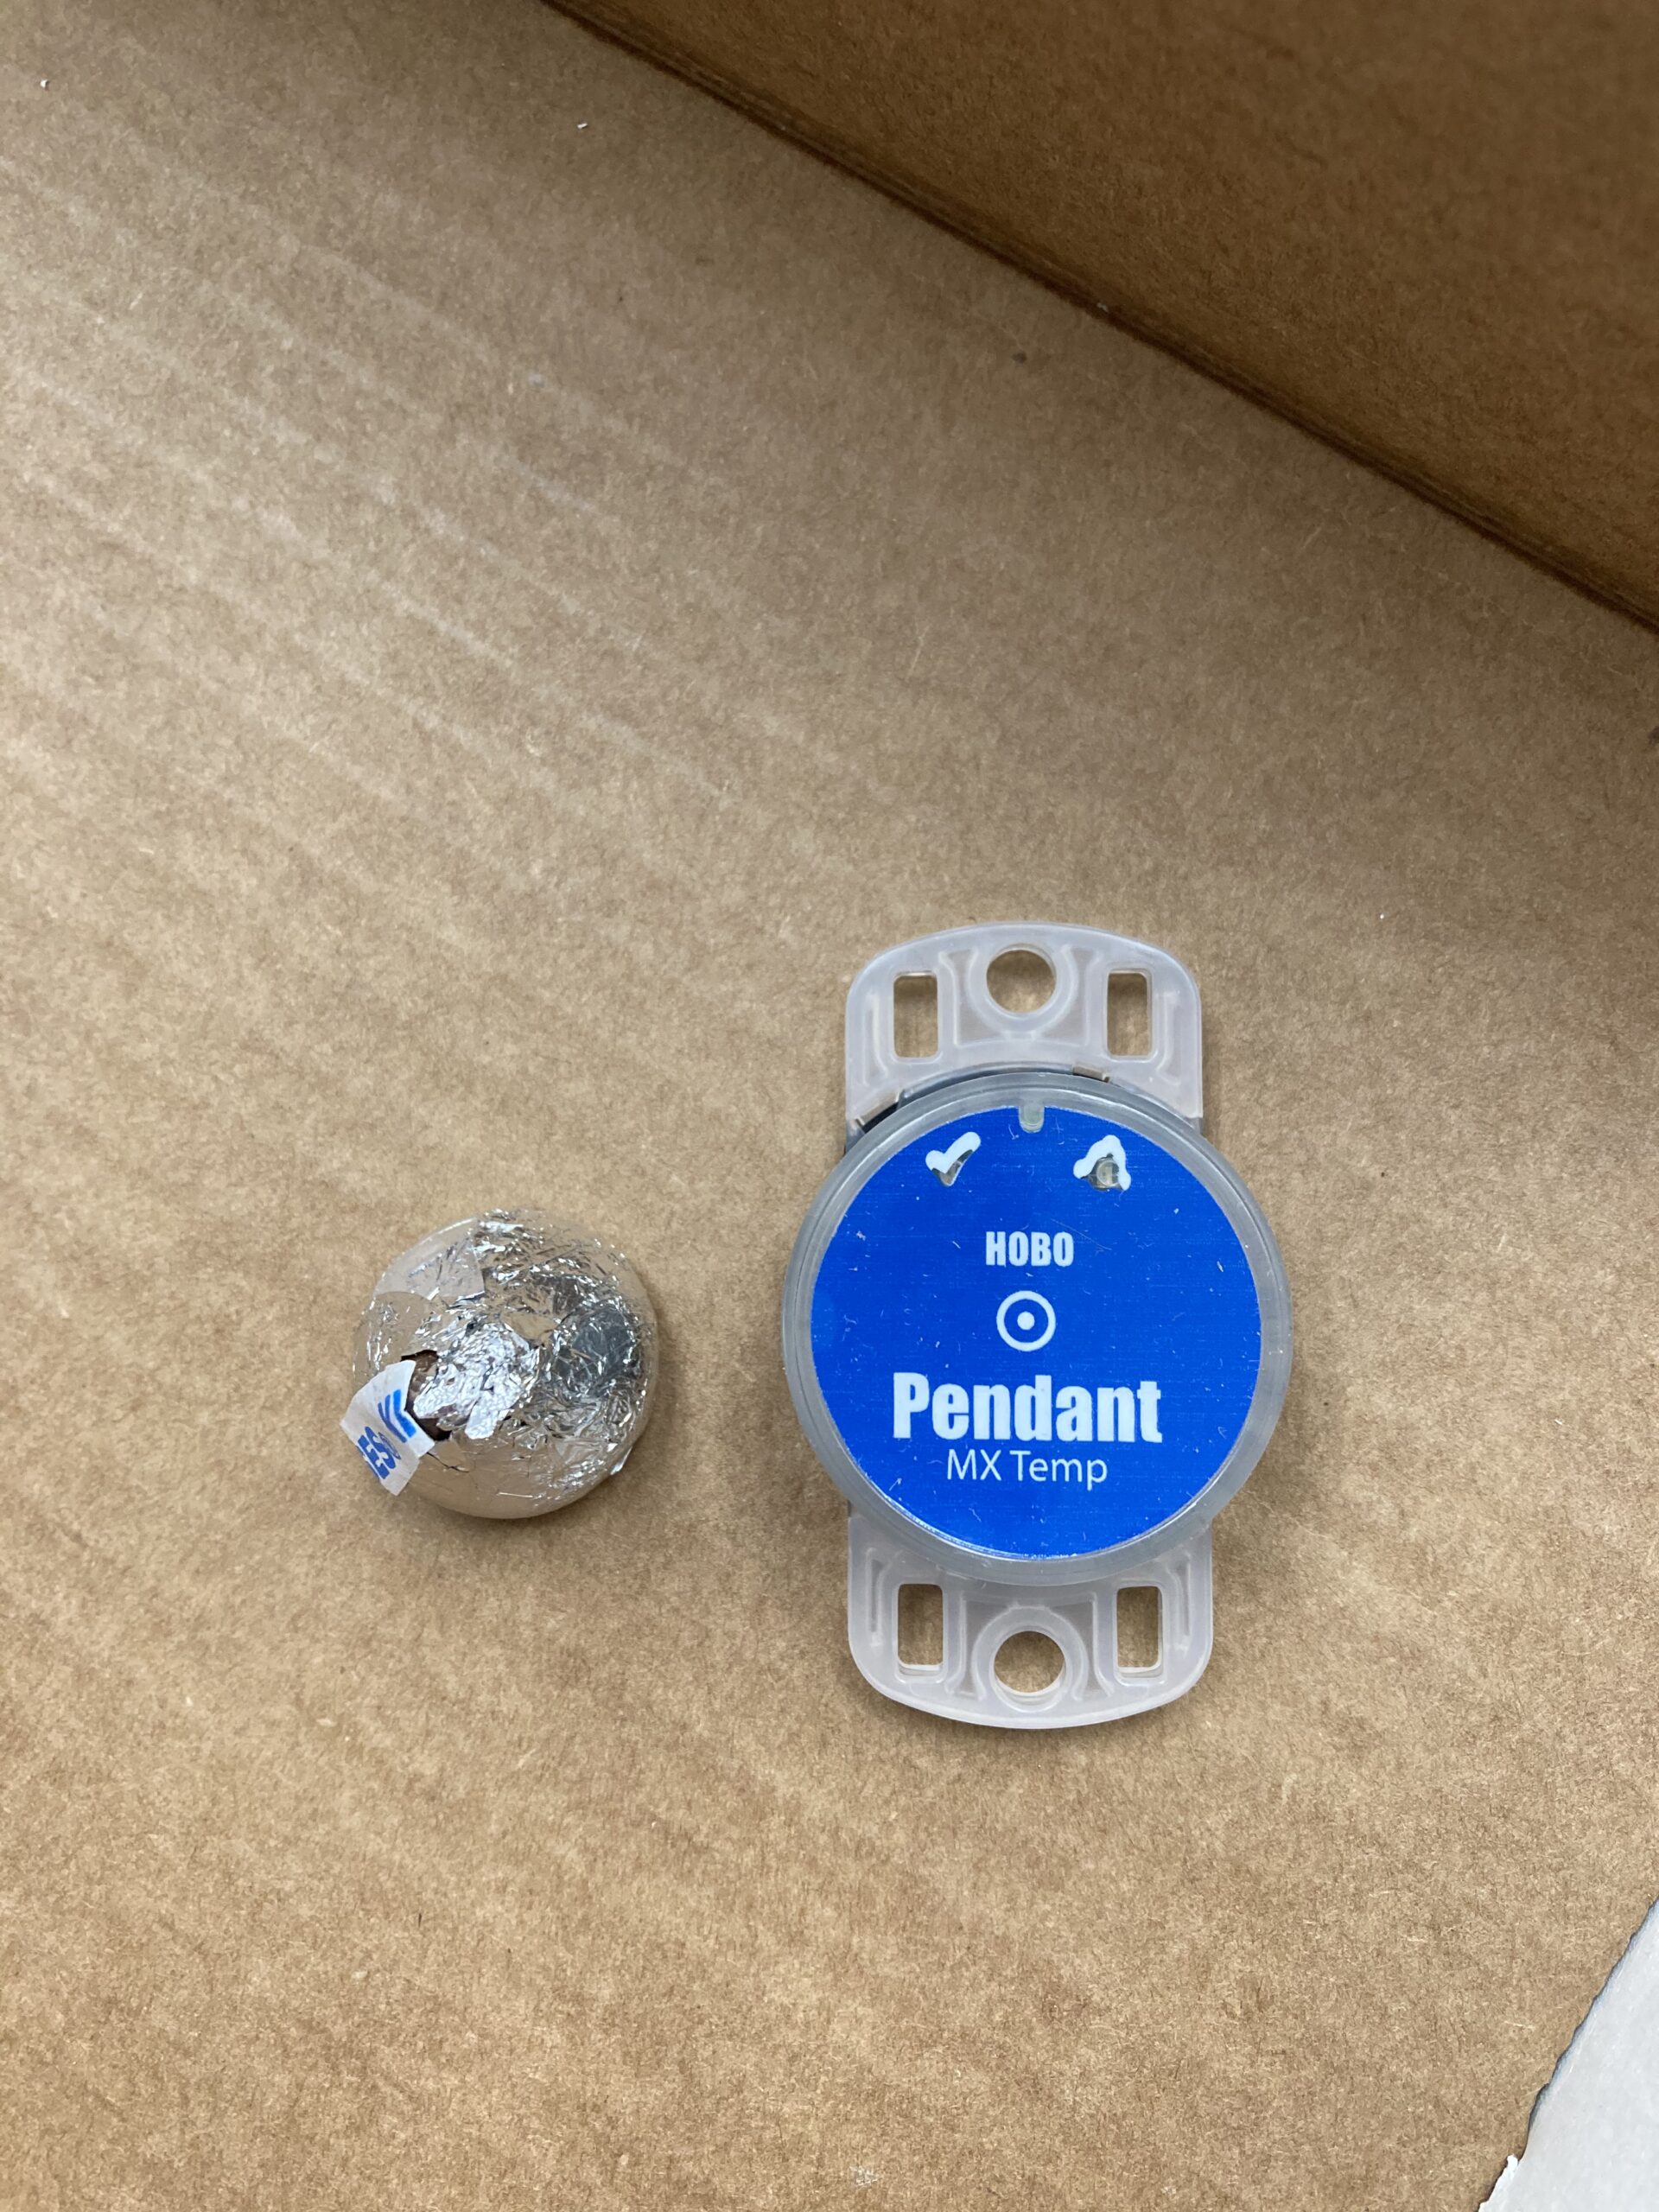
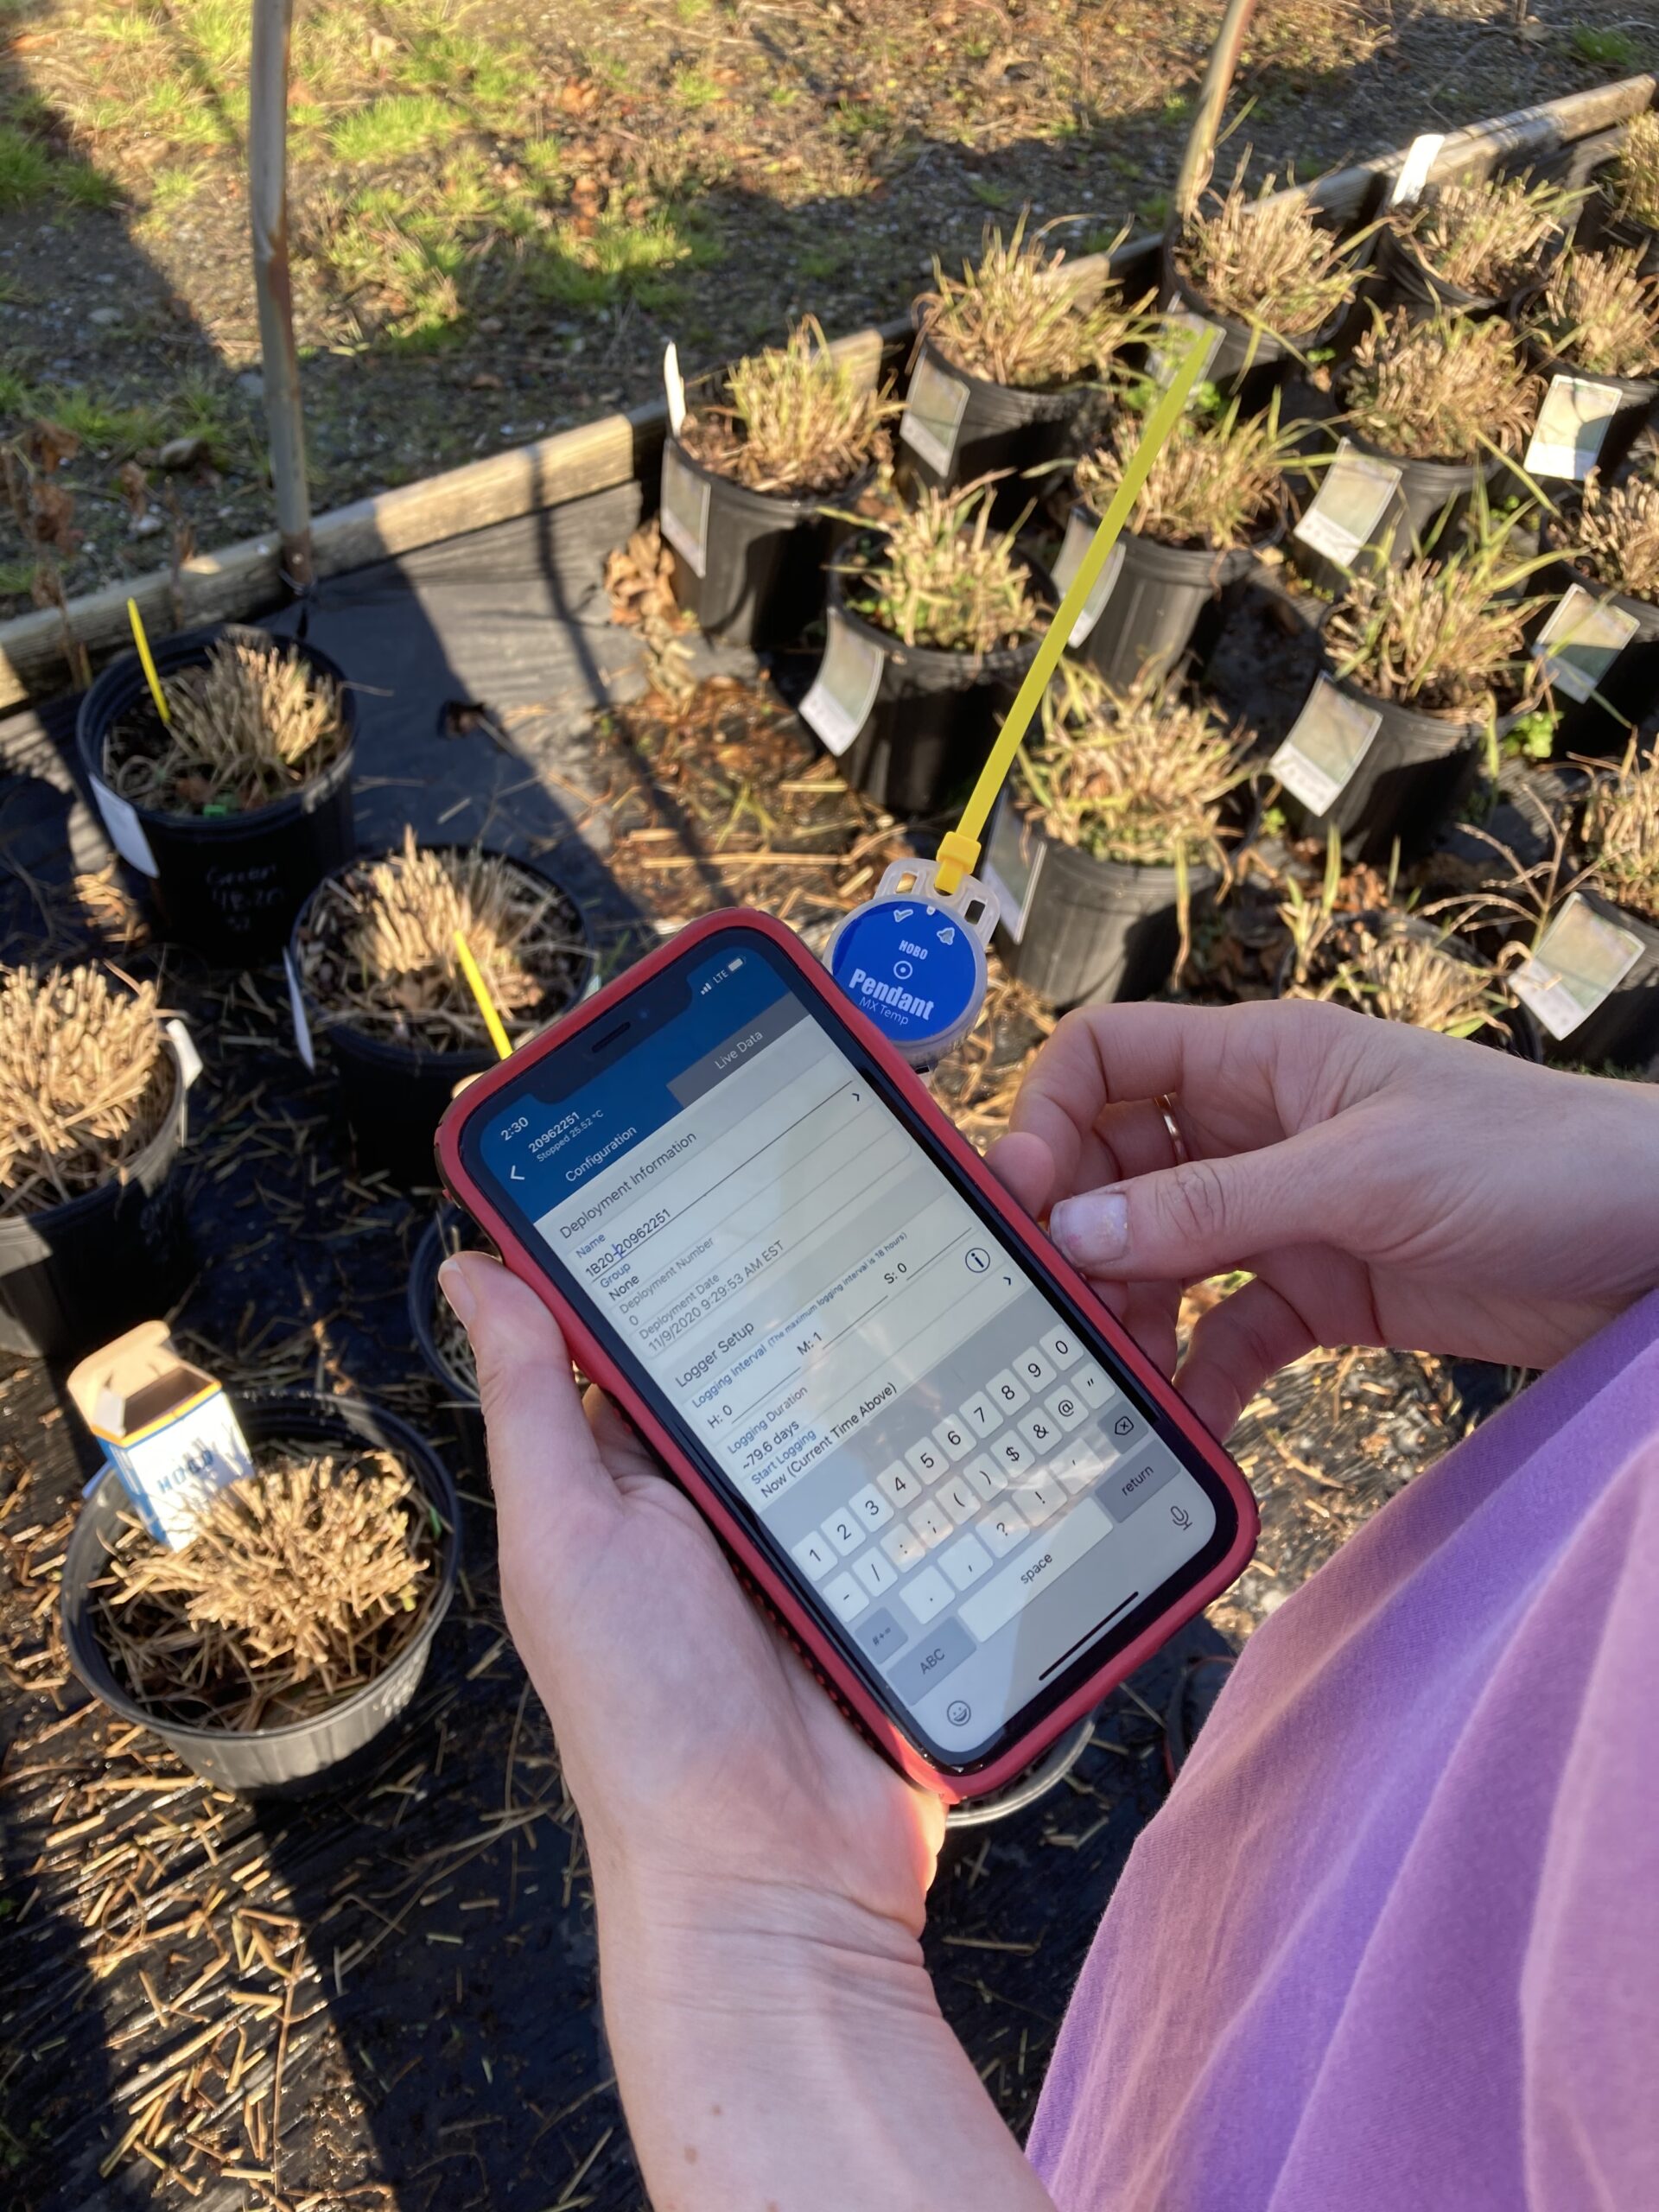
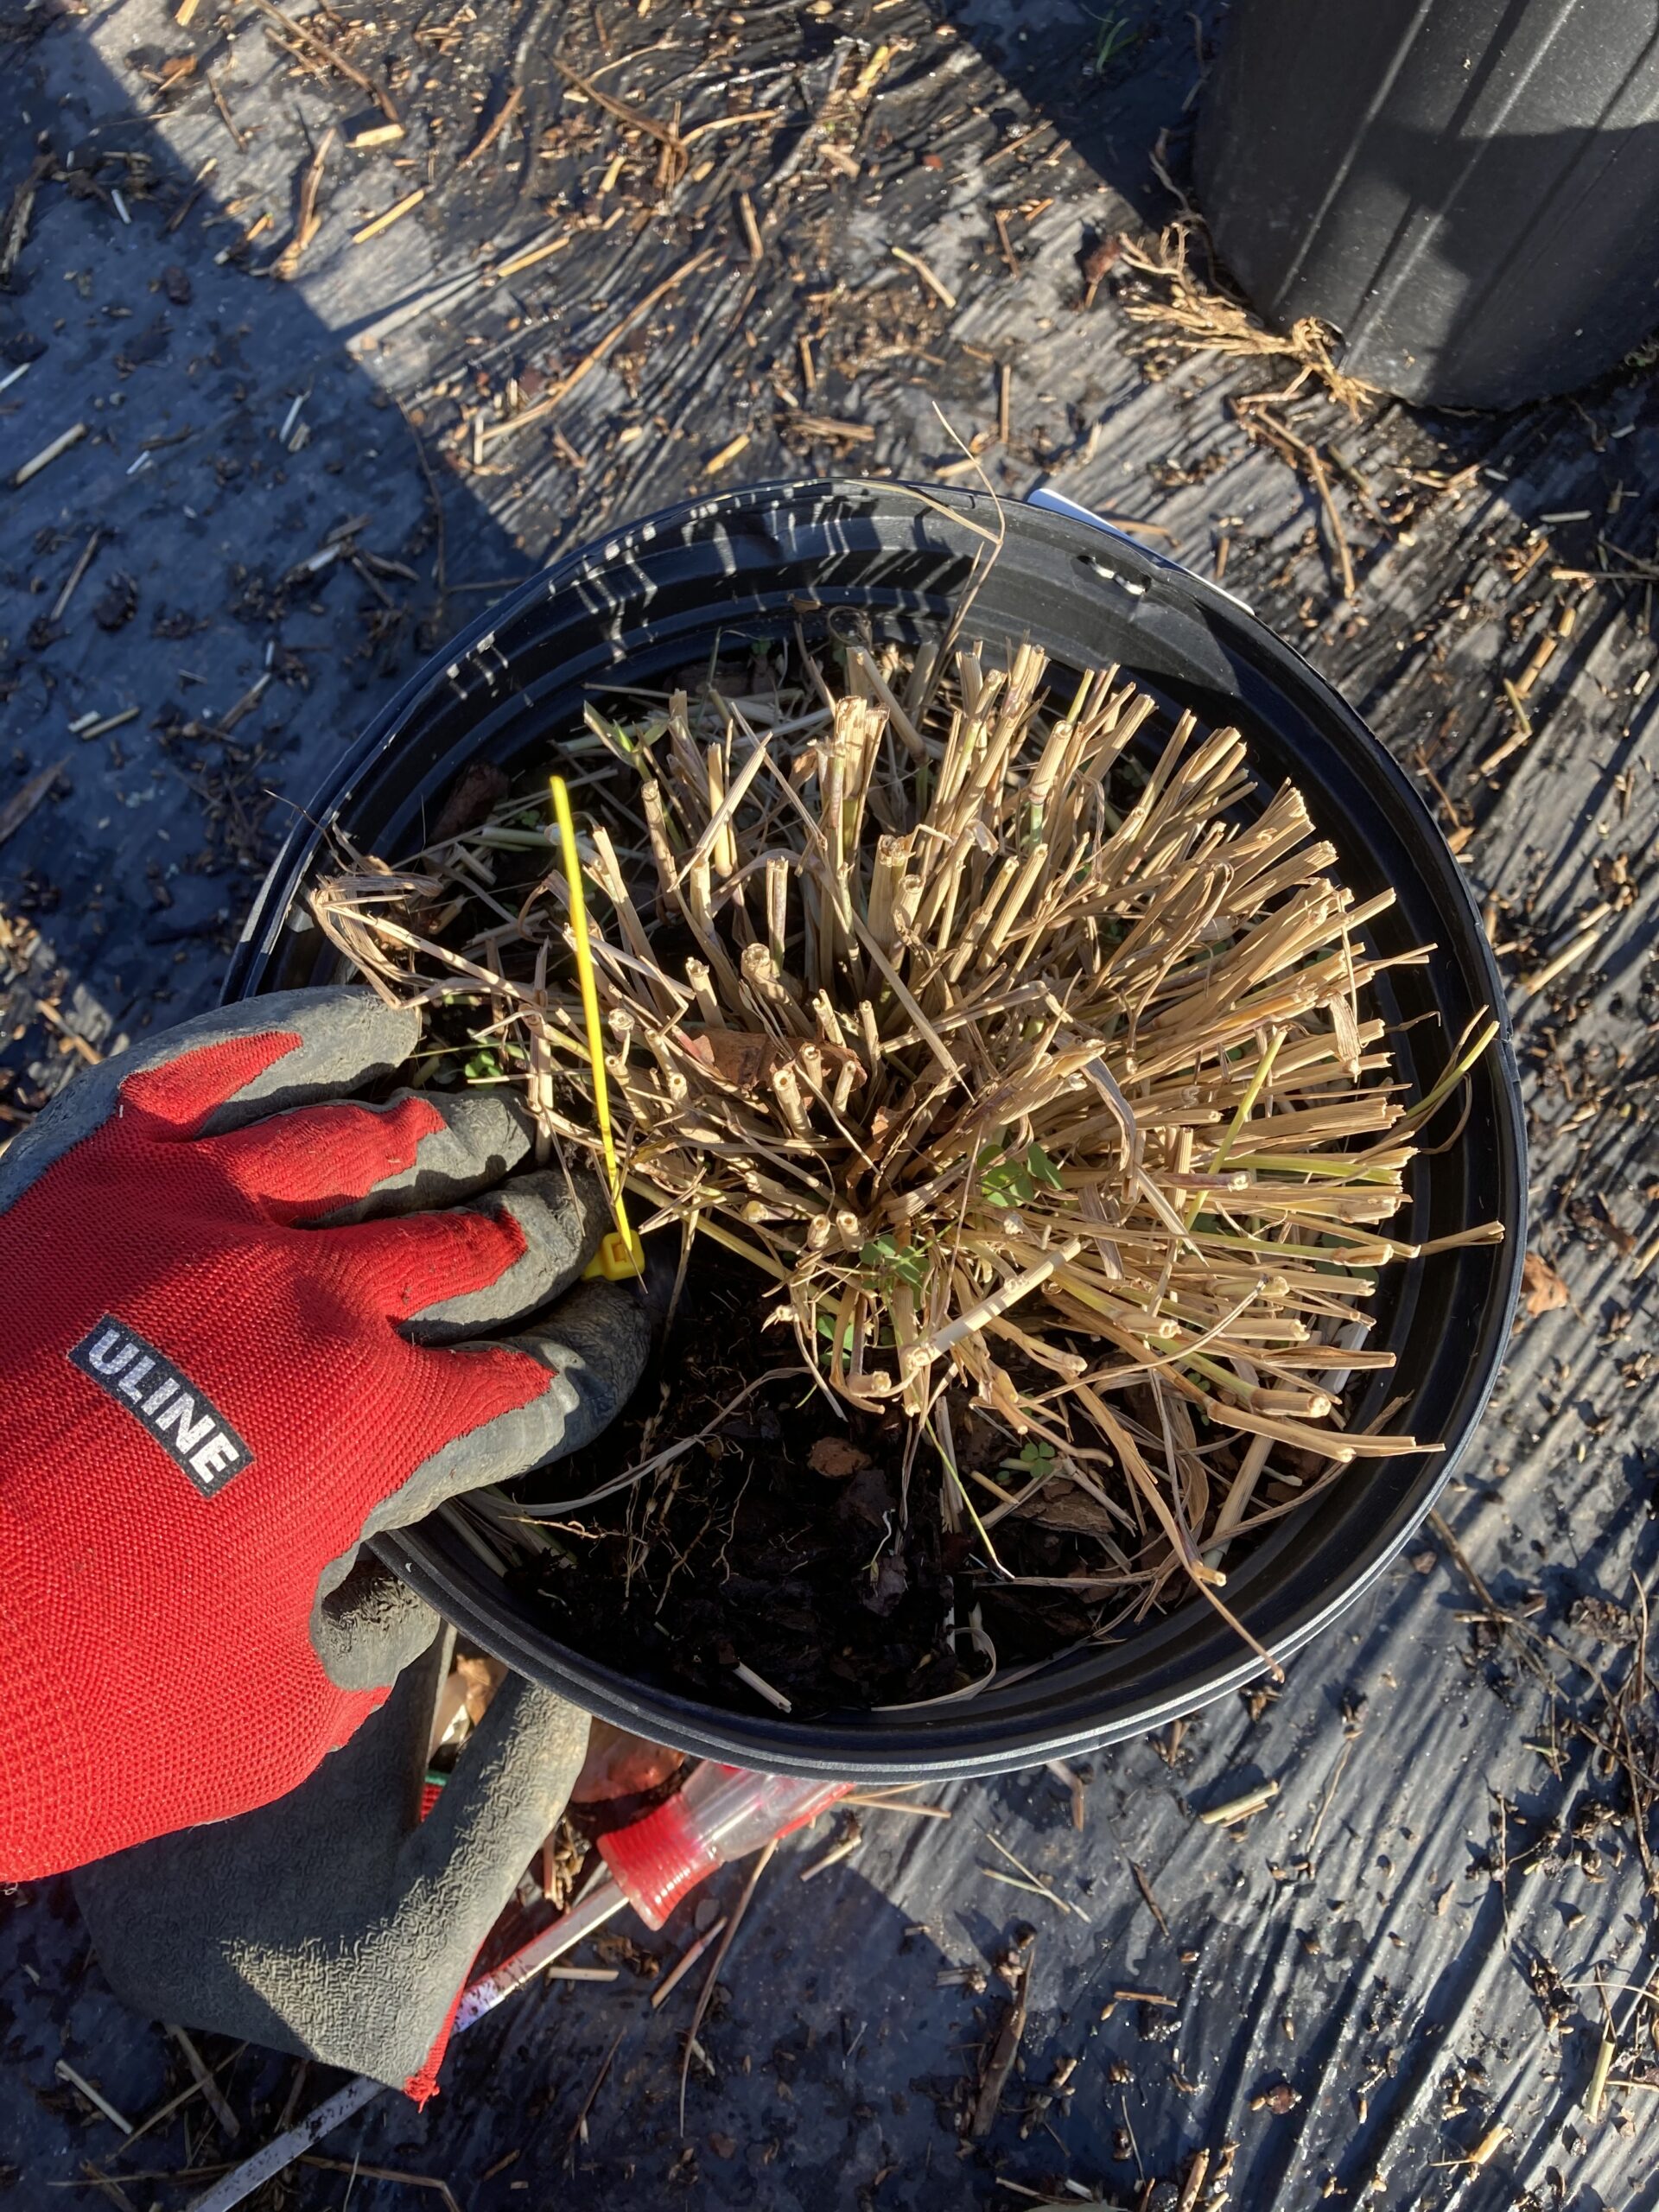
Images above: Relative size of temperature sensor (left), configuration of the sensor (middle left), installation of the sensor into a container (middle right), sensors installed as indicated by the yellow tag (right).
Year 3 – 2021 Container Trials
In March 2021, an initial PourThru was conducted on the overwintered switchgrass plants prior to fertilizing them for the season. PourThrus were conducted every two weeks thereafter to monitor EC, pH, and N levels. Periodic plant health evaluation data were collected until the plants were destructively sampled in mid-June. Dry root ball and shoot biomass weight were recorded. Shoot biomass was collected from eight samples (1 per replicate) per treatment in late August from all grass trials and oven dried at 60 °C for five days and then weighed. After weighing, shoots were collected for tissue nutrient analysis. Data from the Hobo waterproof temperature sensors were downloaded in mid-June after the destructive sampling was done.
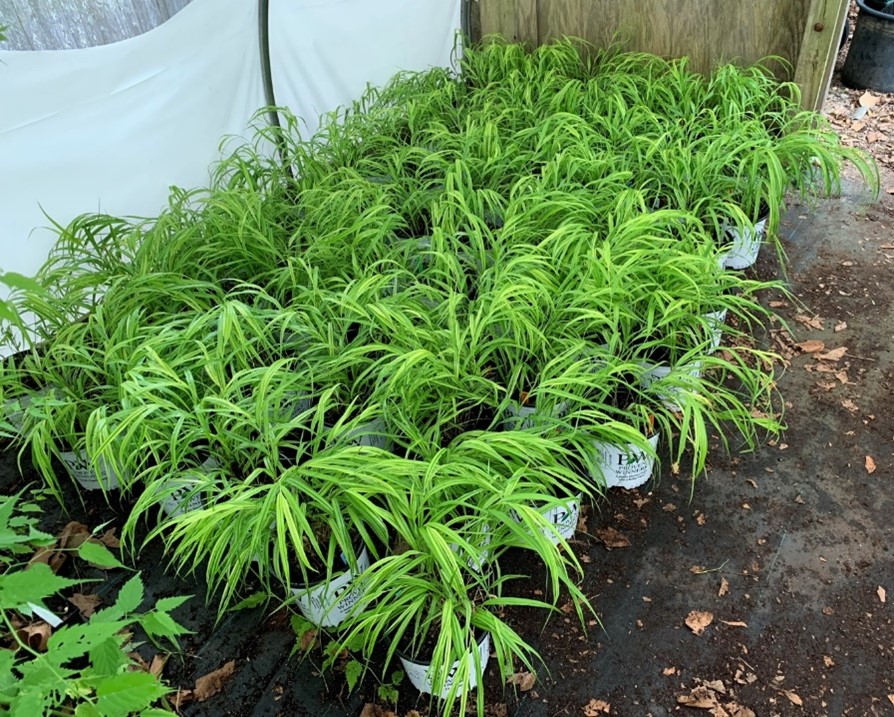
In May 2021, Japanese forest grass (Hakonechloa macra 'Aureola') and California privet (Ligustrum ovalifolium) liners were potted up at the LIHREC. The Japanese forest grass was grown in a hoophouse and overhead irrigated. New switchgrass plugs were potted up at both the LIHREC and the on-farm nursery site in Cutchogue. Due to few differences in 2019 and 2020 among treatments, the biochar rate treatments in the 2021 container trials were increased to 20%, 35%, and 50% by volume plus a no-biochar control; 1.5-gallon plastic nursery pots were used. Further, the bottom biochar treatment was discarded in year 3 as there were also no differences seen in nutrient leaching or plant productivity with this method of biochar use in the first two years of the trial. Biochar was mixed with the substrate before transplanting the liner. Lastly, we decided to use two different biochars: hardwood and oat hulls biochar. The hardwood biochar was charged prior to use by the biochar producer with a fertilizer, brewer yeast, and microbial blend, however, the oat hull biochar was not, and we unfortunately did not realize this until after treatments were applied.
Again, PourThru data were collected every two weeks in addition to conducting periodic plant health evaluations. All container plants were destructively sampled in September. Shoot and root dry weight data were collected on all plants.
Field Trials:
Year 1 – 2019 Field Trials
The field experiments were established using a completely randomized block design with subsamples. Ten consecutive plants per treatment was set as the experimental unit with 1 buffer plant at each end of the plot. Data were collected from the center 8 plants. Prior to biochar application, soil samples were collected from each farm. Biochar was applied at rates of 5, 10, and 15 tons/acre, plus control plots which had no biochar amendment. Treatments were applied at five replications with one replication per treatment occurring per field row. One replication per field row was used to account for inherent variability in the field. Test plants used were California privet (Ligustrum ovalifolium) at the Riverhead nursery location and Douglas fir (Pseudotsuga menziesii) at the Cutchogue Christmas tree farm location. The biochar was surface applied and manually incorporated using a metal rake into the top 4 inches of the soil profile within the immediate planting row (future herbicide strip). One week after applying the biochar, lysimeters (SoilMoisture Equipment Corp., California) were installed to a depth of 18 inches in two of the five replications in each treatment at both field sites. Lysimeters were charged before every rain event with at least 0.5-inch rain predicted. Once the rain stopped, all lysimeters were checked for soil water leachate. Initially, we would check after irrigation events, but no soil water leachate would be found thus we opted to check after rain events. Any soil water samples collected were kept refrigerated until shipped to Brookside Laboratories Inc., (New Bremen, OH) for ammonium and nitrate analysis.
Soil samples were collected from all field sites prior to biochar application and analyzed for soil health by the Cornell University Soil Health Laboratory using the Comprehensive Assessment of Soil Health (CASH) standard test package. The CASH analysis includes measurements of soil pH, organic matter, extractable P, K, total C, active C, total N, micronutrients, texture, respiration, protein, available water capacity, and wet aggregate stability (Moebius-Clune et al., 2016). This analysis provides growers with a thorough assessment of the quality of their soil and both short- and long-term management suggestions. Time domain reflectometer (TDR) probes (Acclima TDR-310W) and water potential sensors (METER Group TEROS 21) were installed at both field trials to continuously record soil moisture, electrical conductivity (EC), soil temperature. Two depths, 4 and 10- inches, were used for the TDR probes, while only the 4-inch depth was used for the water potential sensors. Like the lysimeter installation, two replicates per treatment had TDR and water potential sensors installed. Periodic plant health evaluations were done every 30 days during the summer months. One plant per replicate were collected from both field production locations in October for shoot and root biomass. Soil was removed from the root samples, and all samples were oven dried for seven days at 100 °C.
The two cooperating growers followed their standard practices for weed and fertility management throughout year 1 of the trial. The privet grower periodically cultivated his fields for weed control; the Douglas fir grower did not cultivate and seeded a permanent grass strip between planted rows to protect the soil from compaction and minimize erosion. Overhead gun irrigation was used by the privet grower and drip irrigation was used by the Douglas fir grower.
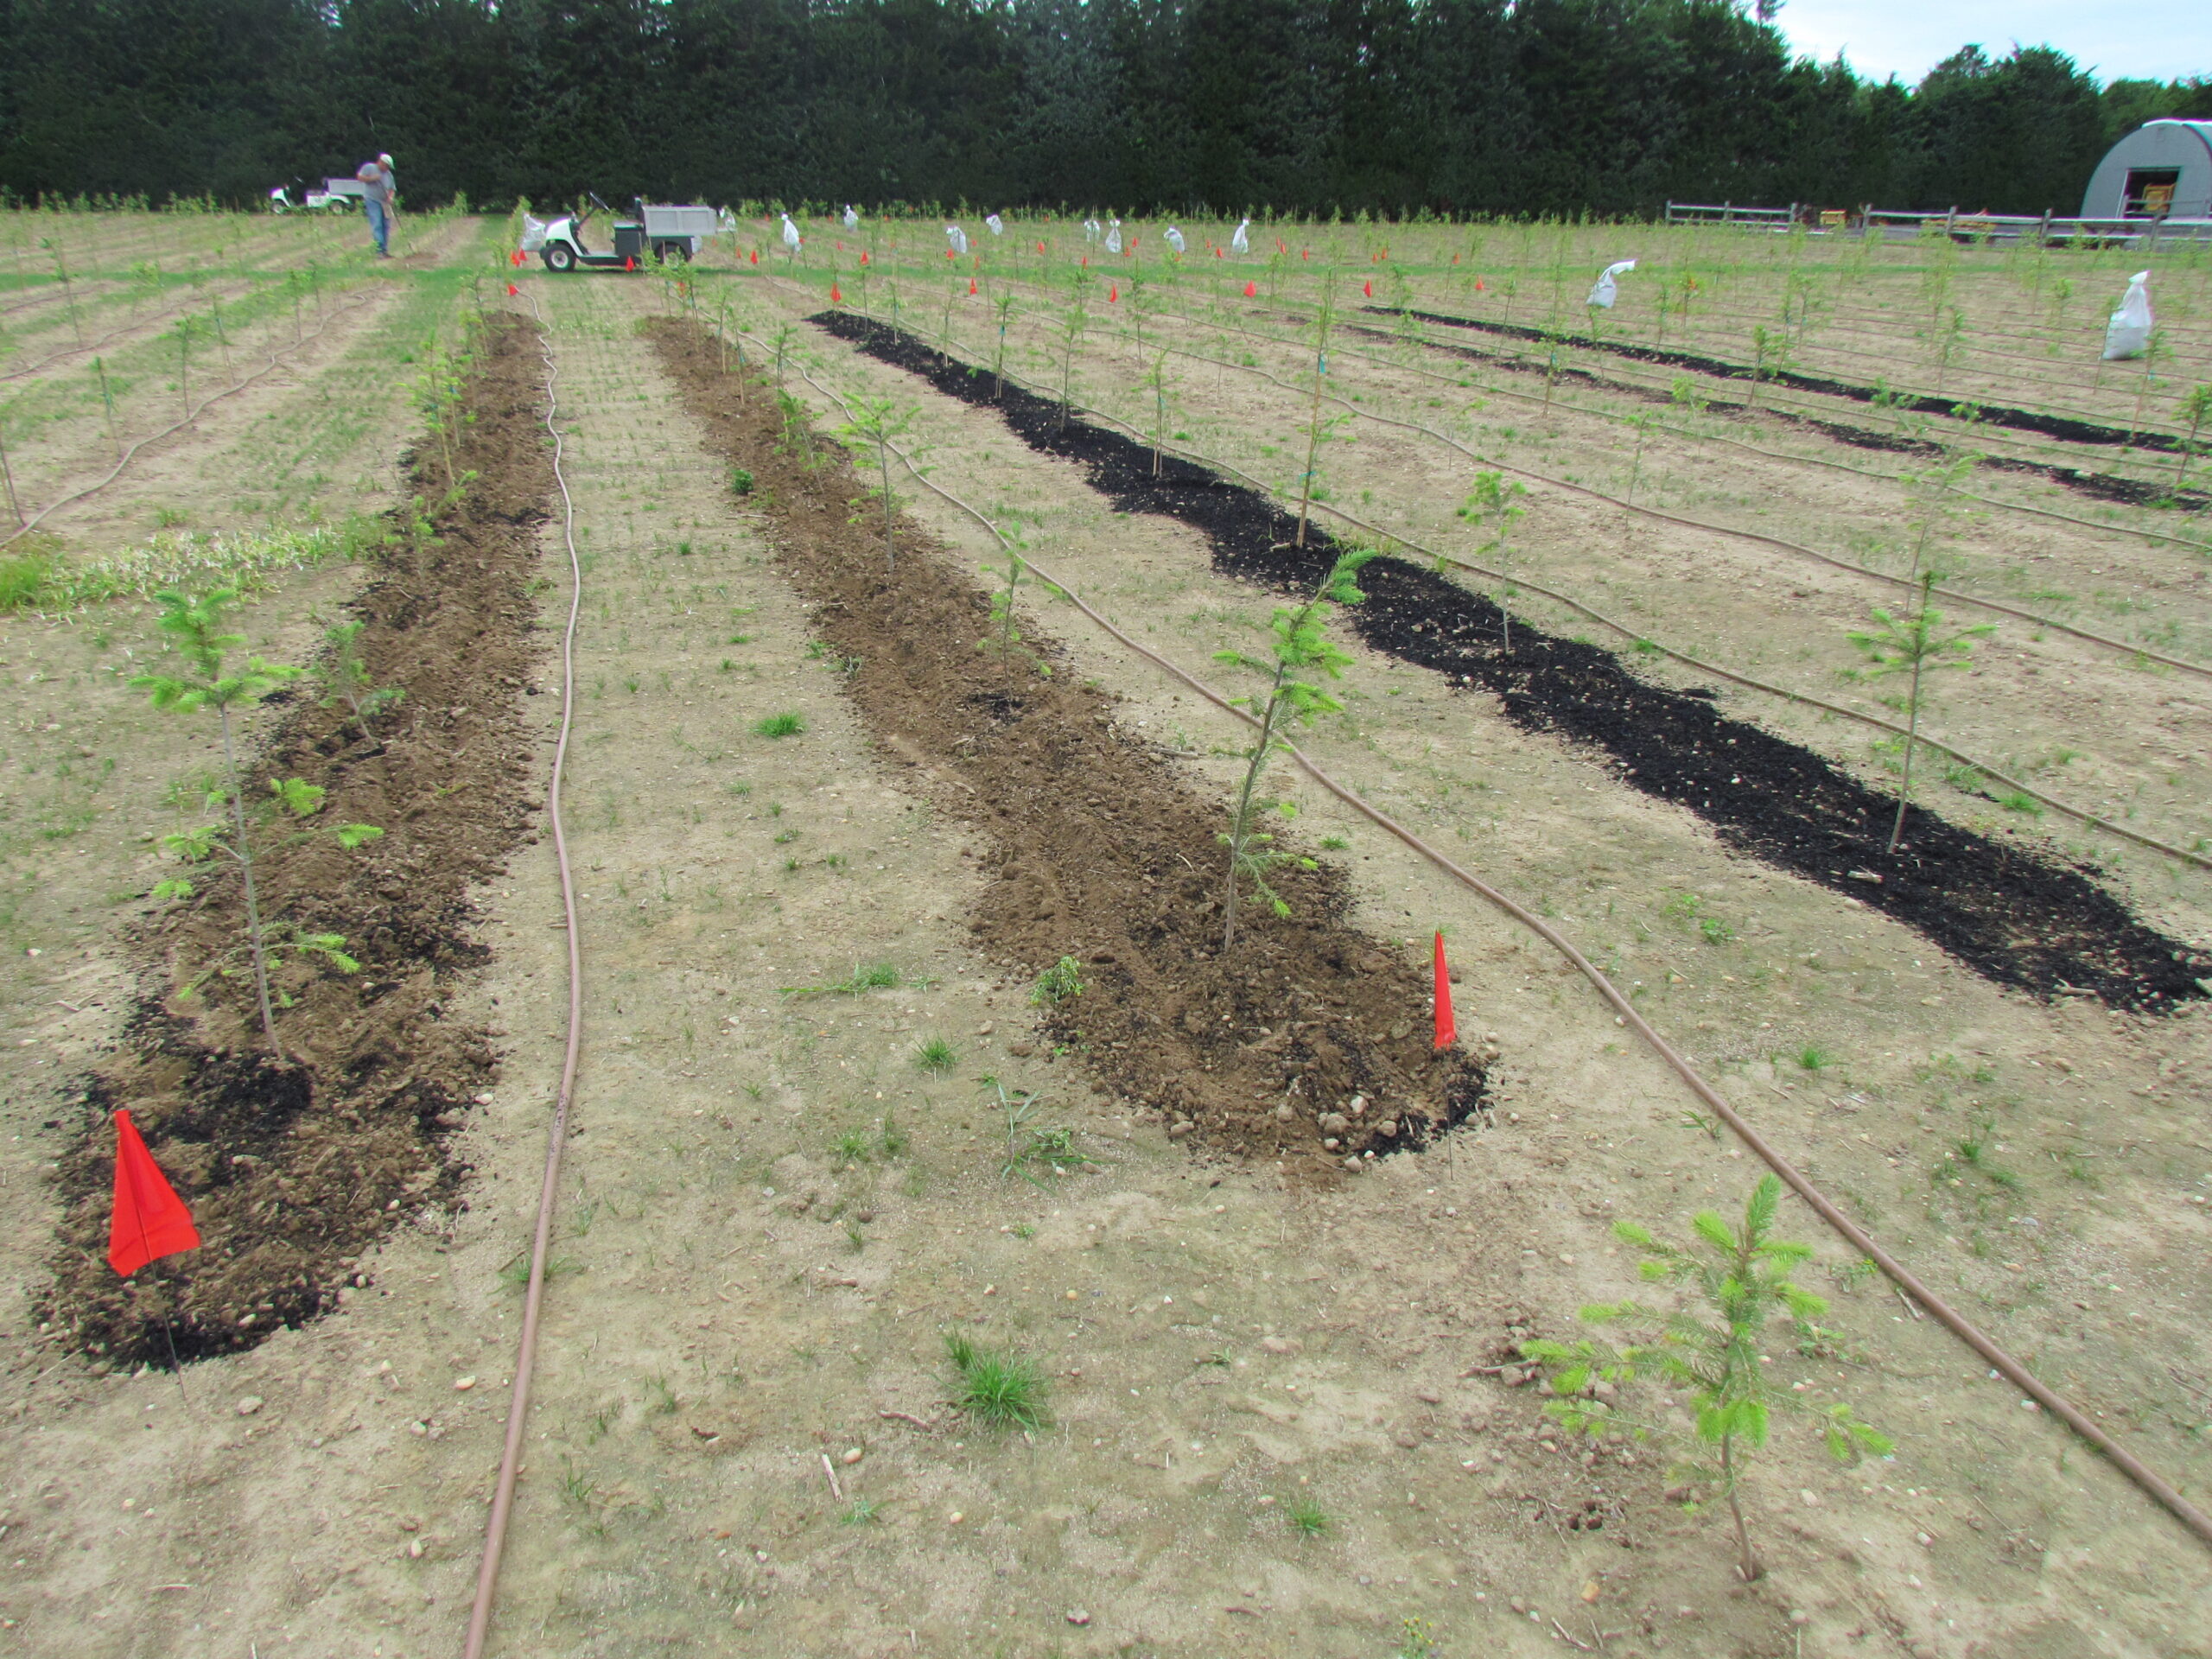
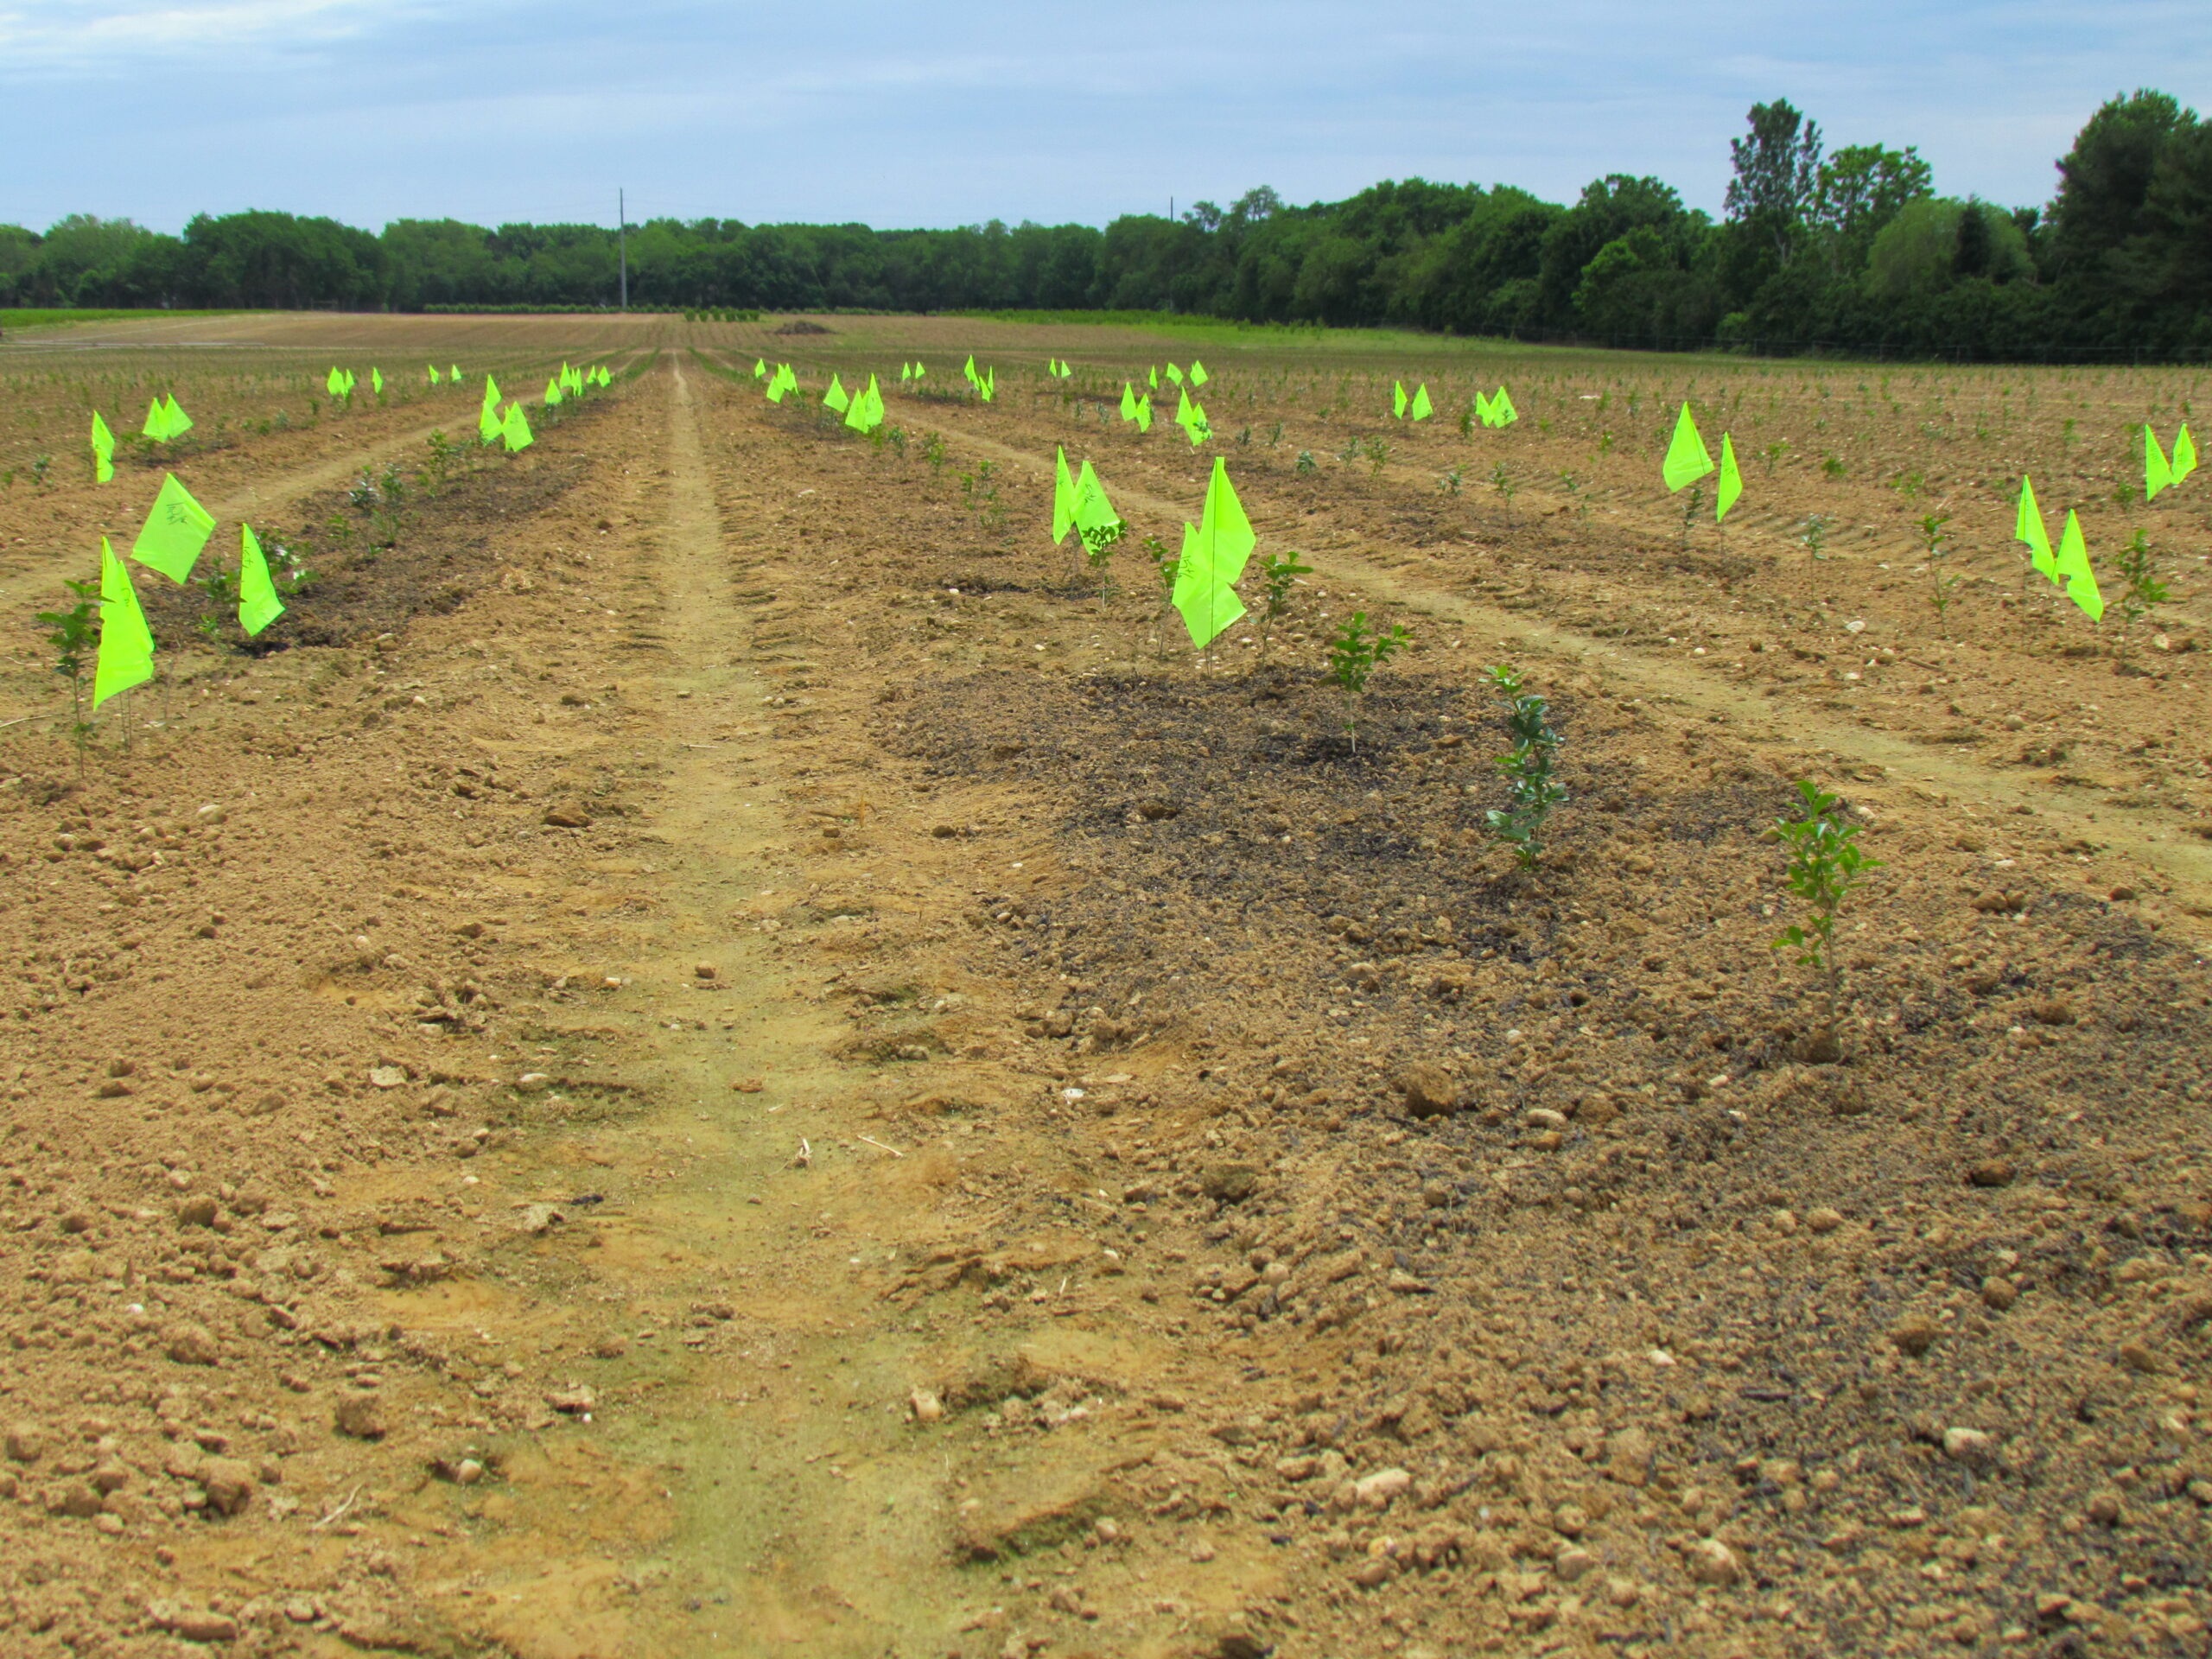
Image: Incorporated biochar treatments to a California privet field in 2019.
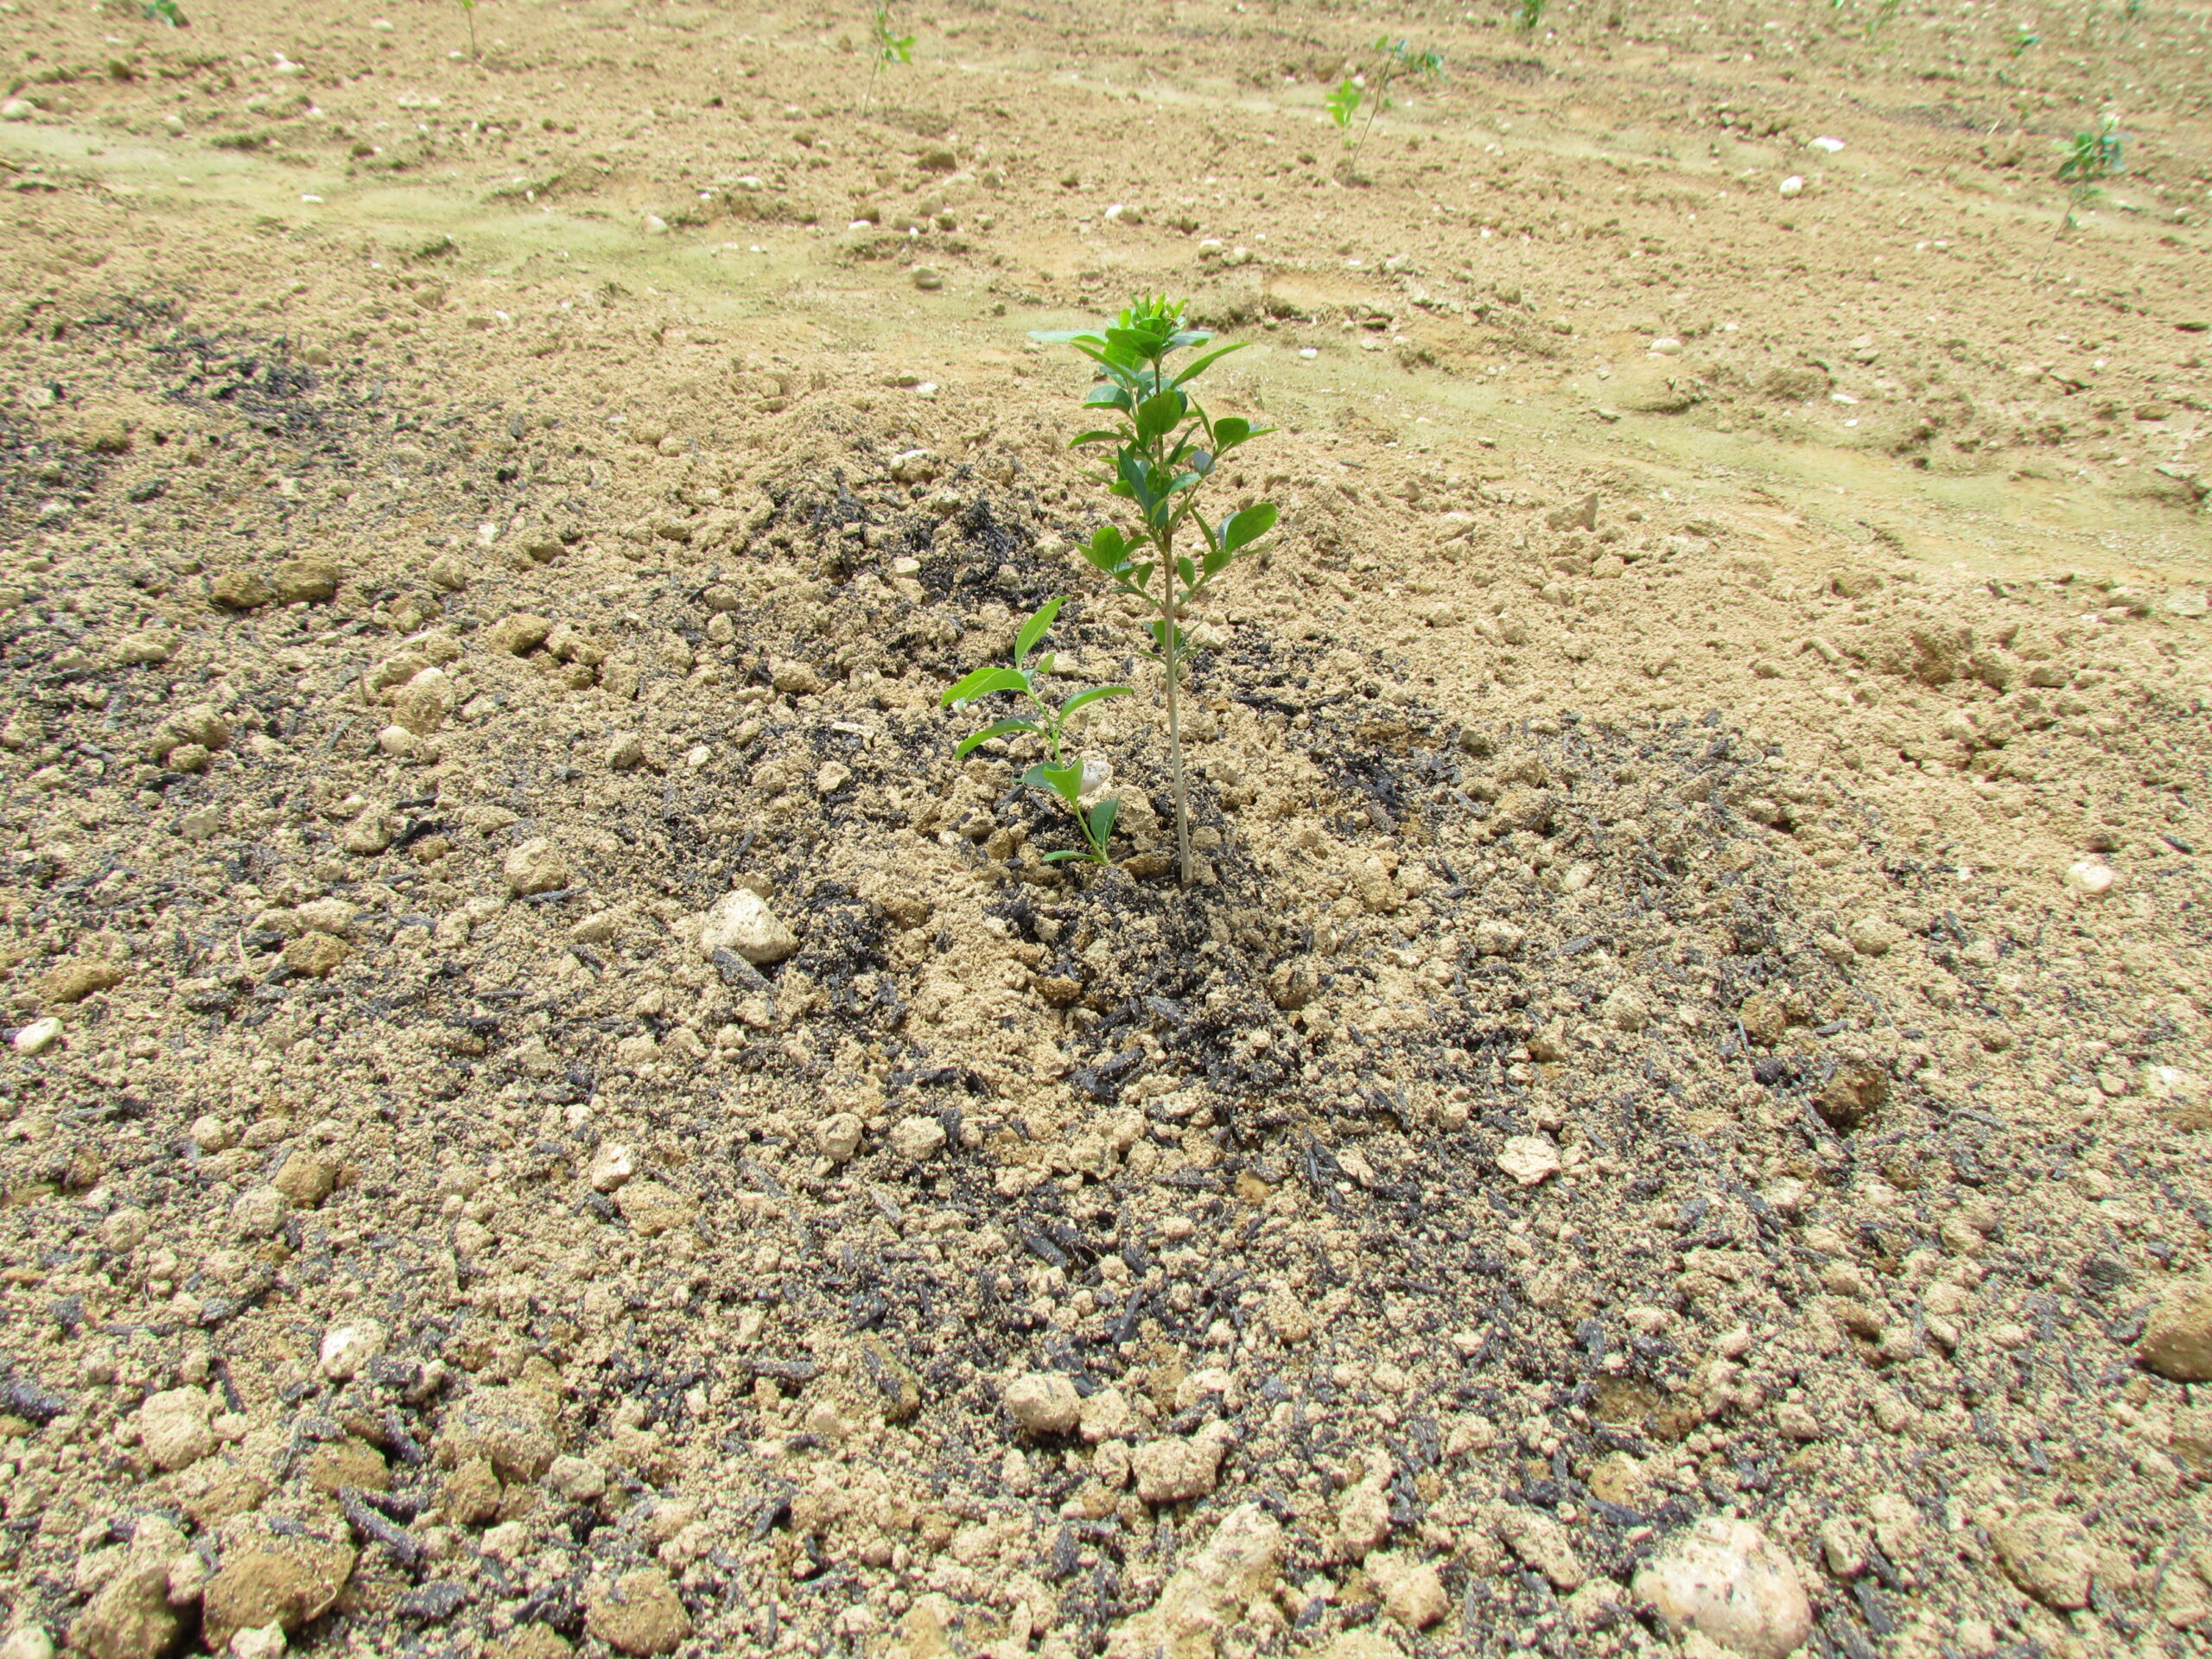
Image: California privet plant after biochar addition in 2019.
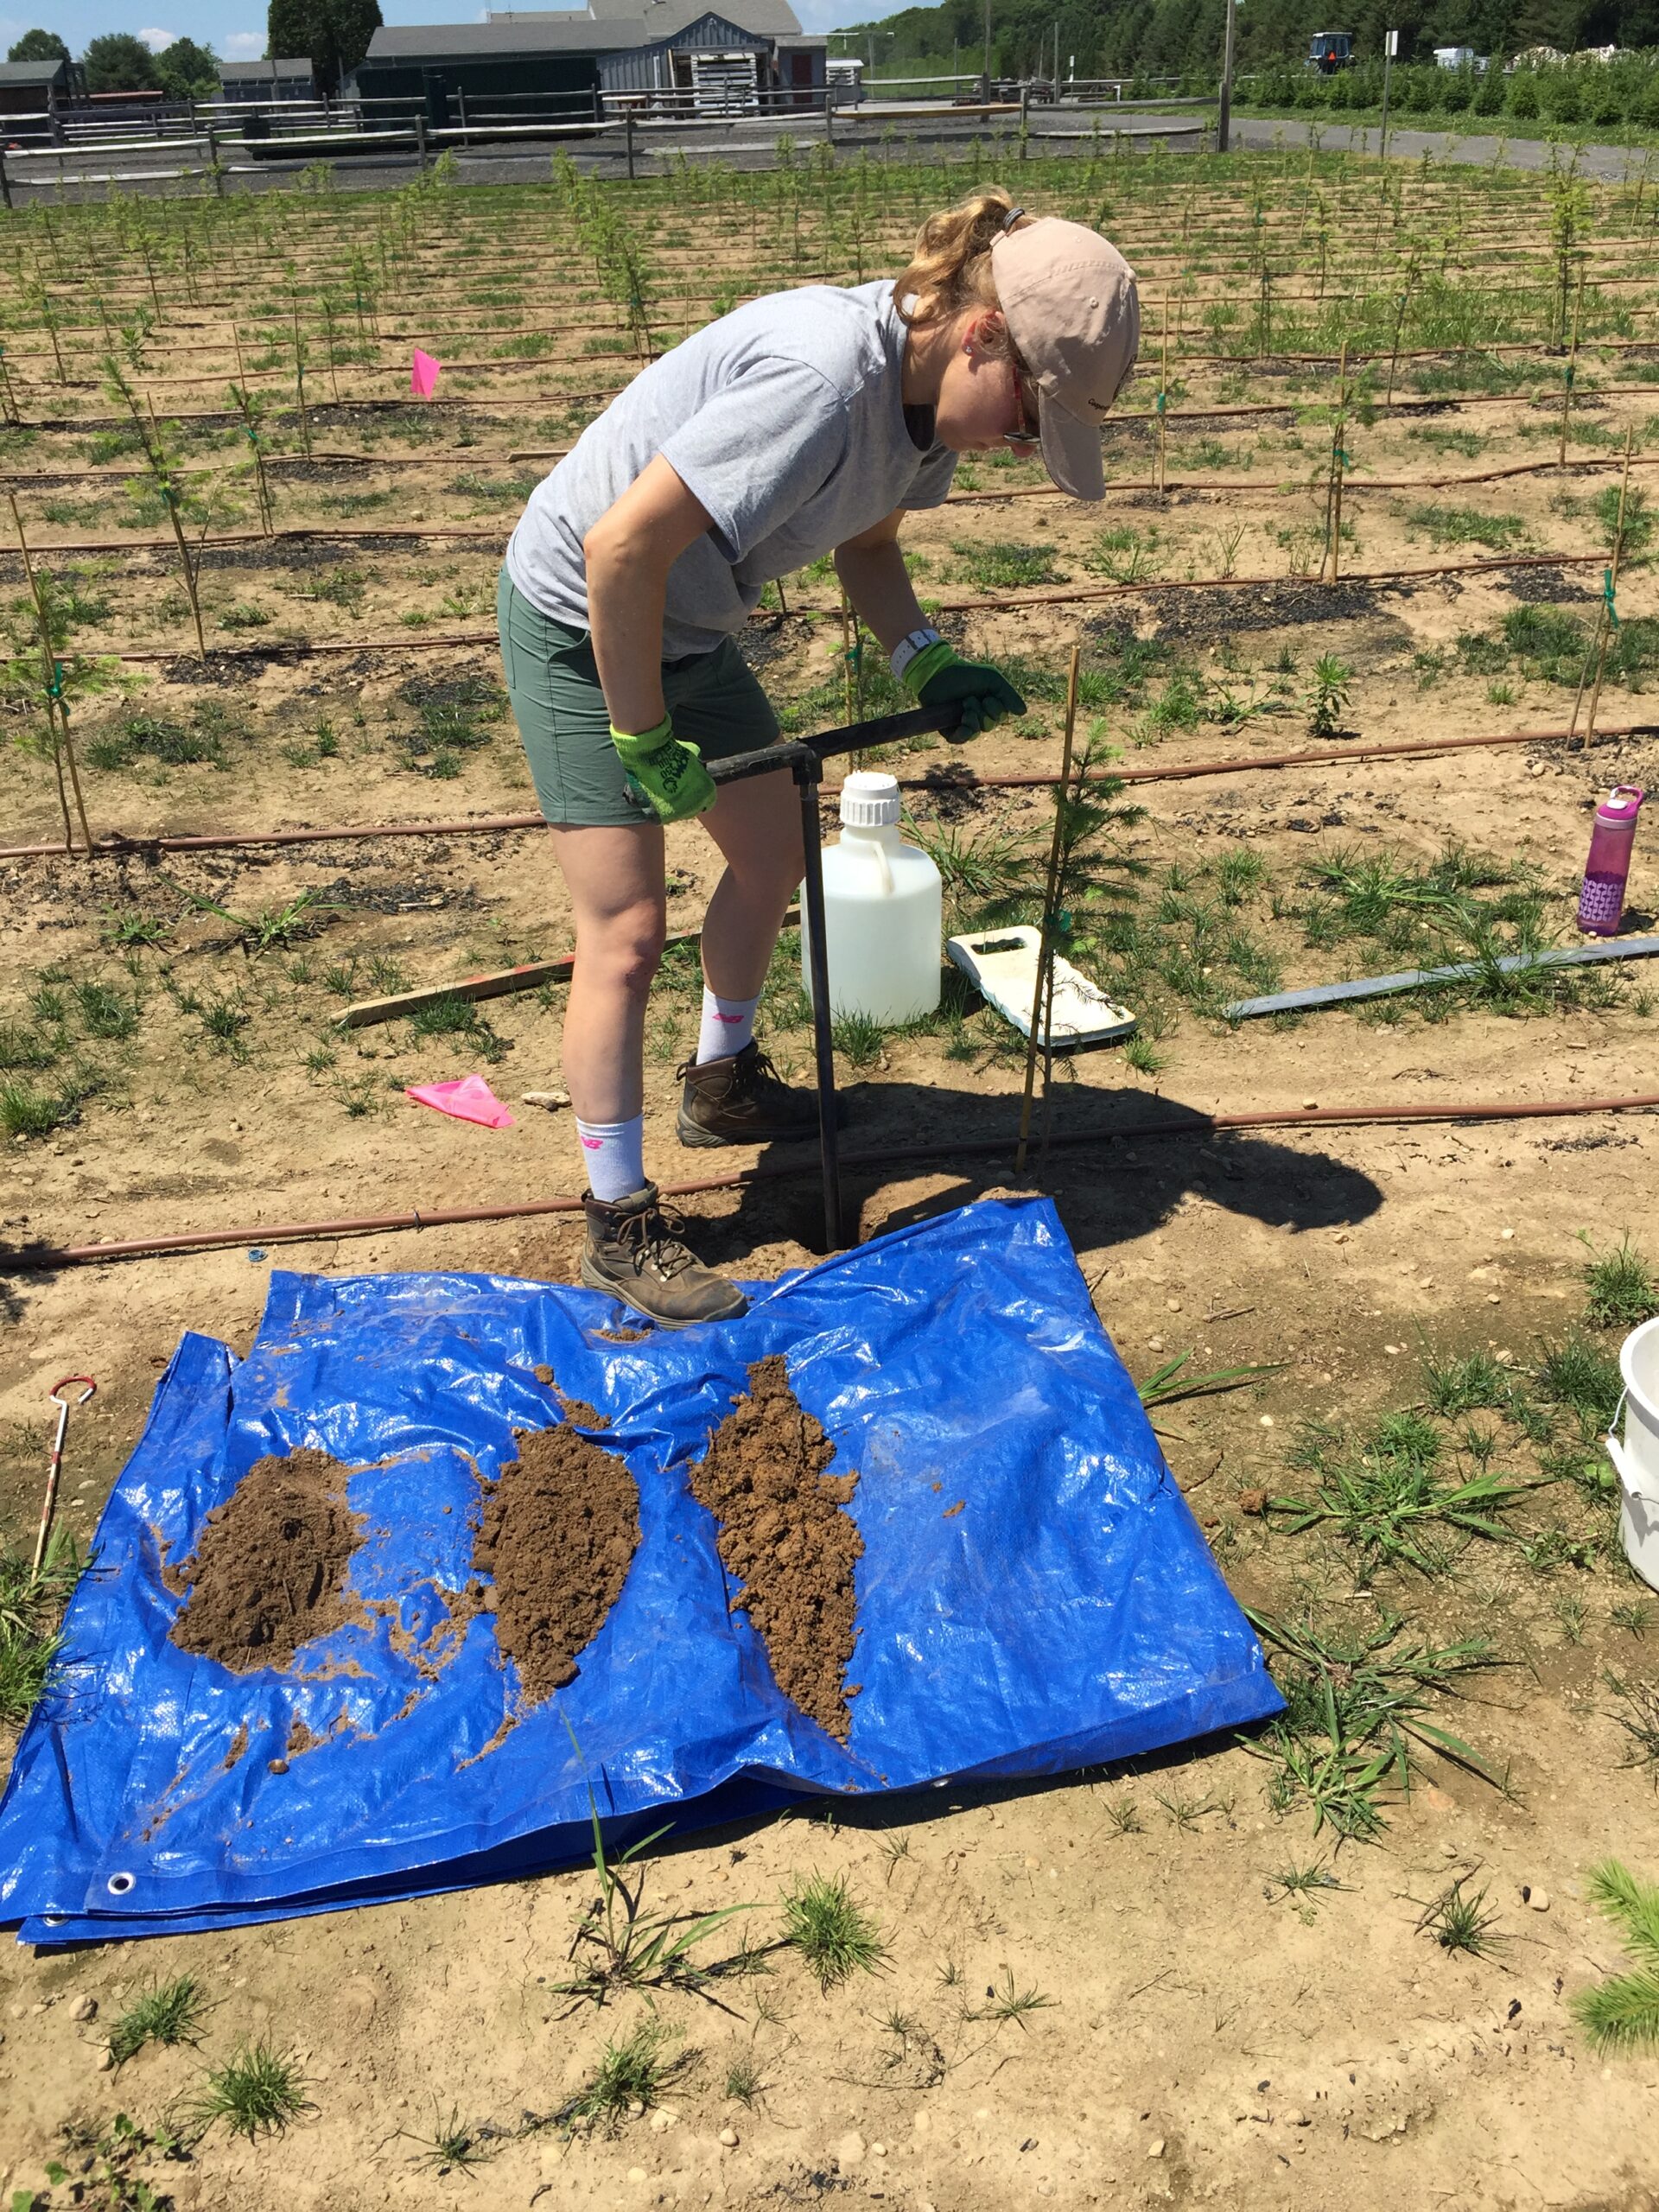
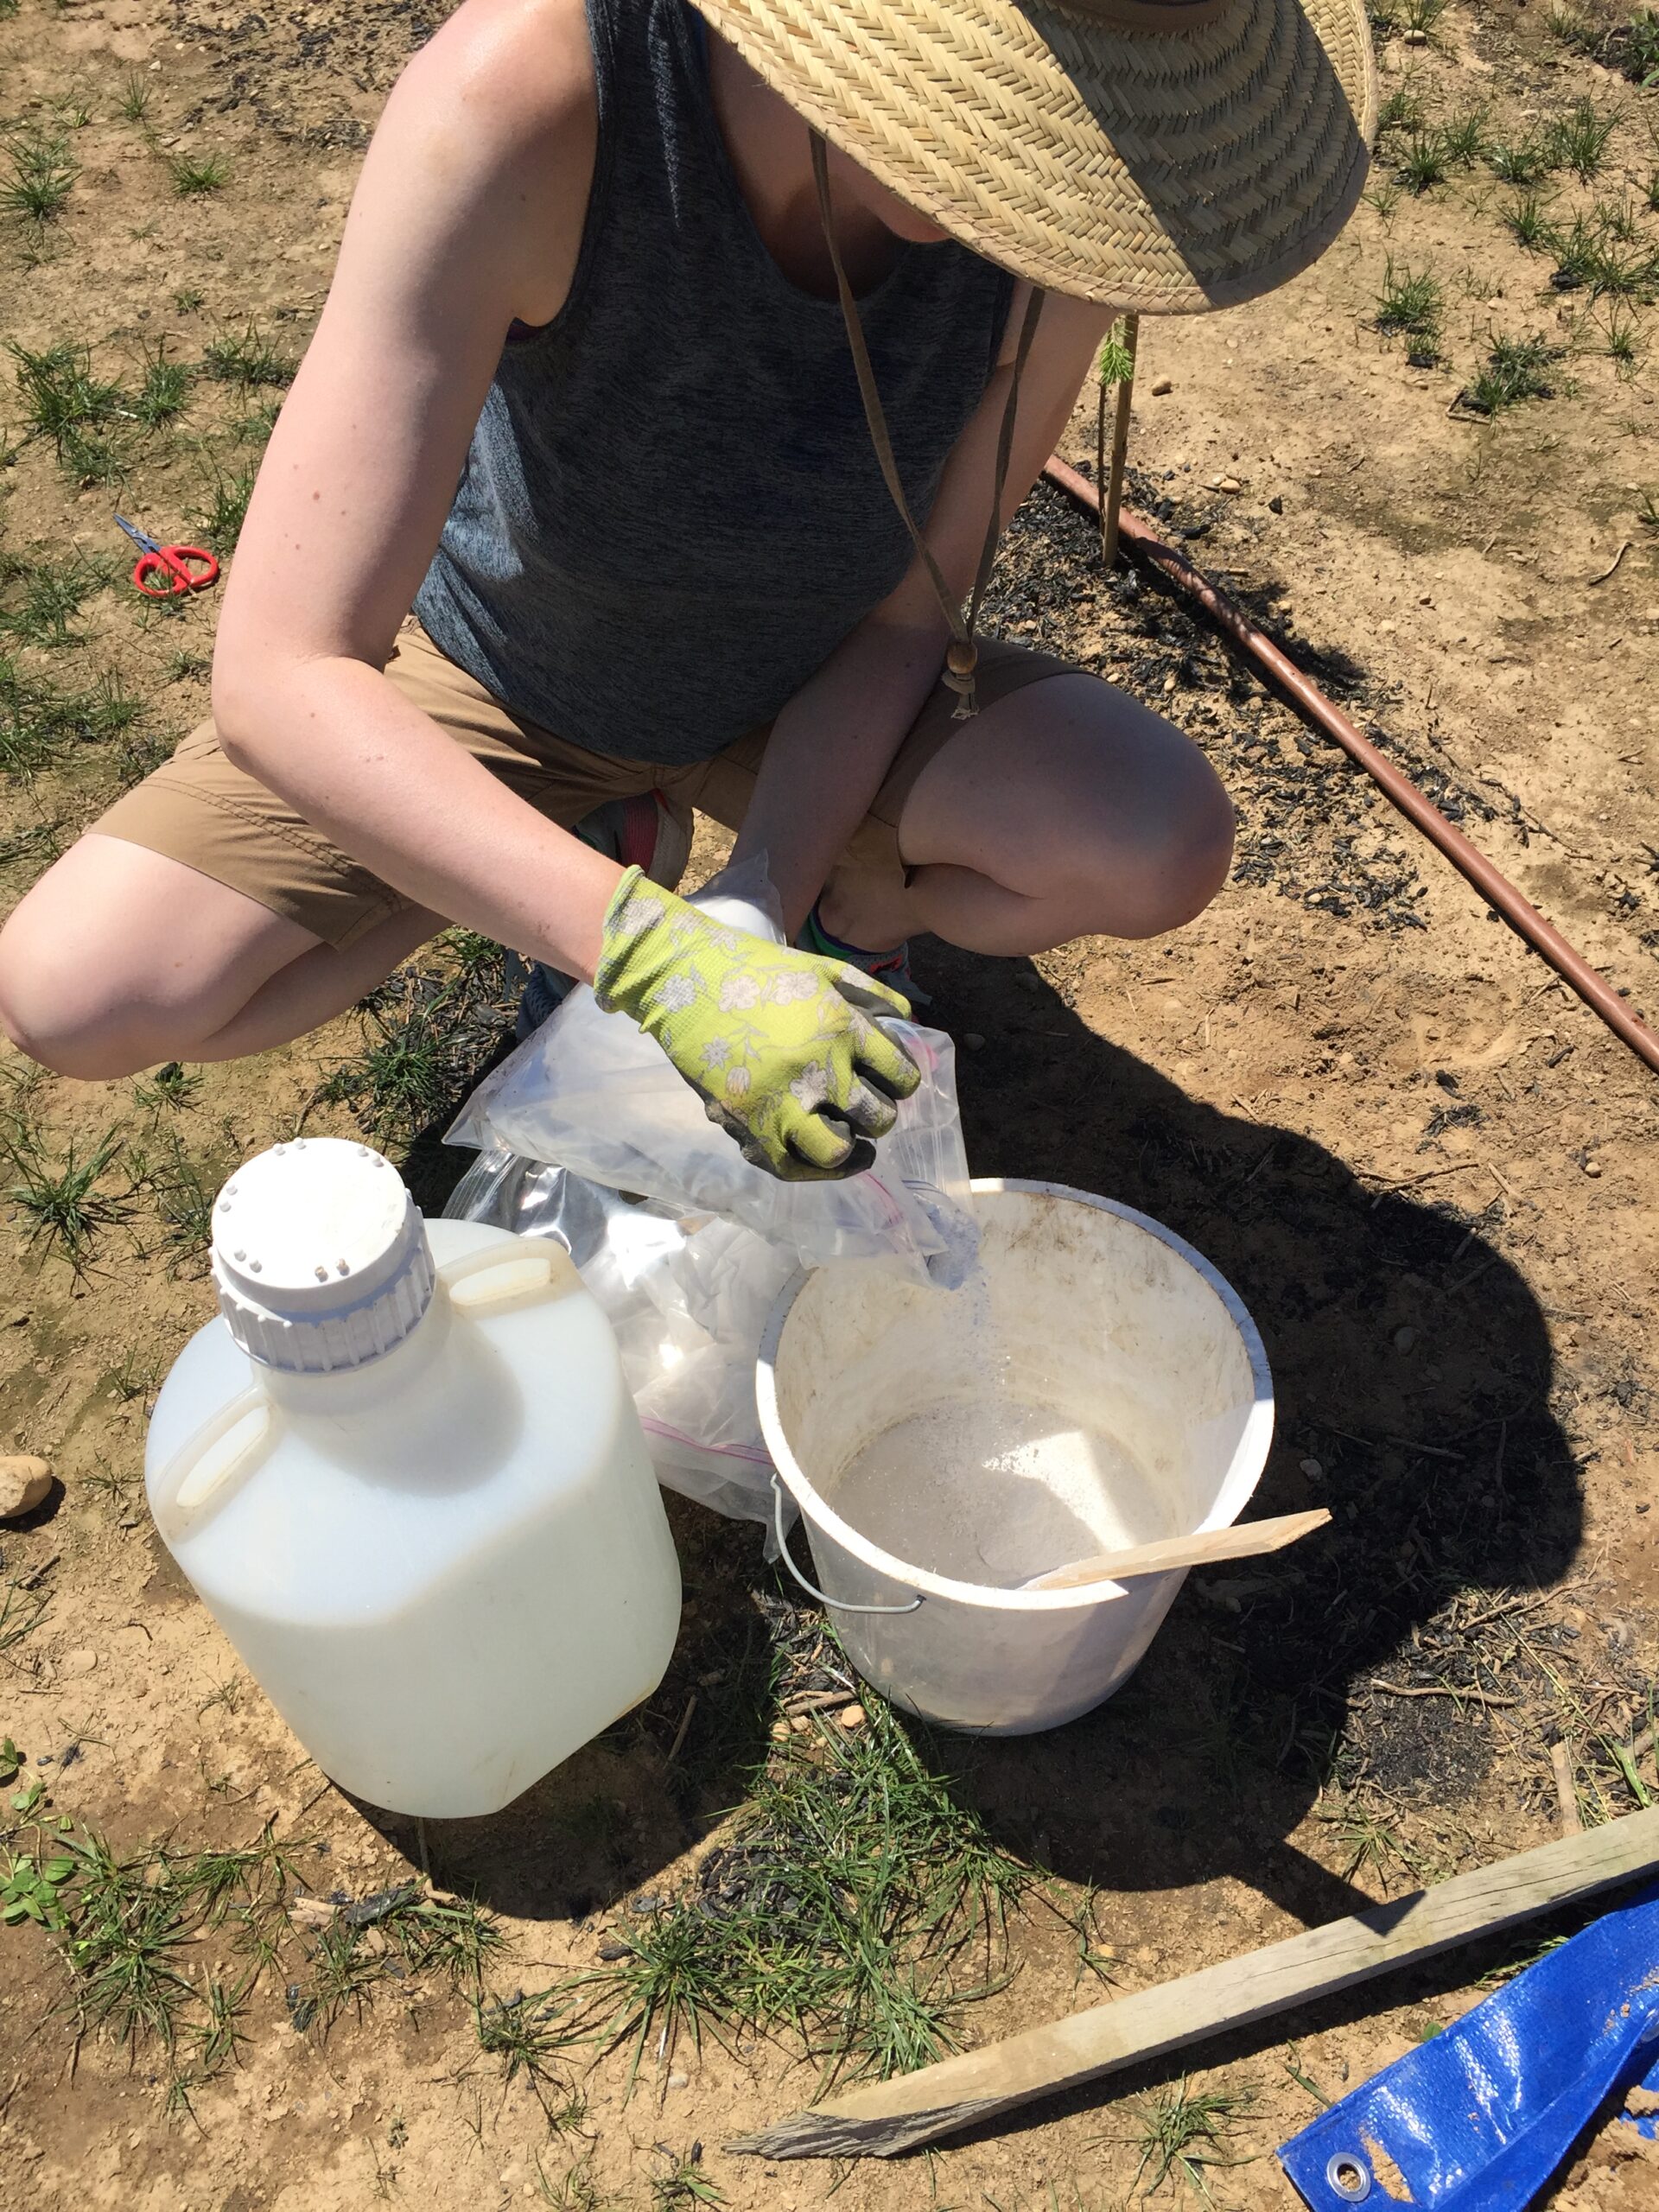
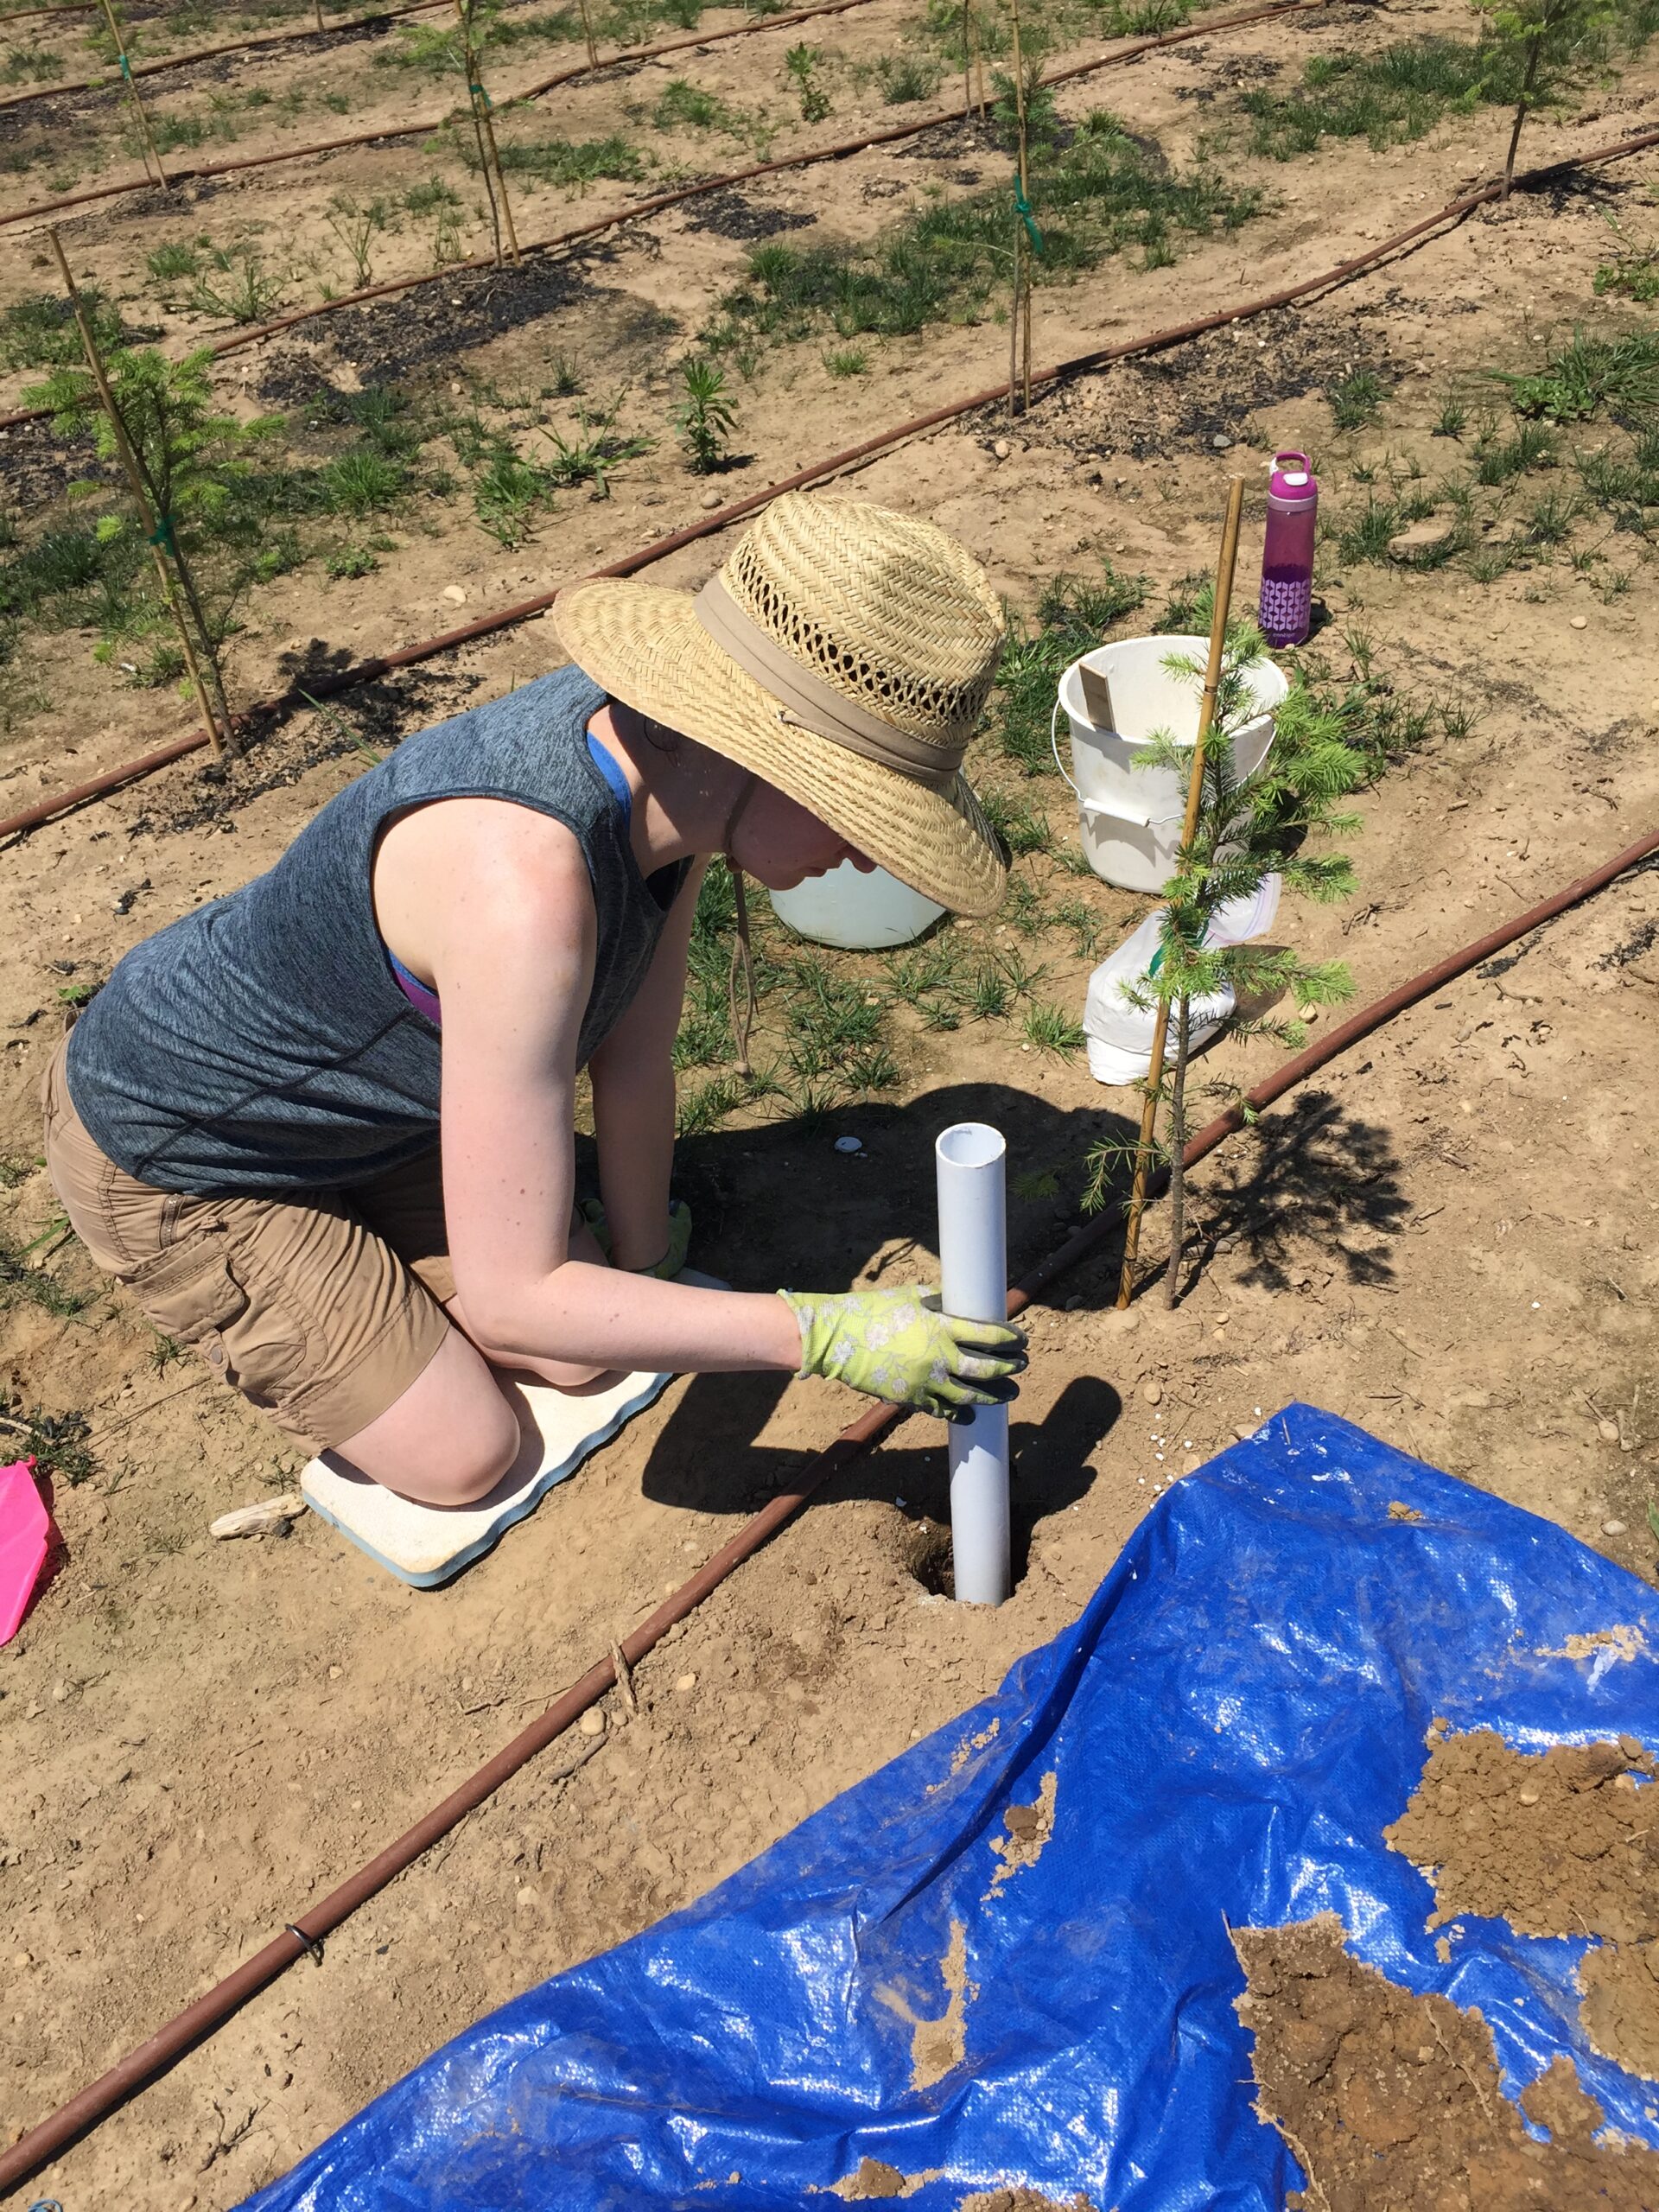
Image: Mina Vescera installing a lysimeter at the Douglas fir trial location.
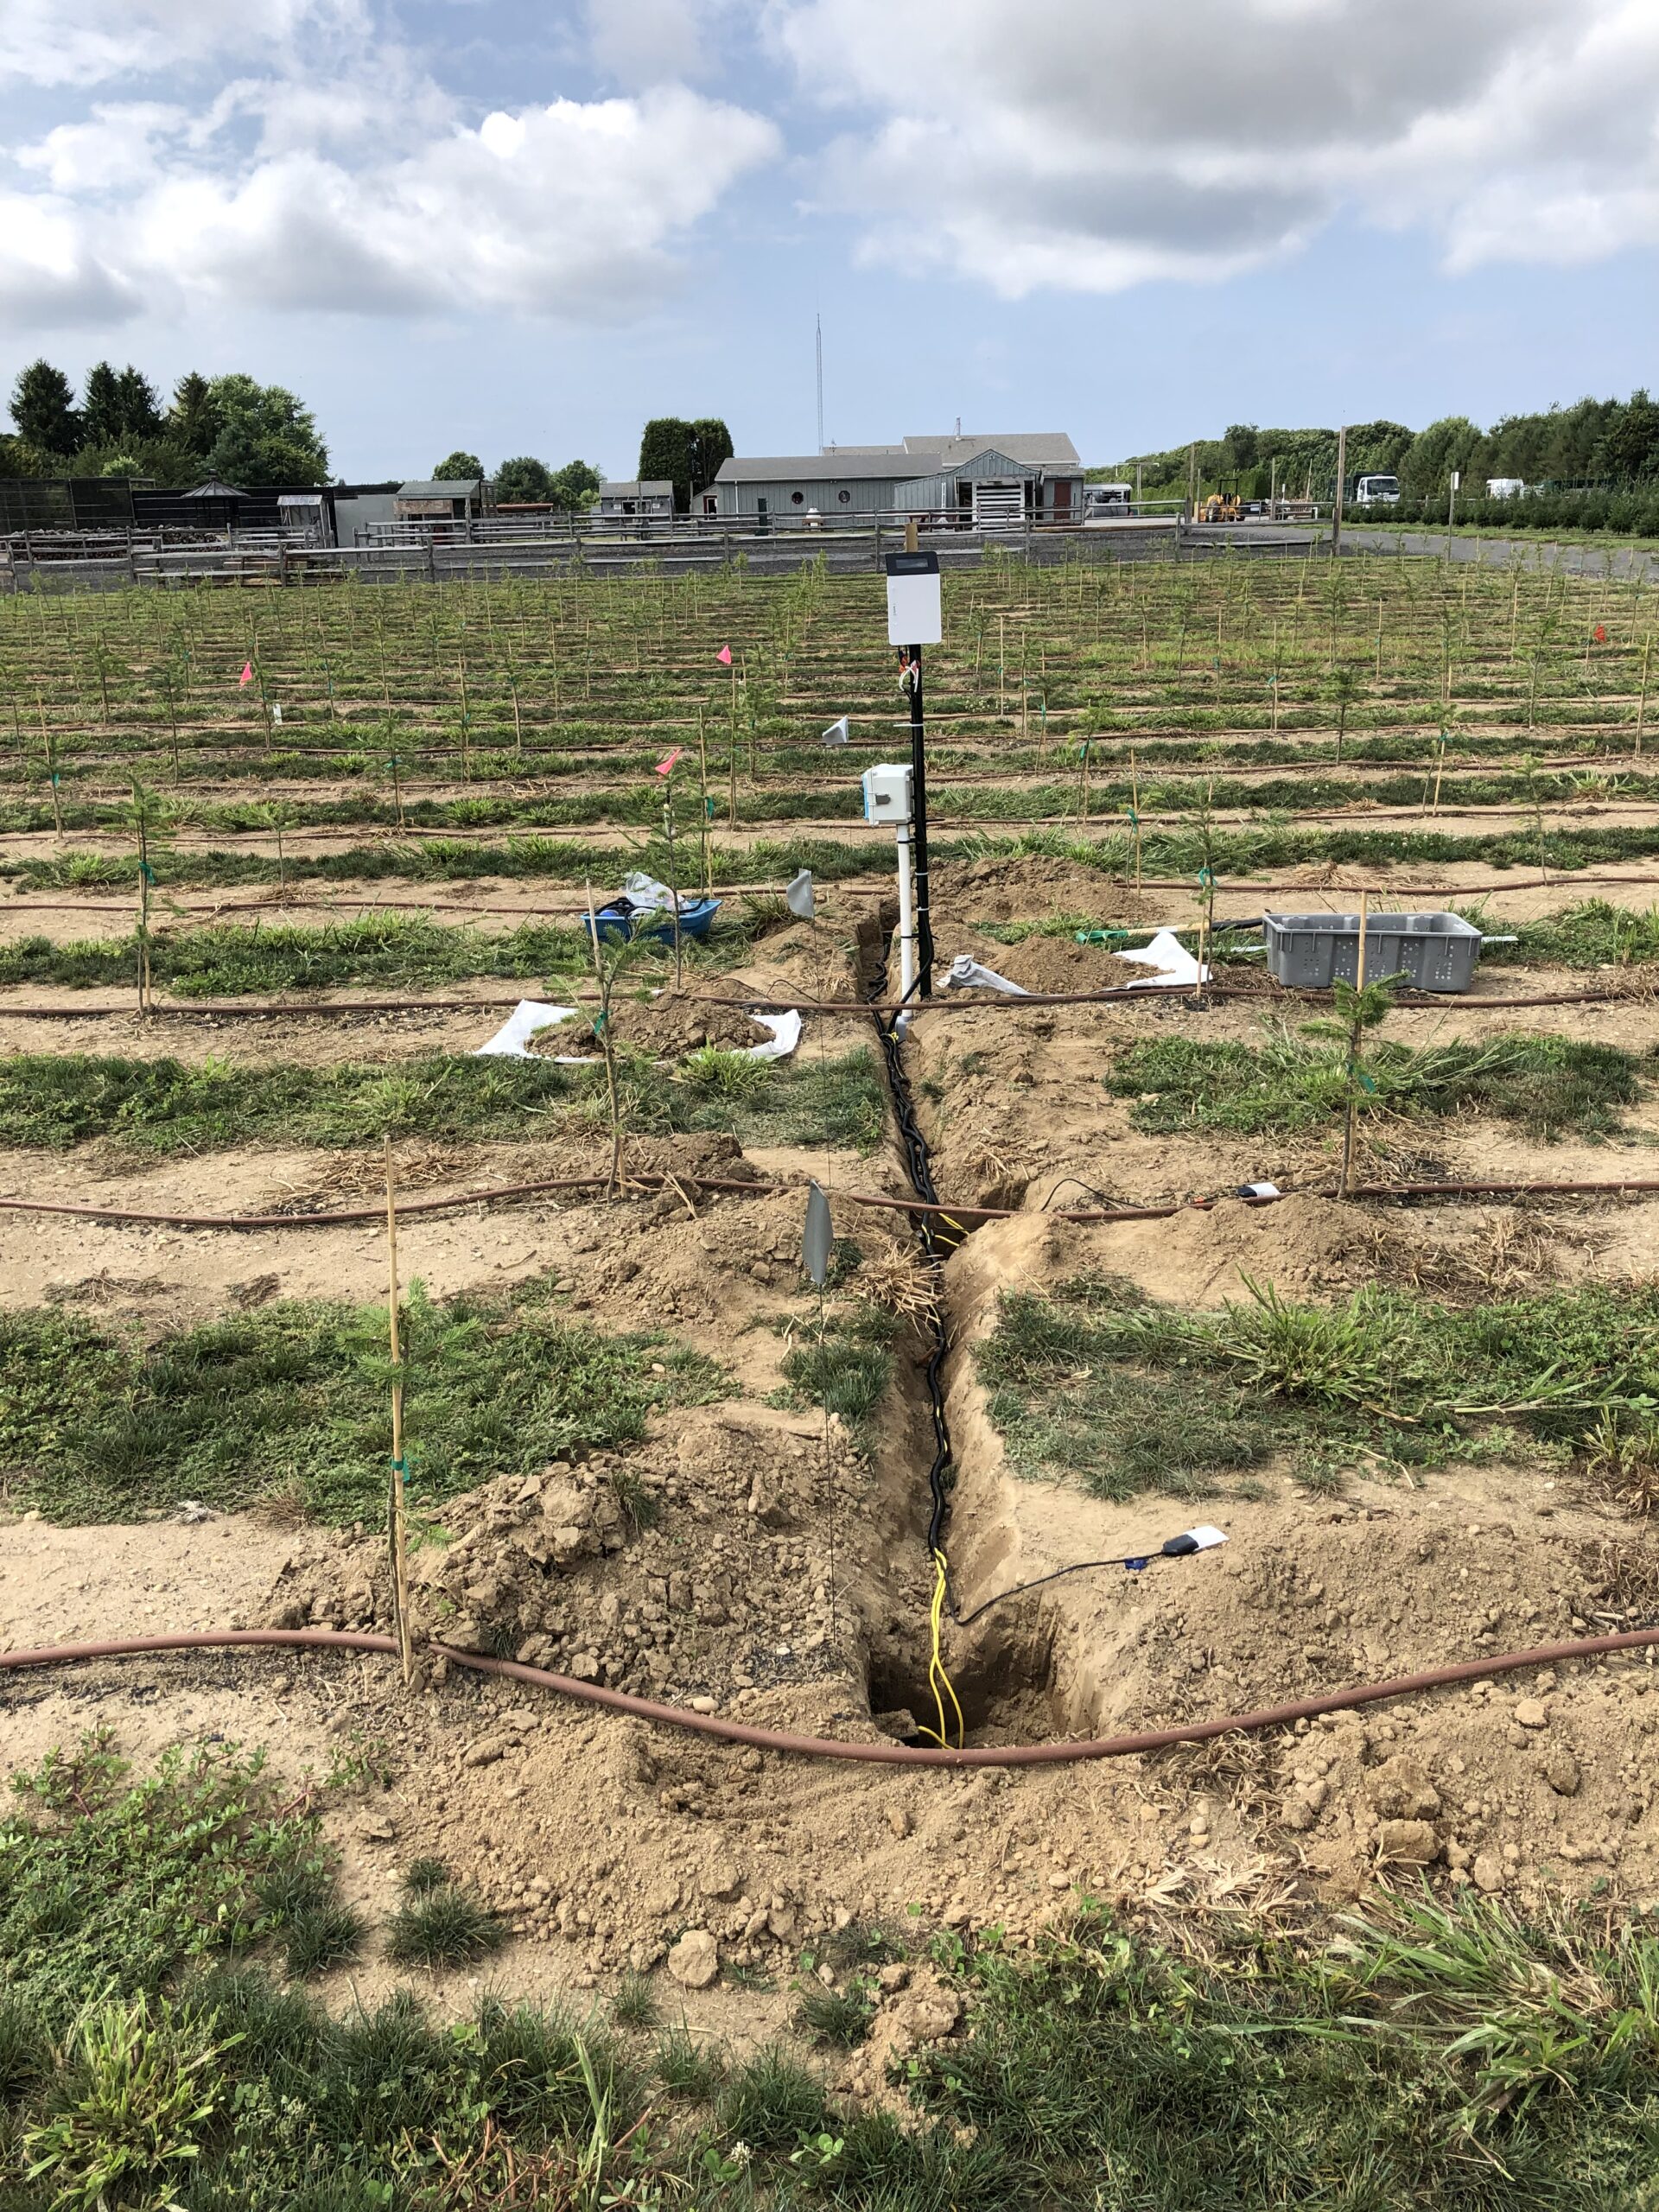
Image: Installation of the TDR and soil water potential sensors into the Douglas fir field in Cutchogue, NY.
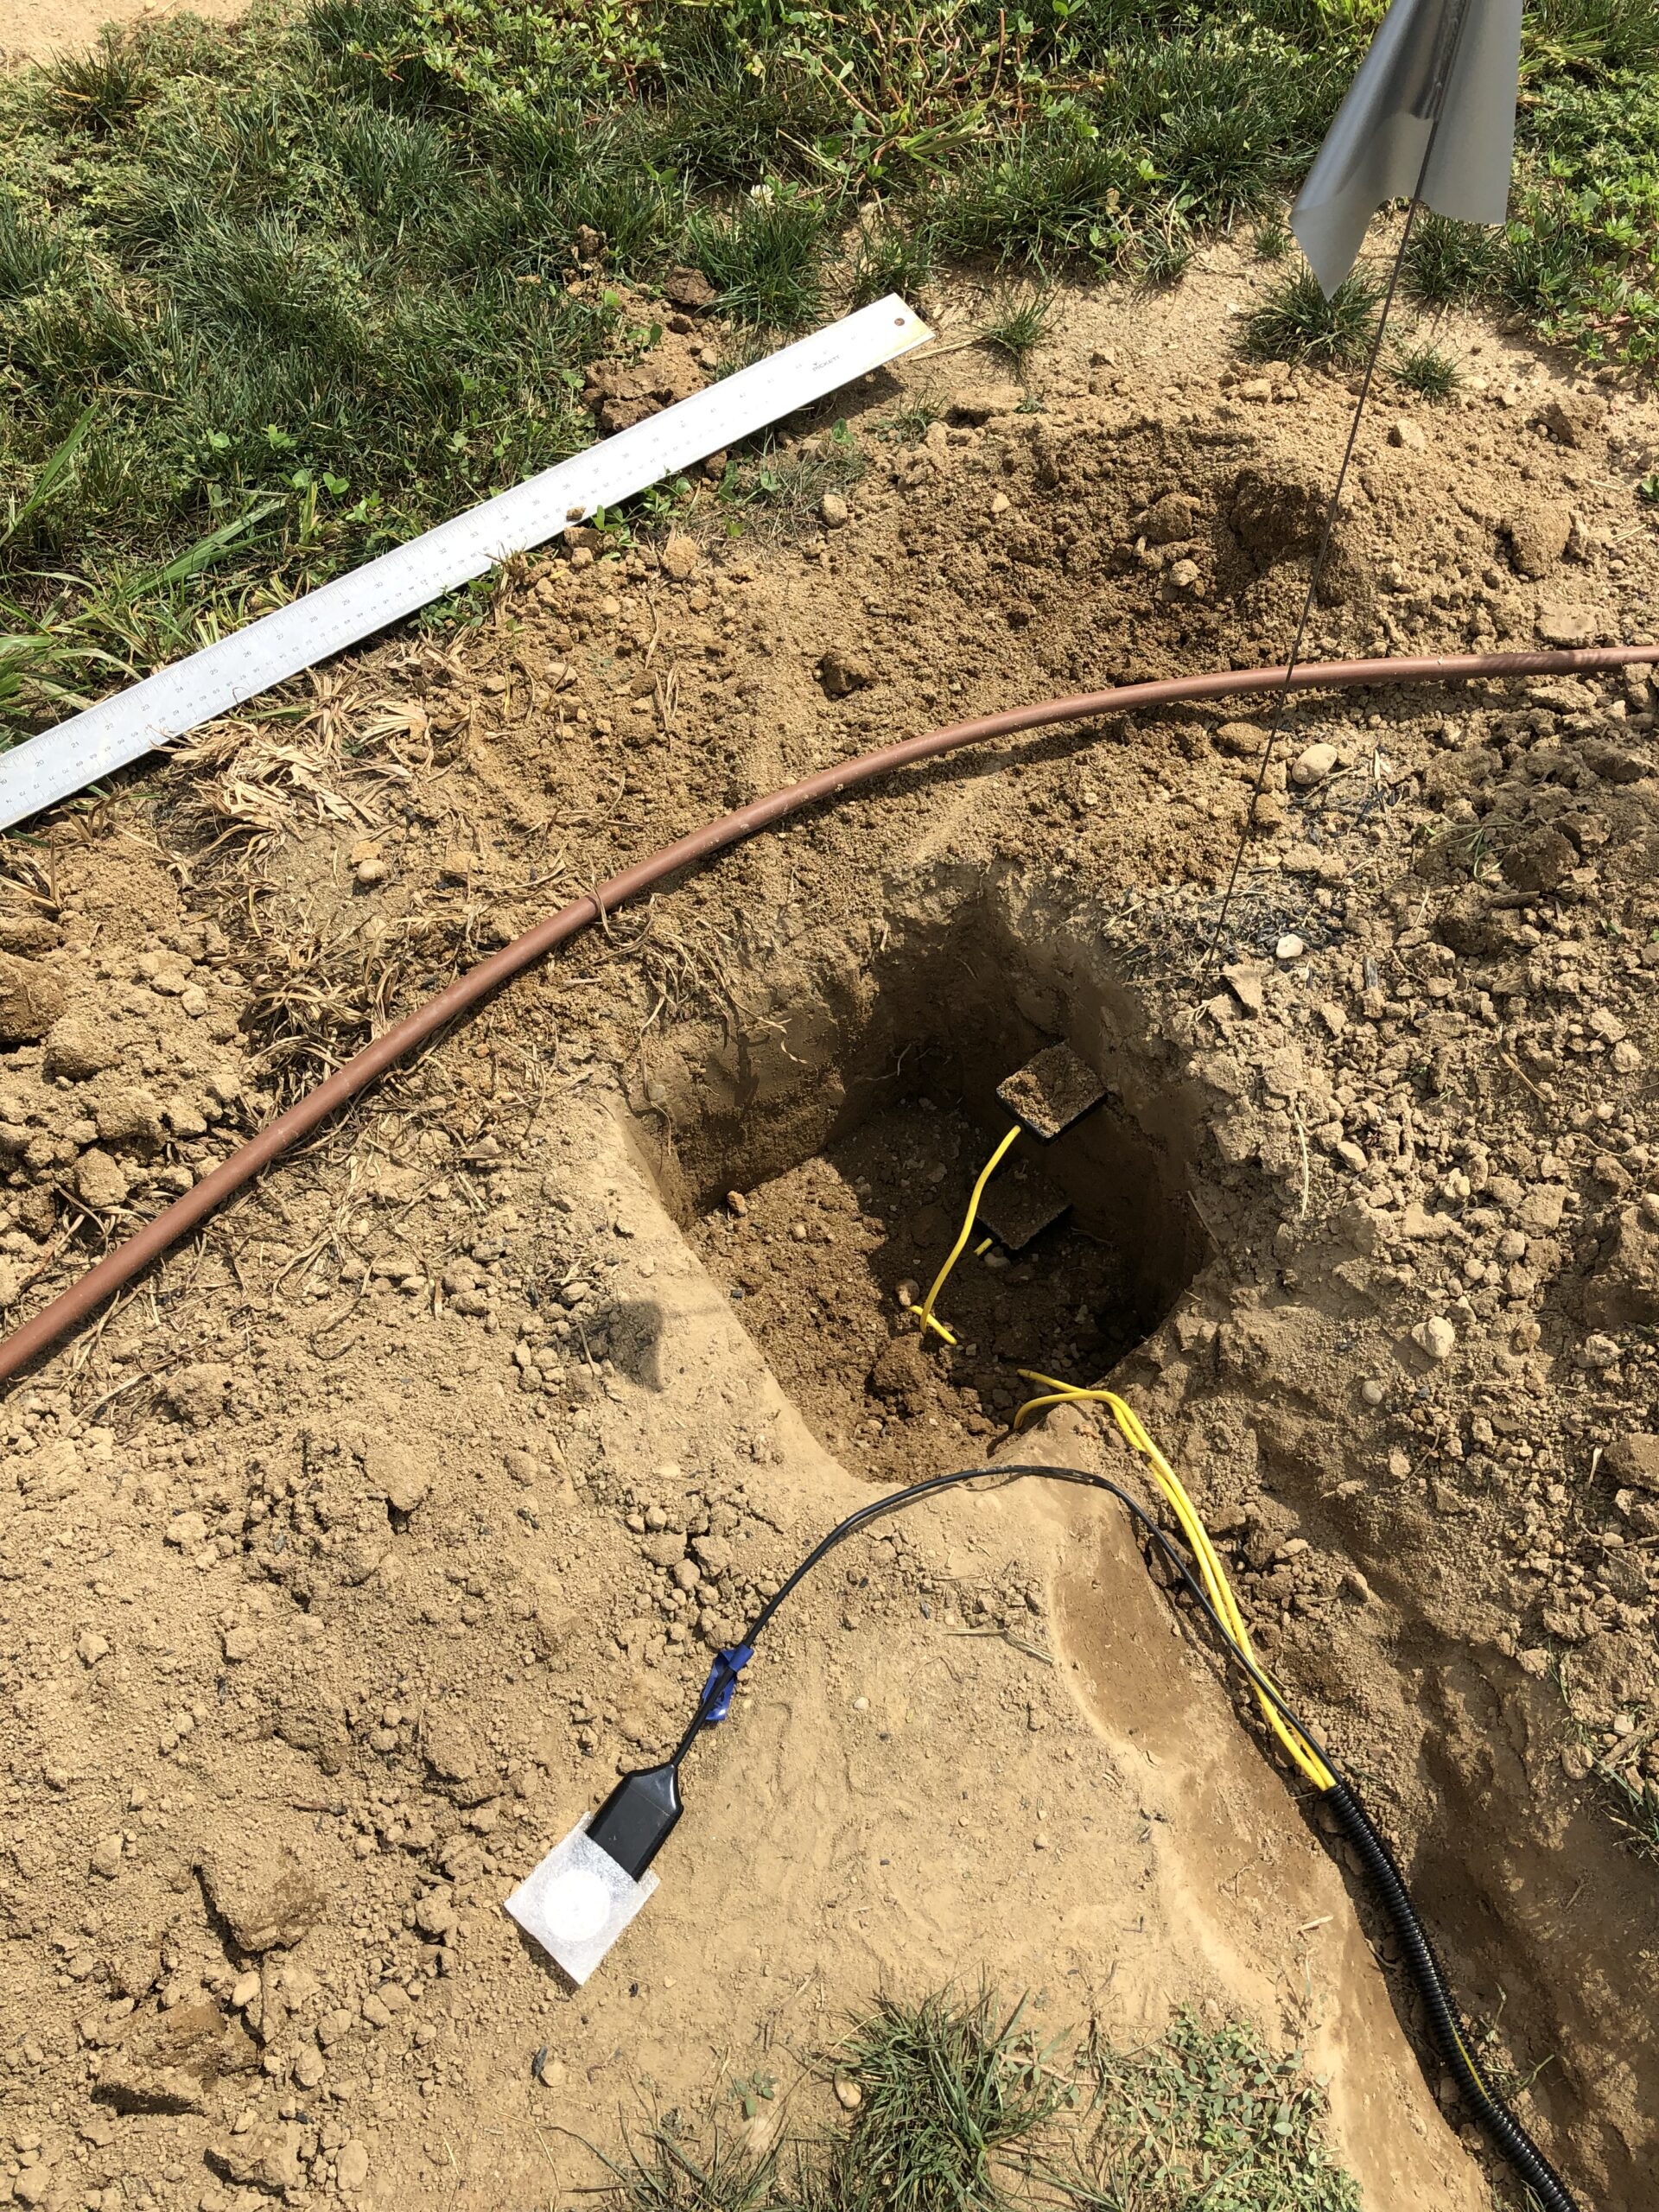
Image: TDR probe inserted at a depth of 4 inches with the 10-inch probe just visible below. The water potential sensor is on the soil surface waiting to be installed at the 4-inch depth as well.
Year 2 - 2020 Field Trials
Data collection continued throughout 2020 from the two field trials installed in 2019. Unfortunately, due to farm management changes the final participating grower located on the South Fork of Long Island that grows California privet was no longer able to participate. However, another grower on the North Fork growing California privet was willing to participate in the trial. Trial installation was further delayed due to restrictions imposed by the Covid-19 pandemic. But eventually, lysimeters and soil sensors were installed in June and July, respectively, with the biochar treatments installed in early October at the third farm location in Riverhead, NY. For all field trials, three plant health evaluations were conducted over the course of the growing season. Lysimeters were checked for soil water leachate after every rain event beginning in May and ending in November. Any soil water samples collected were kept refrigerated until shipped to Brookside Laboratories Inc., (New Bremen, OH) for ammonium and nitrate analysis. Soil samples were collected from all field trials in September and October and analyzed for soil nutrients. No tissue samples were collected because plants were too small to collect a large enough sample across all treatments. Similarly, no destructive sampling was conducted in 2020 due to the size of the plants.
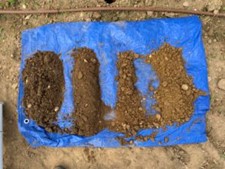
Image: Visual of soil layers found during lysimeter installation at the Baiting Hollow privet field location. Soil type is Riverhead sandy loam with mean soil organic matter for control plots of 2.8%. From left to right, approximate depths of 0-6, 6-13, 13-20, 21-28 inches.
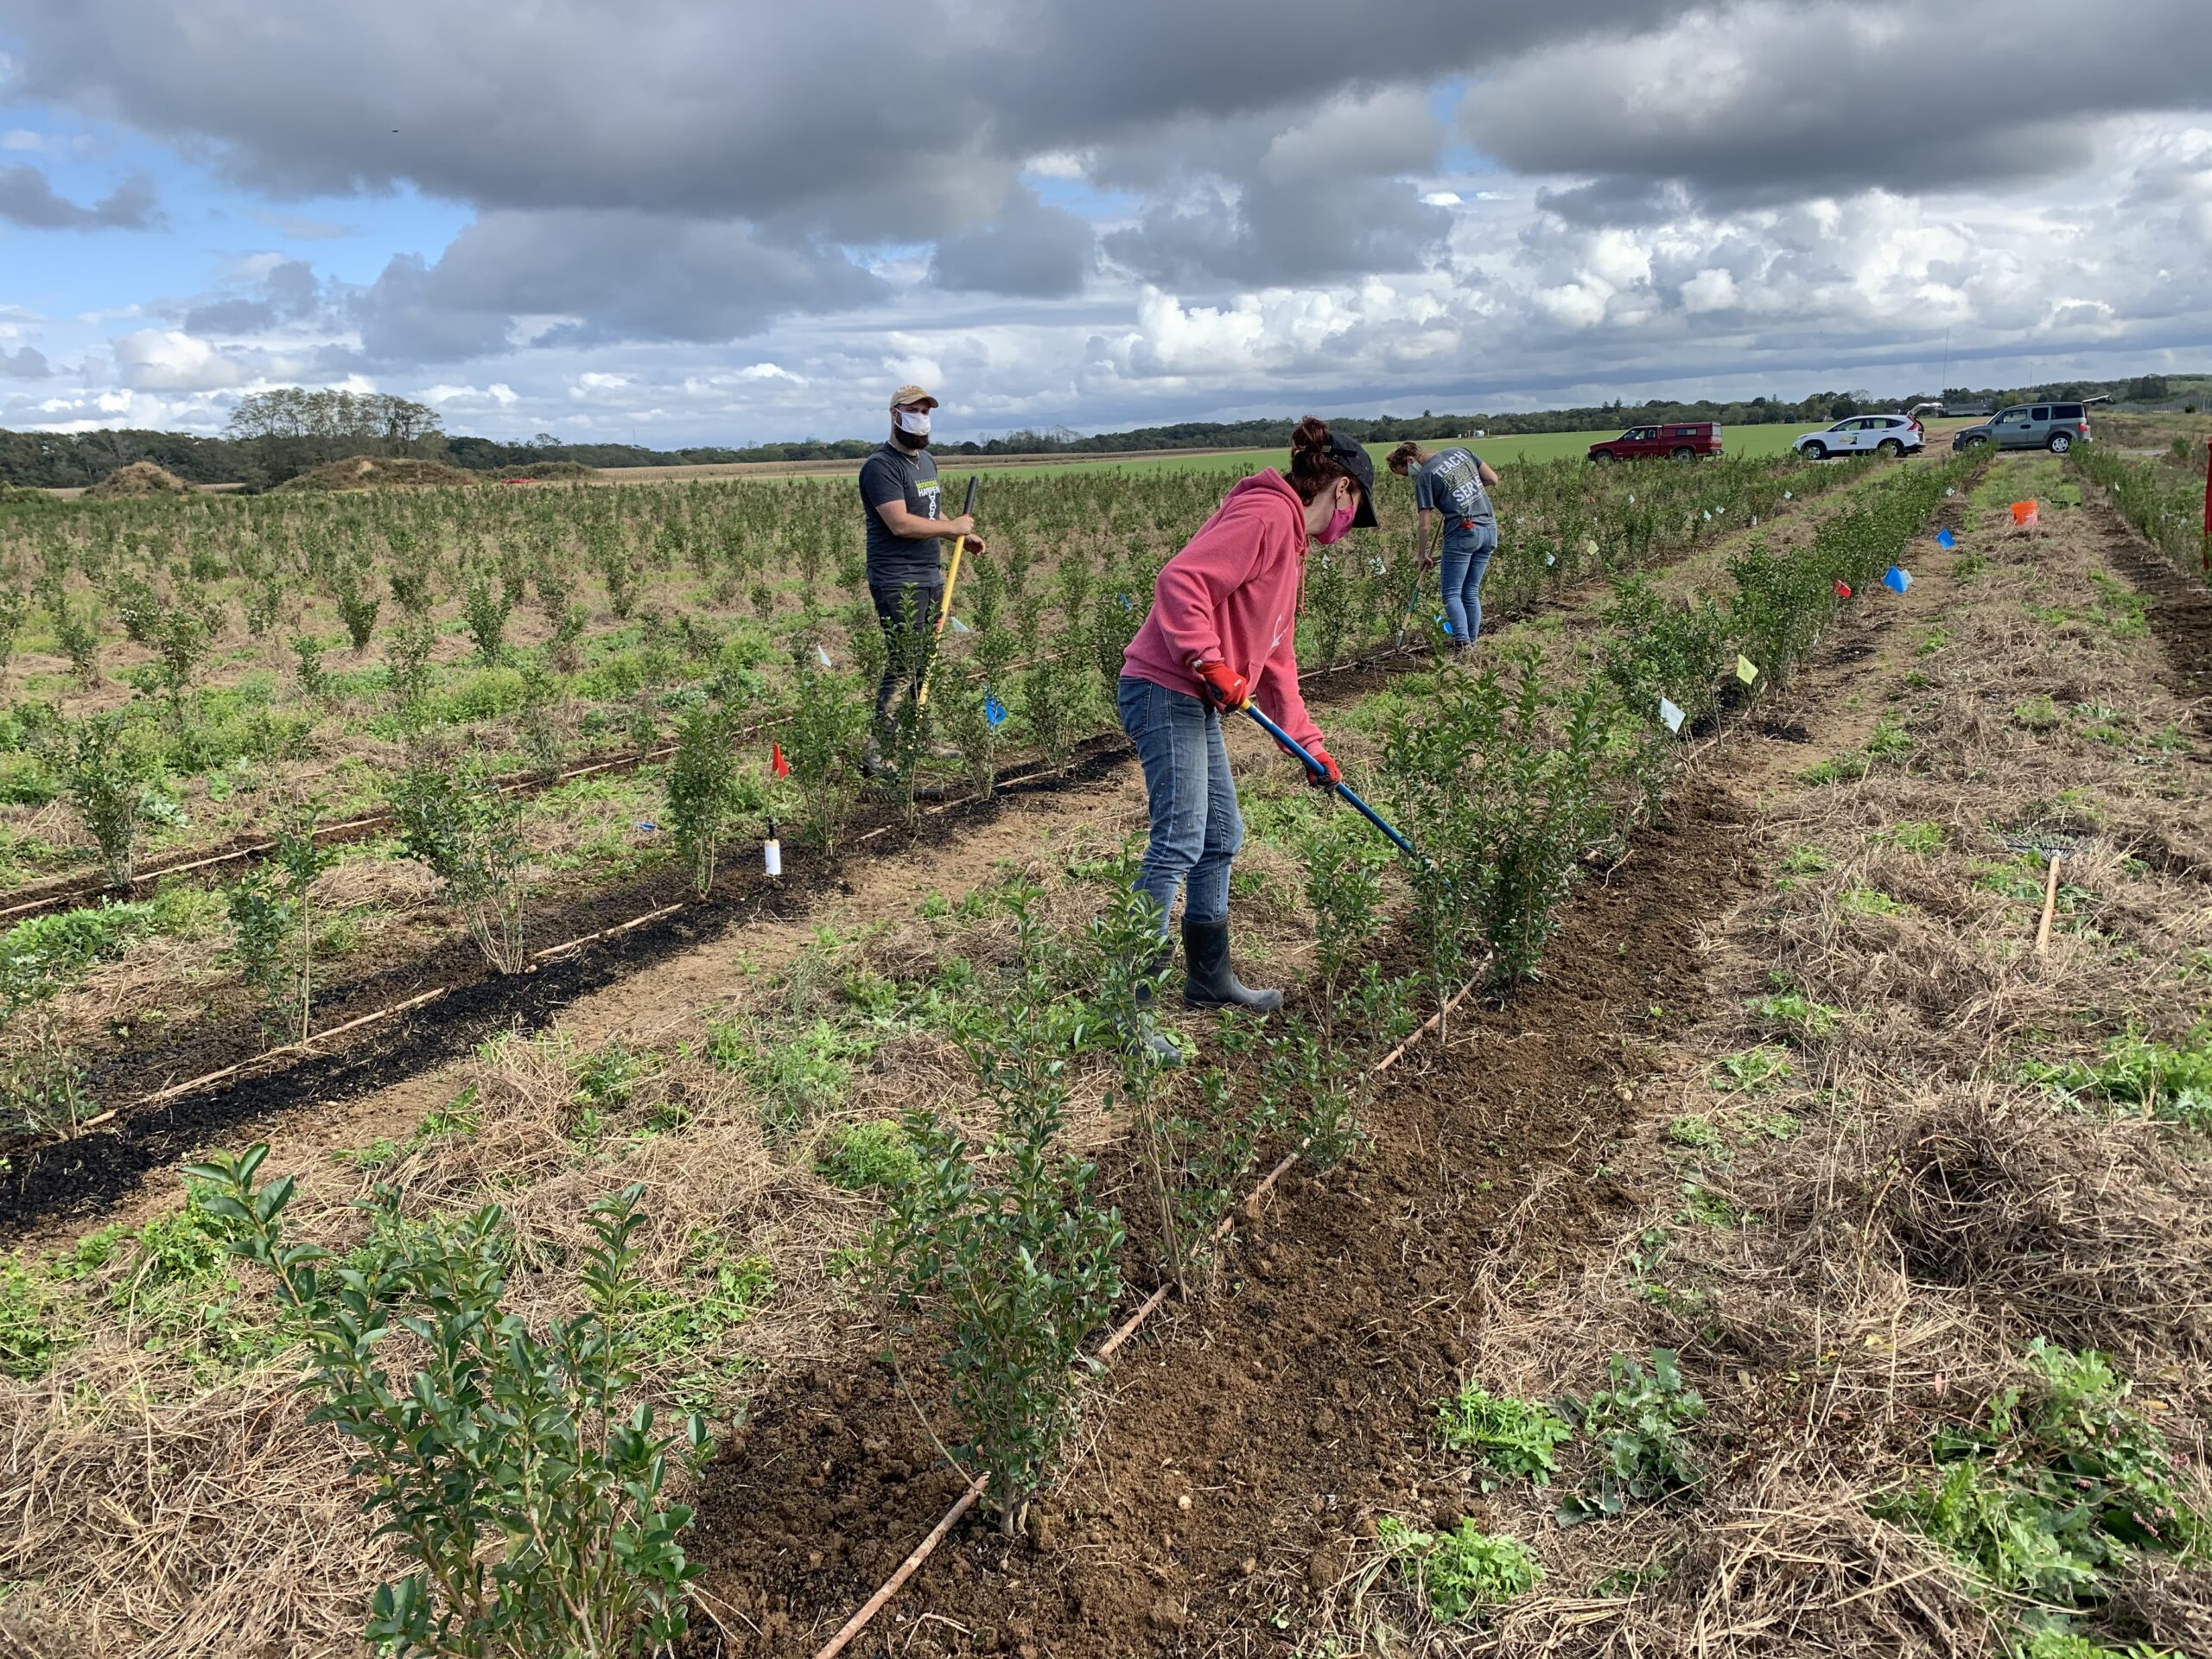
Image: Installation of the third field trial in early October 2020. Plants are California privet (Ligustrum ovalifolium). Hardwood biochar was surface applied and incorporated to a depth of 4 inches.
Year 3 – 2021 Field Trials
Soil samples were collected at the end of the experiment in October. Two replications per treatment were submitted for the CASH test. All replications were analyzed using the Solvita soil health test methods (WoodsEnd Labs, Maine).
The Douglas Fir trees could not be destructively sampled, thus final data collected in mid-September were tree height, number of buds on the leader, and leader height, based on the method described by Hinesley et al., 2000. No data were collected on newly planted trees within each treatment.
Shoot samples were destructively sampled from the Riverhead and Baiting Hollow privet trials. One replicate per treatment was collected in September 2021. One tissue foliar sample per replicate at both privet locations were collected at the same time of the destructive sampling. No root samples were collected.
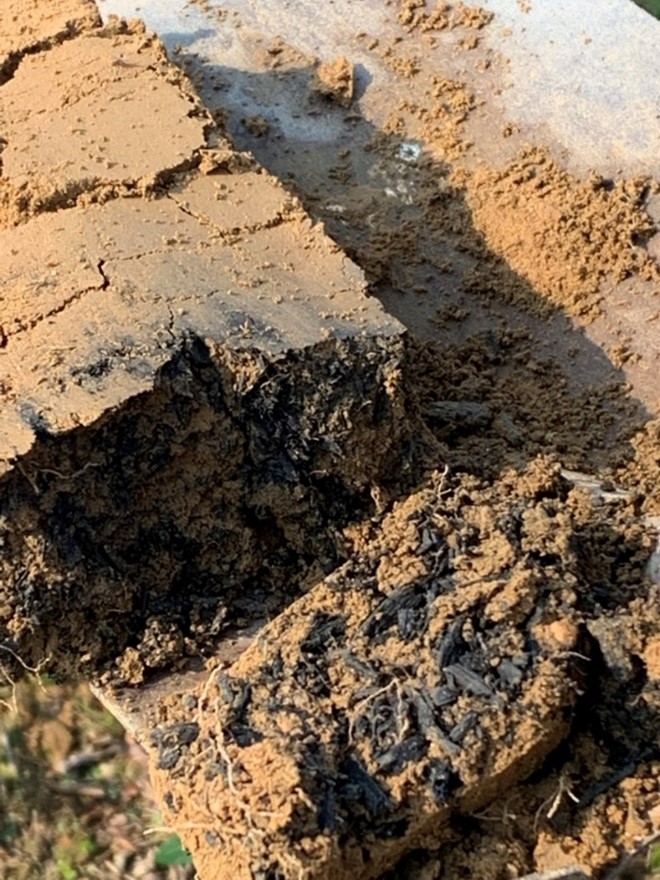
Image: Soil sample collected in September 2022 for the CASH test at the Riverhead California privet field location. The treatment pictured is the 15 tons per acre biochar rate.
Container Experiments:
Year 1 – 2019 Container Results
No differences were found between treatments on shoot growth of the switchgrass trials or boxwood. Root biomass weight included the weight of the potting media because it could not be separated. Treatment B30 produced significantly more root biomass than B10 (p<0.05). No other differences were found between treatments on root biomass. No differences between treatments were found on ammonium and nitrate leachate concentrations for both boxwood and switchgrass trials.
Overall, plant health ratings of container plants did not differ within or across treatments. No differences were found with PourThru data (pH and EC of leachate) between treatments over the season.
Pictures of all container boxwood and switchgrass plants were taken on August 20 and September 11, 2019 to visually compare treatments. No visual differences were seen from these side-by-side pictures.
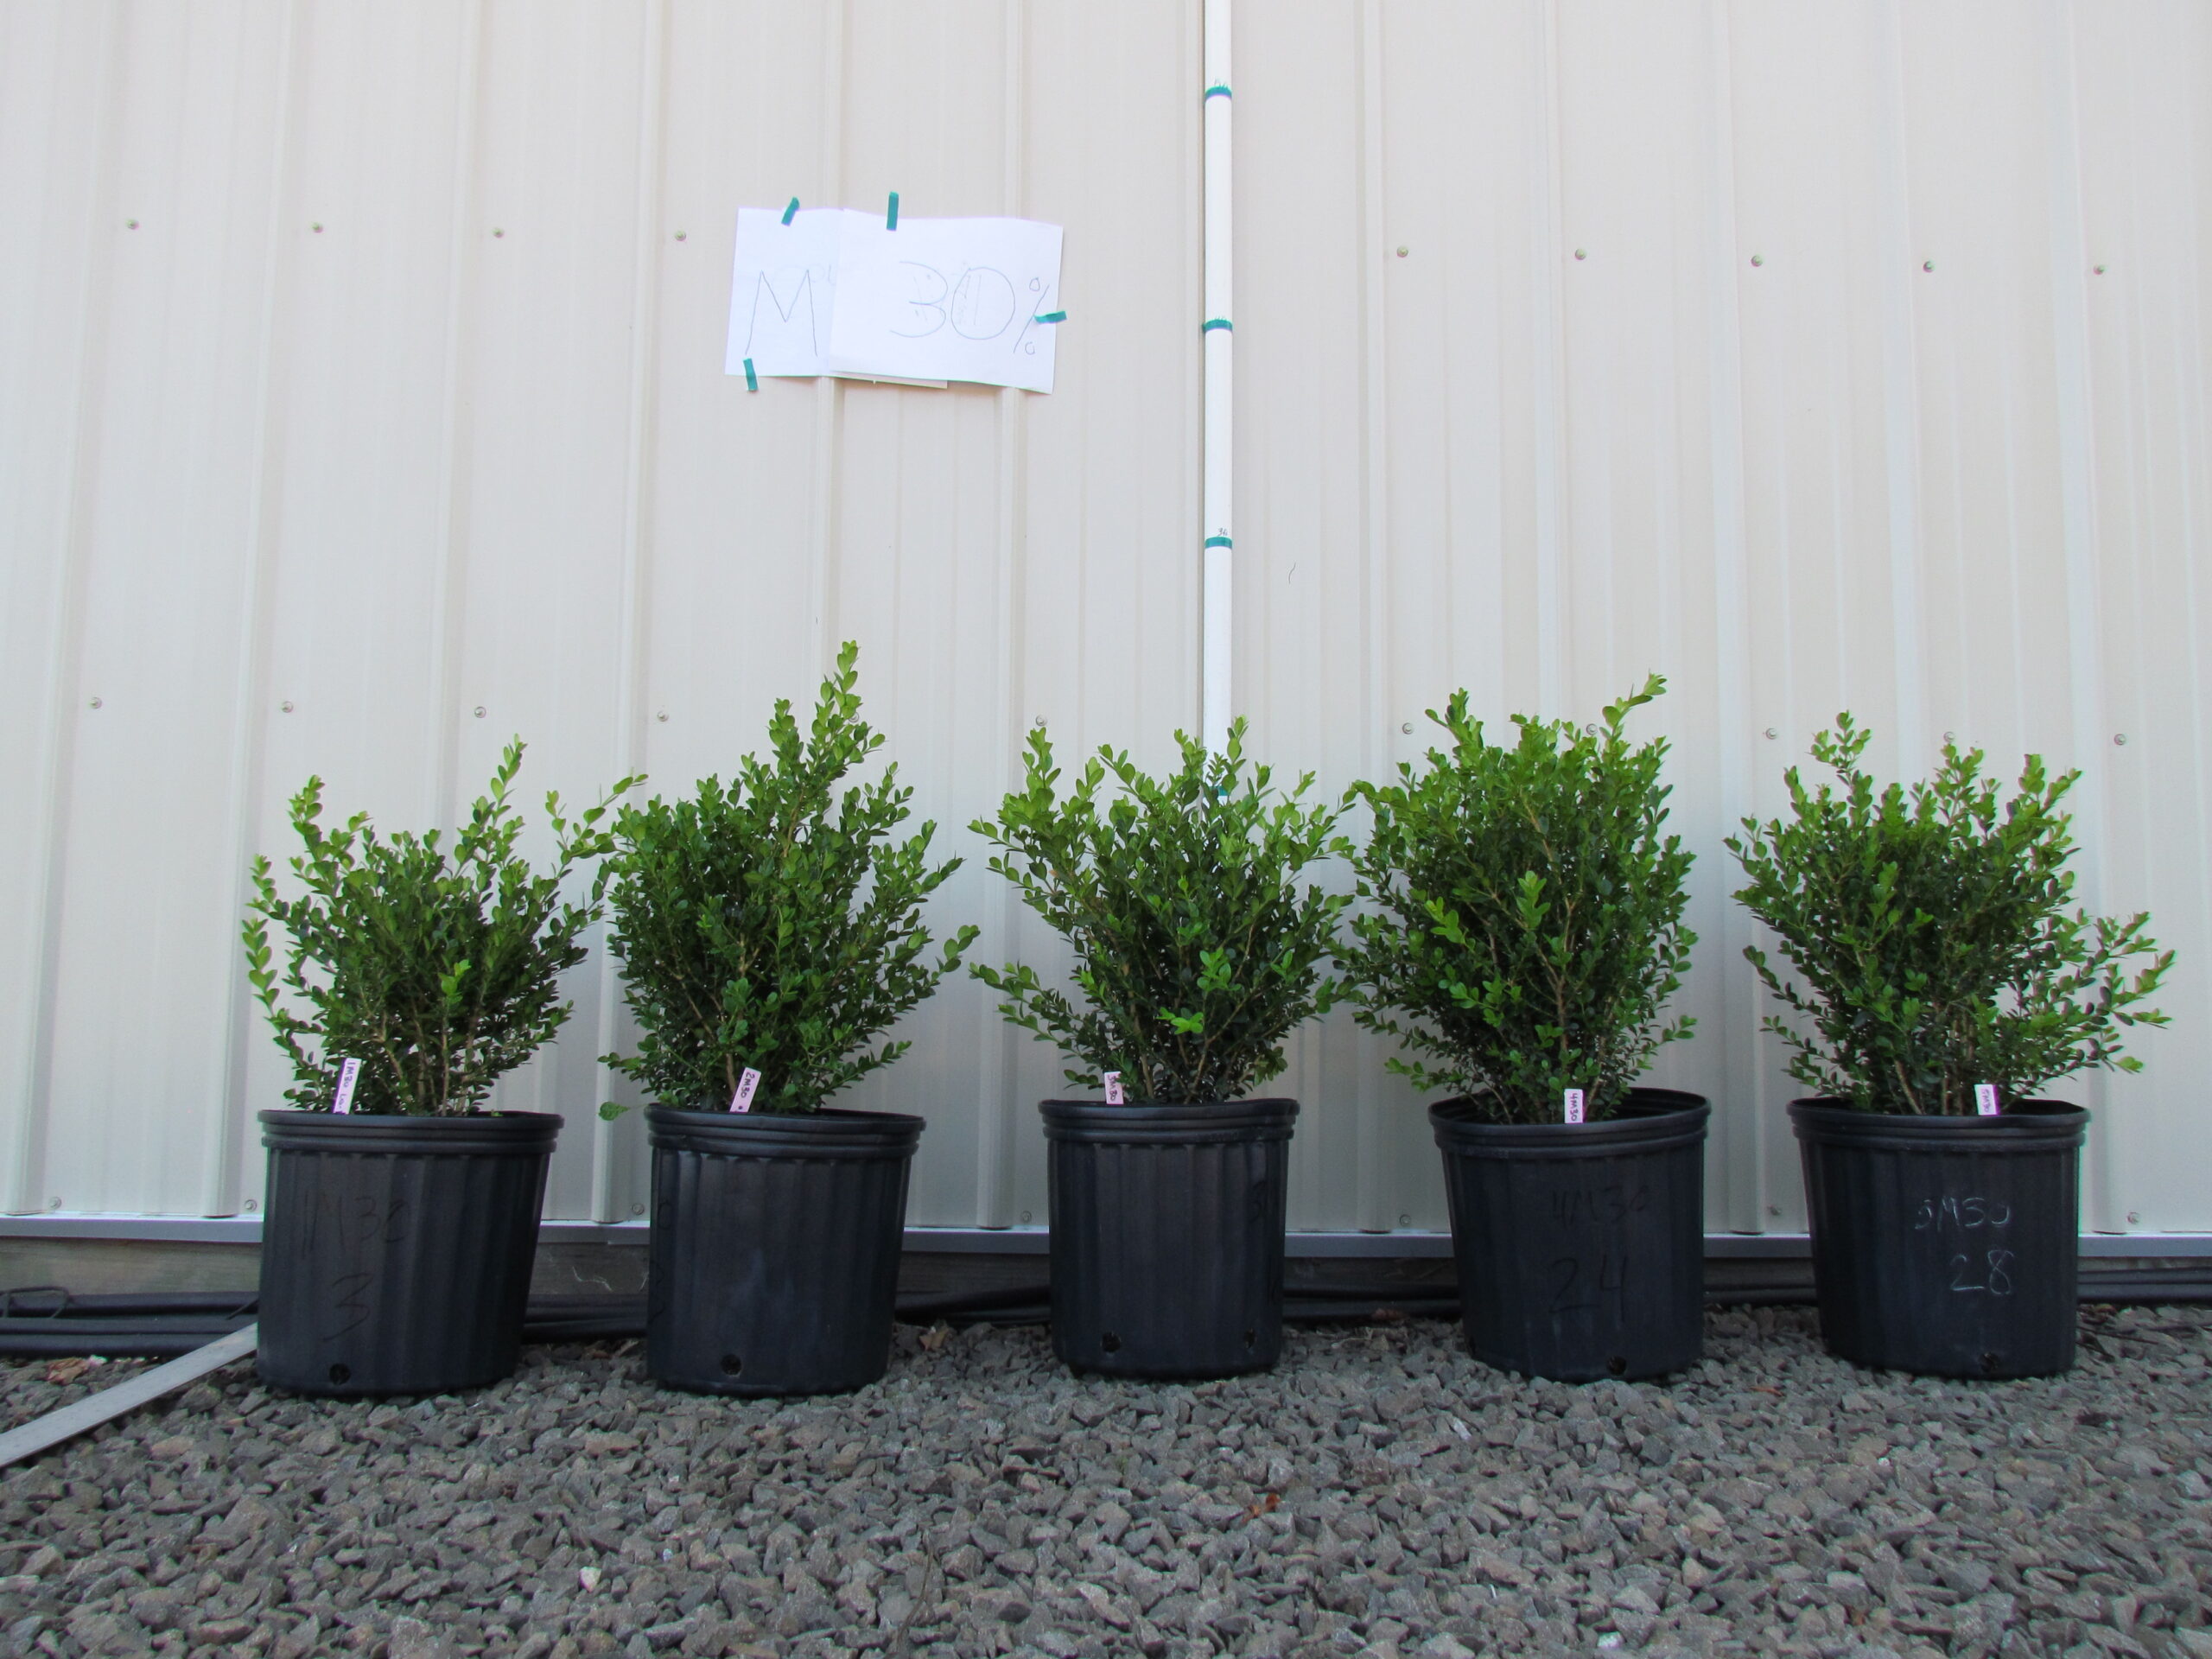
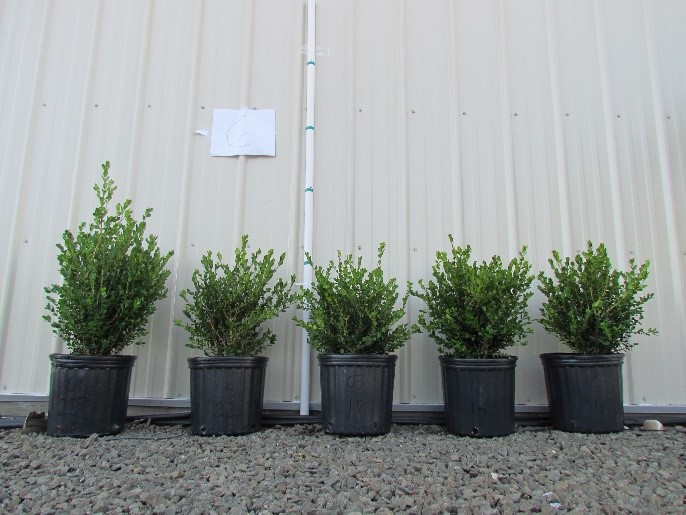
Image: Comparison of boxwood treatment with biochar mixed at 30% by volume (top) and control plants (bottom). Taken September 11, 2019.
Year 2 - 2020 Container Results
No significant differences were found between treatments on shoot dry weight, pH, EC, number of stems as determined by the plant health evaluations, and foliar nutrient levels for the overwintered 2019 on-farm switchgrass plants. Differences were found after destructive sampling on rootball weight with the control and 20% mixed biochar treatments having a greater rootball dry weight than the 10% bottom and 30% mixed biochar treatments. There were no differences in winter container substrate temperatures across treatments as measured with the HOBO temperature sensors. The 20% and 30% bottom biochar treatments were found to have significantly lower EC values over the growing season compared to the control (p<0.05).
Similarly, for the overwintered 2019 boxwoods at LIHREC no significant differences were found for rootball dry weight, shoot dry weight, foliar nutrient levels, and pH of the leachate.
Regarding the switchgrass plants potted up in 2020, no differences were found between any of the treatments for the parameters measured (shoot dry weight, number of stems as determined by the plant health evaluations, and foliar nutrient levels) at either location. However, the different irrigation systems at each trial location are believed to have impacted nutrient leaching levels since pH and EC levels were noticeably different.
Year 3 - 2021 Container Results
For the container trials, no differences were found on shoot and root weight for the 2020 overwintered switchgrass plants.
In the final year of the container trials, in addition to the Heavy Metal switchgrass trials at the LIHREC and container nursery location in Cutchogue, NY, an additional ornamental grass species was included: Japanese forest grass (Hakonechloa macra ‘Aureola’) was added at the LIHREC trials only. This trial was conducted in a covered hoophouse (white plastic) to provide the shade needed for this grass species. In all container trials, no differences were found between tissue analyses. Treatment differences were found on final root dry weight for the container California privet, Japanese forest grass, and switchgrass planted in 2021. However, no consistent effect of biochar rate and type was observed. No significant differences were found in shoot dry weight for the switchgrass trials across treatments at either location. However, shoot dry weights did significantly differ across treatments in the Japanese forest grass trial (p = 0.0031) with the oat hull biochar 50% treatment producing less biomass than other the other treatments (Figure 1).
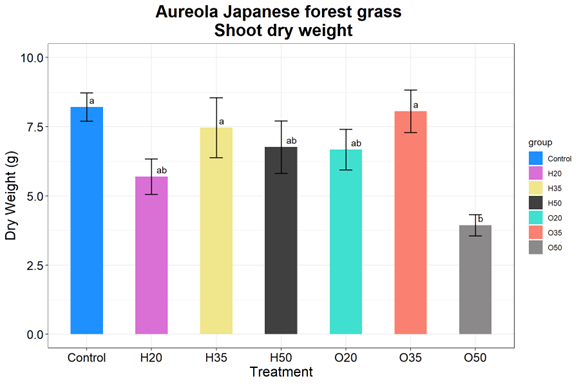
Figure 1. Mean shoot dry weights for Aureola Japanese forest grass samples collected in August 2021, LIHREC, Riverhead, NY. Different letters indicate significant differences between treatments (p < 0.05, Tukey HSD test). Treatments from left to right: control, hardwood 20%, hardwood 35%, hardwood 50%, oat 20%, oat 35%, and oat 50%.
A PourThru was conducted on the container trials in July 2021 and samples were submitted for complete nutrient analysis. Some treatment differences were found for each the Japanese forest grass and switchgrass on selected nutrients (Table 1). No treatment differences were found on the following micronutrients: sodium sulfur, chloride, iron, manganese, copper, zinc, aluminum, molybdenum, and cobalt, and are not reported here. Electrical conductivity also did not differ between any of the treatments
Table 1. Mean pH and nutrient tissue levels for container-grown Japanese forest grass, Riverhead, NY, 2021 and Heavy Metal switchgrass at both locations. Different letters within each row indicate significant differences between treatments (p < 0.05, Tukey HSD test). Wood denotes the hardwood treatments.
|
|
Wood 20% |
Wood 35% |
Wood 50% |
Control |
Oat 20% |
Oat 35% |
Oat 50% |
|
|
Japanese forest grass |
||||||
|
pH |
5.87 AB |
6.37 ABC |
6.46 ABC |
5.1A |
5.8 BC |
6.36 BC |
7.2 C |
|
Nitrate - N (ppm) |
106.6 AB |
24.4 AB |
23.2 AB |
120.9 A |
45.5AB |
35.9 AB |
15.2 B |
|
Calcium (ppm) |
31.6 A |
11.7 AB |
11.9 AB |
32.2 A |
14.6 AB |
11.9 AB |
8.5 B |
|
Magnesium (ppm) |
24.3 AB |
6.0 AB |
5.1 B |
35.5 A |
11.7 B |
7.7 B |
3.1 B |
|
|
Heavy Metal switchgrass (Cutchogue, NY) |
||||||
|
pH |
6.23 B |
6.66 AB |
6.87 AB |
7.2 A |
6.23 B |
6.9 AB |
7.03 A |
|
Calcium (ppm) |
8.45 B |
14.13 AB |
19.6 A |
17.16 A |
13.5 AB |
8.66 B |
11.45 AB |
|
Potassium (ppm) |
5.1 BC |
4.14 C |
6.8 BC |
4.64 BC |
12.1 AB |
35.9 A |
21.2 A |
|
|
Heavy Metal switchgrass (LIHREC) |
||||||
|
Calcium (ppm) |
18.0 AB |
15.4 ABC |
15.8 ABCD |
12.7 A |
8.6 BCD |
7.5 CD |
8.9 D |
|
Boron (ppm) |
0.07 A |
0.04 B |
0.05 B |
0.07 A |
0.04 B |
0.03 B |
0.03 B |
Several differences across treatments were found in the nutrient tissue levels for the LIHREC Japanese forest grass and the Cutchogue switchgrass trials (Tables 2 and 3). No differences in tissue nutrient levels for the LIHREC switchgrass trial were found. No differences were found in plant health observations at all field trial locations.
As found in the first two years of the trial, some tissue nutrient levels were within sufficiency ranges, while others were above or below. Only the switchgrass plants showed symptoms of stressed growth as several plants in both trial locations were chlorotic. However, this is not likely a nutrient deficiency or treatment effect.
Table 2. Mean macro- and micronutrient tissue levels for container-grown Japanese forest grass, Riverhead, NY, 2021. Different letters within each row indicate significant differences between treatments (p < 0.05, Tukey HSD test). Wood denotes the hardwood treatments.
|
|
Wood 20% |
Wood 35% |
Wood 50% |
Control |
Oat 20% |
Oat 35% |
Oat 50% |
|
Nitrogen (%) |
2.25 A |
1.89 B |
1.98 B |
2.19 A |
1.91 B |
1.92 B |
2.08 AB |
|
Phosphorous (%) |
0.47 A |
0.4 B |
0.41 B |
0.41 B |
0.38 B |
0.36 B |
0.36 B |
|
Potassium (%) |
2.34 A |
2.02 BC |
2.03 BC |
2.00 BC |
1.86 C |
1.97 BC |
2.14 AB |
|
Calcium (%) |
0.46 A |
0.43 AB |
0.37 BCD |
0.42 ABC |
0.34 CD |
0.32 D |
0.32 D |
|
Magnesium (%) |
0.24 A |
0.21 B |
0.19 BC |
0.25 A |
0.19 BC |
0.17 C |
0.18 C |
|
Sulfur (%) |
0.38 A |
0.32 BC |
0.31 BCD |
0.35 AB |
0.27 DE |
0.26 E |
0.27 CDE |
|
Boron (ppm) |
8.6 B |
7.1 C |
7 C |
6.9 C |
8.1 BC |
9.3 B |
11.9 A |
|
Iron (ppm) |
94.8 A |
77.8 AB |
72.9 B |
83.6 AB |
80.4 AB |
73.8 B |
84.4 AB |
|
Manganese (ppm) |
239.6 A |
162.5 B |
168.5 B |
257.5 A |
166 B |
135.4 BC |
121.6 BC |
|
Copper (ppm) |
13.8 A |
11.1 B |
9.9 BC |
11.1 B |
11.4 B |
10.4 BC |
8.9 C |
|
Zinc (ppm) |
53.4 A |
48.8 AB |
47.8 AB |
49.4 A |
45.4 AB |
46.9 AB |
41.1 B |
Table 3. Mean macro- and micronutrient tissue levels for container-grown Heavy Metal switchgrass with significant differences across treatments, Cutchogue, NY, 2021. Different letters within each row indicate significant differences between treatments (p < 0.05, Tukey HSD test). Wood denotes the hardwood treatments.
|
|
Wood 20% |
Wood 35% |
Wood 50% |
Control |
Oat 20% |
Oat 35% |
Oat 50% |
|
Magnesium (%) |
0.43 A |
0.38 AB |
0.35 AB |
0.38 AB |
0.32 AB |
0.31 B |
0.29 B |
|
Calcium (%) |
0.28 AB |
0.31 A |
0.3 AB |
0.23 BC |
0.2 C |
0.2 C |
0.19 C |
|
Boron (ppm) |
5.6 A |
5.3 AB |
5 AB |
4.8 AB |
4.6 AB |
4.3 AB |
4.1 B |
|
Manganese (ppm) |
95.5 AB |
74.8 BC |
68.3 C |
100.7 A |
88.5 ABC |
75.5 ABC |
70.9 BC |
|
Copper (ppm) |
5.9 AB |
4 B |
4.4 B |
6 AB |
6.5 A |
7.2 A |
5.9 AB |
Field Trials:
Year 1 – 2019 Field Results
No significant differences were found between treatments for shoot and root dry weights of California privet or Douglas fir samples (data not shown).
Lysimeter samples were collected from late July to late October from the Douglas Fir and California privet production fields. The low-tension, porous cup lysimeters functioned well in the loamy soils of the Douglas Fir production soils, but not in the sandier soils of the California privet production fields. Fewer samples were possibly collected from the privet-field lysimeters because the soil was too free-draining at the 18-inch depth location of the porous cup. Fertilizer practices differed by grower. For the Douglas fir trees, a low rate of slow-release, organic fertilizer (3% N) was applied at a rate of 0.1 oz N per tree three times during the growing season (May, June, and September). For the California privet shrubs, one application of conventional, quick-release fertilizer (16% N) was applied in early July at 500 pounds to the row-acre. Table 1 and 2 list ammonium (NH4+) and nitrate (NO3-) nitrogen levels detected in field lysimeters located at the Douglas fir production fields, Cutchogue, NY and California privet production fields in Riverhead, NY, respectively.
At both grower locations (California privet and Douglas fir production sites), presence of leachate in lysimeters was inconsistent leaving missing data for some treatments and overall, more samples were collected as the Douglas fir trial location (Tables 4 & 5). Nitrogen levels did not reveal a trend across treatments or fertilizer type.
Table 4. Ammonium (NH4+) and nitrate (NO3-) nitrogen levels from California privet production fields during the 2019 growing season, Riverhead, NY; Riverhead sandy loam soil type. Two values for the same day and treatment signifies that both lysimeters had leachate for collection. Values were not averaged to show variability in nitrogen levels.
|
Treatment* |
Date |
NH4+-N (ppm) |
NO3--N (ppm) |
|
Control |
8/29/2019 |
22.09 |
8.27 |
|
10 ton/A |
8/29/2019 |
13.03 |
9.05 |
|
Control |
9/13/2019 |
0.75 |
2.55 |
|
10 ton/A |
9/13/2019 |
0.54 |
2.02 |
|
Control |
10/4/2019 |
2.53 |
30.17 |
|
5 ton/A |
10/4/2019 |
3.04 |
42.47 |
|
10 ton/A |
10/4/2019 |
3.62 |
24.13 |
|
Control |
10/23/2019 |
2.00 |
34.26 |
|
5 ton/A |
10/23/2019 |
1.29 |
51.81 |
|
10 ton/A |
10/23/2019 |
4.43 |
32.81 |
|
10 ton/A |
10/23/2019 |
0.10 |
18.48 |
|
15 ton/A |
10/23/2019 |
3.84 |
29.24 |
|
15 ton/A |
10/23/2019 |
1.17 |
32.39 |
*Denotes rate biochar per acre. Control plots did not have any biochar amendments. All plots were fertilized to the grower standard practices.
Table 5. Ammonium (NH4+) and nitrate (NO3-) nitrogen levels from Douglas fir production fields during the 2019 growing season, Cutchogue, NY; Haven loam soil type.
|
Treatment* |
Date |
NH4+-N (ppm) |
NO3--N (ppm) |
|
Control |
7/23/2019 |
16.64 |
25.96 |
|
Control |
7/23/2019 |
11.42 |
42.16 |
|
5 ton/A |
7/23/2019 |
13.45 |
33.07 |
|
5 ton/A |
7/23/2019 |
18.33 |
18.47 |
|
15 ton/A |
7/23/2019 |
18.87 |
20.39 |
|
Control |
8/13/2019 |
20.37 |
34.75 |
|
5 ton/A |
8/13/2019 |
14.93 |
32.39 |
|
10 ton/A |
8/13/2019 |
15.51 |
31.66 |
|
15 ton/A |
8/13/2019 |
18.52 |
23.68 |
|
Control |
8/22/2019 |
19.31 |
48.71 |
|
5 ton/A |
8/22/2019 |
18.79 |
35.29 |
|
10 ton/A |
8/22/2019 |
16.92 |
34.80 |
|
15 ton/A |
8/22/2019 |
15.72 |
34.47 |
|
Control |
8/23/2019 |
20.23 |
53.90 |
|
5 ton/A |
8/23/2019 |
17.25 |
35.87 |
|
10 ton/A |
8/23/2019 |
21.66 |
33.91 |
|
15 ton/A |
8/23/2019 |
21.85 |
48.68 |
|
15 ton/A |
8/23/2019 |
17.08 |
38.59 |
|
Control |
8/29/2019 |
15.42 |
53.36 |
|
5 ton/A |
8/29/2019 |
17.24 |
49.69 |
|
10 ton/A |
8/29/2019 |
22.66 |
37.68 |
|
15 ton/A |
8/29/2019 |
17.08 |
50.78 |
|
Control |
9/13/2019 |
0.87 |
52.94 |
|
5 ton/A |
9/13/2019 |
3.19 |
32.90 |
|
10 ton/A |
9/13/2019 |
1.30 |
48.67 |
|
10 ton/A |
9/13/2019 |
< 0.10 |
37.29 |
|
15 ton/A |
9/13/2019 |
0.52 |
51.27 |
|
Control |
10/4/2019 |
0.73 |
52.26 |
|
Control |
10/4/2019 |
0.55 |
54.97 |
|
10 ton/A |
10/4/2019 |
1.68 |
37.38 |
|
10 ton/A |
10/4/2019 |
0.41 |
38.78 |
|
10 ton/A |
10/4/2019 |
0.29 |
39.28 |
|
10 ton/A |
10/4/2019 |
0.76 |
54.32 |
|
15 ton/A |
10/4/2019 |
1.43 |
49.41 |
|
15 ton/A |
10/4/2019 |
3.84 |
49.34 |
|
15 ton/A |
10/4/2019 |
0.98 |
39.48 |
* Denotes rate biochar per acre. Control plots did not have any biochar amendments. All plots were fertilized to the grower standard practices.
Year 2 - 2020 Field Results
All plants continued to establish well during the 2020 growing season. There were no observable differences in biotic or abiotic issues. Soil nutrient analyses showed significant differences in mean soil sodium (Na) base saturation levels in the Douglas fir trial only with the control differing significantly from the 5, 10, and 15 tons/A treatments (p<0.05). Mean soil Na base saturation for control plots was 1.08%, with the biochar treatments having sodium base saturation levels at 0.88, 0.93, and 0.88 percent for the 5, 10, and 15 tons/A treatments, respectively.
Similar to the 2019 growing season, most soil water leachate samples were collected from the Douglas Fir production field location, but samples were collected from all trial locations (Tables 6-8). Ammonium nitrogen levels are not reported because all samples tested less than 0.50 ppm.
Table 6. Soil water leachate nitrate nitrogen levels from California privet production fields during the 2020 growing season, Riverhead, NY; Riverhead sandy loam soil type. Two values for the same day and treatment signifies that both lysimeters had leachate for collection. Values were not averaged to show variability in nitrogen levels.
|
Treatment* |
Date |
NO3--N (ppm) |
|
5 ton/A |
9/3/2020 |
58.04 |
|
10 ton/A |
9/3/2020 |
108.56 |
|
10 ton/A |
9/3/2020 |
3.81 |
|
15 ton/A |
9/3/2020 |
22.35 |
|
5 ton/A |
9/11/2020 |
14.65 |
|
10 ton/A |
9/11/2020 |
75.53 |
|
Control |
10/14/2020 |
31.66 |
|
Control |
10/14/2020 |
95.41 |
|
5 ton/A |
10/14/2020 |
93.01 |
|
5 ton/A |
10/14/2020 |
38.65 |
|
5 ton/A |
10/14/2020 |
12.36 |
|
10 ton/A |
10/14/2020 |
30.93 |
|
10 ton/A |
10/14/2020 |
35.15 |
|
15 ton/A |
10/14/2020 |
29.72 |
|
15 ton/A |
10/14/2020 |
51.65 |
|
5 ton/A |
10/22/2020 |
129.17 |
|
5 ton/A |
10/22/2020 |
63.08 |
|
10 ton/A |
10/22/2020 |
37.23 |
|
15 ton/A |
10/22/2020 |
148.28 |
*Denotes rate biochar per acre. Control plots did not have any biochar amendments. All plots were fertilized to the grower standard practices.
Table 7. Soil water nitrate nitrogen levels from Douglas fir production fields during the 2020 growing season, Cutchogue, NY; Haven loam soil type. Two values for the same day and treatment signifies that both lysimeters had leachate for collection. Values were not averaged to show variability in nitrogen levels.
|
Treatment* |
Date |
NO3--N (ppm) |
|
Control |
5/7/2020 |
10.20 |
|
Control |
5/7/2020 |
13.95 |
|
10 ton/A |
5/7/2020 |
8.65 |
|
10 ton/A |
5/7/2020 |
13.30 |
|
15 ton/A |
5/7/2020 |
12.37 |
|
Control |
6/2/2020 |
11.02 |
|
10 ton/A |
6/2/2020 |
10.98 |
|
10 ton/A |
6/2/2020 |
13.52 |
|
15 ton/A |
6/2/2020 |
12.03 |
|
Control |
6/12/2020 |
11.10 |
|
10 ton/A |
6/12/2020 |
12.24 |
|
10 ton/A |
6/12/2020 |
14.52 |
|
15 ton/A |
6/12/2020 |
13.50 |
|
Control |
7/8/2020 |
14.74 |
|
10 ton/A |
7/8/2020 |
14.58 |
|
10 ton/A |
7/8/2020 |
18.28 |
|
15 ton/A |
7/8/2020 |
18.63 |
|
15 ton/A |
7/8/2020 |
11.37 |
|
Control |
7/13/2020 |
15.68 |
|
10 ton/A |
7/13/2020 |
19.09 |
|
15 ton/A |
7/13/2020 |
20.27 |
|
Control |
8/20/2020 |
17.37 |
|
10 ton/A |
8/20/2020 |
23.81 |
|
15 ton/A |
8/20/2020 |
27.19 |
|
Control |
9/3/2020 |
16.22 |
|
5 ton/A |
9/3/2020 |
21.84 |
|
5 ton/A |
9/3/2020 |
15.48 |
|
10 ton/A |
9/3/2020 |
21.97 |
|
10 ton/A |
9/3/2020 |
29.54 |
|
15 ton/A |
9/3/2020 |
31.93 |
|
15 ton/A |
9/3/2020 |
18.16 |
|
Control |
9/11/2020 |
18.28 |
|
15 ton/A |
9/11/2020 |
28.33 |
*Denotes rate biochar per acre. Control plots did not have any biochar amendments. All plots were fertilized to the grower standard practices.
Table 8. Soil water leachate nitrate nitrogen levels from California privet production fields during fall 2020, Baiting Hollow, NY; Riverhead sandy loam soil type. Two values for the same day and treatment signifies that both lysimeters had leachate for collection. Values were not averaged to show variability in nitrogen levels.
|
Treatment* |
Date |
NO3--N (ppm) |
|
Control |
10/14/2020 |
3.49 |
|
Control |
10/14/2020 |
7.51 |
|
5 ton/A |
10/14/2020 |
3.43 |
|
5 ton/A |
10/14/2020 |
4.36 |
|
10 ton/A |
10/14/2020 |
7.73 |
|
10 ton/A |
10/14/2020 |
5.6 |
|
15 ton/A |
10/14/2020 |
4.36 |
|
15 ton/A |
10/14/2020 |
4.24 |
|
Control |
10/22/2020 |
3.52 |
|
Control |
10/22/2020 |
3.24 |
|
5 ton/A |
10/22/2020 |
3.21 |
|
10 ton/A |
10/22/2020 |
6.35 |
|
10 ton/A |
10/22/2020 |
5.29 |
|
15 ton/A |
10/22/2020 |
4.22 |
|
15 ton/A |
10/22/2020 |
7.9 |
|
Control |
11/11/2020 |
1.07 |
|
Control |
11/11/2020 |
10.61 |
|
5 ton/A |
11/11/2020 |
6.38 |
|
10 ton/A |
11/11/2020 |
4.56 |
|
15 ton/A |
11/11/2020 |
8.22 |
|
Control |
11/13/2020 |
10.42 |
|
Control |
11/13/2020 |
11.77 |
|
5 ton/A |
11/13/2020 |
5.03 |
|
10 ton/A |
11/13/2020 |
9.55 |
|
10 ton/A |
11/13/2020 |
15.27 |
|
15 ton/A |
11/13/2020 |
3.51 |
|
15 ton/A |
11/13/2020 |
7.1 |
*Denotes rate biochar per acre. Control plots did not have any biochar amendments. All plots were fertilized to the grower standard practices.
Percent soil moisture, measured by Acclima TDR-310W probes installed at 4- and 10-inch depths, was recorded throughout the growing season at the Douglas fir production field in and the California privet field located in Riverhead, NY (Figures 2 & 3). Averaged across the entire growing seasons, differences were observed between treatments on soil moisture (%) at both sites. In the Douglas fir field, the 5 ton/A and 10 ton/A biochar treatments had lower soil moisture than the control and 15 ton/A treatments (p<0.05). No differences were observed between the 5 ton/A and 10 ton/A biochar treatments or the control and 15 ton/A treatments. At the California privet field, differences were more apparent at the 10-inch depth than the 4-inch depth. The 5 ton/A biochar treatment had lower soil moisture compared to all other treatments. The 10 ton/A treatment was also lower than the 15 ton/A and control treatments across the season. No differences were found between the 15 ton/A and control treatments on soil moisture at this field site.
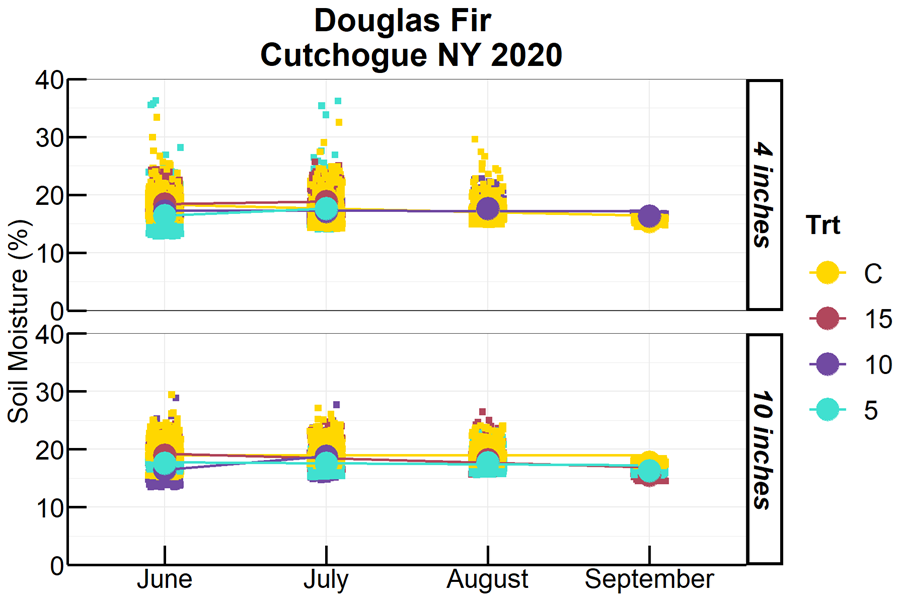
Figure 2. Average soil moisture (%) for four months by treatment (5 ton/A, 10 ton/A, 15 ton/A, control) and for two depths (4- and 10- inches) in 2020, Cutchogue, NY. Data for the control and 15 ton/A treatments were missing for the 4-inch depth in August and September.
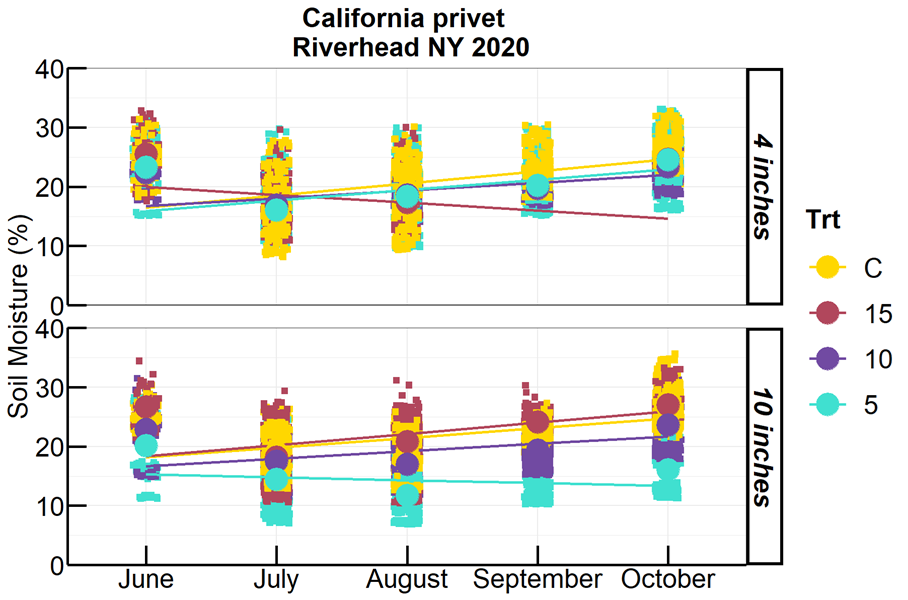
Figure 3. Average soil moisture (%) for four months by treatment (5 ton/A, 10 ton/A, 15 ton/A, control) and for two depths (4- and 10- inches) in 2020, Riverhead, NY.
While the probes were installed during the 2020 season at the California privet field located in Baiting Hollow, NY the treatment plots could not be installed until October 2020 because of management issues at that site.
Year 3 - 2021 Field Results
No significant differences were found between treatments on soil health indicators as determined by the CASH test at the conclusion of the study. Soil Labile Amino Nitrogen (SLAN) and CO2 burst respiration level were found to be different at one farm. The biochar 15 ton/A treatment was found to result in greater CO2 respiration than the biochar 10 ton/A treatment, but no other differences were found (p<0.05). The biochar 5 ton/A and control treatments had greater levels of organic soil nitrogen as determined by the SLAN test than the biochar 15 ton/A treatment. No other differences were found. These results support no clear pattern of biochar’s impact on soil properties at the trial locations.
No differences were found between treatments on the number of leader buds and height, or tree height, for the Douglas fir trees.
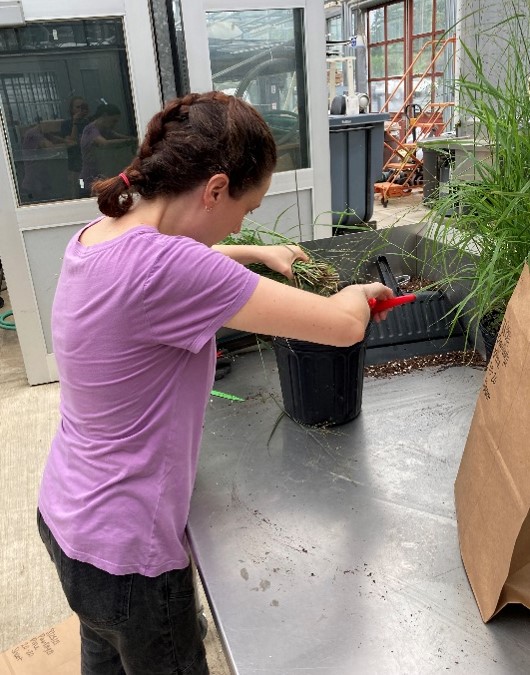
Image: Mina Vescera collecting the shoots of a switchgrass plant before drying.
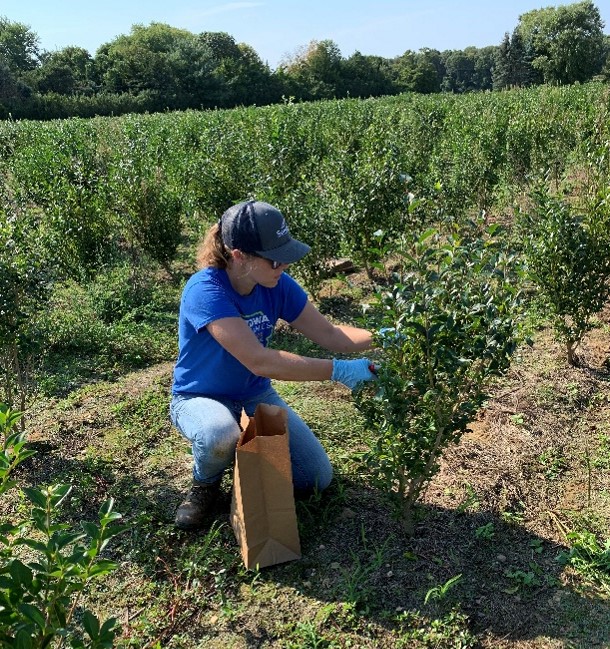
Image: Deborah Aller collecting final leaf samples from a California privet plant.
Shoot biomass was collected from the Riverhead and Baiting Hollow California privet field production locations in September 2021. Root samples were not collected because the root biomass was too challenging to collect consistently after year 1 of the trial. Shoot samples were oven dried for seven days at 100 °C and then weighed. Fifteen samples were collected from each treatment (3 per replicate). Shoot dry weights differed significantly among treatments at the Riverhead California privet location (p = 0.0026). The control treatment had significantly lower shoot biomass than the 5 and 15 ton/A acre treatments, but no differences were found for the 10 ton/A acre treatment (Figure 4). No differences in shoot dry weight at the Baiting Hollow location were found.
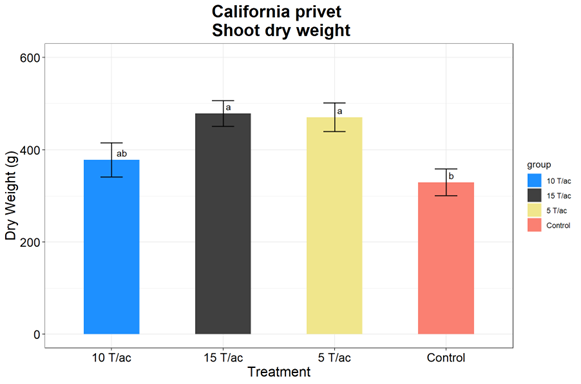
Figure 4. Mean dry weights of field-grown California privet shoots collected in September 2021, Riverhead, NY. Different letters indicate significant differences between treatments (p < 0.05, Tukey HSD test).
No significant differences in foliar nutrient tissue levels across treatments at either California privet field location were found. Tissue samples were not collected from the Douglas fir trees since they were too small to handle replicated sample collection.
Lysimeter Data 2021
Soil water leachate collections continued during the final year of the project. Three locations were monitored: Douglas fir Christmas tree production field in Cutchogue, NY and California privet production fields in Riverhead and Baiting Hollow, NY (Tables 9-11). As in 2020, ammonium nitrogen levels are not reported because all samples tested less than 0.50 ppm. For all tables, treatment denotes rate of biochar per acre. Control plots did not have any biochar amendments.
Table 9. Soil water leachate nitrate nitrogen (NO3- -N) levels from California privet production fields during the 2021 growing season, Riverhead, NY. Two values for the same day and treatment signifies that both lysimeters had leachate for collection. Values were not averaged to show variability in nitrogen levels.
|
Treatment |
Date |
NO3--N (ppm) |
|
Control |
6/2/2021 |
20.72 |
|
10 ton/A |
6/2/2021 |
6.6 |
|
10 ton/A |
6/2/2021 |
43.65 |
|
10 ton/A |
6/4/2021 |
9.05 |
|
10 ton/A |
6/4/2021 |
56.08 |
|
Control |
9/2/2021 |
75.92 |
|
Control |
9/2/2021 |
26.64 |
|
5 ton/A |
9/2/2021 |
42.52 |
|
5 ton/A |
9/2/2021 |
3.75 |
|
10 ton/A |
9/2/2021 |
3.96 |
|
15 ton/A |
9/2/2021 |
6.34 |
|
15 ton/A |
9/2/2021 |
4.19 |
|
Control |
9/10/2021 |
14.69 |
|
Control |
9/10/2021 |
80.47 |
|
5 ton/A |
9/10/2021 |
36.83 |
|
5 ton/A |
9/10/2021 |
0.46 |
|
10 ton/A |
9/10/2021 |
< 0.10 |
|
10 ton/A |
9/10/2021 |
1.46 |
|
15 ton/A |
9/10/2021 |
0.61 |
Table 10. Soil water leachate nitrate nitrogen (NO3- -N) levels from Douglas fir production fields during summer 2021, Cutchogue, NY. Two values for the same day and treatment signifies that both lysimeters had leachate for collection. Values were not averaged to show variability in nitrogen levels.
|
Treatment |
Date |
NO3--N (ppm) |
|
Control |
6/21/2021 |
37.32 |
|
5 ton/A |
6/21/2021 |
31.06 |
|
5 ton/A |
6/21/2021 |
37.94 |
|
10 ton/A |
6/21/2021 |
31.87 |
|
10 ton/A |
6/21/2021 |
0.97 |
|
15 ton/A |
6/21/2021 |
25.10 |
|
Control |
6/23/2021 |
28.50 |
|
Control |
6/23/2021 |
37.04 |
|
5 ton/A |
6/23/2021 |
30.58 |
|
5 ton/A |
6/23/2021 |
34.71 |
|
10 ton/A |
6/23/2021 |
31.46 |
|
10 ton/A |
6/23/2021 |
1.97 |
|
15 ton/A |
6/23/2021 |
17.47 |
|
Control |
7/12/2021 |
36.17 |
|
Control |
7/12/2021 |
74.67 |
|
5 ton/A |
7/12/2021 |
29.65 |
|
10 ton/A |
7/12/2021 |
34.20 |
|
10 ton/A |
7/12/2021 |
1.75 |
|
15 ton/A |
7/12/2021 |
28.97 |
|
15 ton/A |
7/12/2021 |
20.91 |
|
Control |
7/30/2021 |
31.29 |
|
Control |
7/30/2021 |
51.63 |
|
5 ton/A |
7/30/2021 |
28.94 |
|
5 ton/A |
7/30/2021 |
24.27 |
|
10 ton/A |
7/30/2021 |
33.27 |
|
10 ton/A |
7/30/2021 |
7.01 |
|
15 ton/A |
7/30/2021 |
31.18 |
|
15 ton/A |
7/30/2021 |
23.21 |
|
Control |
8/24/2021 |
23.64 |
|
Control |
8/24/2021 |
54.08 |
|
5 ton/A |
8/24/2021 |
28.21 |
|
5 ton/A |
8/24/2021 |
21.83 |
|
10 ton/A |
8/24/2021 |
29.87 |
|
10 ton/A |
8/24/2021 |
16.15 |
|
15 ton/A |
8/24/2021 |
28.95 |
|
Control |
9/2/2021 |
19.35 |
|
5 ton/A |
9/2/2021 |
29.75 |
|
5 ton/A |
9/2/2021 |
25.82 |
|
10 ton/A |
9/2/2021 |
31.68 |
|
10 ton/A |
9/2/2021 |
23.64 |
Table 11. Soil water leachate nitrate nitrogen (NO3- -N) levels from California privet production fields during the 2021 growing season, Baiting Hollow, NY. Two values for the same day and treatment signifies that both lysimeters had leachate for collection. Values were not averaged to show variability in nitrogen levels.
|
Treatment |
Date |
NO3--N (ppm) |
|
Control |
6/1/2021 |
0.44 |
|
Control |
6/1/2021 |
5.52 |
|
5 ton/A |
6/1/2021 |
4.84 |
|
10 ton/A |
6/1/2021 |
2.45 |
|
15 ton/A |
6/1/2021 |
2.03 |
|
Control |
9/2/2021 |
2.66 |
|
5 ton/A |
9/2/2021 |
< 0.10 |
|
5 ton/A |
9/2/2021 |
< 0.10 |
|
10 ton/A |
9/2/2021 |
< 0.10 |
|
10 ton/A |
9/2/2021 |
0.24 |
|
15 ton/A |
9/2/2021 |
< 0.10 |
|
15 ton/A |
9/2/2021 |
0.42 |
|
Control |
9/10/2021 |
< 0.10 |
|
Control |
9/10/2021 |
< 0.10 |
|
5 ton/A |
9/10/2021 |
< 0.10 |
|
5 ton/A |
9/10/2021 |
< 0.10 |
|
10 ton/A |
9/10/2021 |
0.4 |
|
15 ton/A |
9/10/2021 |
< 0.10 |
|
15 ton/A |
9/10/2021 |
< 0.10 |
Soil moisture continued to be measured during the 2021 growing season. Unfortunately, due to issues with the sensors no data was recorded at the Douglas Fir field location. At the California Privet Field in Baiting Hollow the 10 ton/A biochar treatment had lower soil moisture compared to the control and 5 ton/A biochar treatments at the 10-inch depth (Figure 5). No differences were found between the 5 ton/A and control treatments across the season. The sensors in the 15 ton/A treatment at the 10-inch depth stopped working after the June data collection.
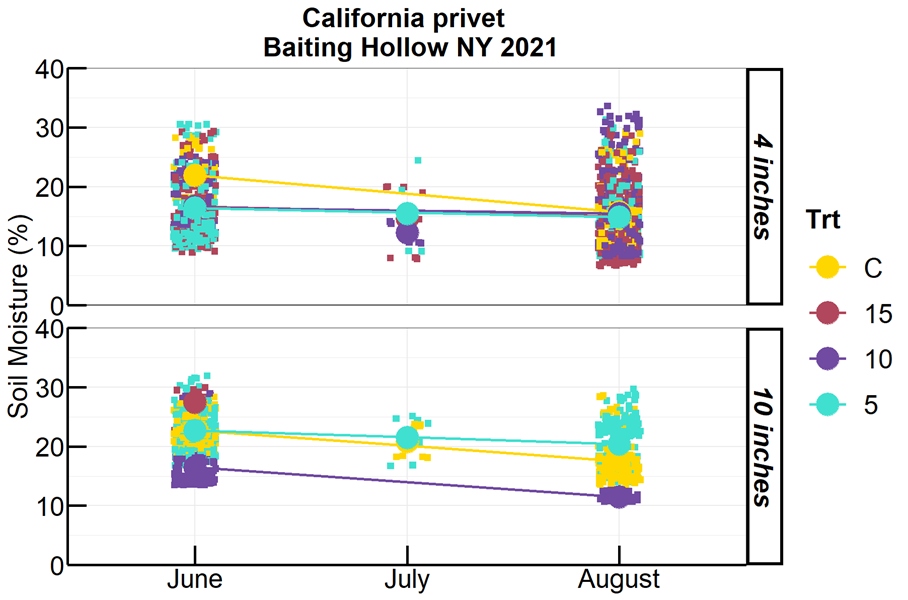
Figure 5. Average soil moisture (%) for four months by treatment (5 ton/A, 10 ton/A, 15 ton/A, control) and for two depths (4- and 10- inches) in 2021, Baiting Hollow, NY. Data is missing for the 15 ton/A treatment at the 10-inch depth
Soil moisture also differed between several of the treatments at the Riverhead California privet location. At the 4-inch depth differences were found between all treatments except the 5 and 15 ton/A biochar treatments. No differences were observed at the 10-inch depth (Figure 6).
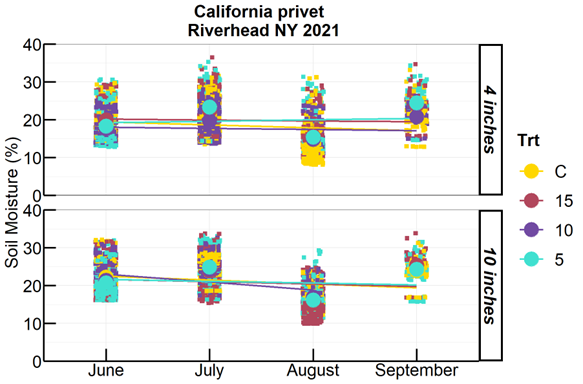
Figure 6. Average soil moisture (%) for four months by treatment (5 ton/A, 10 ton/A, 15 ton/A, control) and for two depths (4- and 10- inches) in 2021, Riverhead, NY. Data is missing for the 10 ton/A treatment at the 10-inch depth in the month of September.
Soil water potential data from TEROS 21 sensors installed at 4-inch depth is available upon request.
Results of this study demonstrated that a hardwood biochar applied to both container and field-grown ornamental plants had a variable impact on water retention and nutrient leaching. No consistent positive impacts were observed with increasing biochar application rate in any of the trials. Field heterogeneity likely contributed to differences observed in the field trials rather than a treatment effect. No clear impact of biochar on soil properties at the trial locations was found. Greater nutrient levels and aboveground (shoot) biomass were observed with biochar additions, but again significant variability was observed, and the effect was not consistent each year. Lastly, few differences and no consistent trends were observed between treatments on nutrient leachate levels in the container grown plants.
While there is potential for biochar to improve soil properties, as found in numerous studies, and provide carbon sequestration benefits, due to the variable impacts of biochar in this study no application rate recommendations for biochar use in ornamental production can be provided. However, we emphasize the need for biochar to be inoculated with compost tea or some other nutrient rich material before application and support that biochar applied in the field not simply be applied to the surface and lightly incorporated but incorporated deeper into the soil profile to prevent transport off the field by wind or water.
Education & outreach activities and participation summary
Educational activities:
Participation summary:
2019 Activities - year 1
An article providing an overview and explanation of the project was published in our local monthly agricultural extension publication (Ag News). This publication is mailed to approximately 325 growers monthly. The article is entitled "New study will look at biochar impacts on water and nutrient retention in nursery production."
Ag News article April 2019
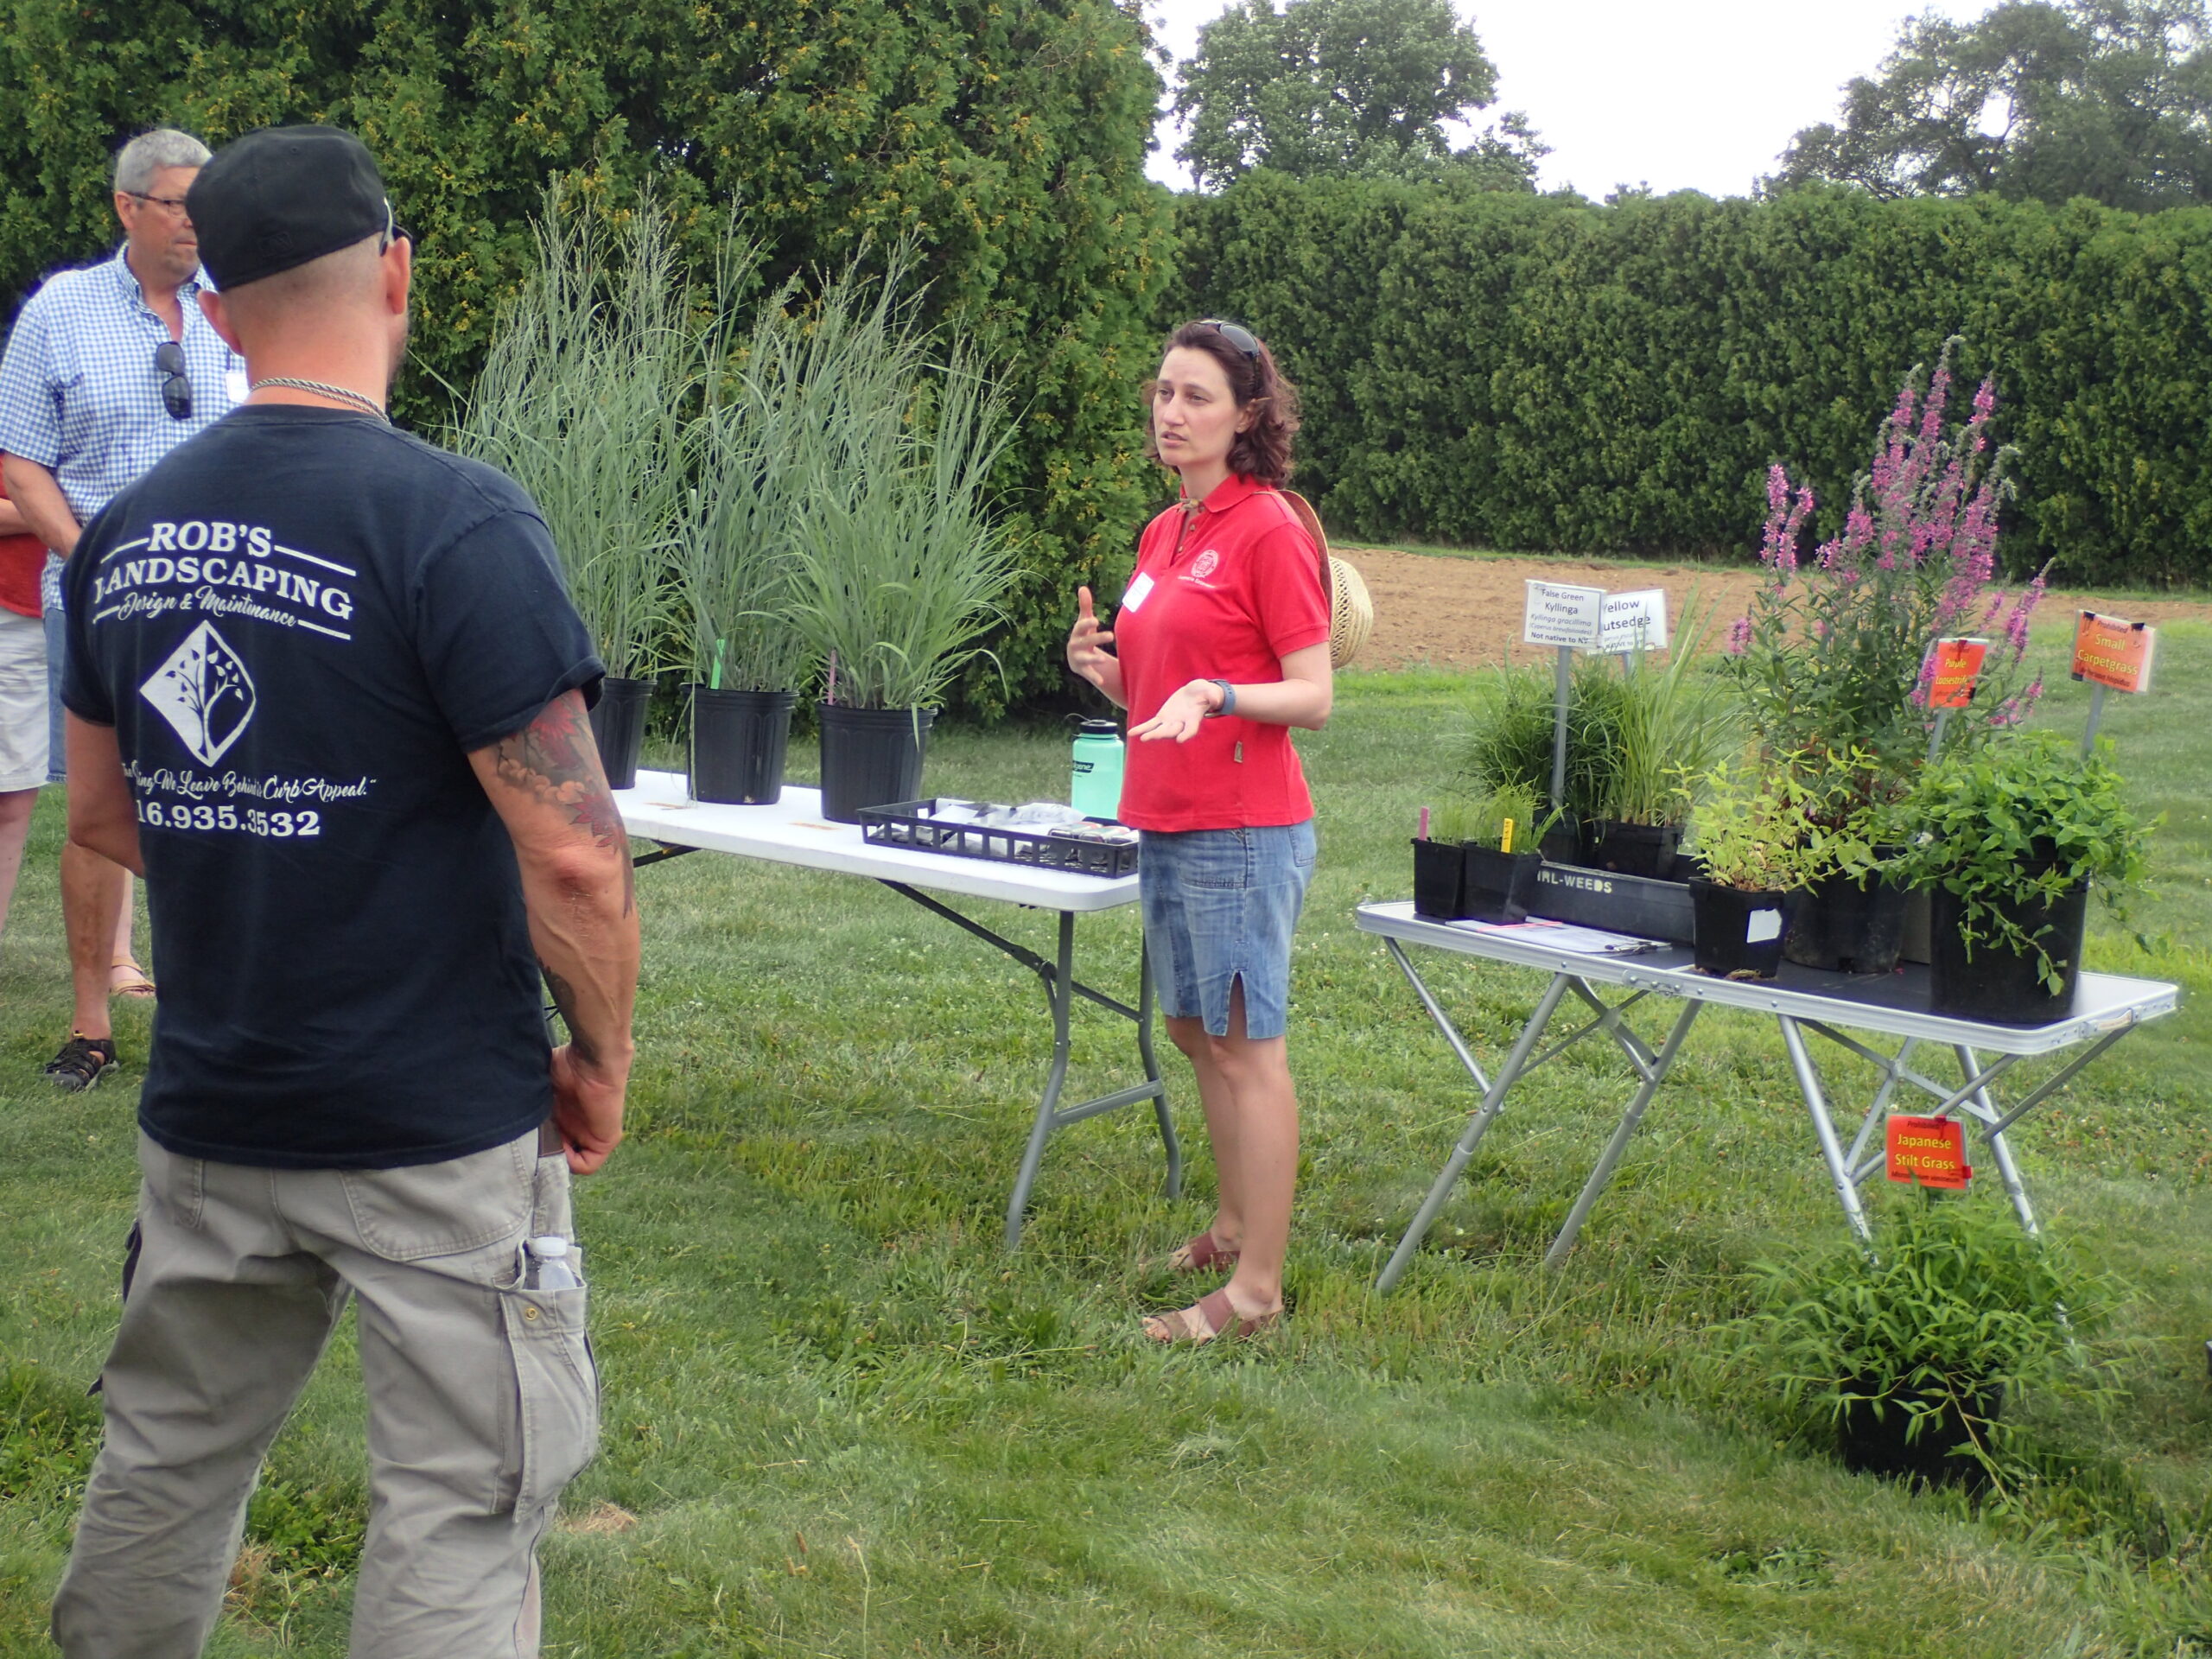
An overview of the project including a discussion about biochar and soil moisture sensors was given to nursery growers attending Cornell University's annual Plant Science Day at LIHREC in July 2019.
Mina Vescera attended the Northeast Specialty Crop Water Symposium in December 2019 at the University of Vermont where she presented an overview of biochar and the field trials associated with this project. Talk titled "Evaluating wood-based biochar in field production of woody ornamentals in Long Island nurseries".
2020 Activities - year 2
An article providing an update on the field portion of this trial was published in February 2020 in Ag News. The article is entitled "Evaluating Biochar in Field Production of Ornamental Woody Plants". Ag News Article February 2020
In March 2020, Deborah Aller gave a presentation on "Soil Science, Water Management & Amendments" for the Long Island Arboricultural Association. She discussed biochar and the ongoing research associated with this project for improving tree and plant health in the landscape.
In lieu of an in-person field day due to the pandemic a four part biochar webinar series was held in November 2020 (Biochar2020 webinar flyer). Biochar basics, the science behind biochar, ornamental nursery applications of biochar, and landscape applications of biochar were discussed by 12 experts from across the United States. We were able to reach over 600 individuals through these virtual events. All the recordings are available for viewing on the New York Soil Health website (Biochar Webinar Series-recordings NY Soil Health Initiative) or this link: https://blogs.cornell.edu/soilhealthinitiative/2020/12/04/biochar-webinar-series-recordings-now-available/#.YACa-OhKg2w
Also, in November 2020 Deborah Aller gave a (virtual) presentation on the 'Potential of Biochar for Use in Nursery Crop Production' at the ASA-CSSA-SSSA International Annual Meeting.
An article providing an update on the container portion of this trial was published in December 2020 in Ag News. The article is entitled "Project Update! Evaluating Biochar for Use in Container Production". Ag News Article Dec2020
2021 - year 3
In 2021, Deborah Aller discussed biochar and shared the current findings of the study at various meetings and workshops including a University of New Hampshire Extension Plant Production Lunch and Learn Series, Stony Brook University Seminar, and the New York Soil Health Specialist Training Workshop series.
Unfortunately, due to uncertainly around the ongoing pandemic no in-person field day was held in 2021.
Learning Outcomes
Conversations with farmers and educators revealed that some of most impactful contributions from this project were increasing awareness of what biochar is, its benefits, where to purchase it (e.g., suppliers), and its practical applications (e.g., pre-treatment needs, and methods and rates of application).
Further, in 2018, biochar was not available in local retail garden and agriculture supply centers on Long Island. By 2021, all the primary agriculture and horticultural distributors had at least one type of biochar product available for sale.
The Covid-19 pandemic greatly limited our outreach potential for in-person contact, but we offered a 4-part biochar webinar series that was very successful and reached an international audience. Although we are unable to quantify the changes that resulted from this programming, as of October 2022, total viewings for the entire series were nearly 80,000. The entire playlist can be viewed here: https://www.youtube.com/playlist?list=PL-PQtqYZwdtBu1977PC7QBJi-TnhiQMA6.
Project Outcomes
A nursery/landscape/golf course manager from western Long Island is now aware of biochar and its potential benefits and plans to incorporate it into his managed landscapes in the future.
Five vegetable farmers are interested in using biochar on their farms. Also, a local vineyard is interested in producing biochar from vine trimmings and applying it back to the crop.
Interest in using biochar on farms continues to increase both on Long Island and beyond. Farmers frequently inquiry about the benefits of biochar and possible use on their own farm.