Final report for LNE21-416
Project Information
Problem and Justification: With the passage of the 2018 Farm Bill, hemp production was legalized creating the opportunity to grow a new crop with the potential to diversify farm income in the Northeast. Since hemp was illegal for eight decades in the US, growers have limited locally-based research information to draw from to guide production. Contrary to popular opinion, hemp is a challenging crop to grow well in our humid climate. With little growing experience and limited research-based fertility and pest management information, hemp farmers and agricultural service providers need information and training on how to grow this crop sustainably. Growers frequently talk about their “hemp field” as if they have no intention of rotation, and that hemp has few pests and needs little fertility. This perception must be changed to produce hemp sustainably. Research was developed to evaluate the benefit and challenges of adding hemp into the rotation and to also develop effective levels of nitrogen (N) to sustain yield and quality, and not harm the environment. Our goal was to also involve 100 northeast industrial hemp growers in an intensive 15-hour training program in the winter of 2022 and 2023 and document producers’ improved understanding of the crop’s: 1) legal requirements; 2) unique biology and therapeutic benefits; 3) complicated pest and fertility management; and 4) harvest and post-harvest handling.
Over the course of this project, the number of hemp growers greatly declined within the three-year period. In 2023 anticipated class and event attendance dropped significantly in conjunction with market trends and associated transitions to state recreational grower’s licenses. At its peak, Vermont had 985 registered growers within the state for the 2019 growing season. In Vermont, 336 growers were registered in 2021, 89 in 2022, and only 33 in 2023. Maine saw similar trends with peak licenses issued in 2019 at 191 registered growers declining over the four year period. The overall number steeply declined over the period of this grant with only 49 registered growers in 2021, 17 growers in 2022, and ending with 9 registered growers in 2023. A combination of factors leading to these declines included the sudden influx of hemp growers after the passing of the 2018 farm bill which ultimately flooded the market, reducing the value of flower crops significantly. Furthermore, state adoption of recreational markets and transitions to federally regulated hemp programs in both Maine and Vermont lead to significant loss of interest for hemp cultivation as a primary business model. Comparatively, each state saw greater numbers of registered growers for the adult use cannabis market with 140 cultivation licenses in Maine and 119 licenses in Vermont. Despite these challenges for growers, we were able to complete a wide array of additional outreach education events which reached the growers and technical service providers within our region.
Through the project research, our team identified that floral hemp responds very differently to N fertilizer compared to grain hemp varieties. Grain hemp research has shown that the majority of N uptake occurs during the first month of vegetative growth. Similarly, this is also a critical growth period for floral hemp as well. However, as much as 200 lbs/ac are needed to meet the crop needs of grain hemp, where our data suggest that 100 lbs N/ac should be sufficient for floral hemp. Possibly even lower rates of N could be needed but dependent on soil conditions. Hemp plants grown within soils with higher concentrations of organic matter may also be capable of effectively scavenging nitrogen within the soil. Reducing applications to 50-100 lbs N/ac for flower hemp may be more beneficial from a yield and labor standpoint for soils with higher organic matter. Conversely, low organic matter soils may require higher concentrations of nitrogen to provide adequate flower yield. This is where an in-season test for N would help farmers fine-tune rates.
Unfortunately, the N testing methods that we tried to develop were not reliable. The early testing method, conducted at approximately one-month post-transplant where additional N could be applied if it were needed, was found to not separate responsive and non-responsive hemp. The later testing protocols were a bit more robust but floral cannabis does not need N at flowering, too much late season N can hurt production. Simply sampling the fourth most recently fully matured fan leaf from the top of the plant, as described by Cochrane et al. (2019) seemed to be as useful of a method to assess N status as anything developed here. Further, we were unable to have our chlorophyll evaluation work on just one variety, let alone multiple varieties which were shown in previous work to have different depth of green supplied with a similar amount of N.
The three-year rotation studies also provided critical information for hemp growers. We hypothesized that more years between hemp would increase production, improve soil health, and create a healthier growing condition. We showed that growing three years of hemp leads to significantly higher incidence and severity of the disease Septoria spp. and other leaf spots. We also hypothesized that three years of widely spaced hemp would have affected weed levels, but that was also not the case. Hemp yield and quality were not greatly affected by three consecutive years of the crop despite increased levels of leaf spot on hemp grown in three successive years. Additionally, we found no difference in soil health after growing hemp for as much as three years compared to growing hemp in only one or two years out of three. Each of our locations scored high in terms of overall soil health from the onset of this study and lower initial soil health scores may result in more noticeable impacts during a three-year rotation depending on growing conditions and other soil management practices. Longer term studies are necessary to identify benefits and challenges of any crop rotation.
Through this project’s efforts research and education was delivered to over 500 stakeholders through outreach events including online courses, webinars, on-farm field days and conferences. Our key education effort for this grant was the online farmer class which involved a 5-week course open to all growers and technical service providers, taking place in 2022 and 2023. This course titles “Hemp Production: Science and Uses” provided detailed information on the history of hemp production in the U.S., plant physiology, hemp agronomics, legal considerations, and human interactions. There were 35 attendees over the two-year period the course was offered. Attendees indicated a strong increase in knowledge across a wide variety of topics including marketing, regulations, soils, pests, agronomy, and post-harvest handling.
At other events, attendees were provided with an overview of research results from the trials conducted within this scope of work with additional one-on-one interactions at every event. Ninety-four project participants completed an end of project survey. The results indicate that 79 farmers and 35 service providers reported changes in knowledge, attitudes, skills and/or awareness as a result of their participation in our project. There were 66 farmers growing on 180 acres that made changes to nitrogen fertilization on their hemp crop (primarily reductions in N inputs) and/or improved rotation to minimize disease pressure.
Of the 100 farmers attending the 15-hour intensive training program, 80 will document improved confidence in hemp production, 50 will report improved rotations, reduced production costs, and/or improved hemp yields of 200 lbs per acre on 50 acres.
Resinous hemp production was new to most of the Northeast with true legalization initiated with the Farm Bill in 2018. The industry grew rapidly with many people entering the field with little knowledge of farming or this plant. With 80 years of prohibition, we had no valid fertility recommendations, and very few solid agronomic principles to advise growers. We needed N response data to guide fertility recommendations, and information on how crop rotation would affect insect and disease management. Through our educational program, we developed a five module, 15-hour educational program to give growers the basics on hemp production, harvest, processing and marketing. Data from our research trials was used to inform our training materials.
Cooperators
- (Educator and Researcher)
Research
The need for crop rotation research comes directly from farmers experiencing significant disease issues and yield depression because of the lack of using crop rotation. The impact of successive years of hemp production on yield/quality and pest management is really poorly understood. What crop types (legume, grass, etc) in rotation with hemp will result in highest yields and lowest pest pressure? The second research question was driven by farmers who wanted to know what is the impact of nitrogen (N) on yield and pest management and how can they know the crop has sufficient N. Can a SPAD chlorophyll quick-test improve N management?
Research Design
Hemp Rotation Trial
Crop rotation is a fundamental practice to improve yields and reduce pest incidence in crop production. Yet, many of our growers have small land holdings and practice no or limited rotation. Growers need to see how hemp yield and quality, pest pressure, and soil health are impacted by successive years of hemp production.
In the research component of the NE-SARE Research and Education funded project, we grew hemp for one, two or three years to monitor yield and quality, as well as changes in weed, disease, and insect pressure each year. Trials were conducted at two distinct locations in the Northeast: University of Vermont’s research farm in Alburgh, VT (UVM-A), and University of Maine’s research farm (Roger’s Farm) in Stillwater Maine (UM-RF) Rotation crops have included sweet corn and beans (string beans at UVM-A and fava beans at UM-RF). Hemp was transplanted into a three-treatment replicated complete block field trial in both Vermont and Maine. Hemp was grown consecutively for three years (3-years) for the no-rotation treatment. For the single year rotation (2-years), hemp was grown in year 1 and year 3 with sweet corn as the rotation crop in year 2. For the two-year rotation (1-year), beans were produced the 2021 season, sweet corn in the 2022 season, and hemp in the 2023 year. Each hemp plot had 15 plants per plot (5 plants per row) planted on 6 ft x 6 ft spacing, and the three plants of the center row were harvested for yield and cannabinoid content. Whole plant biomass was measured in the field, one plant chipped for moisture content, and the other two were hung to dry. Plants were separated into stems, leaves, and flowers, weighed, and flowers were analyzed for cannabinoid content. Before planting in year one (2021), soil samples were collected from each plot and sent to the Cornell Soil Health Laboratory in Ithaca, NY for the standard soil quality analysis. Soils were assessed for a variety of physical, biological, and chemical soil health indicators. Procedures outlined by the lab (https://soilhealth.cals.cornell.edu/). The soils were sampled in September of the third year to assess changes by plot.
In 2023, the hemp was transplanted into the study area and was assessed for weed, insect, and disease incidence severity at one month, two months, and three months post-transplant at each location. Particularly, we were interested in understanding if there would be an increase in diseases like white mold, powdery mildew and hemp leaf spots (septoria, bipolaris, cercospora) over time as affected by rotation. At each sampling period, we collected two leaves from three parts of the plant: the bottom, middle and top of the plant randomly and assessed those for incidence and severity of disease symptoms. From each leaf, disease presence was indicated and rated on a scale of 0-100% of leaf surface affected for leaf spots and powdery mildew. Similarly an incidence and severity rating was recorded for white mold and gray mold indicating the total number of infection sites on each plant. Weed biomass was collected at flower initiation. One .25m2 quadrat was collected from undisturbed weed growth within each plot during flower initiation and biomass data was collected. Additionally, weed species were sorted and weight by weed type (i.e. annual and perennial broadleaf or grass). Disease and insect incidence and severity measurements were collected and subjected to analysis of variance with appropriate mean separation techniques.
Hemp harvest required collecting the middle three plants from each plot for yield assessment. For each plant harvested, the whole plant weight was recorded. The largest of the three plants was cut at the plant base approximately 10 cm above the ground surface with loppers, and the plant was weighed and run through a chipper shredder to determine whole plant dry matter and total N content. The other two plants were harvested the following day, weighed and one plant in Maine and both plants in Vermont were separated into individual branches and stripped of its fan leaves. Flowers were separated from individual branches using an MB1 Munch Machine bucker in Maine and a BuckmasterPro bucker in Vermont. In Vermont bucked flower was then fed through the CenturionPro Gladiator Trimmer. Wet bud weight and unmarketable bud weight were recorded. Stems were also collected and weighed. Flower dry matter content was assessed by collecting a flower subsample and drying the flower sample overnight in a small dehydrator. In Maine, samples of the dehydrated flower were submitted for cannabidiol (CBD) and tetrahydrocannabinol (THC) and total cannabinoid content at Nova Analytics in Portland; samples in Vermont were analyzed in house at the E.E. Cummings Crop Testing Laboratory. The percent moisture at harvest was used to calculate total dry matter and flower dry matter yields. The whole plant total N was analyzed at the respective university labs.
Sweet corn and bean yields were assessed by harvesting bean pods and ears of the corn. Each hemp plot had 15 plants per plot (5 plants per row) planted on 6 ft x 6 ft spacing, and the three plants of the center row were harvested for yield and cannabinoid (CBD) content. In 2023, the entire field was planted to hemp, and five plants per plot were harvested and weighed. The three center row plants were used for total yield, with one chipped to assess total plant dry matter, and two center plants were separated into stems, leaves, and flowers, weighed, and flowers were analyzed for cannabinoid content.
Nitrogen (N) Rate Trials
The goal of the second field research project was to assess whether the recommendation of 150 lbs N ac-1 yr-1 was an optimal rate of N to apply for flowering hemp. We also sought to develop a chlorophyll SPAD meter test to assess sufficiency of N management. Recommended N application rate for hemp has been 150 lbs N/ac from the UM Soil Testing Lab when this project began, most often supplied at planting or through irrigation. This rate needed to be verified with N response trials. Excessive N fertility could lead to environmental damage, possibly make hemp more attractive to pests, and may increase or decrease CBD or THC content at harvest putting farmers at risk of not meeting standards. An in-field test could help growers know that they had sufficient N particularly after periods of extended rainfall.
Jemison has published a method using SPAD ratios to assess corn N status (Jemison and Lytle, 1996). In that work, the ratio of ear leaf SPAD measurements in the field compared to a high N treatment had to exceed 0.95 to have sufficient N for adequate yield. In 2020, Jemison worked with two growers to collect preliminary data to develop a similar test in hemp. The initial testing was done a month after transplanting; SPAD readings were taken on the fan leaf where the plant’s branching changes from opposite to alternate to see if plants fertilized similarly across varieties had different color values. Different cultivars were found to have different SPAD values with some appearing to be more deeply green than others. But, when we measured the leaf below or two leaves below and took the ratio of two SPAD readings, those ratios were similar in plants fertilized similarly. In August, a second procedure was implemented where fan leaves four branch pairs from the top of the plant and eight branch pairs from the top were sampled. Again, cultivar chlorophyll differences were observed and the ratio of the lower leaves to the upper leaves were above 0.95 and similar across N rates. This work needed to be assessed in replicated plots with varying N rates to determine the optimum time to employ this test with the greatest success. By having replicated rates of N applied to hemp in two locations and three seasons, we were able to assess if N rates have an impact on cannabinoid concentrations as well as pest pressure.
The experimental design used in all six site years was a randomized complete block with four replicates. Nitrogen rates were 0, 50, 100, 150, and 200 lbs of N/ac (applied as ammonium sulfate) and applied to each plot prior to transplanting in early June. Gypsum was applied to balance out the S applied in the ammonium sulfate. Plot size was three rows with five plants per row. At one, two, and three months after transplanting, plant height and number of branch pairs was recorded. At the branch pair where plants’ branching changed from opposite to alternate, plant height, and leaf chlorophyll were measured on the three plants per plot. Ten measurements of leaf chlorophyll were made on the first alternate branch fan leaf and an average taken. The fan leaves at the last opposite branch were measured similarly and a ratio of the lower to the upper calculated and recorded. In August, we conducted a second intensive chlorophyll test evaluation collecting SPAD readings on fan leaves on the fourth fully developed branch pair from the top of the plant, and 4 branch pairs below that. Ratios were calculated. Insect and disease ratings were conducted at each sampling time as described above. Insect and diseases were sampled at flower initiation and just before harvest. The three harvest plants were examined in each replicate, with leaves and flower buds examined. We noted severity of damage to leaf and to stem/flower in the third year to show impacts on pest and disease as a result of rotation effects.
Harvest required collecting the middle three plants from each plot for yield assessment. For each plant harvested, the whole plant weight was recorded. The largest of the three plants was cut at the plant base approximately 10 cm above the ground surface with loppers, and the plant was weighed and run through a chipper shredder to determine whole plant dry matter and total N content. The other two plants were harvested the following day, weighed and one plant in Maine and both plants in Vermont were separated into individual branches and stripped of fan its fan leaves. Flowers were separated from individual branches using an MB1 Munch Machine bucker in Maine and a BuckmasterPro bucker in Vermont. In Vermont bucked flower was then fed through the CenturionPro Gladiator Trimmer. Wet bud weight and unmarketable bud weight were recorded. Stems were also collected and weighed. Flower dry matter content was assessed by collecting a flower subsample and drying the flower sample overnight in a small dehydrator. In Maine, samples of the dehydrated flower were submitted for cannabidiol (CBD) and tetrahydrocannabinol (THC) and total cannabinoid content at Nova Analytics in Portland; samples in Vermont were analyzed in house at the E.E. Cummings Crop Testing Laboratory. The percent moisture at harvest was used to calculate total dry matter and flower dry matter yields. The whole plant total N was analyzed at the respective university labs.
All data were statistically analyzed using appropriate methods (analysis of variance and regression), and an optimum N rates have been determined for each year and location based on yield response. Using JMP 16 from SAS, data were analyzed using analysis of variance and appropriate mean separation techniques to assess treatment differences.
2022 - Nitrogen response trial and Rotation trial research conducted in Stillwater, Maine and Alburgh, Vermont
These experiments were conducted at the Borderview Farm in Alburgh, VT (UVM-A) and the University of Maine Witter Center Rogers Farm (UM-RF) in Stillwater, Maine. Agronomic information is provided in Tables 1 and 2.
Methods - Soil and experimental preparation
The trials were initiated in the spring of 2021, 2022, and 2023 with soil preparation in late May. The experimental design was a randomized complete block with five N rates (0-200 lbs/ac) and four replications. Soil was disked and based on soil test recommendations, phosphorus and potassium were broadcast applied at 50 lbs of P2O5 and K2O/ac at UM-RF according to soil test results. The UVM-A site was disked and P and K were broadcast applied at 57 lbs of P2O5 and K2O/ac at Borderview Research Farm
Ammonium sulfate (21-0-0-24) was applied to each plot at 0, 50, 100, 150, and 200 lbs N/ac. Gypsum was applied to balance the S in each treatment. These applications were applied to the field in two applications, just prior to planting and three weeks later to avoid salt or fertilizer injury.
Table 1. Soils Data for Nitrogen studies conducted in 2021, 2022, and 2023 for UM-RF and UVM-A.
|
Property |
UMRF |
UVM-Alburgh |
||||
|
|
2021 |
2022 |
2023 |
2021 |
2022 |
2023 |
|
Geographic Location |
44.9297, -68.6959 |
45.009080, -73.309259 |
||||
|
Soil type |
Lamoine silt loam |
Benson rocky silt loam |
||||
|
Soil pH |
6.6 |
6.0 |
6.0 |
7.3 |
6.5 |
6.5 |
|
Soil Organic Matter |
3.4 |
2.8 |
2.1 |
5.3 |
4.8 |
4.8 |
|
Soil Phosphorus |
6.8 |
5.9 |
5.0 |
64.8 |
6.8 |
6.8 |
|
Soil Potassium |
348 |
247 |
125 |
552 |
116 |
116 |
|
Soil Calcium |
1530 |
316 |
1797 |
6930 |
4910 |
4970 |
|
Soil Magnesium |
201 |
111 |
312 |
302 |
160 |
222 |
Table 2b. Soils data for the Rotation studies conducted in 2021, 2022, and 2023
|
Property |
UMRF |
UVM-Alburgh |
|
Geographic Location |
44.9297, -68.6959 |
45.009080, -73.309259 |
|
Soil type |
Lamoine silt loam |
Benson rocky silt loam |
|
Soil pH |
6.6 |
7.3 |
|
Soil Organic Matter |
3.4 |
5.3 |
|
Soil Phosphorus |
7 |
63 |
|
Soil Potassium |
348 |
552 |
|
Soil Calcium |
1730 |
6930 |
|
Soil Magnesium |
129 |
352
|
Individual hemp seeds were sown, one seed per cell, into deep 50 cell plug trays in May of each growing season (Table 3a). Supplemental lighting was provided during the day, and plants were given 18 hours of light. Soil was watered to keep the soil surface sufficiently moist to effect germination and two fertilizations were made with a low analysis 2-2-2 liquid fertilizer. Plants were grown in the greenhouse for almost four weeks prior to transplanting in the field.
At four-weeks after sowing, hemp seedlings (variety Elektra) were hardened off and transplanted. Hemp plants were transplanted on a 6 x 6 spacing without black plastic. The field was laid out and transplant locations were flagged out after the P and K had been applied and disked in. A sharpshooter shovel was used to dig a hole approximately 15 cm deep and 15 cm in diameter. Plants were removed from the container, and the based was dipped in water to saturate the rooting medium. Then, the plant was placed in the hole and watered in.
Weeds were controlled through hand weeding and a walk-behind Power Ox cultivator equipped with three sweeps was used to kill germinating weeds on a biweekly basis at both sites. The Power Ox was directed both down the plot and across the plot to control the weeds biweekly in June, July and August. When the plants were too large to cultivate between them, weeds were hand hoed.
Table 3a. Experimental Details of the Nitrogen Trial on Floral Hemp.
|
|
UM-RF |
UVM-A |
|
Location |
Rogers Farm Stillwater, ME |
Borderview Research Farm – Alburgh, VT |
|
Previous crops |
21 - Onions |
21 – Cereal Rye |
|
22 - Potatoes |
22 – Corn |
|
|
23 - Forage |
23 - Barley |
|
|
Plot size |
20 ft x 25 ft |
20 ft x 25 ft |
|
Plant spacing |
5 ft x 6 ft |
5 ft x 6 ft |
|
Hemp variety |
1 month old Elektra |
1 month old Elektra |
|
Seed sown |
May 6, 2021 |
May 5, 2021 |
|
May 16, 2022 |
May 12, 2022 |
|
|
May 22, 2023 |
May 11, 2023 |
|
|
Transplant Date |
Jun 3, 2021 |
Jun 2, 2021 |
|
Jun 16, 2022 |
Jun 3, 2022 |
|
|
Jun 22, 2023 |
Jun 16, 2023 |
|
|
Harvest Dates |
Sep 27 & 28, 2021 |
Sep 17, 2021 |
|
Oct 3 & 4, 2022 |
Sep 23 & 24, 2022 |
|
|
No harvest |
Sep 28 & 29, 2023 |
Table 3b. Experimental Details of the Rotation Trial on Floral Hemp.
|
|
UM-RF |
UMV-A |
|
Location |
Rogers Farm Stillwater, ME |
Borderview Research Farm – Alburgh, VT |
|
Previous Crop |
Onions |
Small Grains |
|
Plot size |
15 ft x 25 ft |
18 ft x 30 ft |
|
Plant spacing |
6 ft x 6 ft |
6 ft x 6 ft |
|
Hemp variety |
1 month old Elektra |
1 month old Elektra |
|
Seed sown |
May 6, 2021 |
May 12, 2021 |
|
May 16, 2022 |
May 12, 2022 |
|
|
May 22, 2023 |
May 11,2023 |
|
|
Transplant Date |
June 3, 2021 |
June 2, 2021 |
|
June 16, 2022 |
June 3, 2022 |
|
|
June 22, 2023 |
June 16, 2023 |
|
|
Harvest Dates |
September 27 and 28, 2021 |
September 17, 2021 |
|
October 3 and 4, 2022 |
September 23 and 24, 2022 |
|
|
October 3, 4, and 5, 2023 |
September 28 and 29, 2023 |
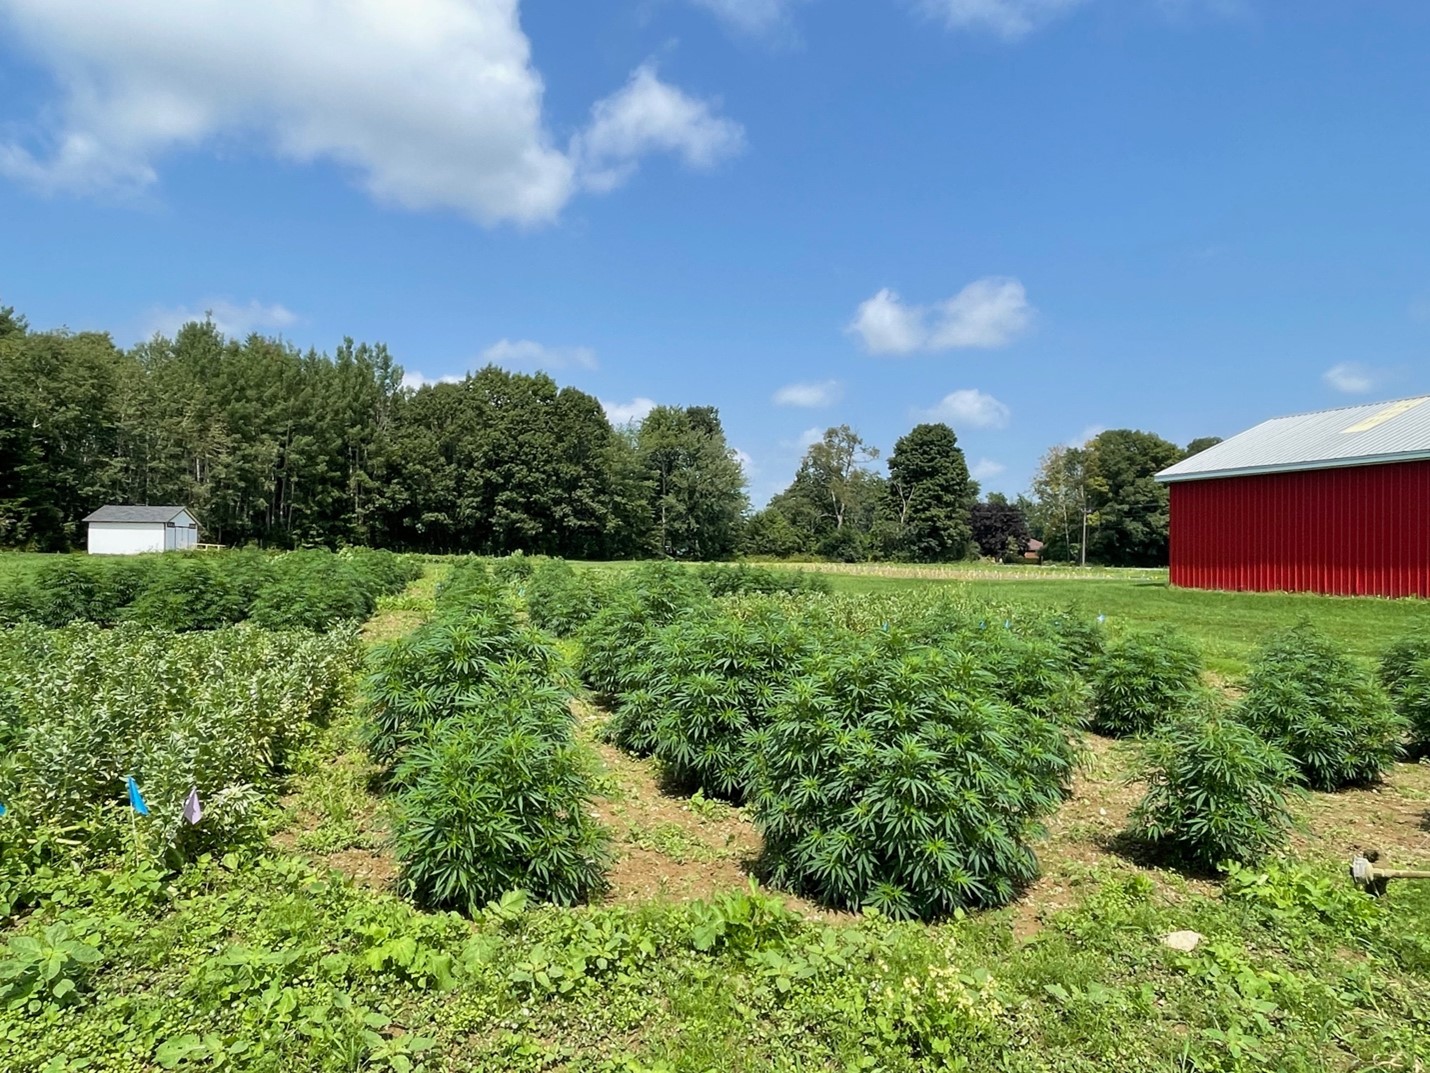
Figures 1 and 2 above are the N Response and Rotation trials conducted at the University of Maine Rogers Farm in 2021
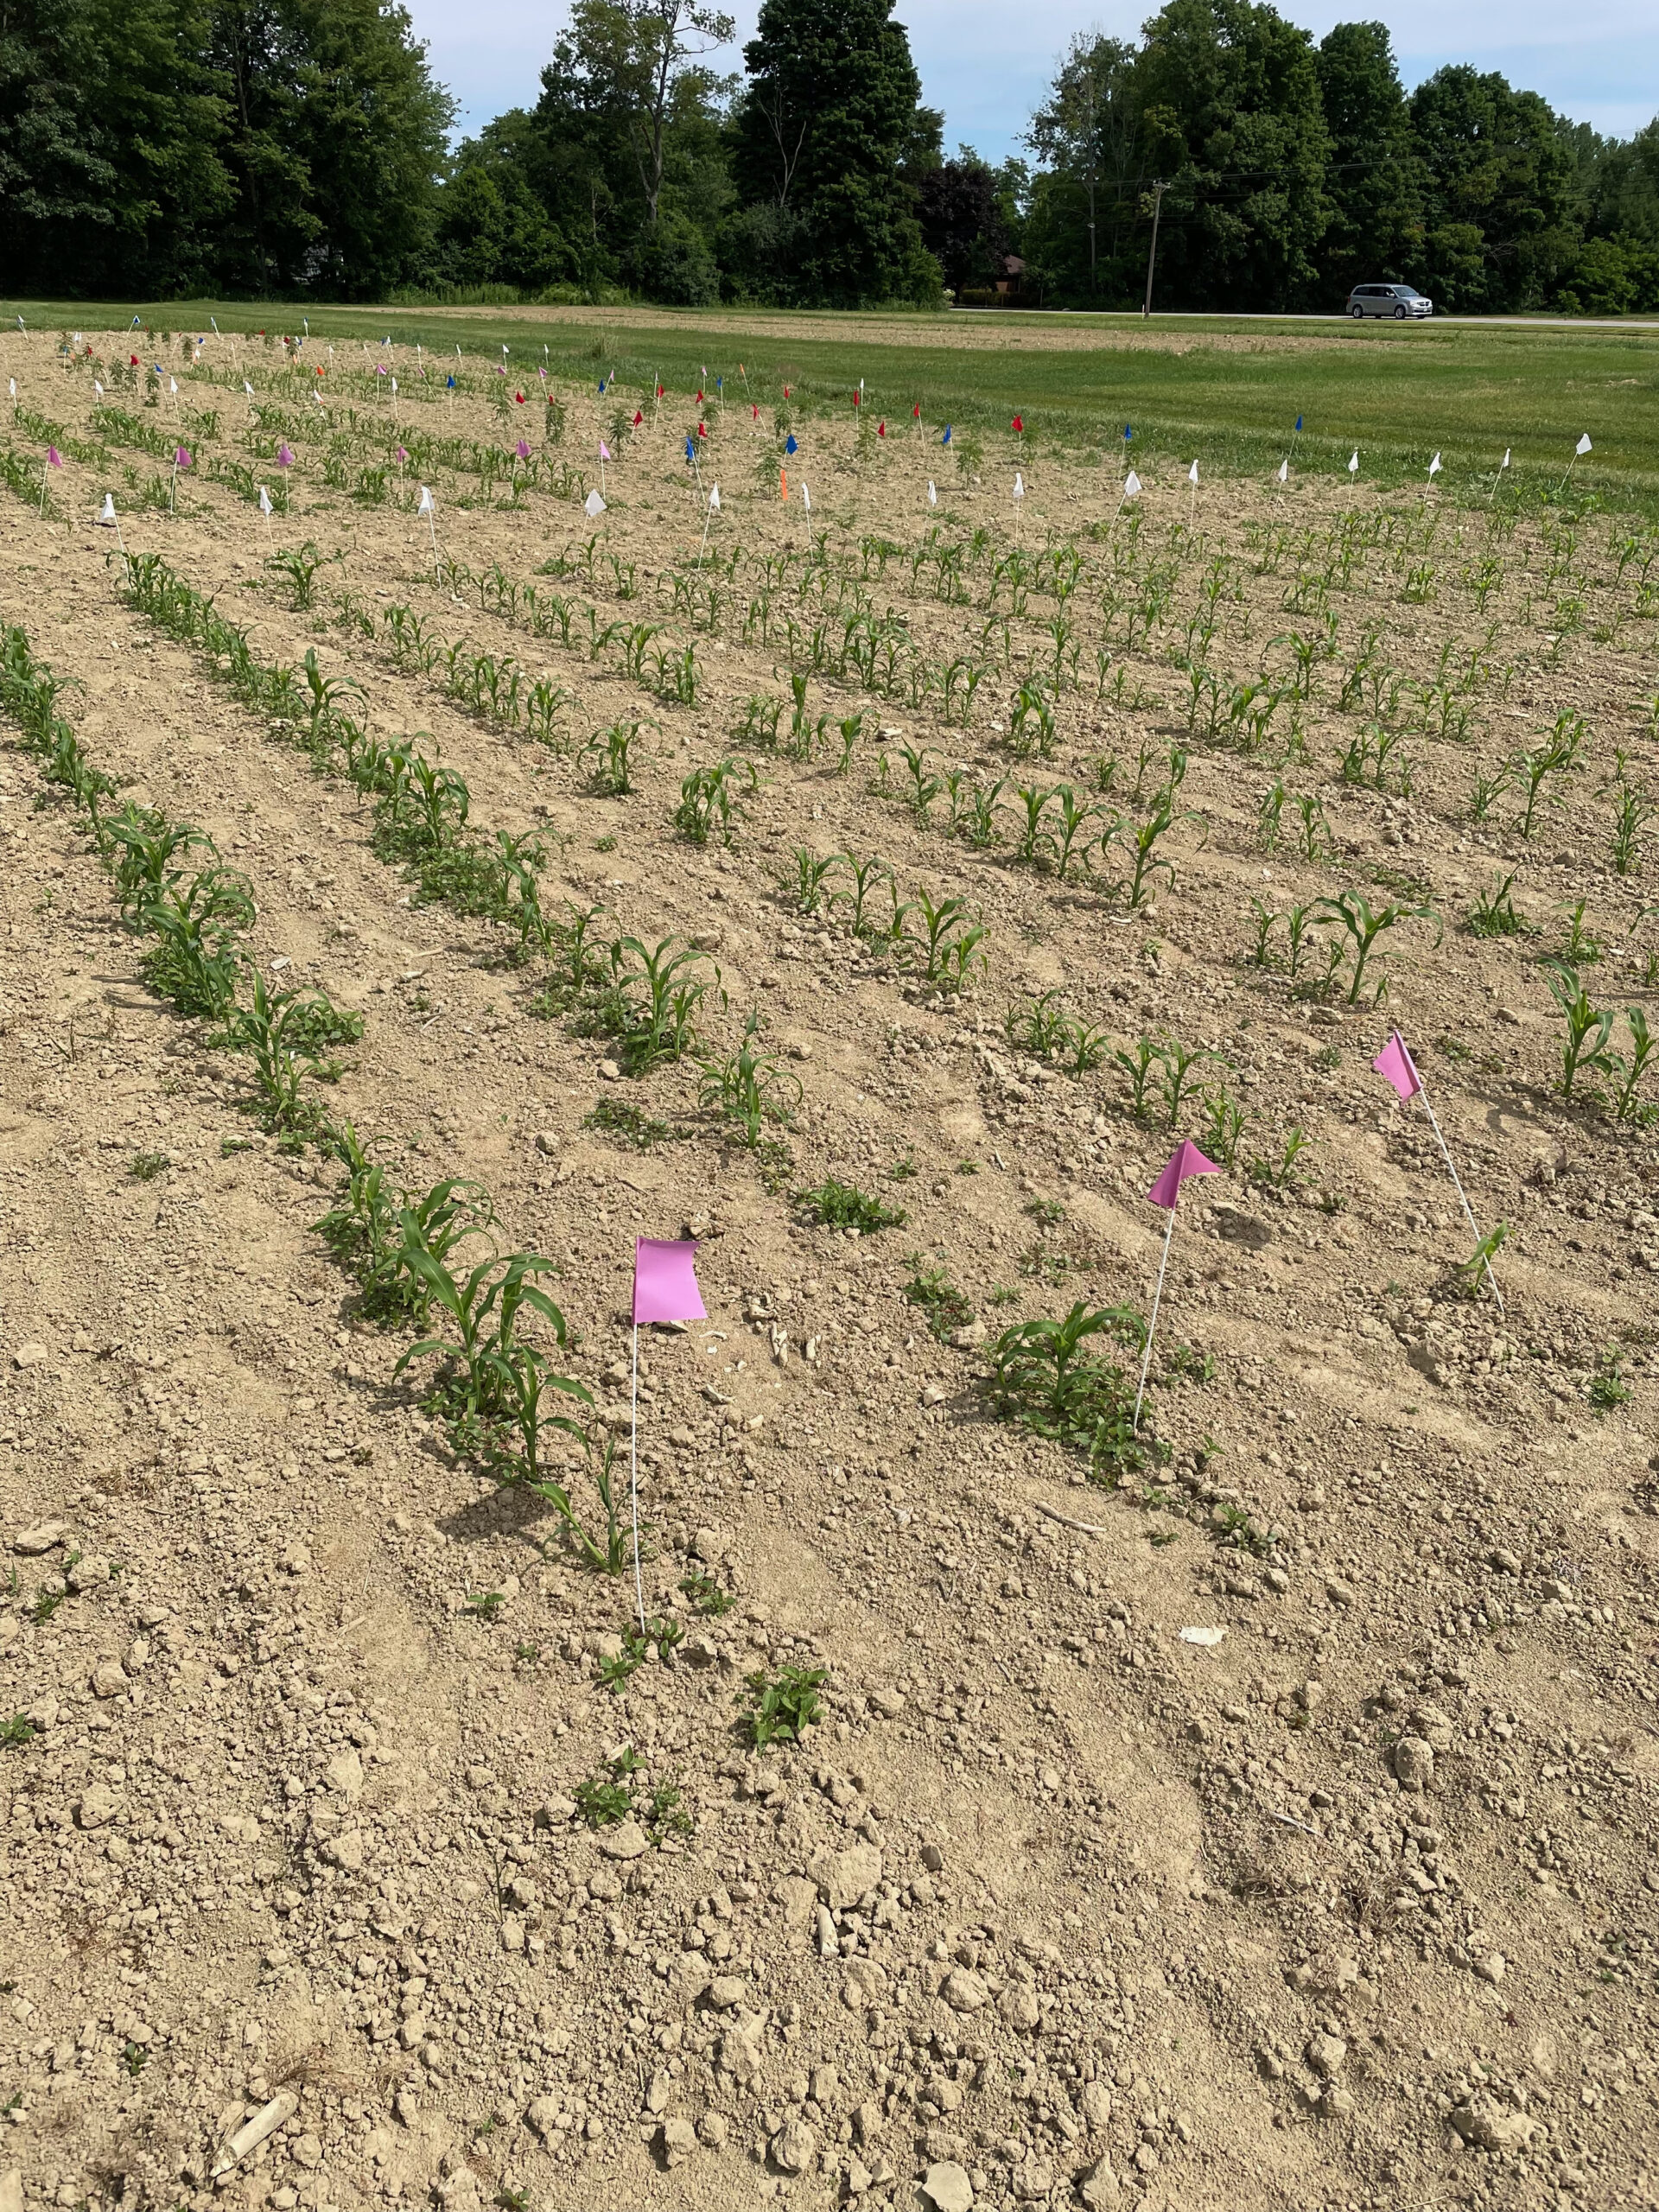
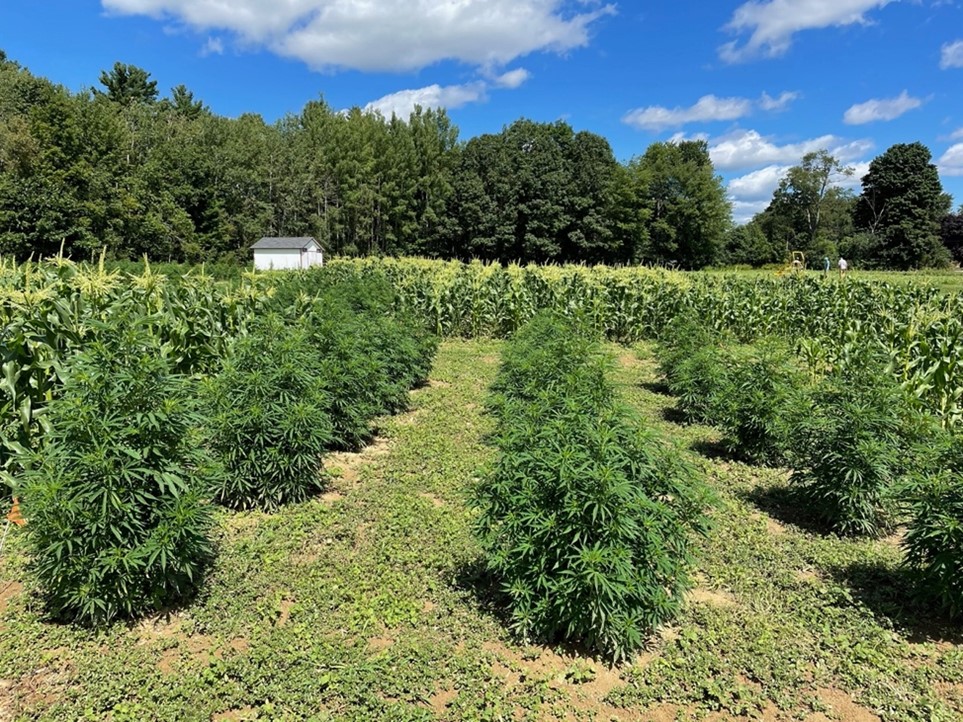
Figure 3. CBD hemp and Sweet Corn from the rotation trial.
On-Farm Sampling
At flower initiation, we visited eight farms in Maine to sample cannabis plants for fan leaf total N and test the leaf chlorophyll test methods using the methods described above. On one farm, we sampled plants by variety, but on most, since the soils were managed the same, we collected one fan leaf sample across varieties and took average SPAD values and ratios to plot against fan leaf N. We used these data to plot 8th:4th node SPAD ratios against fan leaf N using a modified Cate-Nelson statistical approach to see what fan leaf N and what ratio would separate the data to maximize the number of points in the upper right and lower left quadrants (Cate and Nelson, 1971). We could then use those values to assess N status from the UM-RF N response trial.
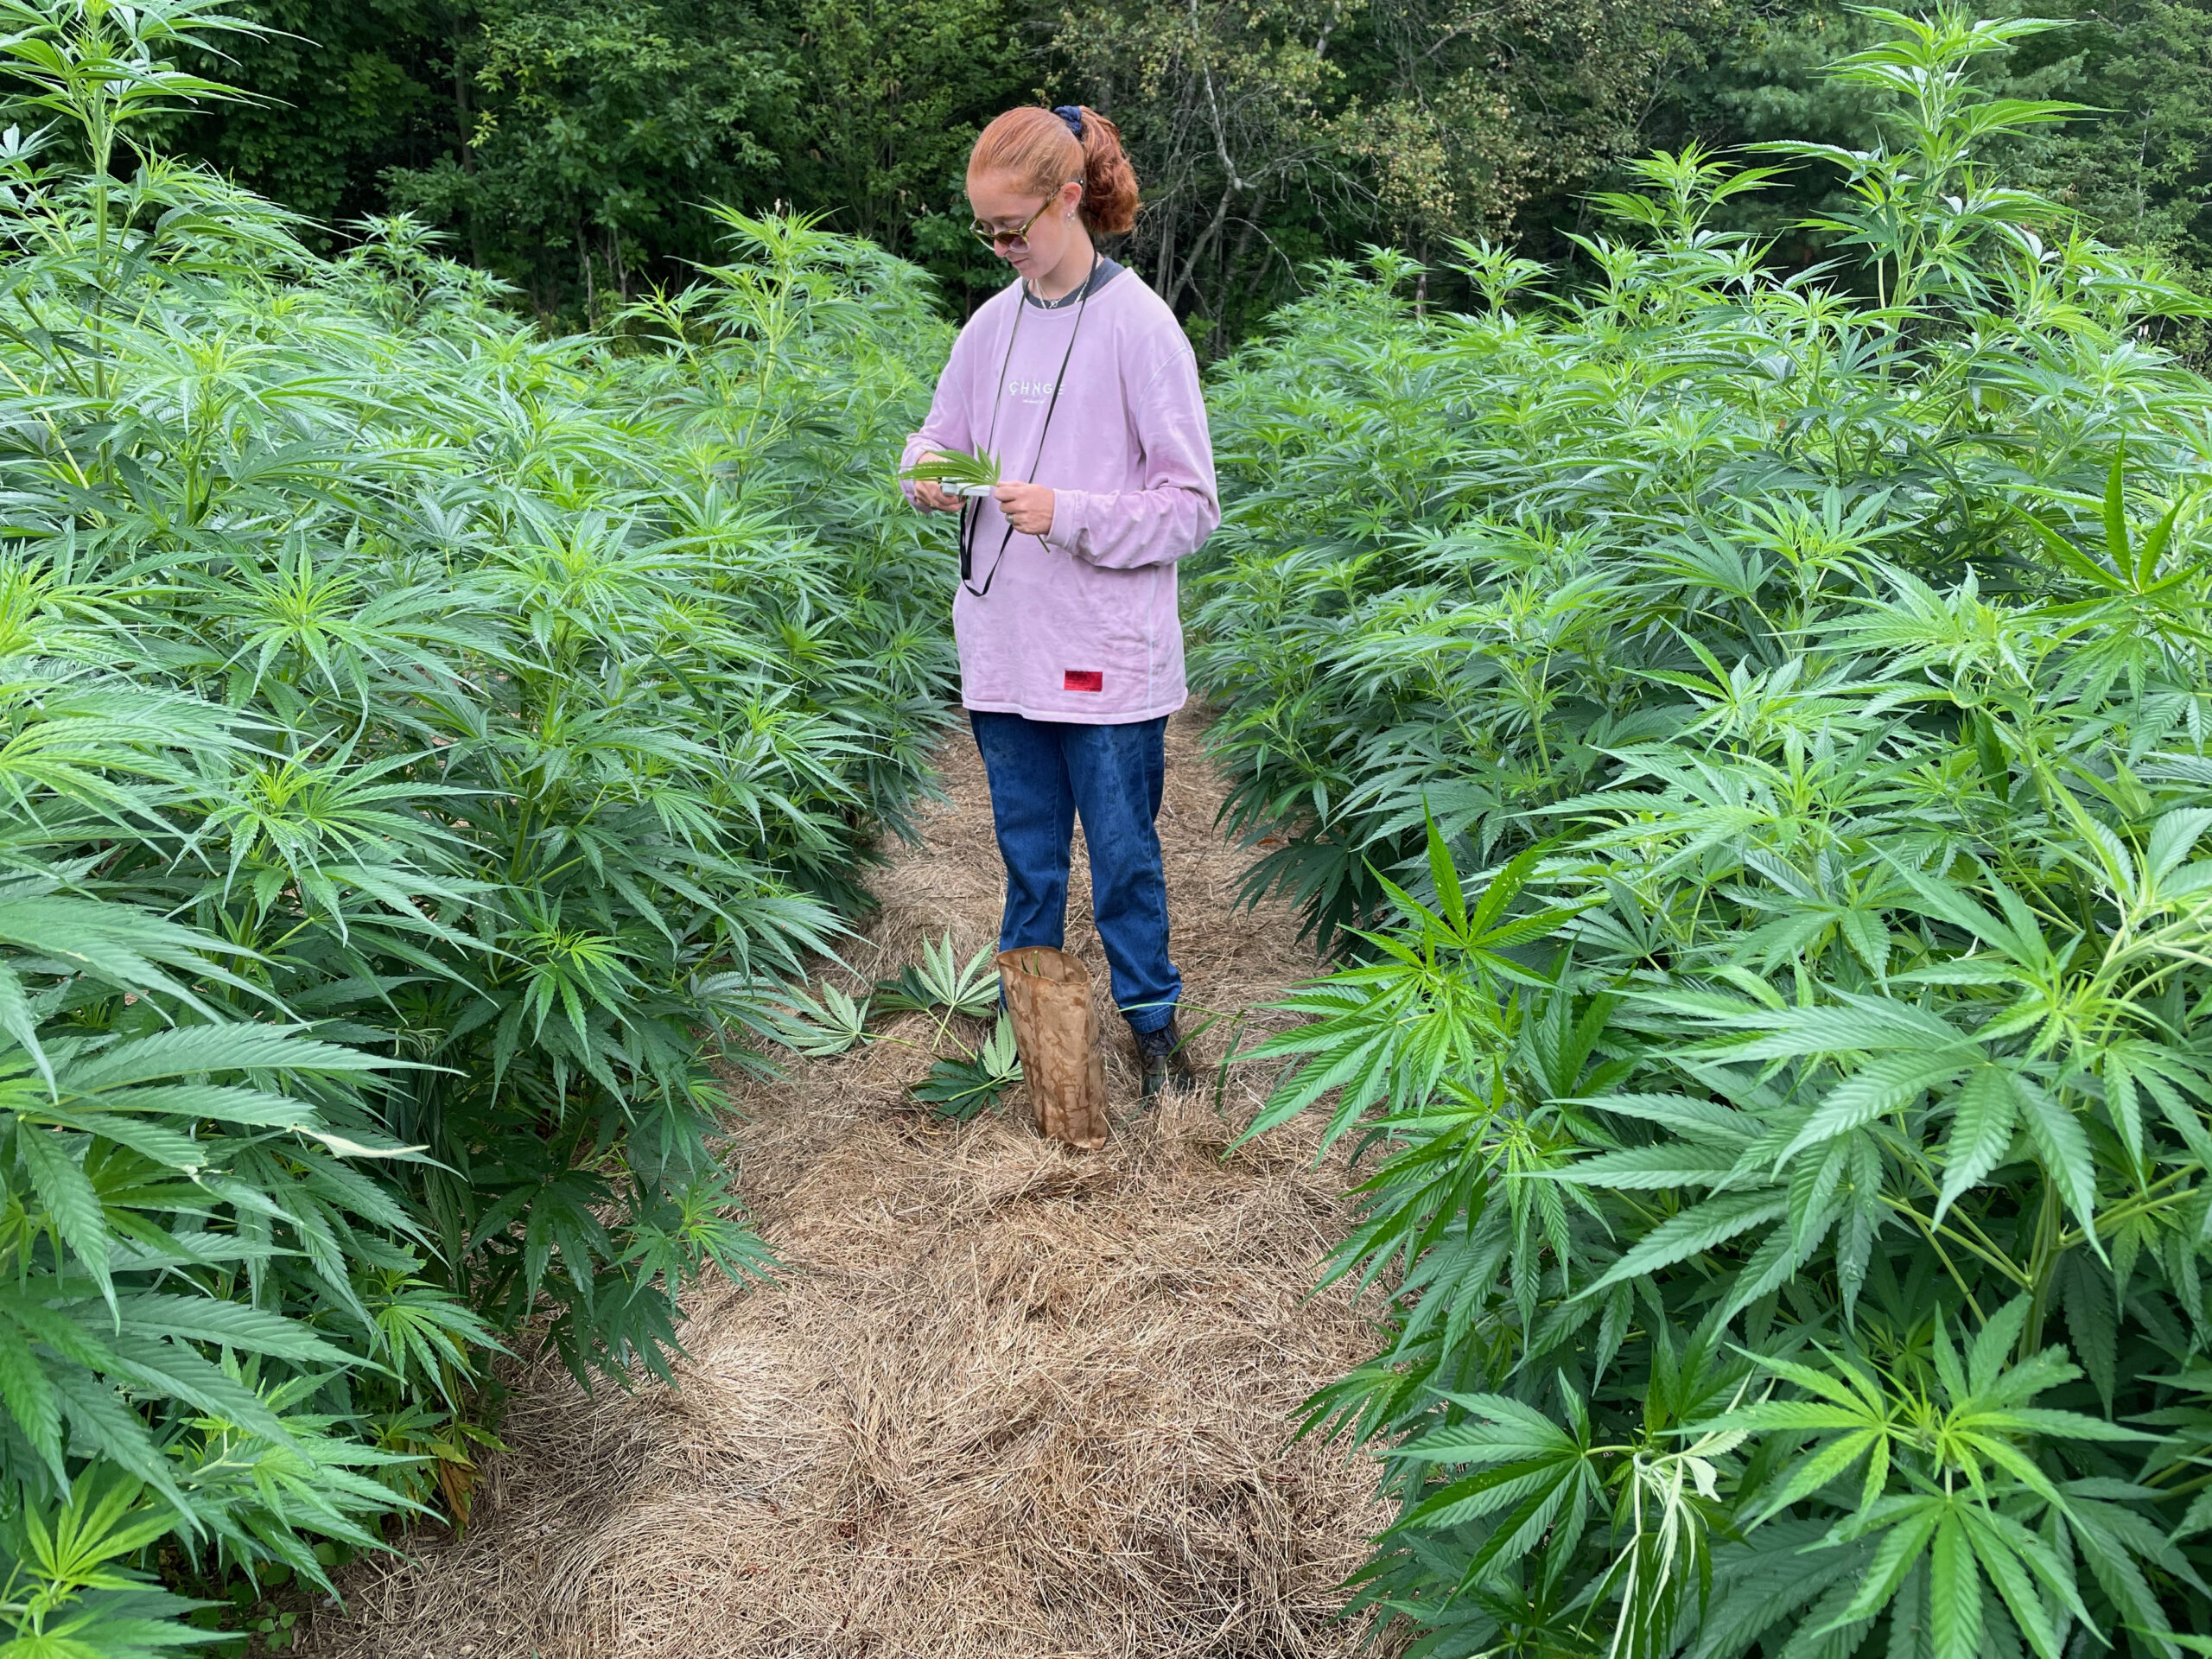
Figures 4 and 5. Using Minolta 501 SPAD meter to assess leaf chlorophyll and SPAD ratios to assess N status.
Results and Discussion
Environmental conditions found during the three years of work greatly influenced plant production (Table 1).
Table 1a. Temperature and rainfall from the UM-RF site from 2021 – 2023.
|
Month |
Avg Monthly Temperature (C) |
30-year average (C) |
Average Monthly Rainfall (mm) |
30-yr average rainfall (mm) |
||||
|
|
2021 |
2022 |
2023 |
|
2021 |
2022 |
2023 |
|
|
Apr |
7.40 |
6.00 |
6.50 |
3.10 |
96.0 |
111 |
29.0 |
81 |
|
May |
12.2 |
13.1 |
12.0 |
12.2 |
48.0 |
42.0 |
83.0 |
84 |
|
Jun |
19.3 |
16.3 |
15.9 |
17.2 |
25.0 |
39.0 |
129 |
89 |
|
Jul |
18.1 |
21.1 |
21.7 |
20.0 |
162 |
64.0 |
85.0 |
86 |
|
Aug |
20.5 |
20.3 |
18.1 |
18.2 |
76.0 |
90.0 |
224 |
81 |
|
Sep |
19.5 |
14.6 |
16.3 |
14.4 |
216 |
144 |
83.0 |
96 |
|
June-Sep total |
|
|
|
|
479 |
337 |
521 |
352 |
Table 1b. Temperature and rainfall from the UVM-Alburg site from 2021 – 2023.
|
Month |
Avg Monthly Temperature (C) |
30-year average (C |
Average Monthly Rainfall (mm) |
30-yr average rainfall (mm) |
||||
|
|
2021 |
2022 |
2023 |
|
2021 |
2022 |
2023 |
|
|
Apr |
8.90 |
8.90 |
9.10 |
7.60 |
89.0 |
141 |
125 |
78.0 |
|
May |
14.7 |
15.5 |
13.9 |
14.7 |
17.0 |
85.0 |
50.0 |
96.0 |
|
Jun |
21.3 |
18.5 |
18.7 |
19.7 |
78.0 |
208 |
112 |
108 |
|
Jul |
20.1 |
22.1 |
22.3 |
22.5 |
74.0 |
76.0 |
273 |
103 |
|
Aug |
23.3 |
21.3 |
19.4 |
21.5 |
58.0 |
125 |
159 |
90.0 |
|
Sep |
17.1 |
15.9 |
17.6 |
17.0 |
104 |
112 |
61.0 |
93.0 |
|
June-Sep total |
|
|
|
|
314 |
521 |
605 |
394 |
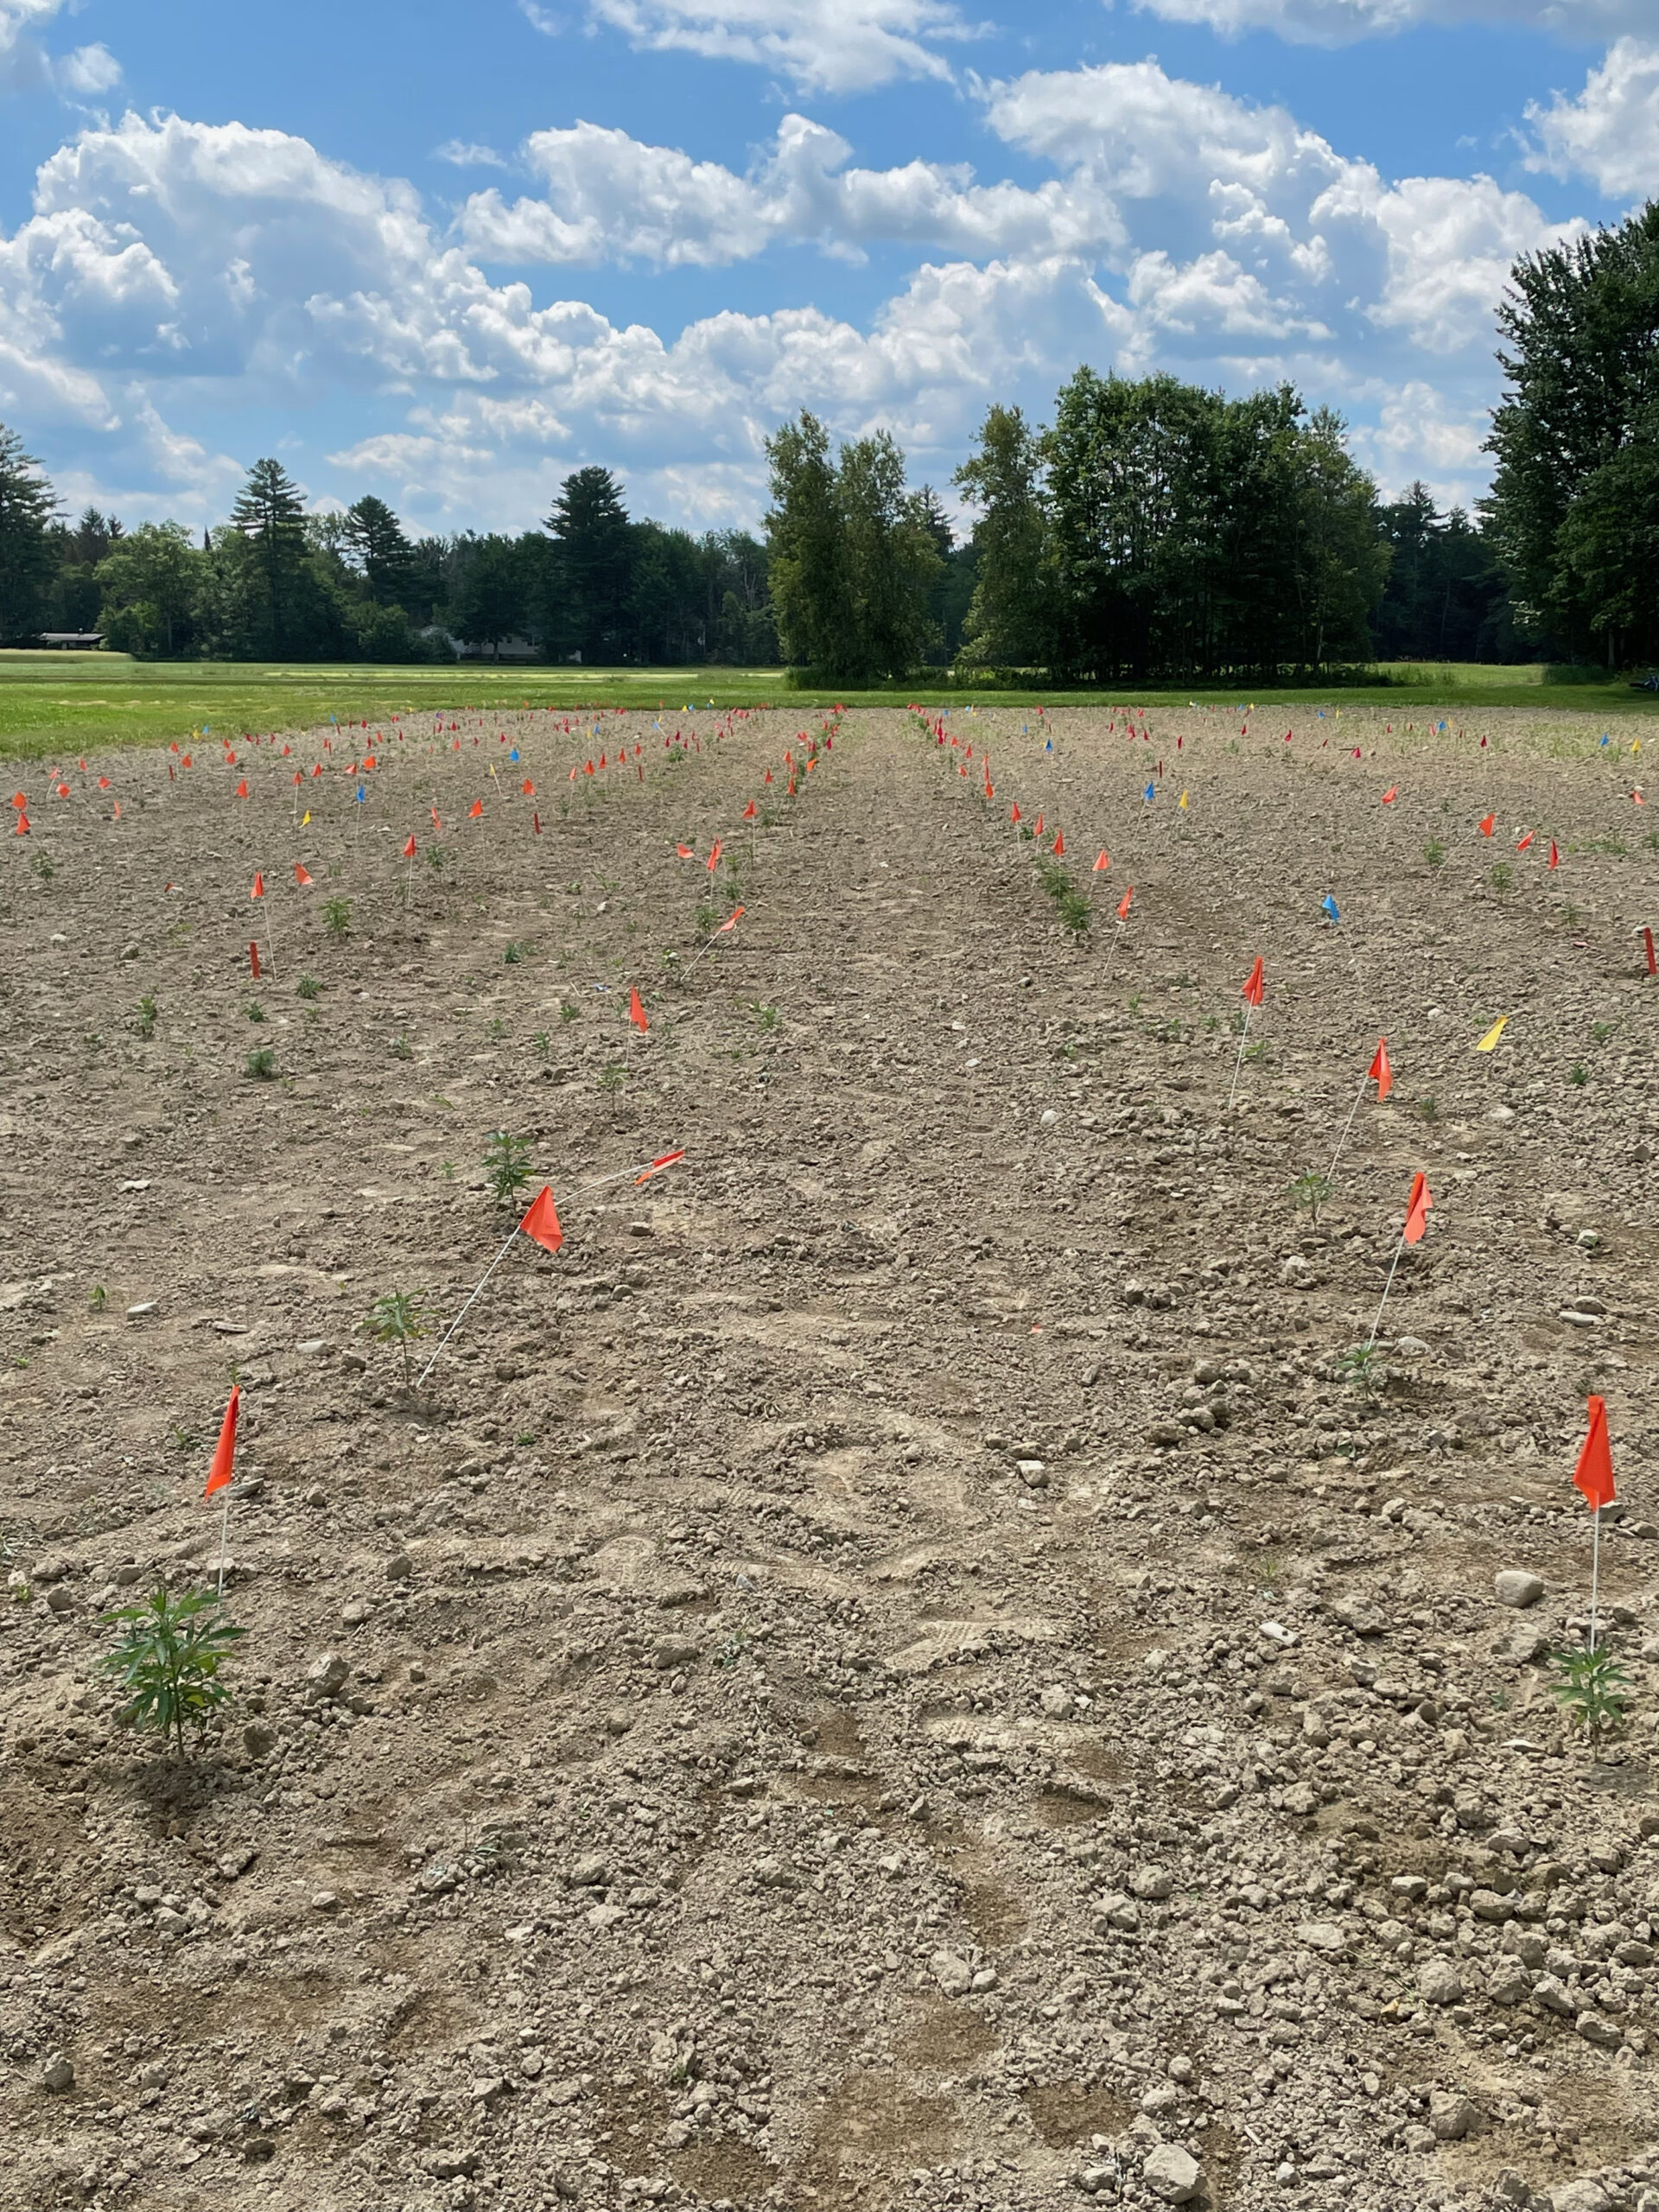
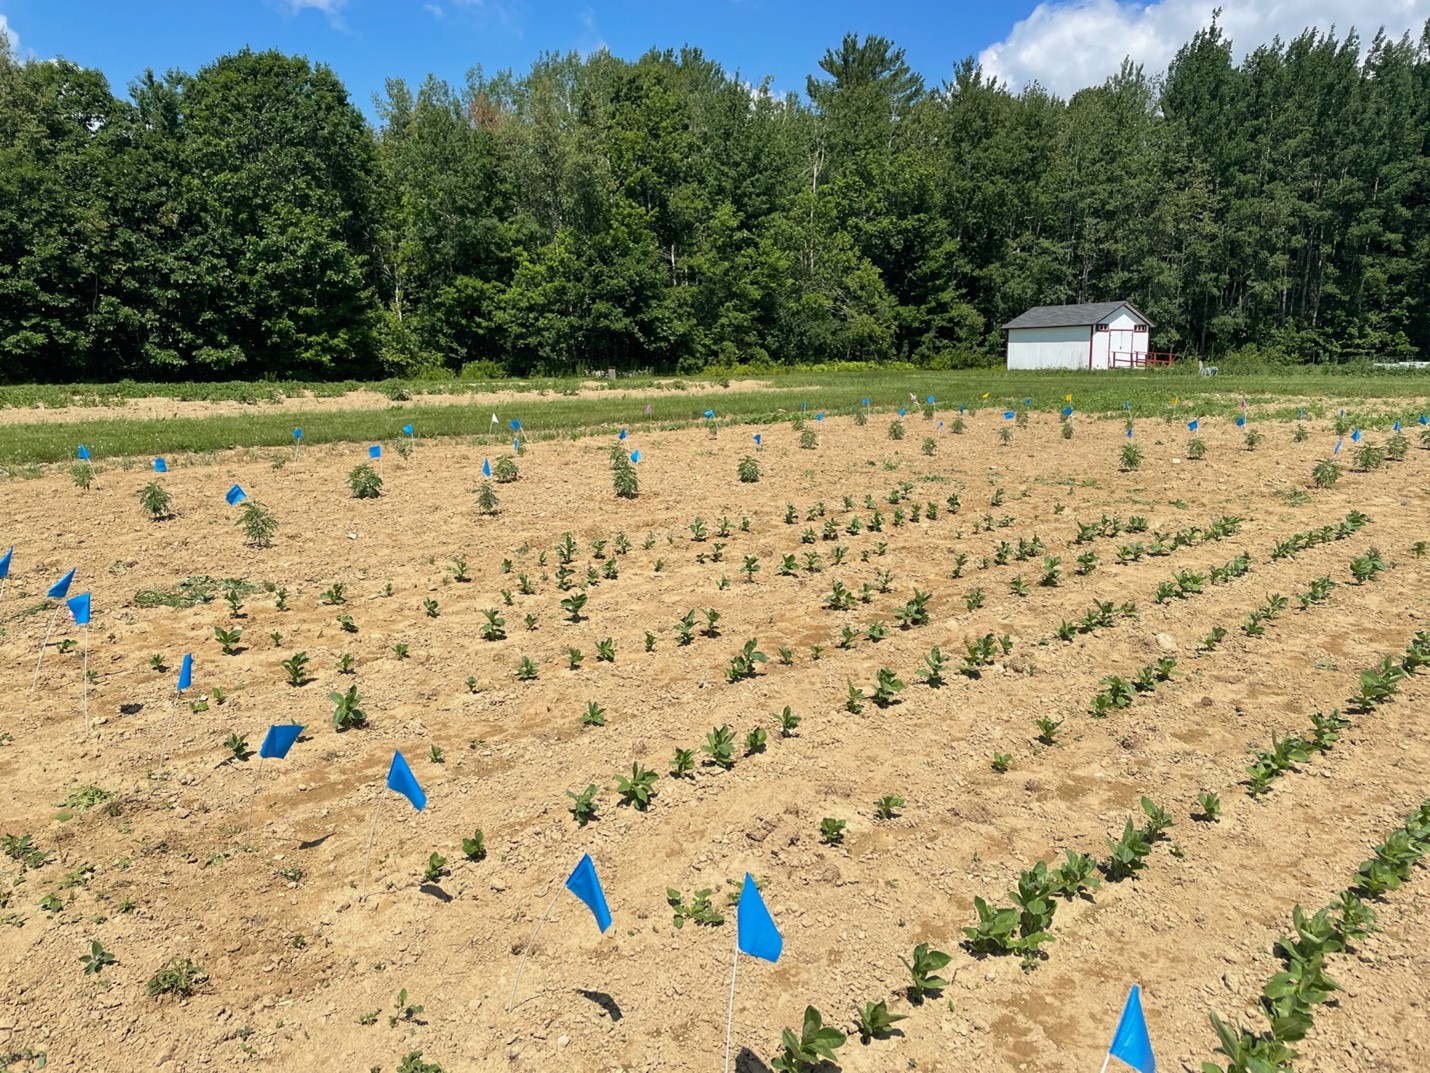
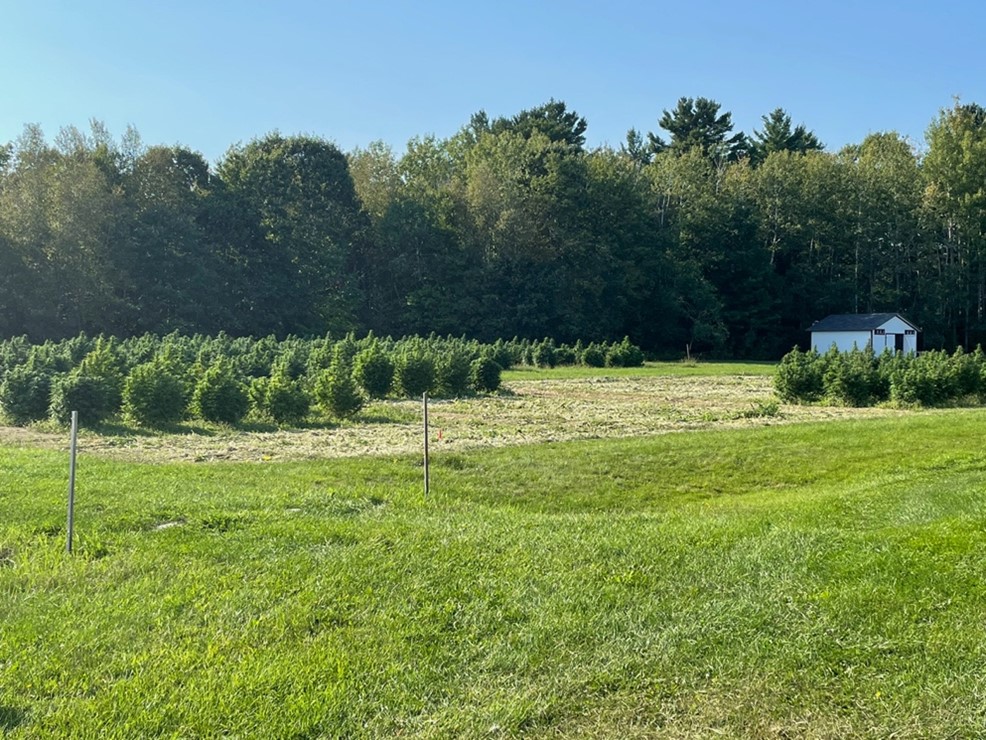
These data reflect the temperature and precipitation totals collected over the three growing seasons in 2021 – 2023. They do not reflect the distribution which was particularly important in 2023. The 2023 year was the wettest of the three years for both UM-RF and UVM-A. At UM-RF, at planting in 2021 and 2022, some supplemental irrigation was required to not lose the plants to drought, but not in 2023. The 2023 site at UM-RF was selected due to its likelihood of seeing a yield response. It was a heavier more poorly drained soil than that used in 2021 and 2022. The field was wetter than desired when transplanting, and the field never dried out. The extra 40 mm above the 30-year average and the average amount in July of 2023 kept the soil saturated most of the season. Finally in August, the site received three times the long-term average rainfall rate, and most came in a 10-day period at flower initiation. Had there been sufficient room to block the study North to South, the plants in the last replicate could have been dropped. But the field length necessary to lay out the study required us to plant east to west, and the plants in the southern 50-60 feet of the field all drowned. The first image shows the chlorotic plants on the southern end of the field in early august. Image 2 shows a plant wilting because the ground is saturated, and the third image shows the dead plants in the southern third of the field in September. Similar levels of precipitation were observed at the UVM site in Alburgh, VT with excessive precipitation especially in July reaching rainfall totals almost three times that of the 30-year average. However, with better drainage at this site plant productivity was not as severely impacted. The most notable impact was increased disease pressure due to the wet and cool conditions. The UVM-A site was not as greatly impacted by precipitation events as the UM-RF location, and the trial was able to reach full maturity and be harvested in the 2023 growing season.
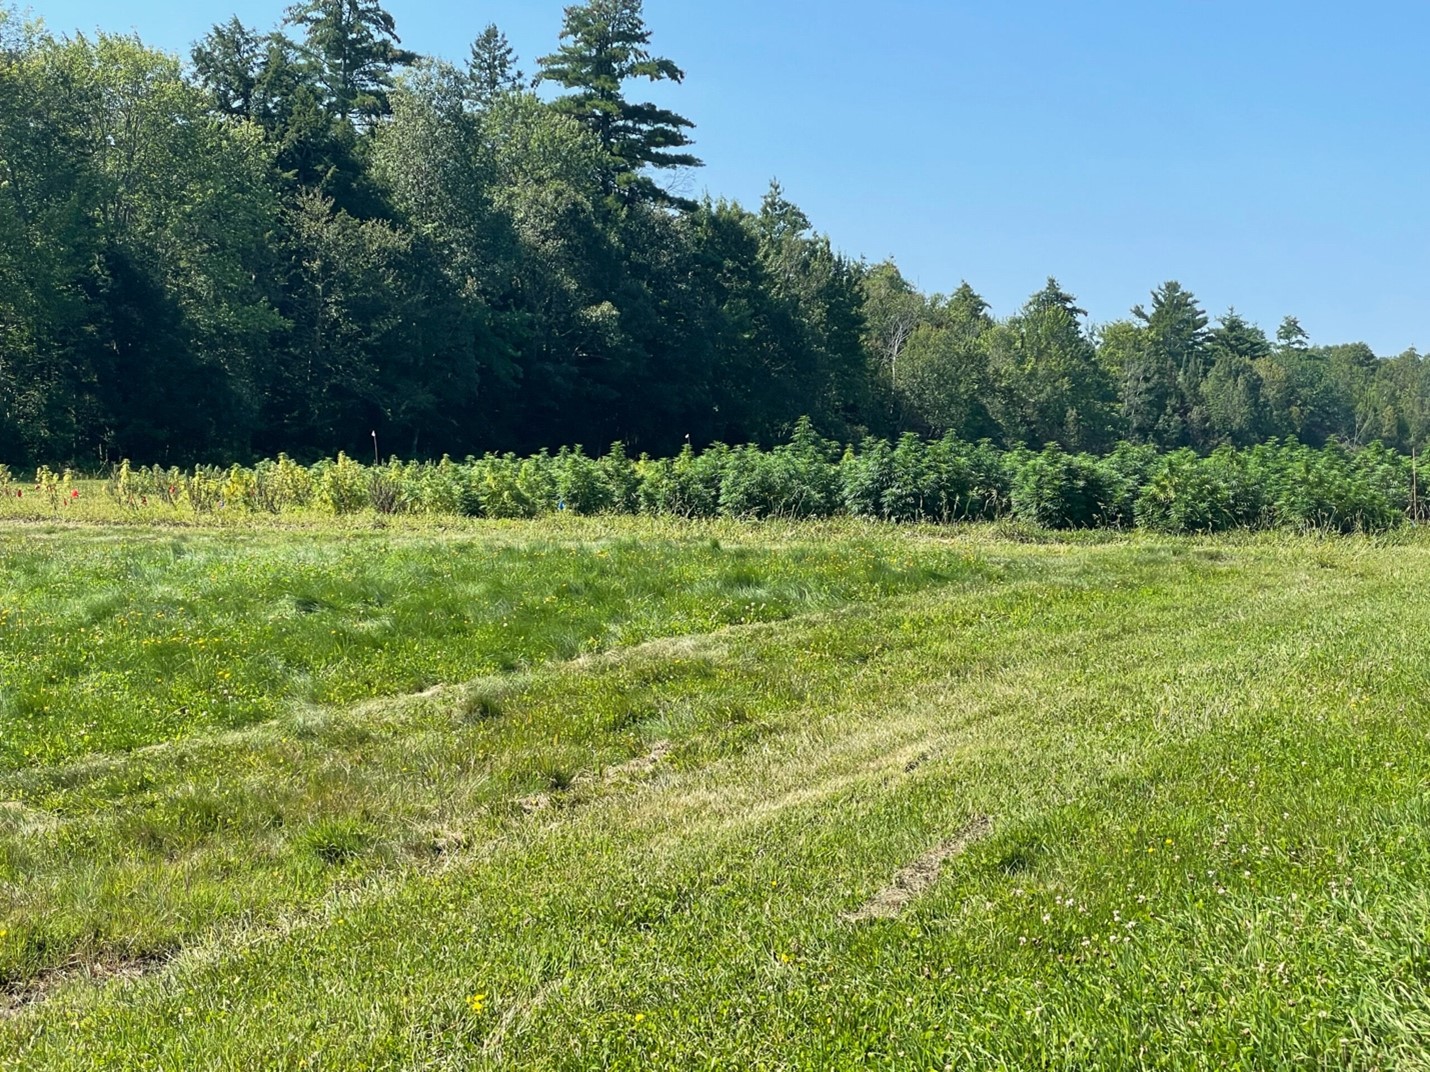
Image 1. UM-RF Year 1 Field location.
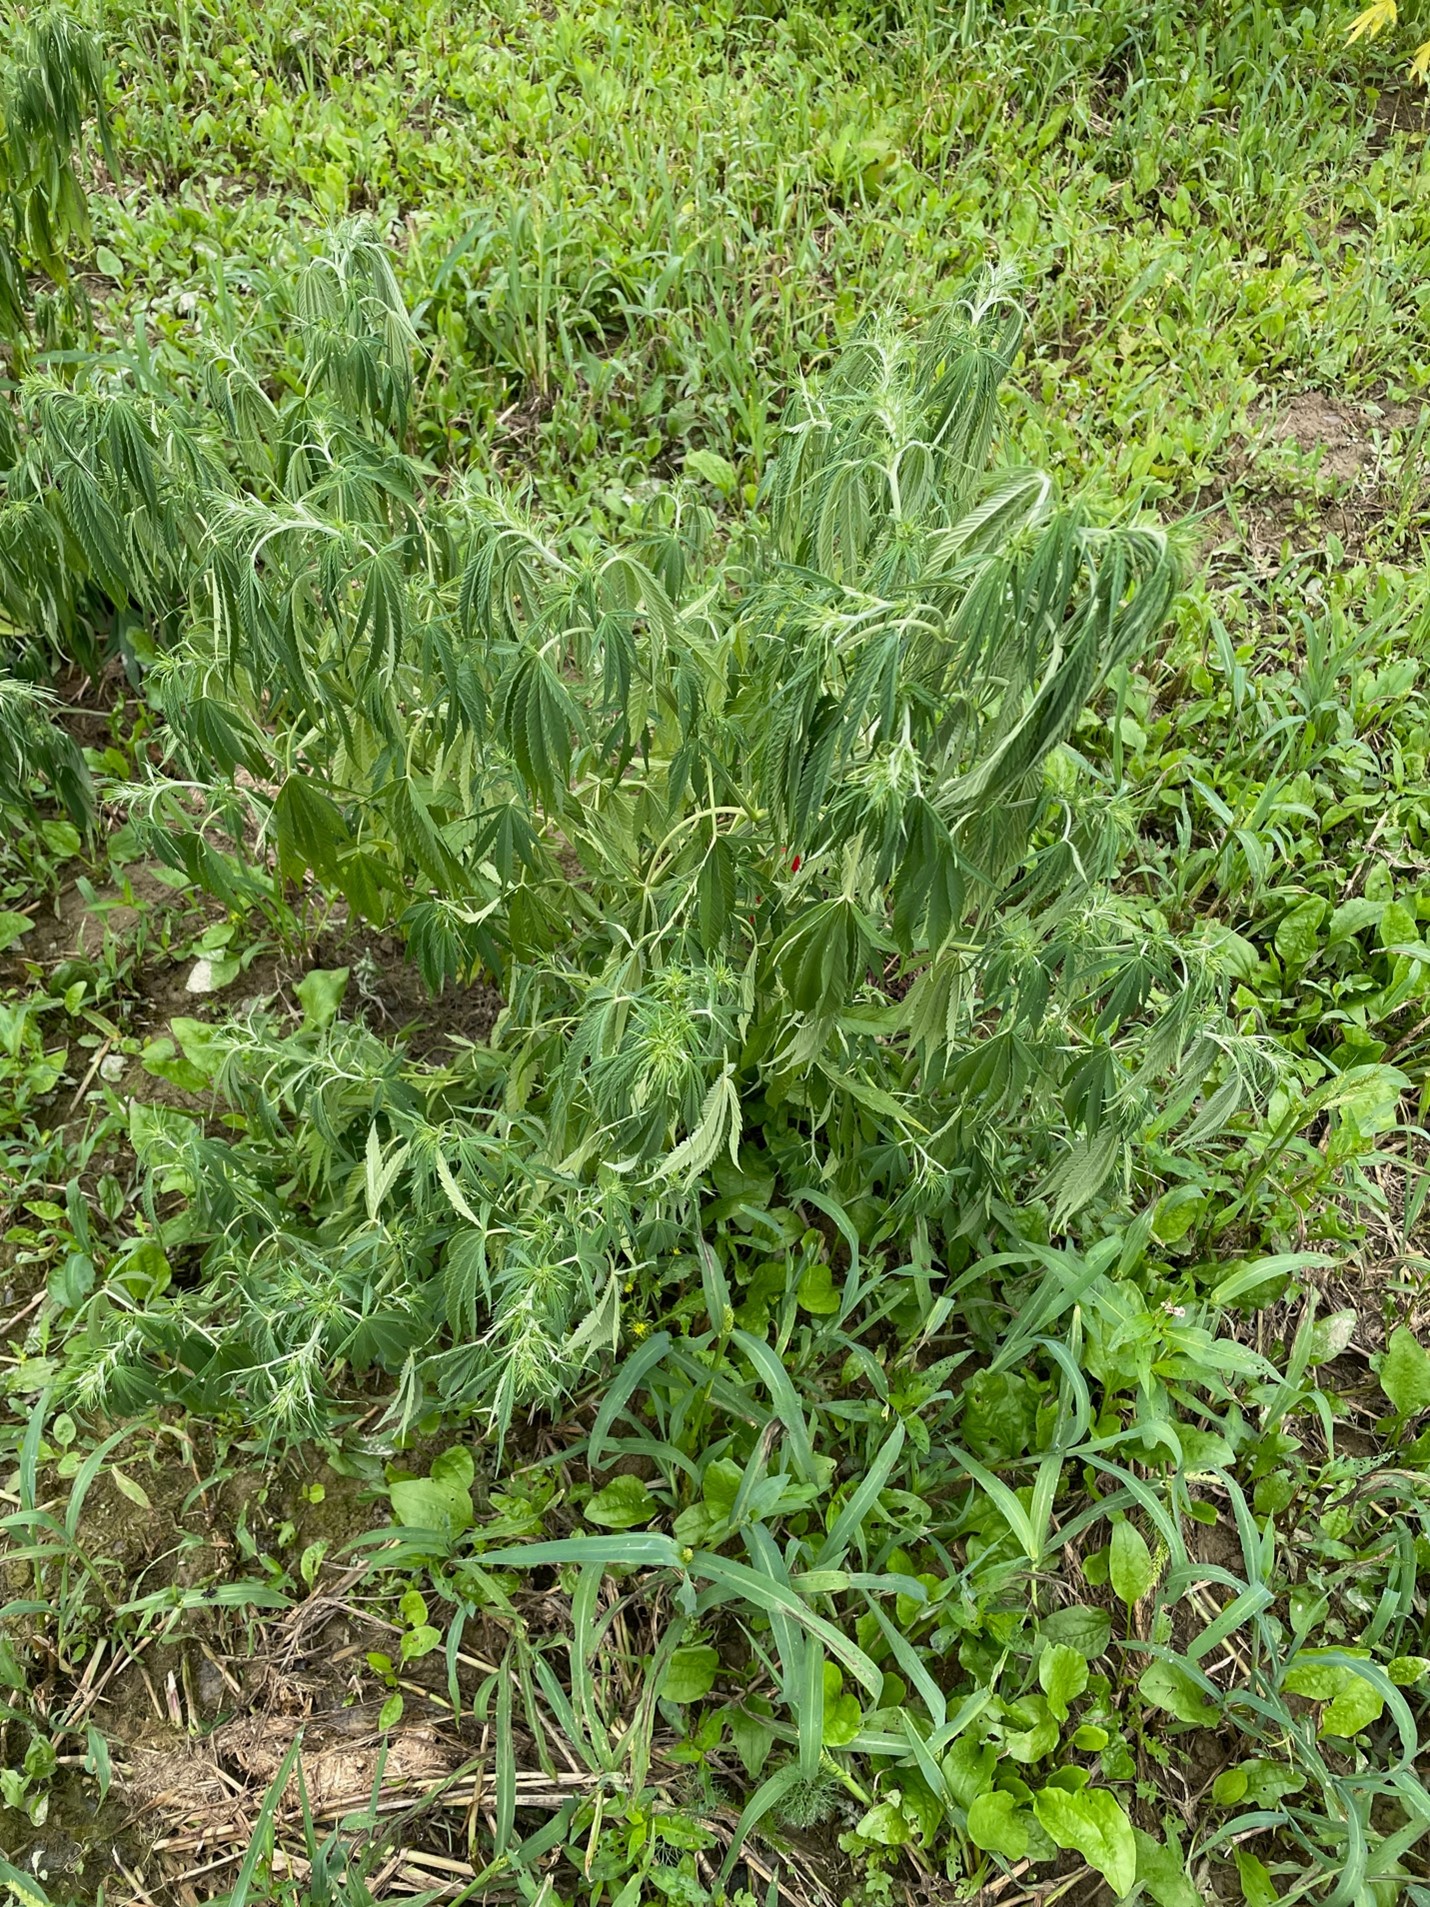
Image 2. In-field water damage from excessive precipitation and poor field drainage.
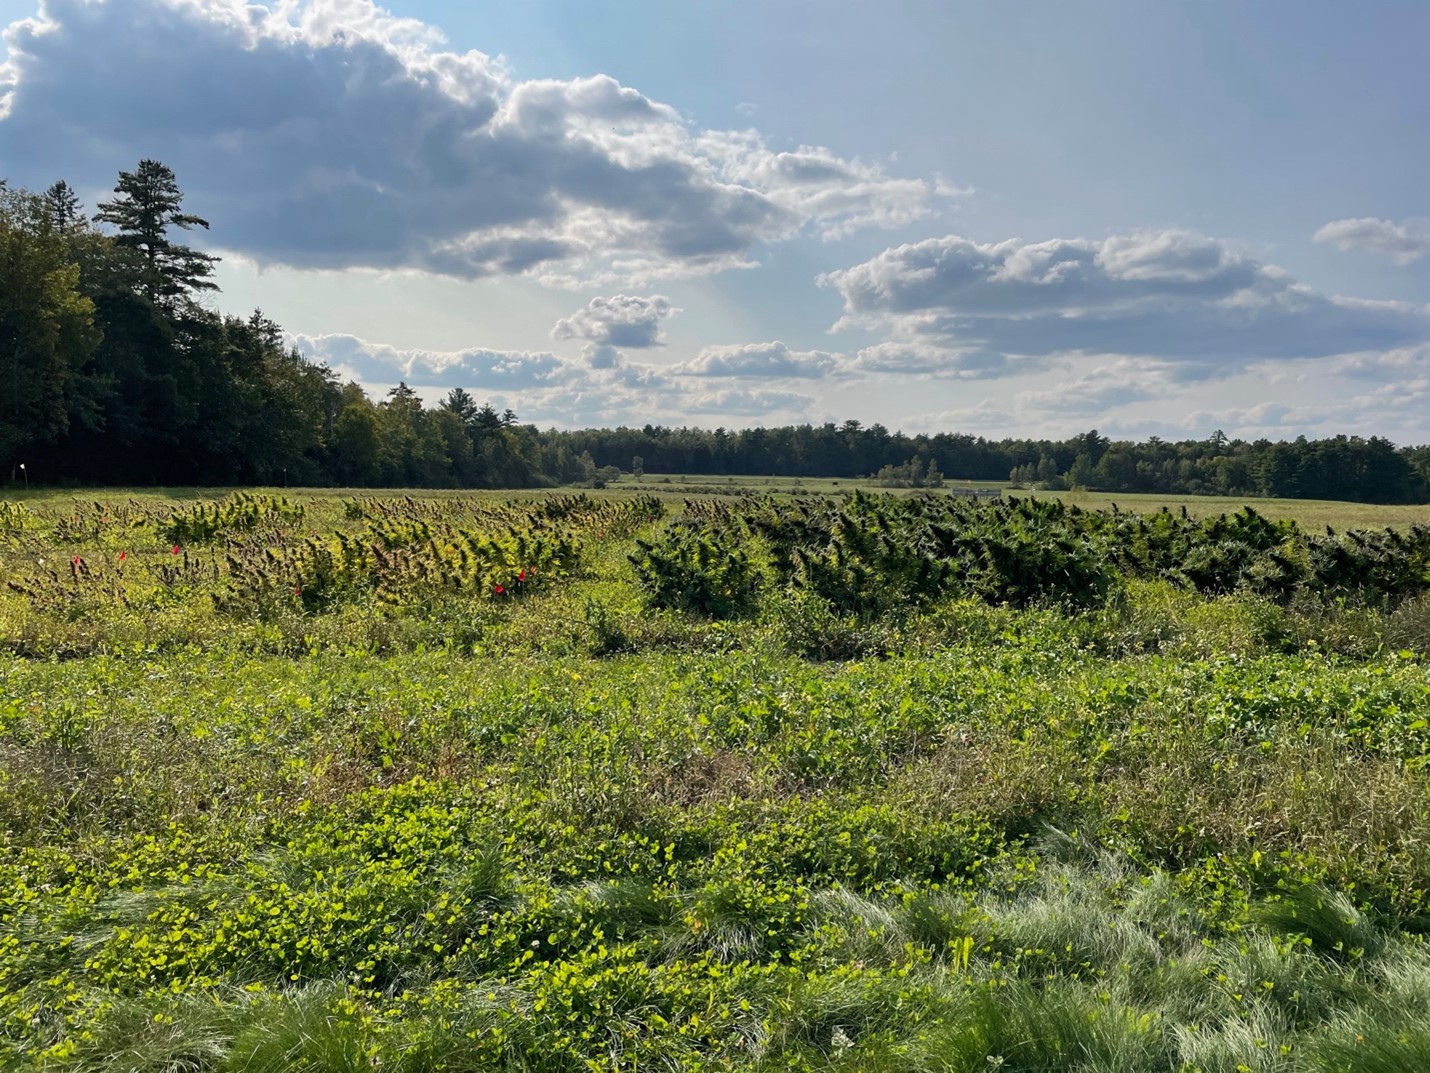
Image 3. Late season N-Fertility plots.
As a result of this environmental issue, we had to abandon the 2023 UMRF study site. Therefore, we will present 5 site-years of analysis from this work.
Soil and Experimental Information
The same experimental layout and sampling procedures were implemented at each location. We developed a randomized complete block experiment with four replications for the N study and the rotation study. Soils information for the two locations for the N study are found in Table 2a and 2b. Experimental details are presented in Table 3a and 3b.
Table 2a. Soils Data for the Nitrogen studies conducted in 2021, 2022, and 2023 for UMRF and UVM-A
|
Property |
UM-RF |
UVM-A |
||||
|
|
2021 |
2022 |
2023 |
2021 |
2022 |
2023 |
|
Geographic Location |
44.9297, -68.6959 |
45.009080, -73.309259 |
||||
|
Soil type |
Lamoine silt loam |
Benson rocky silt loam |
||||
|
Soil pH |
6.6 |
6.0 |
6.0 |
7.3 |
6.5 |
6.5 |
|
Soil Organic Matter |
3.4 |
2.8 |
2.1 |
5.3 |
4.8 |
4.8 |
|
Soil Phosphorus |
6.8 |
5.9 |
5.0 |
64.8 |
6.8 |
6.8 |
|
Soil Potassium |
348 |
247 |
125 |
552 |
116 |
116 |
|
Soil Calcium |
1530 |
316 |
1797 |
6930 |
4910 |
4970 |
|
Soil Magnesium |
201 |
111 |
312 |
302 |
160 |
222 |
Table 2b. Soils data for the Rotation studies conducted in 2021, 2022, and 2023
|
Property |
UM-RF |
UVM-A |
|
Geographic Location |
44.9297, -68.6959 |
45.009080, -73.309259 |
|
Soil type |
Lamoine silt loam |
Benson rocky silt loam |
|
Soil pH |
6.6 |
7.3 |
|
Soil Organic Matter |
3.4 |
5.3 |
|
Soil Phosphorus |
7 |
63 |
|
Soil Potassium |
348 |
552 |
|
Soil Calcium |
1730 |
6930 |
|
Soil Magnesium |
129 |
352 |
Table 3a. Experimental Details of the Nitrogen Trial on Floral Hemp.
|
|
UM-RF |
UVM-A |
|
Location |
Rogers Farm Stillwater, ME |
Borderview Research Farm – Alburgh, VT |
|
Previous crops |
21 - Onions |
21 – Cereal Rye |
|
22 - Potatoes |
22 – Corn |
|
|
23 - Forage |
23 - Barley |
|
|
Plot size |
20 ft x 25 ft |
20 ft x 25 ft |
|
Plant spacing |
5 ft x 6 ft |
5 ft x 6 ft |
|
Hemp variety |
1 month old Elektra |
1 month old Elektra |
|
Seed sown |
May 6, 2021 |
May 5, 2021 |
|
May 16, 2022 |
May 12, 2022 |
|
|
May 22, 2023 |
May 11, 2023 |
|
|
Transplant Date |
Jun 3, 2021 |
Jun 2, 2021 |
|
Jun 16, 2022 |
Jun 3, 2022 |
|
|
Jun 22, 2023 |
Jun 16, 2023 |
|
|
Harvest Dates |
Sep 27 & 28, 2021 |
Sep 17, 2021 |
|
Oct 3 & 4, 2022 |
Sep 23 & 24, 2022 |
|
|
No harvest |
Sep 28 & 29, 2023 |
Table 3b. Experimental Details of the Rotation Trial on Floral Hemp.
|
|
UM-RF |
UMV-A |
|
Location |
Rogers Farm Stillwater, ME |
Borderview Research Farm – Alburgh, VT |
|
Previous Crop |
Onions |
Small Grains |
|
Plot size |
15 ft x 25 ft |
18 ft x 30 ft |
|
Plant spacing |
6 ft x 6 ft |
5 ft x 6 ft |
|
Hemp variety |
1 month old Elektra |
1 month old Elektra |
|
Seed sown |
May 6, 2021 |
May 12, 2021 |
|
May 16, 2022 |
May 12, 2022 |
|
|
May 22, 2023 |
May 11,2023 |
|
|
Transplant Date |
June 3, 2021 |
June 2, 2021 |
|
June 16, 2022 |
June 3, 2022 |
|
|
June 22, 2023 |
June 16, 2023 |
|
|
Harvest Dates |
September 27 and 28, 2021 |
September 17, 2021 |
|
October 3 and 4, 2022 |
September 23 and 24, 2022 |
|
|
October 3, 4, and 5, 2023 |
September 28 and 29, 2023 |
Nitrogen Study Results
Plant Height and Branch Pair Count as Influenced by Nitrogen Rate, Year, and Location
Years greatly influenced early plant production in the Nitrogen Rate Trial experiments. In Maine, the very hot dry June and July in 2021 really set back early growth in Maine. In 2022, Maine had more favorable growing conditions, and growth was extremely similar in 2023. These differences led to a significant Location*Year interaction. Interestingly, nitrogen application rate did not affect early season growth and development. The same trends found with hemp growth at one-month post-transplant were also found with the branch pair count which also had a year*location interaction (data not presented).
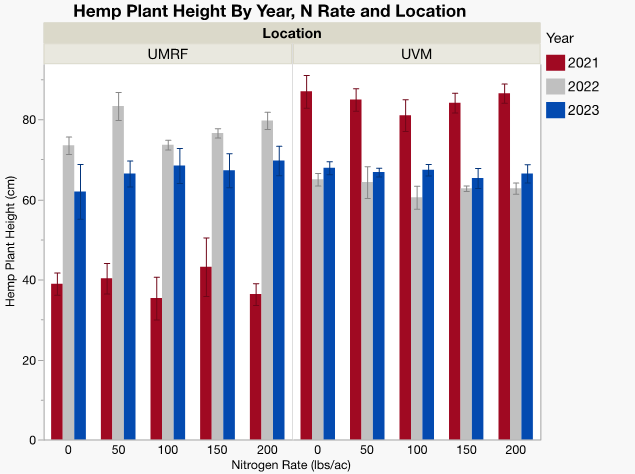
Figure 1. Plant height as influenced by environmental conditions over time.
The chlorophyll SPAD readings taken on the last opposite leaf across the six site years from the zero-N rate were different from all other treatments across both locations, and the 50 lb N/ac rate was different from 0-N and 150 lbs N/ac (Figure 2). Due to differences in weather and soils, there was a three-way interaction that was barely significant (p<0.05), but the key thing found was that the plant color was not strongly influenced by N rate.
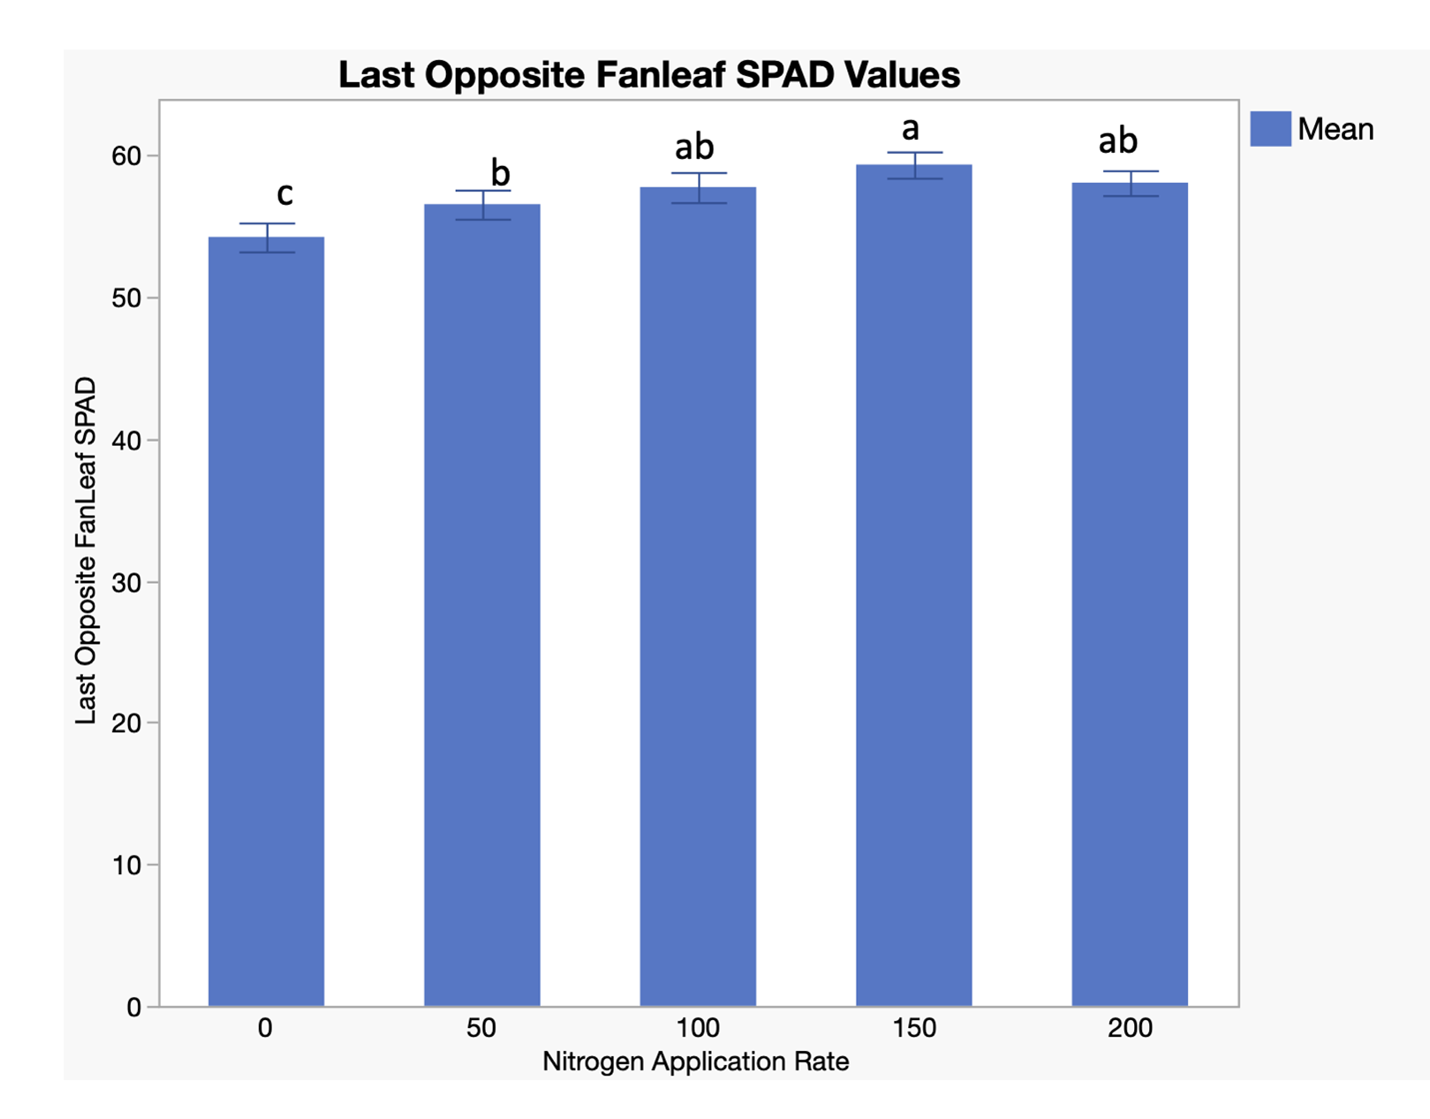
Figure 2. Last opposite fanleaf SPAD values as a function of N rate.
The ratio of the last opposite to alternate fanleaf SPAD values was calculated and analyzed. While the last opposite fanleaf SPAD values were statistically significant, the ratio of the last opposite to first alternate was not statistically different. The reasons are likely that the plants were too small at this stage, and the two leaves do not have sufficient separation on the plant to see a real difference (Figure 3).

Figure 3. Fanleaf SPAD ratio – no treatment effect.
At Flowering Plant Size and SPAD Values
Plant height at flowering was influenced greatly by soil and environmental conditions leading to a significant year*location interaction (Table 4).
Table 4. At Flowering Hemp Area and SPAD Value Measurements across years, locations and N rate.
|
N-Rate |
Height (cm) |
Branch Pairs |
4th leaf SPAD |
8th leaf SPAD |
Ratio 8:4 |
Fanleaf Total N |
|
0 |
118a |
16.6a |
53.8c |
49.4a |
0.87a |
3.51b |
|
50 |
120a |
17.1a |
55.1bc |
51.1a |
0.86a |
3.64ab |
|
100 |
122a |
16.5a |
58.8abc |
53.3a |
0.88a |
3.67ab |
|
150 |
122a |
17.1a |
60.4ab |
55.7a |
0.89a |
3.9a |
|
200 |
123a |
16.8a |
62.5a |
55.2 |
0.92a |
3.8a |
|
(p<0.05) |
NS |
NS |
** |
57.5a |
NS |
|
|
Location |
|
|
|
|
|
|
|
UMRF |
137a |
15a |
52.7b |
45.1a |
0.54a |
3.72a |
|
UVM |
106b |
19b |
62.5a |
61.7b |
0.97b |
3.68b |
|
(p<0.05) |
** |
*** |
*** |
*** |
|
|
|
Year |
|
|
|
|
|
|
|
2021 |
117b |
16.8 |
58.7b |
57.9a |
0.98a |
2.87a |
|
2022 |
121b |
17 |
61.7b |
56.4a |
0.96a |
3.98b |
|
2023 |
125a |
16.7 |
53.8a |
45.9b |
0.76b |
4.25c |
|
(p<0.05) |
*** |
NS |
*** |
*** |
|
|
|
|
Yr*Loc |
Yr*Loc |
Nrate*Yr*Loc |
Nrate*Yr*Loc |
Yr*Loc |
Nrate*Yr*Loc |
Plant height was apparently more influenced by environment and growing conditions than N fertilizer application rates over the six site years of research. This is likely due in part to the response of hemp to N being considerably less than most agronomic crops. Data for the number of branch pairs follows closely with that found with plant height as there was also a significant year*location interaction.
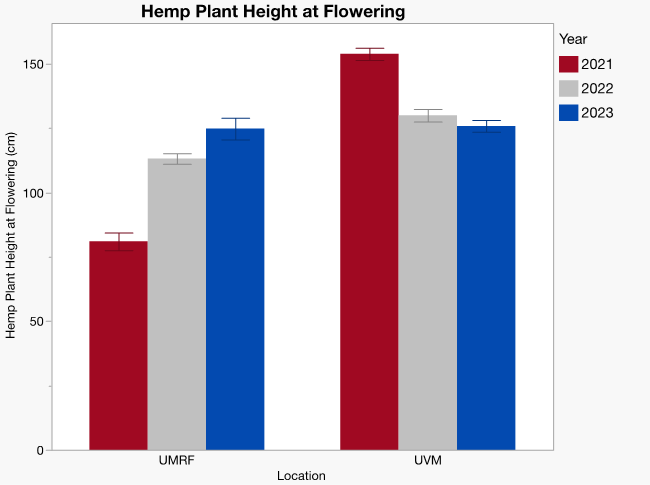
Figure 4. Significant hemp plant height as affected by location and season.
The N-testing methods to look at the 4th and 8th fanleaf SPAD were heavily affected by the intensely wet 2023 year at Orono. The field was very wet when we pulled fan leaves for total N and SPAD analyses. Later that week, we received an additional 6 inches of rain the following week which drowned several plants (see image 2). So, we ended with a significant location*year*N rate three-way interaction. This extreme environmental condition affected the values collected in 2023 from Maine.
Based on these data, including the Maine 2023 data, this would indicate that our testing methods that we initially thought would be very helpful to at least assess the following year’s fertility program for floral hemp are not particularly sensitive to N. Fanleaf total N was influenced by N, but even the 0-N rate had a total N content that was considered to be adequate for growth according to Cochrane et al., (2019). So, more work is needed under more growing conditions, more varieties, and environments to better understand strengths and weaknesses of various testing methods in floral hemp production.
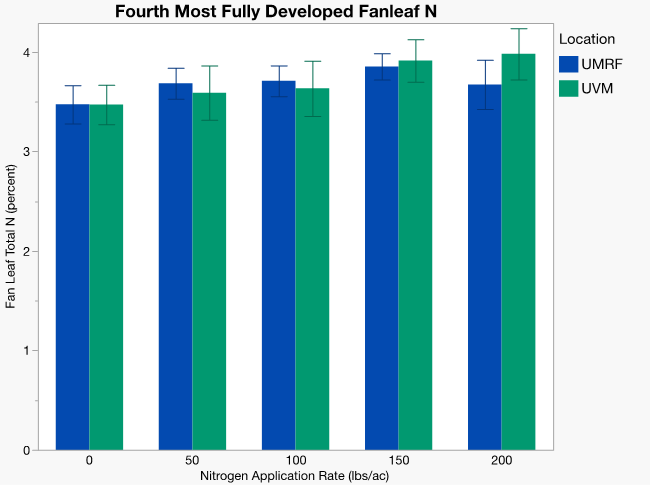
Figure 5. Fanleaf total N as influenced by N rate
Whole Plant and Floral Yield
Whole plant dry matter yield was highly variable across treatments and locations. Nitrogen is needed by this plant, but not at the 150 lbs N/ac rate that the University of Maine was recommending (Figure 6).
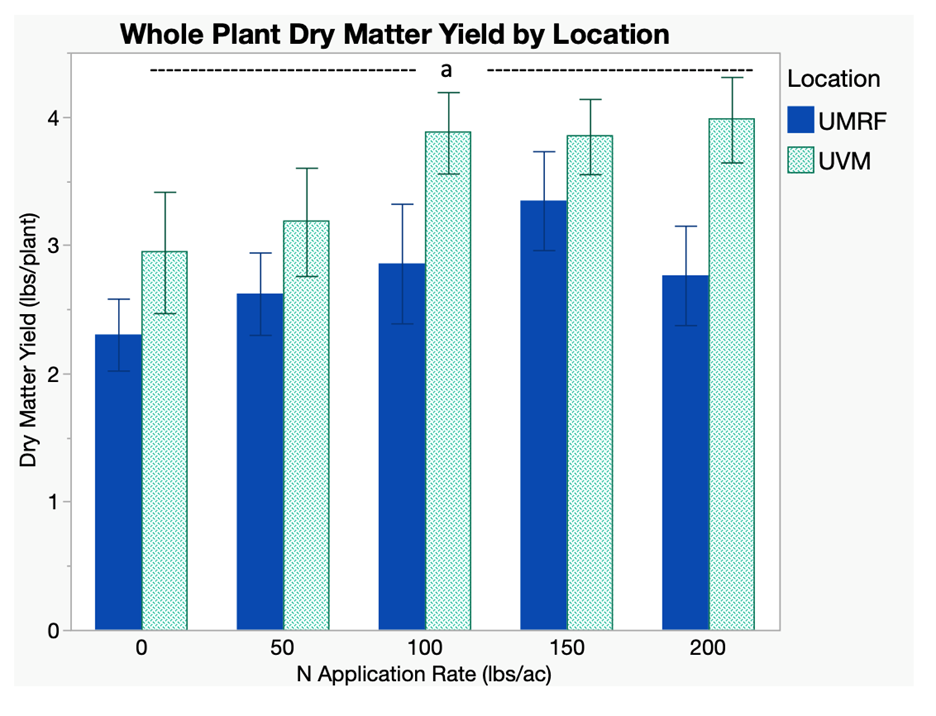
Figure 6. Response of floral hemp whole plant dry matter to applied. After completing five site-years of research, it appears that 100 lbs N/ac is an appropriate amount of N to apply to floral hemp.
Floral yield was also not influenced by N rate or location (Figure 7). Several reasons are suggested for this. There is an incredible amount of phenotypic variation within the same variety resulting in size and shape differences for floral hemp plants. The yield is dependent on time in flowering, environmental conditions, and soil type. Given that, we did not see any differences in N application rate on amount of flower harvested. However, it still seems that the plant requires some N. The 100 lb/ac rate seemed to produce the most biomass, and the more biomass generally the more flower or at least there is more photosynthetic processing area.
However, N really seems to not affect yield in the work we have done much to date.
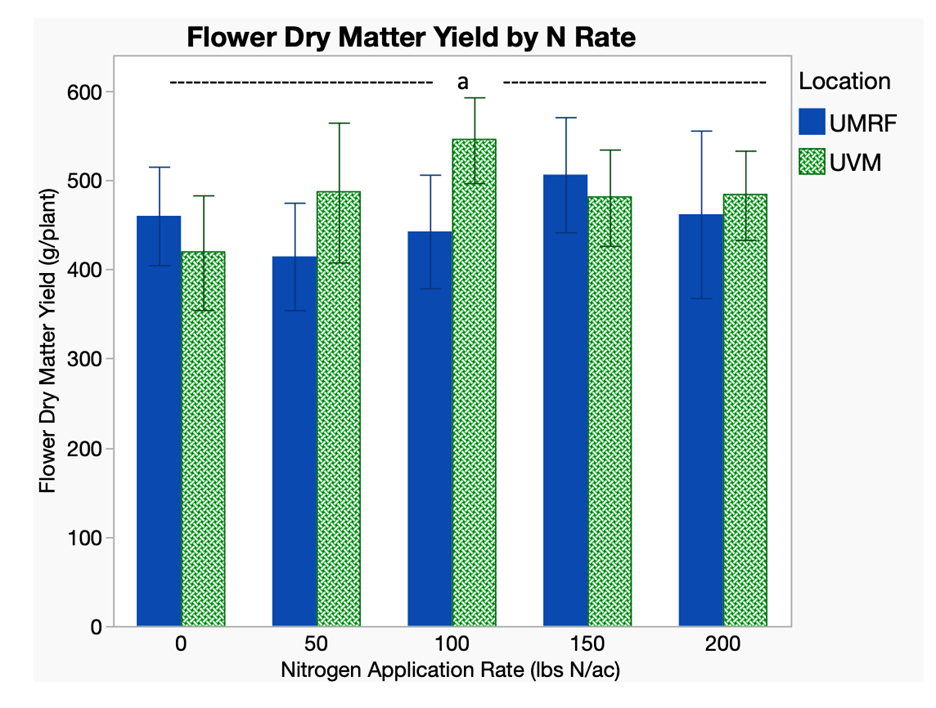
Figure 7. Floral hemp flower yields as influenced by N rate and location.
Total CBD, Total THC, Total Cannabinoid Content and Total Cannabinoid Yield.
The flower total CBD concentration was influenced by location, primarily due to the later harvest date. The longer the plant can be in flower, producing trichomes, the higher the cannabinoid concentration can be. Nitrogen rate however had no effect on total cannabidiol concentration (Figure 8).
In addition, the total THC concentration was similar with the UMRF location having a significantly higher concentration due to more time in flower. The UMRF average concentration was 4.8 mg/g while the average at UVM was 4 mg/g. The total cannabinoid concentration was significantly higher than that found at UVM by approximately 30%, but N application rate had no effect.
Lastly the cannabinoid yield was also affected only by location with the UMRF site producing approximately 23% higher yield due to the later harvest date (Table 3b). The risk of allowing the flower to produce the highest cannabinoid rate is that THC levels can also spike leading to legal issues. But N rate had no effect on cannabinoid concentration or yield.
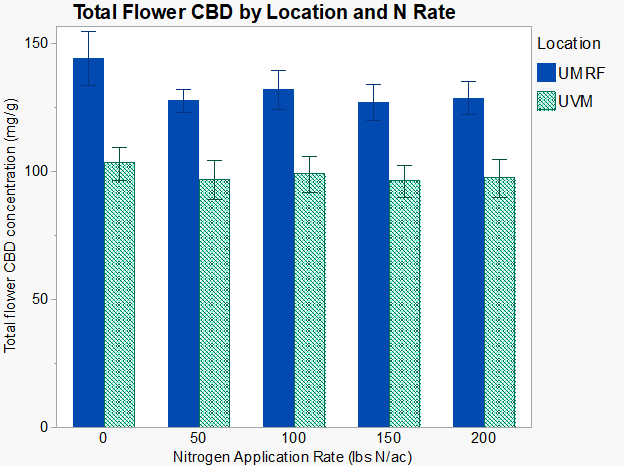
Figure 8. Lack of N application rate effect on hemp flower concentration.
N-rate Trial Conclusions
Floral hemp plants are not like commodity crops (corn, small grains etc). Floral hemp needs some N, but not at all like the commodity crops we are familiar with like corn and small grains.
We were able to show that time in flower is key to optimizing total CBD production, but the UMRF location with 2-3 weeks more time in flowering had 30% more CBD but also had much higher THC concentrations putting the crop at risk for noncompliance.
Both the University of Vermont and the University of Maine have dropped their N recommendations to 100 lbs N/ac per season. Most apply that N weekly though irrigation, but not all.
The N-testing methods need more testing. They did not predict a need for additional N because for the most part, flower production was relatively not affected by N rate.
Keys to improving this crop will be based on reducing plant genetic variability. Further, while hemp grain production is strongly influenced by N, flower production appears to be much less influenced by N application rate.
Rotation Study Results.
Rotation Study - 2021
Hemp Growth and Development
At one month following transplanting, plant height and total node count were collected. These plants responded to the site and grew rapidly (Table 5), and average hemp height at one month after planting was 62 cm, a full 50% taller than the average height in the nitrogen response trial. By flower initiation, the resinous hemp plant growth had almost doubled in height, and by harvest the plants were on average about 180 cm tall.
Table 5. Rotation plant measurements in 2021.
|
Location
|
Plant height (cm) |
Plant yield |
Dry matter yield |
Flower yield
|
Plant total CBD |
Total flower CBD |
Total flower THC |
||
|
UMRF |
1-month |
At flower |
Harvest
|
(lbs/plant) |
(mg/g) |
||||
|
2-years hemp |
60 |
114 |
171 |
18.9 |
4.7 |
6.6 |
16.4 |
138 |
6.4 |
|
3-years hemp |
65.6 |
123 |
191 |
20.3 |
5.2 |
5.9 |
17.3 |
107 |
4.7 |
|
p<0.05 |
NS |
NS |
NS |
NS |
NS |
NS |
NS |
NS |
NS |
|
|
|
|
|
|
|
|
|
|
|
|
UVM-Alburgh |
|
|
|
|
|
|
|
|
|
|
2-years hemp |
*** |
*** |
155 |
16.9 |
5.6 |
5.7 |
- |
- |
- |
|
3-years hemp |
*** |
*** |
160 |
16.1 |
5.3 |
5.4 |
- |
- |
- |
|
p<0.05 |
|
|
NS |
NS |
NS |
NS |
- |
- |
- |
*** Data not collected in first year at UVM-A location
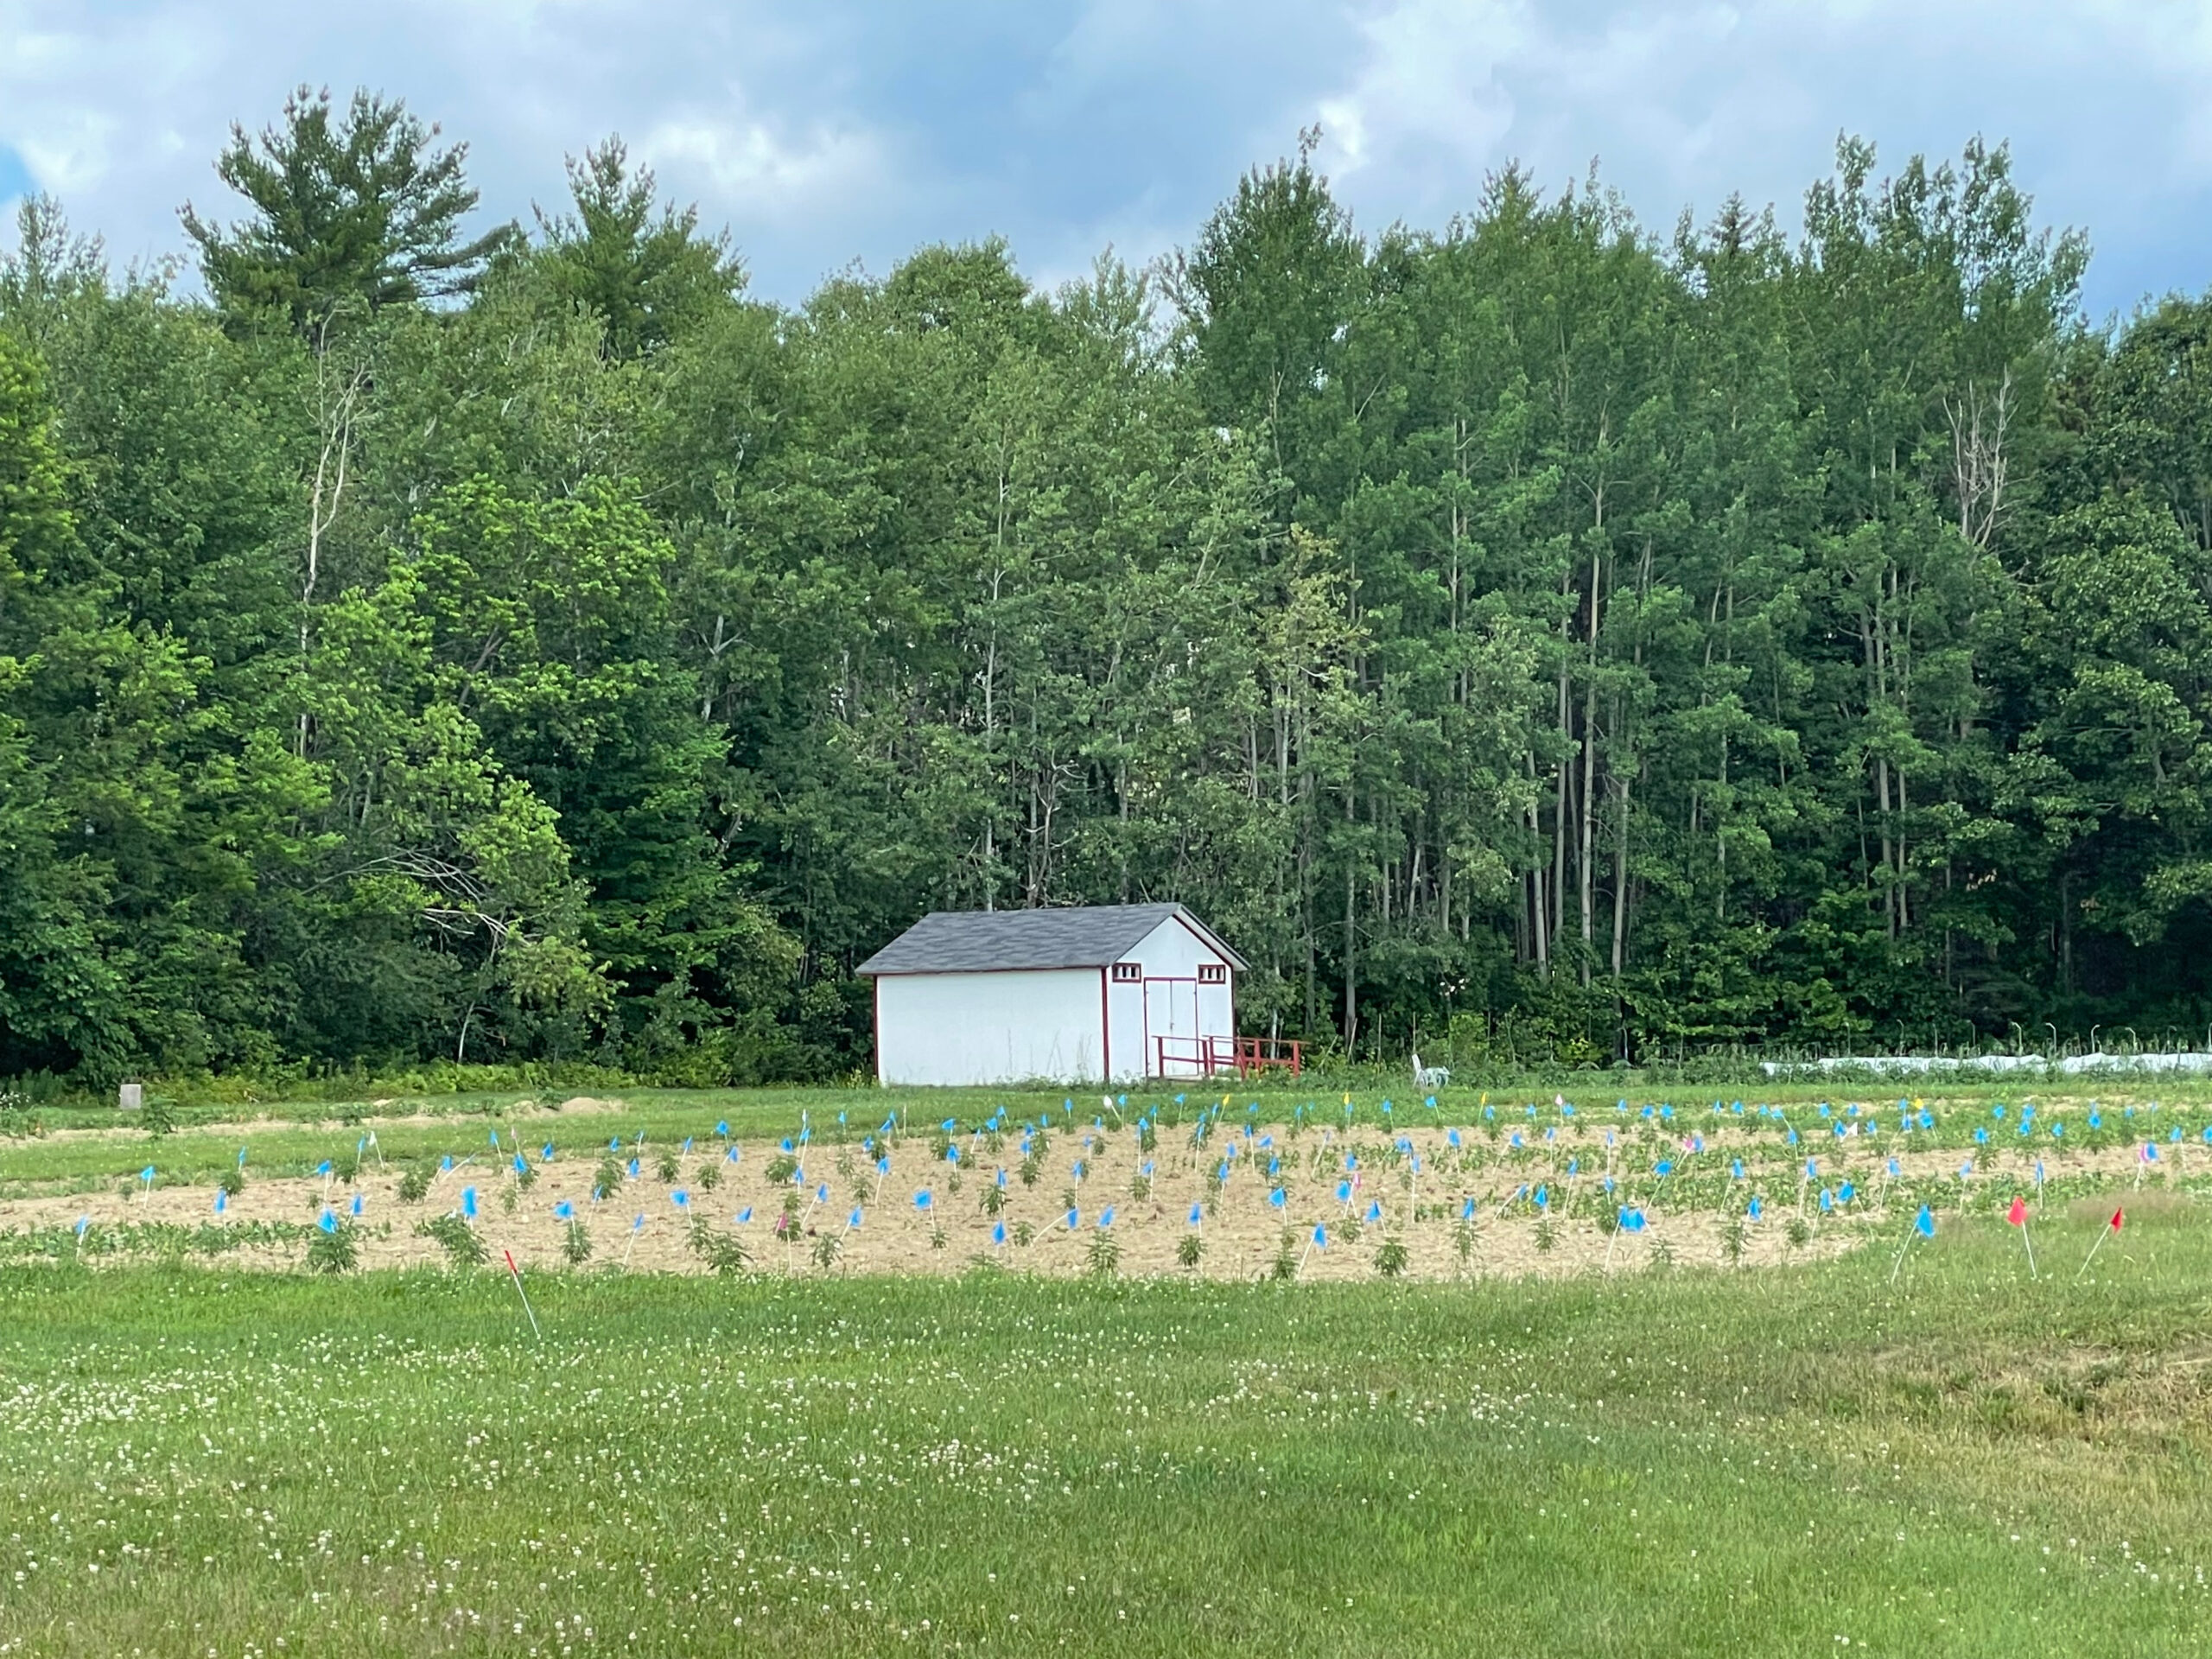
Images 4 and 5 – 2021 Rotation study UM-RF
Background insect and disease levels were very low at both locations.
Harvest: Yield and Cannabinoid Content
There was no significant differences in yield among treatments in ME or VT. In ME, the average plant weight was 20 lbs and flower production was large at approximately 6.3 lbs per plant. We also found that the flower CBD and THC production averaged about 122 and 5.5 mg/g. In Vermont, plants were similarly sized reaching up to 20 lbs total plant biomass, averaging approximately 16.5 lbs. Flower yields were also comparable at 5.5 lbs per plant in the first year of this study.
Fava Bean Yield
Fava bean yield was limited due to the botrytis disease setting back plants. This is Botrytis fava and this is a different botrytis than that which affects hemp. Yield averaged 1220 lbs of biomass per acre with a seed yield of 580 lbs/ac.
String Bean Yield
Across the peak three-week harvest window, string bean plot yields averaged 3698 lbs of beans per acre.
Rotation Crop Harvest - 2022
Conditions for growth and development were good in 2022, and it was a better year environmentally for the hemp and sweet corn in ME. Rainfall was lower than the long-term averages in June and July, but the field never had to be irrigated to keep the plants alive, unlike in 2021. Sweet corn was the rotation crop in 2022, and it yielded fairly well at both Alburgh and Stillwater. Fertilizer applications were made pre-plant to the corn and hemp plots. Fertilizer applications of 50 and 100 lbs P2O5 and K2O were applied and N was applied at 70 lbs to the acre preplant and top dressed with an additional 50 lbs N. Corn yield for treatments “1-year” hemp rotation (including bean, corn, hemp treatment) and “2-year” (including hemp, corn, hemp treatment) are presented below (Table 6). There were no rotation effects on the sweet corn yield. Both ear number and weight were not significantly affected by the rotation or by location.
Table 6. Sweet Corn Yields – 2022
|
Variables |
|
Ear Number |
Ear Weight |
Ear Number /ac |
Ear Weight/ac |
|
Rotation |
1 year (sweet corn) |
58.9 |
48 |
20539 |
16725 |
|
|
2-year (sweet corn) |
54.7 |
44.7 |
19070 |
15229 |
|
|
|
NS |
NS |
NS |
NS |
|
Location |
UMRF |
58.3 |
47 |
20299 |
16366 |
|
|
UVM |
55.4 |
44.7 |
19319 |
15588 |
|
|
|
NS |
NS |
NS |
NS |
Image 7. Sweet corn at UMRF
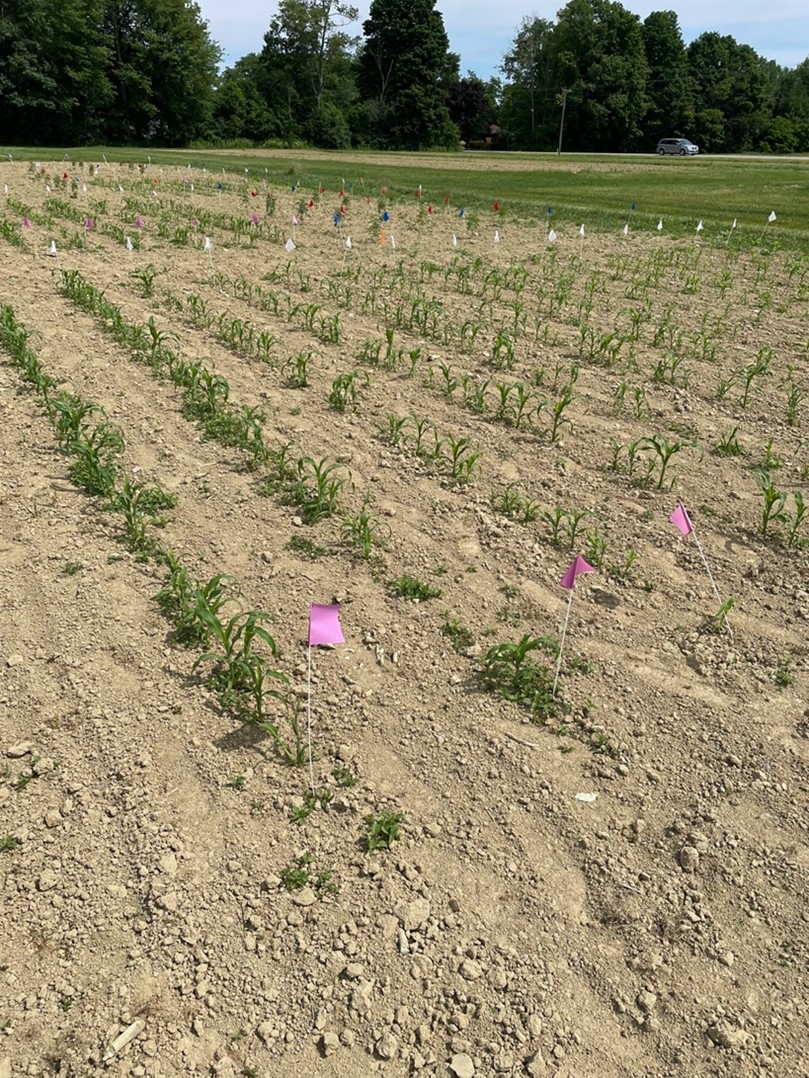
Image 8. Hemp and sweet corn in August at UMRF.
Hemp Harvest - 2022
The hemp yields were affected by environment in 2022. In Vermont, yields were low due to excessive moisture, while the UMRF site had a very favorable production year. In contrast, the UMRF site had a very wet late July and September in 2021, leading to poorer yields than the UVM site. As a result there were significant location and year differences, but not likely due to rotation effects but likely only environmental conditions (Table 7).
Table 7. Rotation hemp harvest data.
|
Year |
Area
|
Hemp Matter Yield
|
Flower Dry Matter Yield |
Flower CBD |
Flower Total THC |
Flower Total Cannabinoids |
Flower CBD yield
|
Flower THC yield |
|
|
(m2) |
(lb) |
(g) |
(mg/g) |
(g/plant) |
|||
|
2021 |
2.97 |
5.35 |
627 |
107 |
4.5 |
117 |
67.2 |
2.8 |
|
2022 |
1.61 |
2.04 |
264 |
98.4 |
3.95 |
121 |
27.9 |
1.1 |
|
|
|
|
|
|
|
|
|
|
|
Location |
|
|
|
|
|
|
|
|
|
UMRF |
2.8 |
3.94 |
478 |
114 |
4.7 |
140 |
54 |
2.3 |
|
UVM |
1.78 |
3.43 |
412 |
92 |
3.7 |
99 |
41 |
1.7 |
Figure 9. Hemp following sweet corn harvest, 2022.
2023 Results
Background soil information and experimental sampling dates are found in Tables 2b and 3b. Plants were assessed for growth and development, leaf color, and disease and insect ratings at one- and two-months post-transplant and at harvest.
Plant development across locations was influenced by the excessive rainfall in the 1-month post-transplant period. Due to excessive rainfall in July in Vermont, the UMRF plants were significantly larger at one-month post-transplant, and the hemp plants without rotation were the largest plants in the studies but the branch pair numbers were similar across locations (Figure 10).
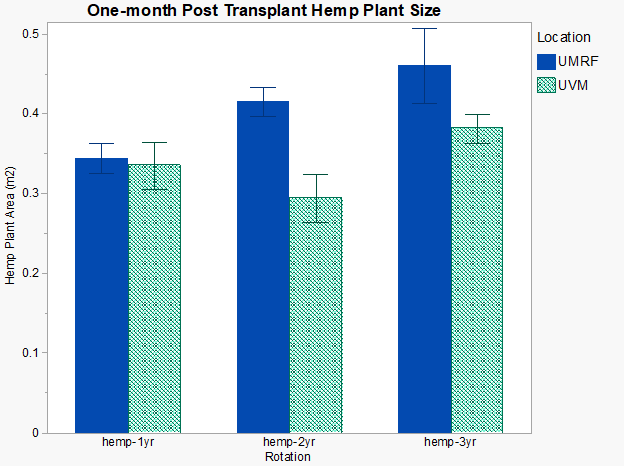
Figure 9. Hemp plant area as affected by rotation and location.
In terms of leaf disease, leaf spot incidence was significantly higher in the continuous hemp rotation. The three-year hemp had a significantly higher incidence of leaves with Septoria than the first-year hemp. The second-year hemp was intermediary (Figure 10). As well, the highest severity of leaf spot damage was also found with the continuous hemp.
Incidence of leaf chewing insects was significantly higher at UMRF than UVM. Approximately 30% of the leaves sampled had some leaf chewing insect damage but it was not related to rotation length. In each treatment across locations, all damage was less than 5%. Leaf sucking insect incidence was also higher at UVM with more aphids and thrips, but not based on rotation length.
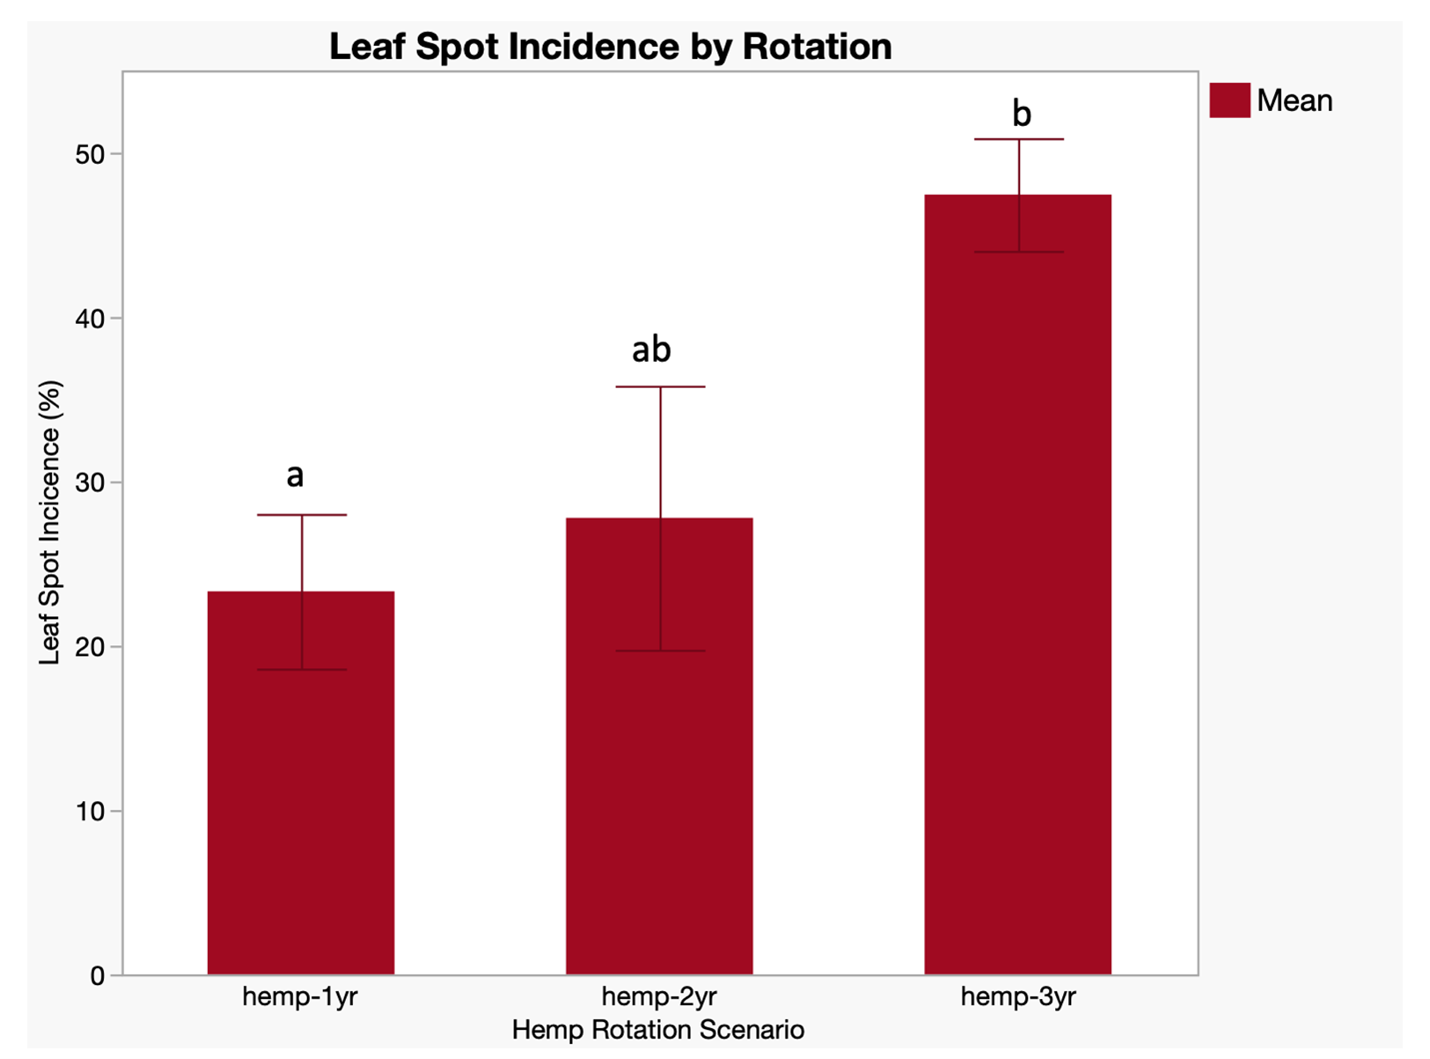
Figure 10. Incidence of leaf spot (Septoria sp.) based on years in hemp production.
Two Months Post-Transplant
Plants grew well over the subsequent month of development. Maximum plant area was measured at both locations, and there was a significant difference again based on hemp rotation length, but the effect at flowering was less than at the one-month post-transplant (Figure 11). Branch pair counts were higher at UVM than UMRF, but there was no effect of hemp rotation on branch pair counts (data not presented).
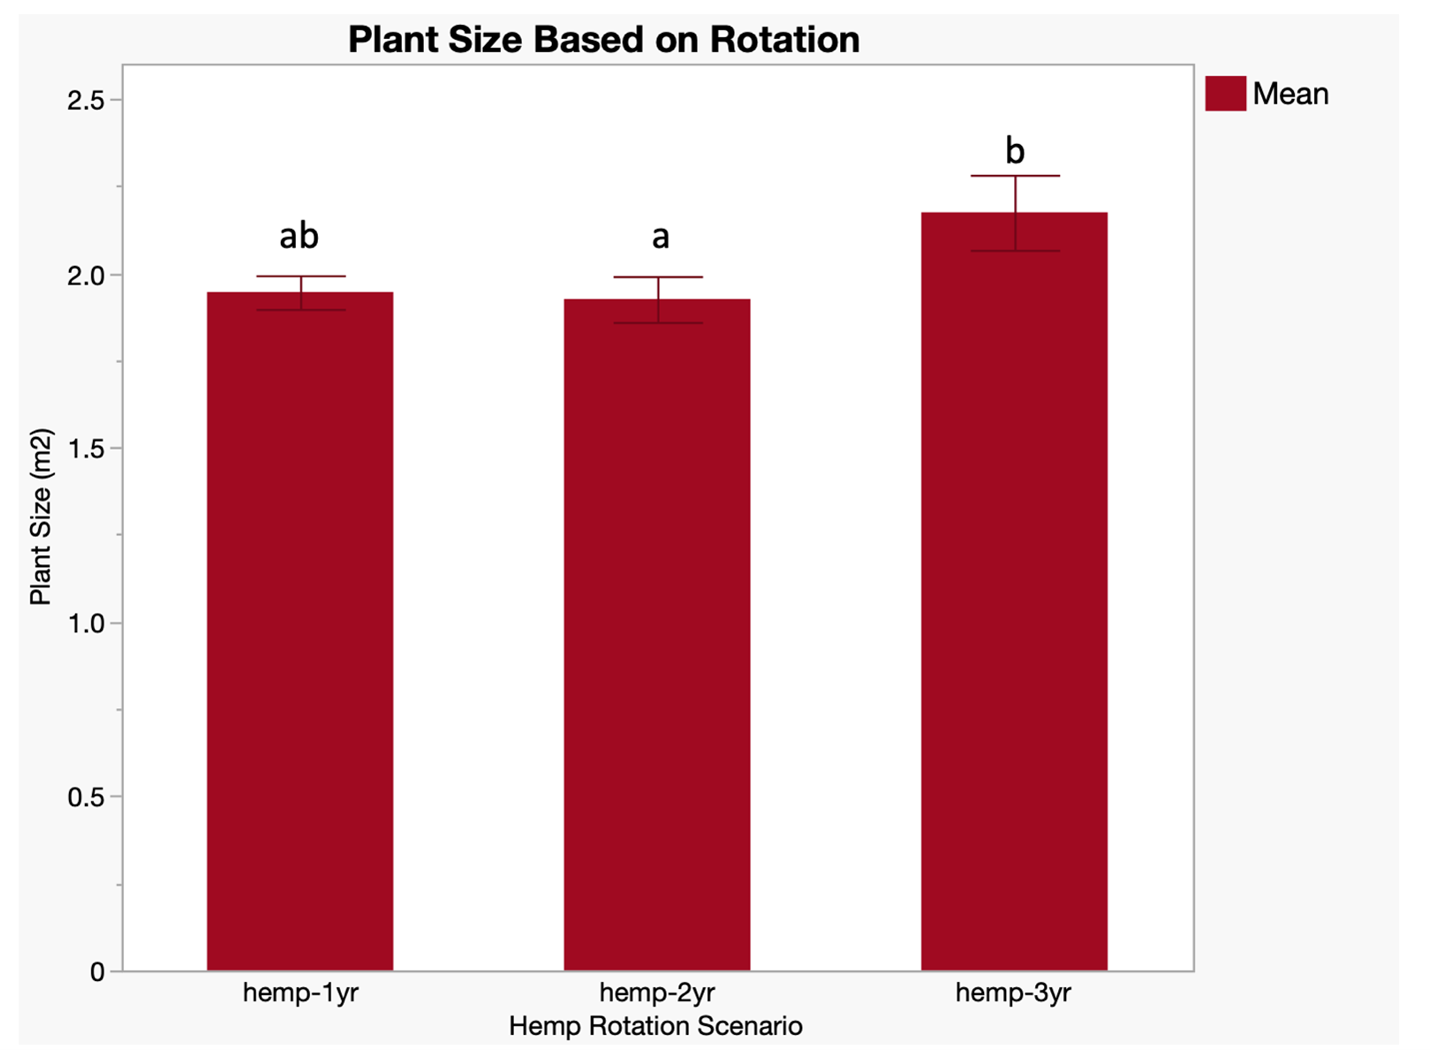
Figure 11. Plant size at flowering based on years in hemp production.
There was no fan leaf color difference between rotation lengths. There was less than one chlorophyll SPAD unit difference by treatment indicating that the soil nitrogen availability by rotation was similar among the rotations at both locations. The fan leaves from the 8th branch pair down were not different at either location or rotation evaluated. The 4th branch fan leaf registered a deeper green color than UVM, but that could be differences in meter calibration between the two sites. The ratio calculated between the 8th and 4th branch pair was not different between the two locations or rotations.
Disease and insect evaluations at flower initiation
Septoria was the most important disease experienced in these studies. At flowering, ratings were taken on incidence and severity as was done in July. We found significantly higher levels of incidence and severity by sampling date and rotation (Figure 12). Not surprisingly, the second sampling date had significantly higher levels of incidence and severity compared to the first, and again, the leaf spot was higher where hemp was grown continuously.
The issue with Septoria is that with significant infection, the plant leaves will turn brown (or fire) and cannot adequately photosynthesize, and the other issue is that the issue builds over time as inoculum levels increase in the soil. Plant breeding to support resistance will be the key to controlling this pest.
Incidence of leaf chewing insects did increase from one-month to two-month post-transplant, but there was no effect of rotation.
Weed management changes by rotation and location
Weed biomass was sampled at flower initiation, and there was a great deal of variability in the weed density across the fields, but there was no rotation effect. There was only a significant difference in the amount of annual broadleaf weeds by location. Much of our annual broadleaf weed was galinsoga, lambsquarters, and pigweed. The magnitude of the difference between rotations was found with the 3-years of hemp having slightly lower weed density, despite the fact that the hemp spacing was wide and weeds did move in and drop seed.
Table 8. Rotation and location differences in Weed populations by weed type.
|
Rotation |
Annual Grass |
Annual Broadleaf |
Perennial Broadleaf |
|
|
(g/m2) |
||
|
1-year hemp |
74.6a |
304a |
2.6a |
|
2-years hemp |
109a |
306a |
2.7a |
|
3-years hemp |
115a |
235a |
1.3a |
|
|
NS |
NS |
NS |
|
Location |
|
|
|
|
UMRF |
111a |
397a |
1.9a |
|
UVM |
88a |
166b |
2.4a |
|
|
NS |
** |
NS |
Hemp harvest
Just prior to harvest, hemp was surveyed for disease and insect incidence. By September, following a wet August, leaf spot spread quickly across the study (Figure 12).
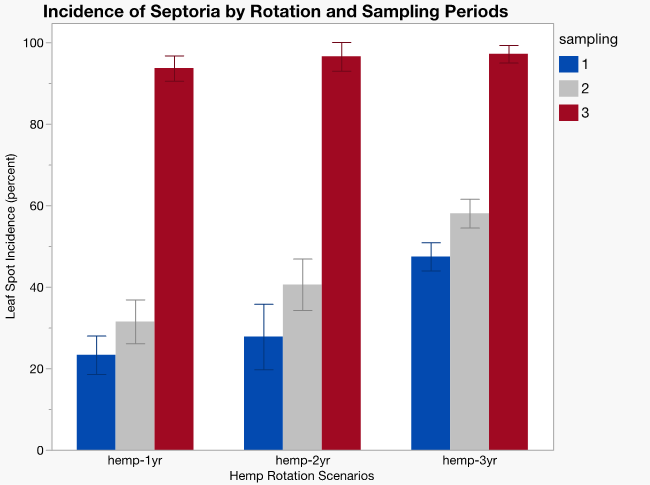
Figure 12. Leaf Septoria sampled across locations and rotations. Note the significant increase over the season.
At each sampling period, hemp rotation significantly affected leaf spot with more years in hemp likely increasing the spore production and reinfection potential. As well, the extremely wet August created perfect conditions to spread Septoria.
Hemp dry matter yield
Hemp was harvested in Vermont at the end of September and in Orono in early October. Plant yields were similar to those of 2022 and 2021 (Figure 13). Whole plant dry matter yields in 2021 were between 5.6 and 5.2 for the 2-year hemp and 3-year hemp. In 2022, yields were more variable and lower at 3.9 and 3.6 lbs at UVM and UMRF respectively. At each plot, we took whole plant yield measurements on five plants to reduce the variability, but still no significant rotation differences were found. Hemp dry matter yield was affected by location, but there was no rotation effect.
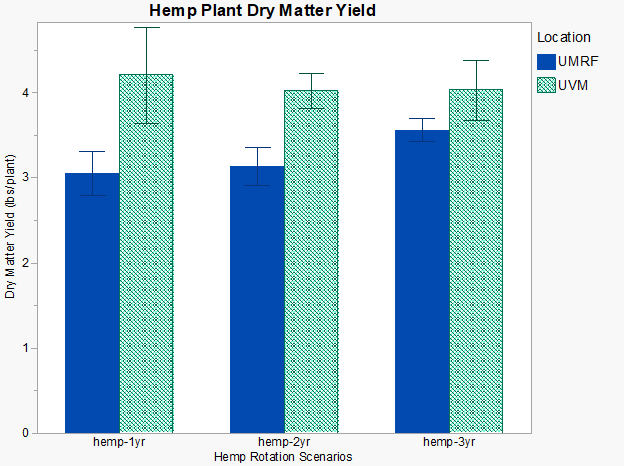
Figure 13. Hemp dry matter yield by location with no significant rotation effect.
Flower Dry Matter Yield
Most growers are primarily concerned about hemp flower yield and quality, and less about overall size. A few Maine growers still in business like to have smaller plants due to ease of harvest, and they intentionally transplant as late as early July to intentionally have smaller plants.
Hemp flower dry matter yield in 2023 was affected differentially by location and treatment (p<0.007) (Figure 14). Whereas whole plant dry matter yield was not affected by rotation, the flower yield response was different by location leading to the interaction.
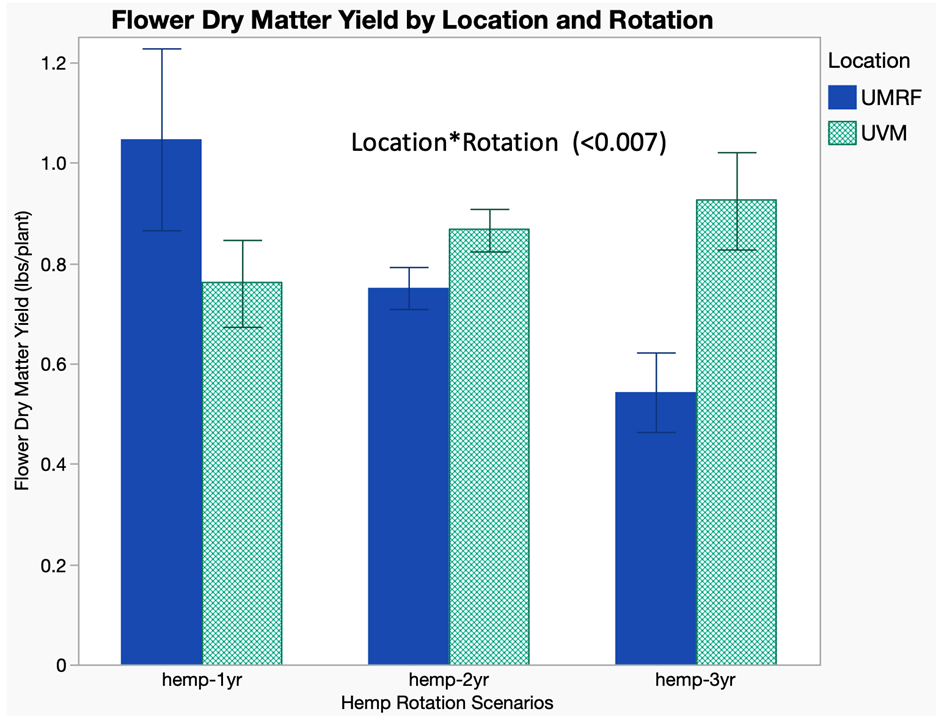
Figure 14. Hemp flower dry matter yield by rotation and location
There was a significant location effect on the amount of bud rot found in 2023. Although not significant, if one took the total flower dry matter yield plus the amount of unmarketable flower (caused primarily by grey mold in the flower) found at the two locations, the dry matter yield difference is greatly diminished and if analyzed with both marketable and unmarketable flower, there were no flower yield differences by treatment or location.
There was five times more unmarketable flower at the UMRF site due to the longer amount of time to flower and the extremely wet August (three times the 30-year average) which caused significant disease management issues (Figure 15). While there was not a significant treatment increase in unmarketable hemp flower with more years without rotating hemp, there is a trend toward more Septoria at one-month post-transplant, and there was a trend for increased incidence of grey mold with more years in hemp.
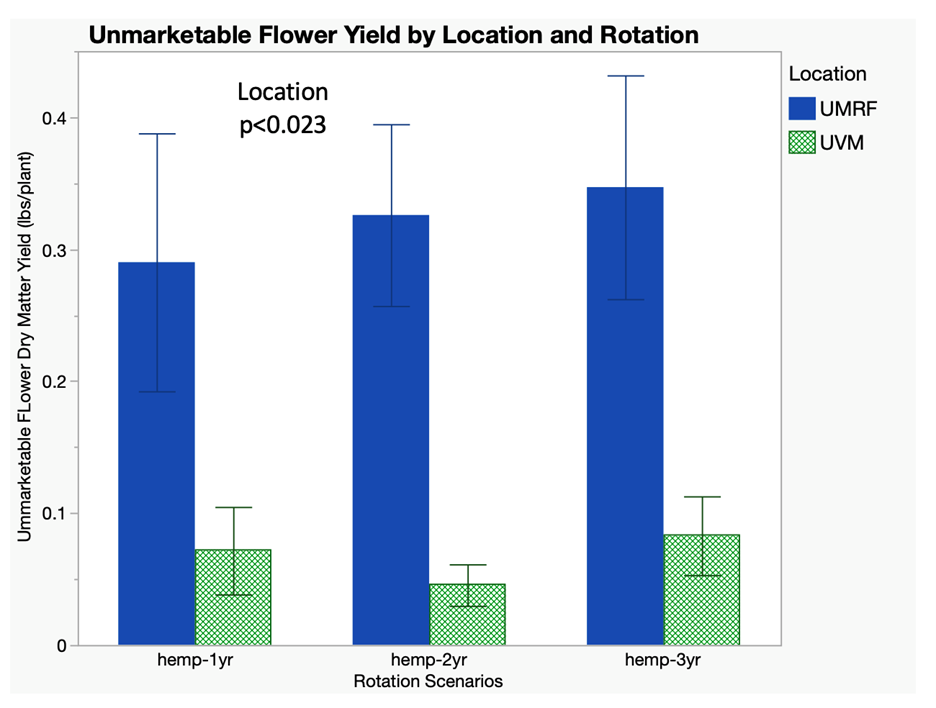
Figure 15. Significantly higher amount of unmarketable hemp flower at the UMRF location.
Total CBD concentration was affected only by location, with the UMRF site having significantly higher CBD concentrations with the extra week in flower. No treatment effect was found. CBD yield per plant had a very similar trend. The CBD yield was significantly higher than at UVM, and there was a trend toward higher productivity with one year of hemp in three compared to not rotating hemp in the rotation (Figure 16).
Plant to plant variability is extremely high with floral hemp. The experimental error is high whether one is measuring plant area, leaf disease, or yield. Breeding efforts in time will likely reduce the amount of within treatment variability. When the range associated with a standard error bar is 25% of the mean weight, it is almost impossible to determine treatment differences.
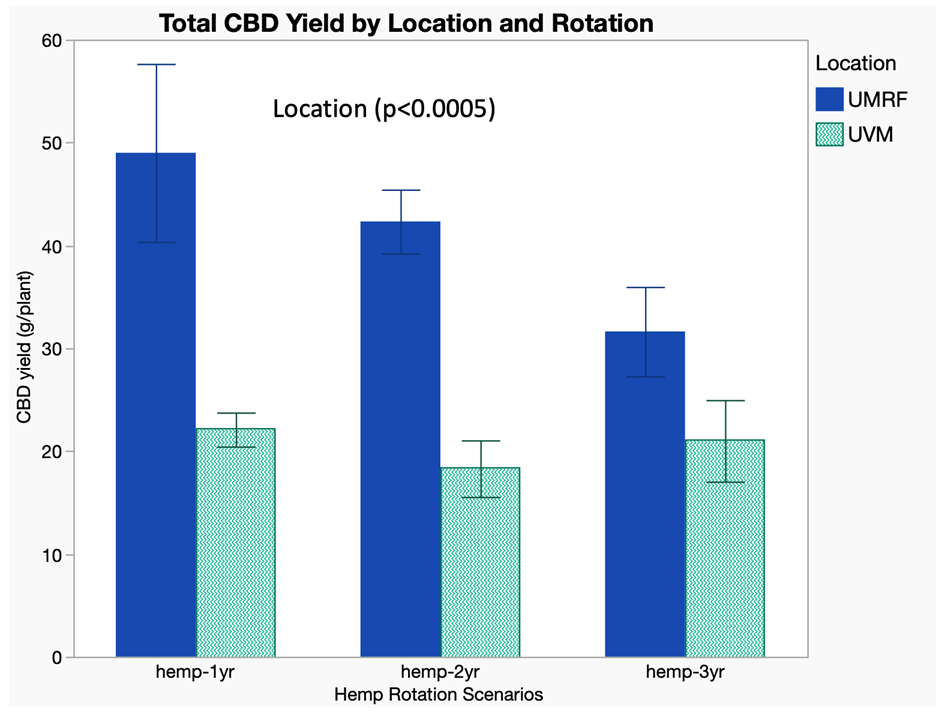
Figure 16. Total hemp flower CBD yield by location and hemp rotation scheme.
Changes in Soil Health by Years in Hemp Production and Location
Soil samples were collected at both locations and sent to the soil health lab for the Comprehensive Assessment of Soil Health (CASH) test. There were few if any significant changes in soil health over the three-year study (Table 9).
Table 9. Soil health measures as affected by rotation length and location
|
N-Rate |
Water retention rating |
Aggregate stability Rating |
Organic Matter |
Total C |
Total N |
Respiration Rating |
Active Carbon Rating |
Overall Score |
|
1-year hemp |
88.2a |
57.5a |
3.74a |
2.4a |
0.22a |
38.9a |
66.6a |
71.8 |
|
2-years hemp |
87.6a |
54.5a |
3.63a |
2.3a |
0.23a |
38.2a |
60.5a |
71.2 |
|
3-years hemp |
83.6a |
53.5a |
3.63a |
2.3a |
0.22a |
26.0a |
63.7a |
71a |
|
(p<0.05) |
NS |
NS |
NS |
NS |
NS |
NS |
NS |
NS |
|
Location |
|
|
|
|
|
|
|
|
|
UMRF |
88.3a |
89.4a |
3.66a |
2.21a |
0.21a |
0.54a |
43.4a |
70a |
|
UVM |
84.6b |
21.0b |
3.67a |
2.44b |
0.25b |
0.97b |
83.8b |
73a |
|
(p<0.05) |
NS |
*** |
NS |
0.05 |
*** |
NS |
*** |
NS |
At our state’s first meeting to develop hemp rules in 2016, many growers stated that they were confident that growing hemp improved soil health. These data indicate that there was no rotation effect on any soil health measures. Growing hemp three years in a row did not degrade soil health over growing hemp a single year or two years in three, and we have discussed this issue at all of our grower meetings and our on-line educational programs. Any differences found between locations seemed more an effect of different soil types between UMRF and UVM.
The results of these studies were surprising. Floral hemp responds very differently to N fertilizer compared to grain hemp varieties (Aubin et al., 2015). Grain and fiber hemp research have shown that the majority of nitrogen uptake occurs during the first month of growth during vegetative periods. This ends up being a similarly critical growth period for high cannabinoid hemp as well with the rapid uptake of nitrogen occurring during the vegetative production period. As much as 200 lbs/ac are needed to meet the crop needs of grain hemp, our data suggest that 100 lbs N/ac should be sufficient for floral hemp. The University of Maine recommended 150 lbs N/ac to all aspiring hemp producers, but from our work, 100 lbs N/ac should be sufficient and possibly even lower rates could be possible depending on soil conditions.
The N testing methods that we tried to develop were not reliable. The early testing method, conducted at approximately one-month post-transplant where additional N could be applied if it were needed, was found to not separate responsive and non-responsive hemp. The later testing protocols were a bit more robust but floral cannabis does not need N at flowering, too much late season N can hurt production. Simply sampling the fourth most recently fully matured fan leaf from the top of the plant, as described by Cochrane et al. (2019) seemed to be as useful of a method to assess N status as anything developed here. Further, we were unable to have our chlorophyll evaluation work on just one variety, let alone multiple varieties which were shown in previous work to have different depth of green supplied with a similar amount of N.
In the end, we have found from this work that 100 lbs N/ac should be sufficient to meet the needs of floral hemp, and recommendations have been changed as such. It is also important to note that between the Vermont and Maine trial sites, soils were
also within the ~3.5-4.0% organic matter range. Hemp plants grown within soils with higher concentrations of organic matter may also be capable of effectively scavenging nitrogen within the soil. Reducing applications to 50-100 lbs N ac-1 for flower hemp may be more beneficial from a yield and labor standpoint for soils with higher organic matter. Conversely, low organic matter soils may require higher concentrations of nitrogen to provide adequate flower yield
The three-year rotation studies also provided some useful information. We hypothesized that more years between hemp would increase production, improve soil health, and create a healthier growing condition. We showed that three years of hemp in a row does lead to significantly higher incidence and severity of Septoria and other leaf spots. We also hypothesized that three years of widely spaced hemp would have affected weed levels, but that was also not the case. Hemp yield and quality were not greatly affected by even three years in a row of hemp despite increased levels of leaf spot on hemp grown in three successive years. Additionally, we found no difference in soil health after growing hemp for as much as three years in a row compared to growing hemp in only one or two years out of three. Each of our locations scored high in terms of overall soil health from the onset of this study and lower initial soil health scores may result in more noticeable impacts during a three year rotation depending on growing conditions and other soil management practices.
Education
Education and Outreach
Over the course of this project, the number of hemp growers greatly declined within the three-year period. In 2023 anticipated class and event attendance dropped significantly in conjunction with market trends and associated transitions to state recreational grower’s licenses. At its peak, Vermont had 985 registered growers within the state for the 2019 growing season. In Vermont, 336 growers were registered in 2021, 89 in 2022, and only 33 in 2023. Maine saw similar trends with peak licenses issued in 2019 at 191 registered growers declining over the four year period. The overall number steeply declined over the period of this grant with only 49 registered growers in 2021, 17 growers in 2022, and ending with 9 registered growers in 2023. A combination of factors leading to these declines included the sudden influx of hemp growers after the passing of the 2018 farm bill which ultimately flooded the market, reducing the value of flower crops significantly. Furthermore, state adoption of recreational markets and transitions to federally regulated hemp programs in both Maine and Vermont lead to significant loss of interest for hemp cultivation as a primary business model. Comparatively, each state saw greater numbers of registered growers for the adult use cannabis market with 140 cultivation licenses in Maine, and 119 licenses in Vermont. Despite these challenges for growers, we were able to complete a wide array of additional outreach education events which reached the growers and technical service providers within our region.
2021 Completed Outreach and Education
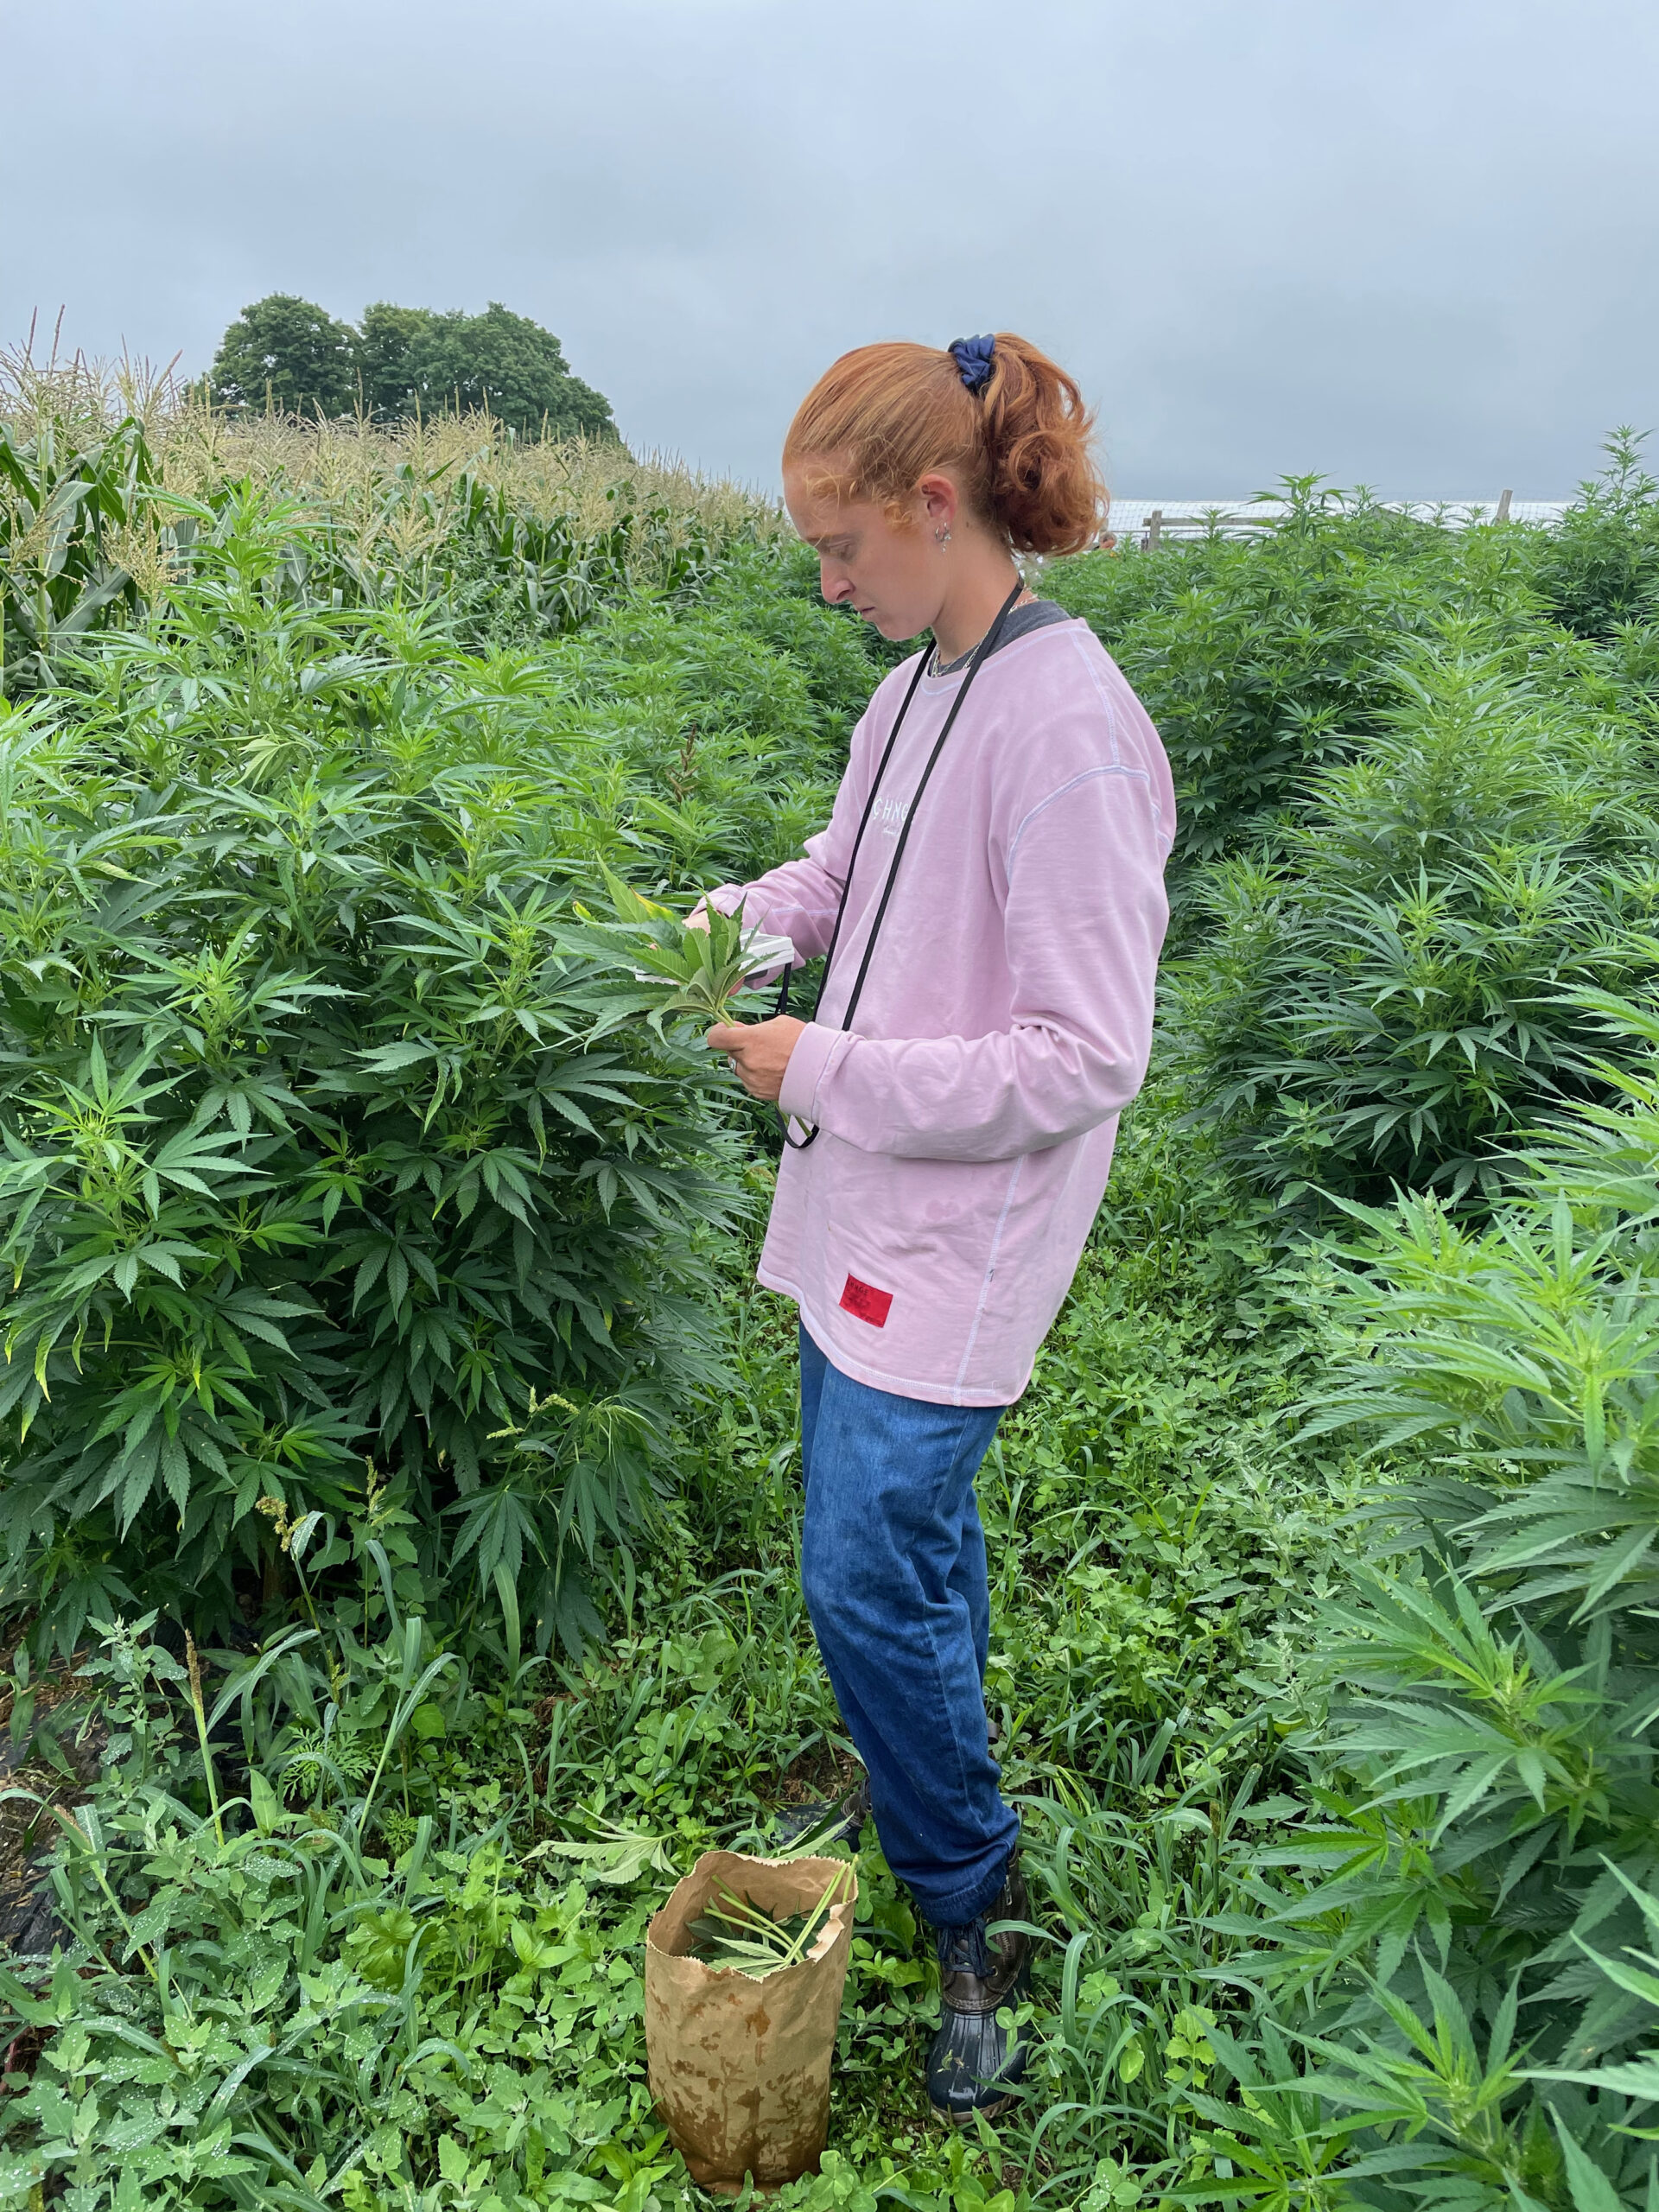
In terms of other educational efforts in 2021, UMRF held one hemp field day at the Rogers Farm in Stillwater Maine. We had 12 growers attend, two attended from the hemp program at the Department of Agriculture Conservation and Forestry, five certified crop advisors, and 4 educators. They witnessed rolling and crimping winter rye as a weed management strategy, we showed them the rotation study, and the nitrogen study. At the time of the field day - held 7/8/2021, the CBD hemp plants had been in the ground about 5 weeks, and we demonstrated the tools that we used to assess N status. In early August, Jemison visited eight farms to collect fan leaves and evaluate the N test which we will report on in a different section. But, Jemison was able to discuss hemp with growers, promote the educational training for the spring, and address any questions they had on a one-to-one basis. Additionally, UVM hosted hemp webinars throughout the growing season which helped to disseminate results of our ongoing hemp trials, focusing largely on nitrogen fertility management in floral hemp.
In Vermont, Dr. Darby and John Bruce conducted a field day and 43 people attended. They were able to see the nitrogen and rotation trials along with the other trials that were conducted at Borderview research farm. Additionally, UVM hosted hemp webinars throughout the growing season which helped to disseminate results of our ongoing hemp trials, focusing largely on nitrogen fertility management in floral hemp.
8/10/21 - Hemp Field Day – 43 attendees
9/28/21 - CBD Hemp Production Webinar & Youtube vieo – 34 attendees
https://www.youtube.com/watch?v=-7_RCpsG2A8
2022 Completed Outreach and Education
https://extension.umaine.edu/agriculture/hemp-production-science-and-uses/
Our key education effort for this grant was the online farmer class which involved a 5-week course open to all growers and technical service providers, taking place in 2022 and 2023. This course titles “Hemp Production: Science and Uses” provided detailed information on the history of hemp production in the U.S., plant physiology, hemp agronomics, legal considerations, and human interactions.
During the spring of 2022, we acquired contact lists of producers who had been licensed to grow hemp from 2018 - 2021 from Vermont and Maine. In Massachusetts it was illegal to give out hemp grower information. Jemison also offered the course to Certified Crop Advisors from the NY/New England region. We did not charge a fee to enroll in the class. Initially we had 48 people sign up, but 25 never attended. We charged this year's attendees $10 to register to ensure improved commitment to attend. Of the 23 people that did attend at least one class, 6 stopped after the economics and marketing class, leaving us with 17 people that completed the course and 12 people completed the course evaluation.
Of those attending, eight people grew hemp from 2019 on, two grew from 2020 on, four grew in 2021 only and eight new hemp growers attended the program. Of those who had grown in 2020 and 2021, we asked them to tell us the acreage that they grew in those years.
Table 1. Educational program attendees hemp acreage in 2020 and 2021.
|
Acreage |
2020 |
2021 |
|
none |
13 |
10 |
|
<1 |
8 |
10 |
|
one to five |
4 |
4 |
|
>5 |
3 |
3 |
One of the key goals with this educational program was to make growers aware of the importance of rotating hemp with other crops. Of those who responded, most were actually rotating their ground. Four growers said that they rotated ever other year; two growers grew hemp one in three. But, 10 responded in the pre-course survey that they were unsure (they likely didn't understand the concept of crop rotation. In the pre-survey, 3 of 5 people responded that they did not understand regulations well, but five of eight appeared to have a good understanding of cost of production.
We also asked our class participants what they found to be most challenging aspects of growing hemp.
Table 2. The most challenging aspects of growing hemp.
|
Climate |
Regulations |
Cost/profit |
Lack of marketing |
Processing |
Banking |
|
8 |
7 |
4 |
17 |
4 |
3 |
The Post-course survey results indicated that the people who completed the class learned a great deal.
Table 3. Survey results of improvement in understanding of specific aspects of hemp production after attending the program
|
Post Course Survey |
Respondents thought the course material covered topics… |
|
|||
|
Topic |
Poorly |
Moderately well |
Well |
Very Well |
Percentage of respondants who impoved their knowledge on given topic |
|
Regulations |
1 |
5 |
4 |
2 |
92 |
|
Cost of production |
2 |
5 |
2 |
3 |
83 |
|
Ability to troubleshoot problems |
0 |
3 |
5 |
4 |
100 |
|
Why to grow? |
0 |
4 |
7 |
1 |
92 |
|
Agronomics |
2 |
3 |
4 |
3 |
100 |
|
Pest management |
2 |
3 |
4 |
3 |
83 |
|
Nutrient management |
1 |
5 |
4 |
2 |
92 |
|
Water use |
1 |
3 |
4 |
4 |
92 |
|
Soil health |
0 |
2 |
4 |
6 |
100 |
|
Organic production |
1 |
3 |
5 |
3 |
92 |
|
Flowering |
1 |
2 |
6 |
3 |
92 |
|
Managing terpenes and cannabinoids |
0 |
7 |
3 |
2 |
100 |
|
Endocannabinoid system |
1 |
3 |
2 |
6 |
92 |
|
Harvest timing |
1 |
3 |
5 |
3 |
92 |
|
Post harvest handling |
1 |
1 |
6 |
4 |
92 |
|
End uses for hemp |
0 |
2 |
4 |
6 |
92 |
|
Marketing |
2 |
3 |
4 |
3 |
83 |
|
Course structure |
|
|
|
|
83% respondents thought the course material was about right. |
Lastly, when asked how much they had learned and the value of the course, 4 stated that they had learned a lot and were cautiously optimistic, while eight said that they had learned a lot and were much better prepared to start growing! So I believe we can certainly say that the course was successful.
2023 Completed Outreach and Education
1/25/23 – 1/26/23
2023 In-Service Training for Agricultural Service Providers, Certified Crop Advisors (CCA): 52 attendees
https://extension.umaine.edu/agriculture/in-service-training-cca/#agenda
N Management of Flower Hemp: Crop Response and Success of Testing Measures, Heather Darby and John Bruce, UVM
Weed Management in Hemp Production, John Jemison, UMaine Extension
As a result of sessions from this in-service training for technical service providers (TSP’s) 18 attendees submitted responses to surveys indicating that knowledge was gained from the presentations.
2/23/23
UVM Hemp Conference: 79 attendees
https://www.uvm.edu/extension/nwcrops/2023-industrial-hemp-conference
Industrial hemp flower sessions from the 2023 Hemp Conference and UVM field days (included below) addressed various agronomic practices which included topics of rotation and fertility management. Within each of these event a number of topics were addressed including CBD fertility, weed management, nitrogen fertility, crop rotation to name a few. UVM hemp conference included 79 total attendees and the UVM NWCS Annual Field day saw 181 attendees. From the industrial hemp conference, a number of growers indicated that information provided addressed concerns of their for production and access to markets with 78% of attendees planning to implement changes as a result of conference sessions.
|
2023 Industrial Hemp Conference Flower Session |
||
|
Question |
Answer |
% of Votes |
|
What are your biggest barriers to growing hemp |
Access to markets |
22% |
|
What are your biggest barriers to growing hemp |
Access to seeds, land etc. |
33% |
|
What are your biggest barriers to growing hemp |
Access to agronomic information |
33% |
|
What are your biggest barriers to growing hemp |
Regulations |
56% |
|
Question |
Answer |
% of Votes |
|
What are your biggest barriers to growing ? |
Access to markets |
81% |
|
What are your biggest barriers to growing ? |
Access to seeds, land etc |
14% |
|
What are your biggest barriers to growing ? |
Access to agronomic information |
14% |
|
What are your biggest barriers to growing ? |
Regulation |
14% |
|
Do you plan on implementing any changes as a result of these sessions? |
Yes |
78% |
|
Do you plan on implementing any changes as a result of these sessions? |
No |
22% |
3/3/23 - 3/31/23
UMaine Hemp Production Course: 12 attendees
5-week course designed for farmers and consultants who wanted to improve their understanding of why you might grow hemp, the key considerations involved, and what this plant might do for your customers that use it. A collaborative effort between UVM Extension NWCS and UMaine Extension Professor, John Jemison.
https://blog.uvm.edu/outcropn/2023/02/02/enroll-in-a-course-on-hemp-production/
https://extension.umaine.edu/agriculture/hemp-production-science-and-uses/
From the 12 attendees for the 2023 course, three survey responses were recorded. Of the these respondents, growers produced (or planned on producing) on average ~1-2 acres of hemp from the 2021-2023 growing seasons and had interest in flower, grain, and fiber production and produced in Maine, Vermont, and Connecticut. Grower’s levels of experience ranged from 2-4 years. As a result of this course, respondents indicated that knowledge was gained across a wide array of topics relating to hemp production. Those not planning on adopting a new practice or strategy also included technical service providers not producing hemp. Survey responses below:
|
Topic |
Gained knowledge (% of respondents) |
Adopted new practice/strategy (% of respondents) |
|
Basic agronomics |
66 |
33 |
|
Plant propagation |
66 |
0 |
|
Variety selection |
66 |
0 |
|
Nutrient management |
33 |
0 |
|
Soil management |
100 |
33 |
|
Crop rotation |
100 |
33 |
|
Cover crops |
100 |
33 |
|
Pest scouting/identification |
33 |
33 |
|
Integrated pest management |
66 |
0 |
|
Irrigation management |
66 |
0 |
|
Compliance testing |
100 |
0 |
|
Harvest timing |
100 |
33 |
|
Harvest strategies |
33 |
0 |
|
Post-harvest handling |
66 |
0 |
|
Quality testing |
33 |
0 |
|
Processing |
33 |
0 |
|
Business planning |
100 |
33 |
|
Regulations |
100 |
33 |
|
Marketing and sales |
33 |
0 |
|
Organic hemp production |
100 |
33 |
|
Other |
|
|
Indicating that they gained a “much higher level of details related to hemp production from start to finish,” that they were a “novice who learned a lot,” and were “more informed [as a] grower.”
7/27/23
UVM Annual Crops and Soils Field Day: 181 attendees
23 attendees participating in afternoon sessions around hemp production.
https://www.uvm.edu/extension/nwcrops/conferences-events-current-and-past
Milestones
Recruitment of hemp farmers to participate in the intensive 15 hours hemp-training program will occur through state hemp programs, current networks, and university websites reaching a pool of 1500 stakeholders.
1500
3
879
5
October 31, 2023
Completed
November 01, 2023
Growers and technical service providers from across the Northeast were provided information and participated in our outreach and education events. While only a small number completed the course materials, information was disseminated through a number of avenues including the online course, conferences, field days, program websites, listservs, and one-on-one interactions.
125 farmer participants will enroll and agree to complete the entire educational program including online hemp course, field days, and verification of performance target. Enrolled participants will complete a survey to document baseline knowledge. Fall 2021 and 2022.
125
5
48
5
October 31, 2022
Completed
December 01, 2023
In 2022, 44 people initially signed up for the course, only 23 people attended the first session, and 6 dropped out after learning about the issues associated with marketing and economics. 17 people completed the course in 2022. Farmers and technical service providers were solicited to attend our 2023 on-line hemp training course across New England through various networks. During the 2023 class 12 people completed the course reflecting the corresponding drop in interest in growing hemp that was seen throughout the Northeast.
https://extension.umaine.edu/agriculture/hemp-production-science-and-uses/
100 hemp farmers will complete the online training course that will allow them to learn about hemp production, regulations, harvest, post-harvest handling, and market options. A minimum of 90% will complete a post course survey and document improved knowledge in the subject areas covered. March 2022 and 2023.
100
5
10
5
March 31, 2023
Completed
May 01, 2023
Across 2022 and 2023, a total of 15 course attendees from the 35 participants completed the final course survey. This number was once again lower than expected largely as a result of industry trends with a number of attendees who had initially decided to grow hemp in the 2022 and 2023 growing seasons exiting the market in favor of recreational cannabis or other non-cannabis ventures.
100 hemp farmers that complete the course will receive hemp production recordkeeping booklets and be able to participate in virtual office hours to receive one-on-one technical assistance and further develop hemp production skills. 2022 and 2023.
100
30
5
May 31, 2023
Completed
May 31, 2023
Every attendee received record keeping booklets as well as additional supplemental course related materials.
75 of the hemp farmers that complete the course will participate in on-farm research to verify nutrient concentration ranges of hemp in the northeast and learn to fine-tune their fertility programs. July 2021
75
13
July 31, 2021
Completed
August 31, 2024
Both the UVM and UM groups offered to visit farms of hemp growers in 2021 and sample their crops for N status if they agreed to participate in the course. 8 growers were visited in Maine and 5 farms were visited in Vermont.
250 hemp farmers and service providers attend field days and learn about best management practices (rotations, IPM, nutrient management) that will help improve crop productivity. 2021, 2022, and 2023.
250
10
416
52
August 31, 2023
Completed
August 31, 2023
Field days were a success across the three year span reaching a total of 416 individuals. Attendees were provided with an overview of research results from the trials conducted within this scope of work with additional one-on-one interactions at every event. These events helped to inform growers on growing practices related to hemp as well as crop viability within our region.
2023 In-Service Training for Agricultural Service Providers, Certified Crop Advisors (CCA)
100 farmer participants in the hemp training program will complete the final survey to verify performance target. December 2023.
100
5
94
5
December 29, 2023
Completed
July 31, 2023
15 Farmers completed the final surveys for the course with additional surveys addressing key topic areas reaching a further 79 growers as a result of 2023 UVM Industrial Hemp Conference.
Milestone activities and participation summary
Educational activities:
Participation summary:
Learning Outcomes
Changes in knowledge base were verified through two main avenues: the online hemp production course that took place over two years of this project, and through the industrial hemp conference surveys. Results from both post course survey and conference are included below:
2023 Post course survey:
|
Post Course Survey |
Respondents thought the course material covered topics… |
|
|||
|
Topic |
Poorly |
Moderately well |
Well |
Very Well |
Percentage of respondants who impoved their knowledge on given topic |
|
Regulations |
1 |
5 |
4 |
2 |
92 |
|
Cost of production |
2 |
5 |
2 |
3 |
83 |
|
Ability to troubleshoot problems |
0 |
3 |
5 |
4 |
100 |
|
Why to grow? |
0 |
4 |
7 |
1 |
92 |
|
Agronomics |
2 |
3 |
4 |
3 |
100 |
|
Pest management |
2 |
3 |
4 |
3 |
83 |
|
Nutrient management |
1 |
5 |
4 |
2 |
92 |
|
Water use |
1 |
3 |
4 |
4 |
92 |
|
Soil health |
0 |
2 |
4 |
6 |
100 |
|
Organic production |
1 |
3 |
5 |
3 |
92 |
|
Flowering |
1 |
2 |
6 |
3 |
92 |
|
Managing terpenes and cannabinoids |
0 |
7 |
3 |
2 |
100 |
|
Endocannabinoid system |
1 |
3 |
2 |
6 |
92 |
|
Harvest timing |
1 |
3 |
5 |
3 |
92 |
|
Post harvest handling |
1 |
1 |
6 |
4 |
92 |
|
End uses for hemp |
0 |
2 |
4 |
6 |
92 |
|
Marketing |
2 |
3 |
4 |
3 |
83 |
|
Course structure |
|
|
|
|
83% respondents thought the course material was about right. |
2023 Hemp Conference survey:
|
2023 Industrial Hemp Conference Flower Session |
||
|
Question |
Answer |
% of Votes |
|
What are your biggest barriers to growing hemp |
Access to markets |
22% |
|
What are your biggest barriers to growing hemp |
Access to seeds, land etc. |
33% |
|
What are your biggest barriers to growing hemp |
Access to agronomic information |
33% |
|
What are your biggest barriers to growing hemp |
Regulations |
56% |
|
Question |
Answer |
% of Votes |
|
What are your biggest barriers to growing ? |
Access to markets |
81% |
|
What are your biggest barriers to growing ? |
Access to seeds, land etc |
14% |
|
What are your biggest barriers to growing ? |
Access to agronomic information |
14% |
|
What are your biggest barriers to growing ? |
Regulation |
14% |
|
Do you plan on implementing any changes as a result of these sessions? |
Yes |
78% |
|
Do you plan on implementing any changes as a result of these sessions? |
No |
22% |
Performance Target Outcomes
Target #1
50
Of the 100 farmers attending our intensive hemp training, 50 will improve crop management skills including crop rotation, improved nitrogen management, and reduced crop loss due to improved pest management.
50 acres of CBD hemp production
The farmers will see improved hemp yield of 200 lbs per acre on 50 acres
66
Changes to nitrogen fertilization on their hemp crop. Reducing nitrogen inputs on farm. Rotating crops to reduce disease pressure.
180 acres
Reduced costs of production for farmers through a reduction in fertilizer inputs.
While changes in the industry reduced the total number of registered growers in the region greatly, we were still able to meet a number of the outreach goals and performance targets through a strong base of farmers represented in our conference attendees and course attendees over the grant funding period. Project surveys were provided to 138 individuals that participated in the course, events, or on-farm research. Of the 158 participants that were sent surveys we received 84 completed surveys (53% response rate).
Verified data results from this project were obtained mainly through these two surveys in which 78% of respondents (66 individuals) indicated that they would or had made changes to their operation as a result of presented materials from UVM Hemp Conference. Additionally, 33% of course attendees indicated that they would make changes as a result of the materials.
Additional Project Outcomes
A new project was initiated with University of Kentucky to look more closely at diseases in hemp that seem to appear as a result of growing continuous hemp. The new funding is supporting additional years of the rotation study and more disease assessment and identification in these systems.
Developing rotations that integrate hemp are critical to the industry. This was a first look at rotations that might be implemented in the Northeast. However, longer term evaluation is critical to all cropping system studies. Other regions of the U.S. will need to look at crops and environments common in their areas. Nitrogen management also need further investigation. We know that the crop requires relatively large amounts of nitrogen however we did not always observe responses to nitrogen additions. Additional environments, nitrogen rates, and timing should be evaluated to continue to gain a handle on how to best fertilize this crop. In-season nitrogen tests can be extremely useful to help minimize over or under application. However, there needs to be more research to better understand nitrogen utilization in hemp to fine-tune the work started through this project.