Final report for LNE22-435
Project Information
Across the Northeast, there are many small, diversified farms raising broiler (meat) chickens. Most of these farms are raising under 1,000 chickens a year and are therefore challenged by economies of scale when it comes to raising and pricing their poultry to achieve profitability. Another challenge to projecting potential income from a pastured broiler enterprise is that the data on production parameters are limited to commercial barn-managed data and data from a handful of pastured systems raising multiple thousands of birds a year. Both of these can't be directly applied to what small pasture-raised chicken producers are doing. Prior to this project, some comparative data existed for Cornish Cross chickens, but there was very little information available for slow-growth broiler types raised in small-scale systems.
This project followed 36 broiler farms across New York State over two years to measure production parameters on two flocks per year, totaling 123 flocks. We were able to collect production data for 97 Cornish Cross flocks and 26 slow growth flocks and were able to provide production, feed conversion, and processing data for both types of chickens. Flock management data was also summarized to share commonalties in production practices.
Participating farms tracked detailed financial data for their broiler enterprises, including direct costs (such as feed and chicks), indirect costs (including depreciation of freezers and processing equipment), and other expenses such as labor, mileage, and marketing fees. At the end of each year, farmers individually evaluated their production and business practices with educators from our project team, and made adjustments aimed at improving profitability in the following season. In addition to gaining a clearer understanding of their own costs of production, farmers were able to compare their enterprise performance to statewide performance and profitability benchmarks, which were calculated from each cohort's averaged data in year 1 and year 2.
In year 2, the farmers went through the same exercise of keeping track of their broiler enterprise and production data and compared their profitability per chicken processed in year 1 to their profitability per chicken processed in year 2 to see if the changes they made following their first year on the project were effective in increasing their profitability. When comparing year 1 to year 2, it was found that farmers generally still lost $13 per chicken when labor was accounted for (and realized a small profit per chicken of $1.26 when labor was not taken into account). But, what's more impressive is that 81% of farmers improved their enterprise profitability form year 1 to year 2 by an average of $7.29 (+/- 2.19) per chicken processed. With an average flock on the project containing 101 birds, that is a total increased average income of $736.29/flock (+/- $221.19).
At the conclusion of the project, farmers were encouraged to continue regularly reviewing their broiler enterprises and making incremental adjustments to better align this enterprise with their farm profit goals.
In addition to the individualized work with the farmers described above, our project team led 6 field days, 3 conference presentations, and a final project webinar to expand our education to an additional 345 farmers and farm service providers including extension personnel and poultry processors. Those who attended these programs were able to take away information on production, processing, marketing, and the financial considerations for raising meat chickens on a small scale on pasture in the Northeast.
Forty farms from across NYS producing either pasture-raised slow growth or pasture-raised Cornish-type (conventional) broilers will develop a robust understanding of the true income from their poultry operations. One hundred and sixty flocks will be part of this project (4 flocks per farm, 2 each year), involving a total of 12,000 birds. Farms that are part of the project will look critically at flock performance and financial balance sheets while making changes to increase income by $4.85/bird, or $363.75/flock.
Poultry is a low-cost, rapid-return enterprise staple for small farms in the Northeast. The 2017 Ag Census indicated that there were 5,088 farms rearing broilers in the region. Of those, 60% are classified as small broiler enterprises (<2,000 birds/year). These enterprises don’t benefit from the economies of scale like larger producers, so inputs and retail values must be carefully considered. While nearly 50% (35/65) of NYS pastured broiler farmers that we surveyed in 2021 indicated that they were not losing money on their broiler enterprises and 71% (46/65) shared that they understood their production costs, preliminary data from the literature review our team conducted the same year did not agree with these findings, which are shared below.
Many times, the true costs of production are not evaluated in enterprise budgets, resulting in losses rather than profits for a farm. Upon calculating the average sales price of a traditional white broiler through Cornell's MeatSuite web page (https://www.meatsuite.com/), which allows farmers across NYS to advertise their meats, it was found that the average price in 2021 was $3.55/lb. The "Niche Poultry Enterprises in New England" guide, created by the New Entry Sustainable Farming Project in 2014, shared that a Cornish cross broiler enterprise operating under the 1,000 bird exemption needs to charge a minimum of $4.52/lb to break even. Therefore, for every pound sold, it's projected that the average small-scale pastured broiler producer in NYS producing Cornish Cross type chickens is losing $0.97/lb.
Slow growth broiler enterprises have additional challenges with slower growth rates, worse feed efficiency, and longer feeding timelines that puts them at an even greater disadvantage; more inputs are needed to achieve the same amount of meat. The average price from MeatSuite for slow growth birds is $4.08/lb, while the "Niche Poultry Enterprise in New England" guide indicates a break-even cost of $5.65/lb, a loss of $1.57/lb for these producers. Evaluating the input costs of and pricing for this type of broiler are especially important since there has been a significant shift away from the faster-growing Cornish breeds, and there is not a practical management guide in it's place which outlines the true costs of raising slow growth breeds in their place.
Value-added processing allowed under the 1,000 bird exemption as well as processing method (on-farm vs outsourcing) can impact profit margins in addition to feed type (traditional, locally milled, non-GMO, and Organic), management style, and age at harvest. Deficient understanding of the optimization of these operations can result in substantial financial loss over many years, and the ultimate demise of small, local broiler enterprises.
This project followed 36 pasture-raised broiler producers (28 who raised Cornish crosses, 6 who raised slow growth breeds, and 2 who raised both types) as they raised two flocks each year over two years to understand costs of production associated with raising, processing, and marketing chicken meat. With individual guidance from the project team based on their farming situation, farmers made changes from year 1 to year 2 to improve their efficiency and profitability. In addition to the one-on-one education provided to the program's farmers through farm visits and individual farm enterprise reporting and discussions, the project team also provided the opportunity for these farmers to talk to one another in cohorts via discussion circles to see where their costs of production fell relative to other producers and to gather ideas as to how to become more efficient in their production and overall profitability.
Additionally, our team hosted 6 pasture-raised broiler field days across the state, spoke at 3 conferences, and held a final project webinar to expand our education to an additional 345 farmers and farm service providers including extension personnel and poultry processors. Data from the research portion of the project is shared as part of this report to elucidate the production and performance parameters associated with Cornish Cross and Slow Growth Broilers raised on pasture in New York State.
Cooperators
- (Educator and Researcher)
- (Educator and Researcher)
- (Educator and Researcher)
- (Educator and Researcher)
- (Educator and Researcher)
- (Educator and Researcher)
- (Educator and Researcher)
- (Researcher)
Research
Small-scale pastured broiler farmers can improve profitability through a better understanding of their true costs of production. Building on this foundational knowledge, they can manage production and processing costs while employing strategic marketing and raising prices.
Thirty-six small, pasture-raised broiler farms, with 28 raising slow growth broilers, 6 raising conventional broilers, and 2 raising both varieties, participated in the project. Each farm had a minimum of 25 broilers per flock with a minimum of two flocks raised per year. We tracked production and processing data on two flocks per year either from 2022 - 2023 or 2023 - 2024. Financial data was collected on farmers' broiler enterprises each year over the same time periods. Only farmers from NYS were selected for this project to keep seasonal variables relatively consistent while at the same time allowing for an evaluation of farms within various markets across the state.
The only variable that this project used to make comparisons in addition to year on the project (year 1 vs year 2) was broiler type (slow growth vs conventional). The inclusion of slow growth broilers in this project was due to a surge in the number of small farms raising slow-growth broilers over the last 5 years. Otherwise, our primary eligibility requirement was that the birds must be pasture-raised following brooding and that farmers were raising under 1,000 broilers a year to keep economies of scale more consistent. This research project's goal is to find the average costs, production, and processing data associated with raising broilers state-wide.
We understand that there can be high production cost variation due to farm location, year, season, bird strain, and management style. Of these, feed choice is going to be most impactful, specifically when comparing GMO-free/organic to conventional. We controlled for this by using the same farms to compare year 1 data to year 2 days. Feed type was not pulled out as a separate variable because there were too few farms with complete data to make meaningful comparisons.
The 36 farmers on the project were split into two cohorts to divide the educators workload more evenly (2022/2023 and 2023/2024) over the course of the project. Spreading out the farmer participation on the project also helped us recruit additional farmers for cohort 2 to replace some of those that were not able to commit to the project in the first year. Farms were selected from a list of farms that have either previously expressed interest in the project or had a history of working with Cornell Cooperative Extension. The cohorts ended up having 18 farmers in each. While we aimed to get an even distribution of slow growth and conventional broilers over both time periods, we still ended up with far fewer slow growth chicken producers due to factors outside of our control including market preferences and upward-trending feed prices.
A pasture-raised broiler enterprise budget tool was created to collect production data and survey producers. Extension educators worked one-on-one with farmers to collect data and ensure that they knew how to use the equipment given to them to collect accurate data. Each farm was visited 5-7 times in year 1, which included an initial visit to the farm followed by visits over the last two weeks of production for each flock of Cornish-type broilers and the last three weeks of production for each flock of slow growth broilers. These visits allowed for the educator to work with each producer one-on-one to measure live weights and feed consumption as well as check in on how the completion of the financial binder was coming along. From this data, live weights, feed consumption, and feed conversion ratios were summarized. Ten average birds per flock were selected for weighing and were banded to ensure that the same birds are evaluated at each time point. In mixed sex flocks, five males and five females were selected.
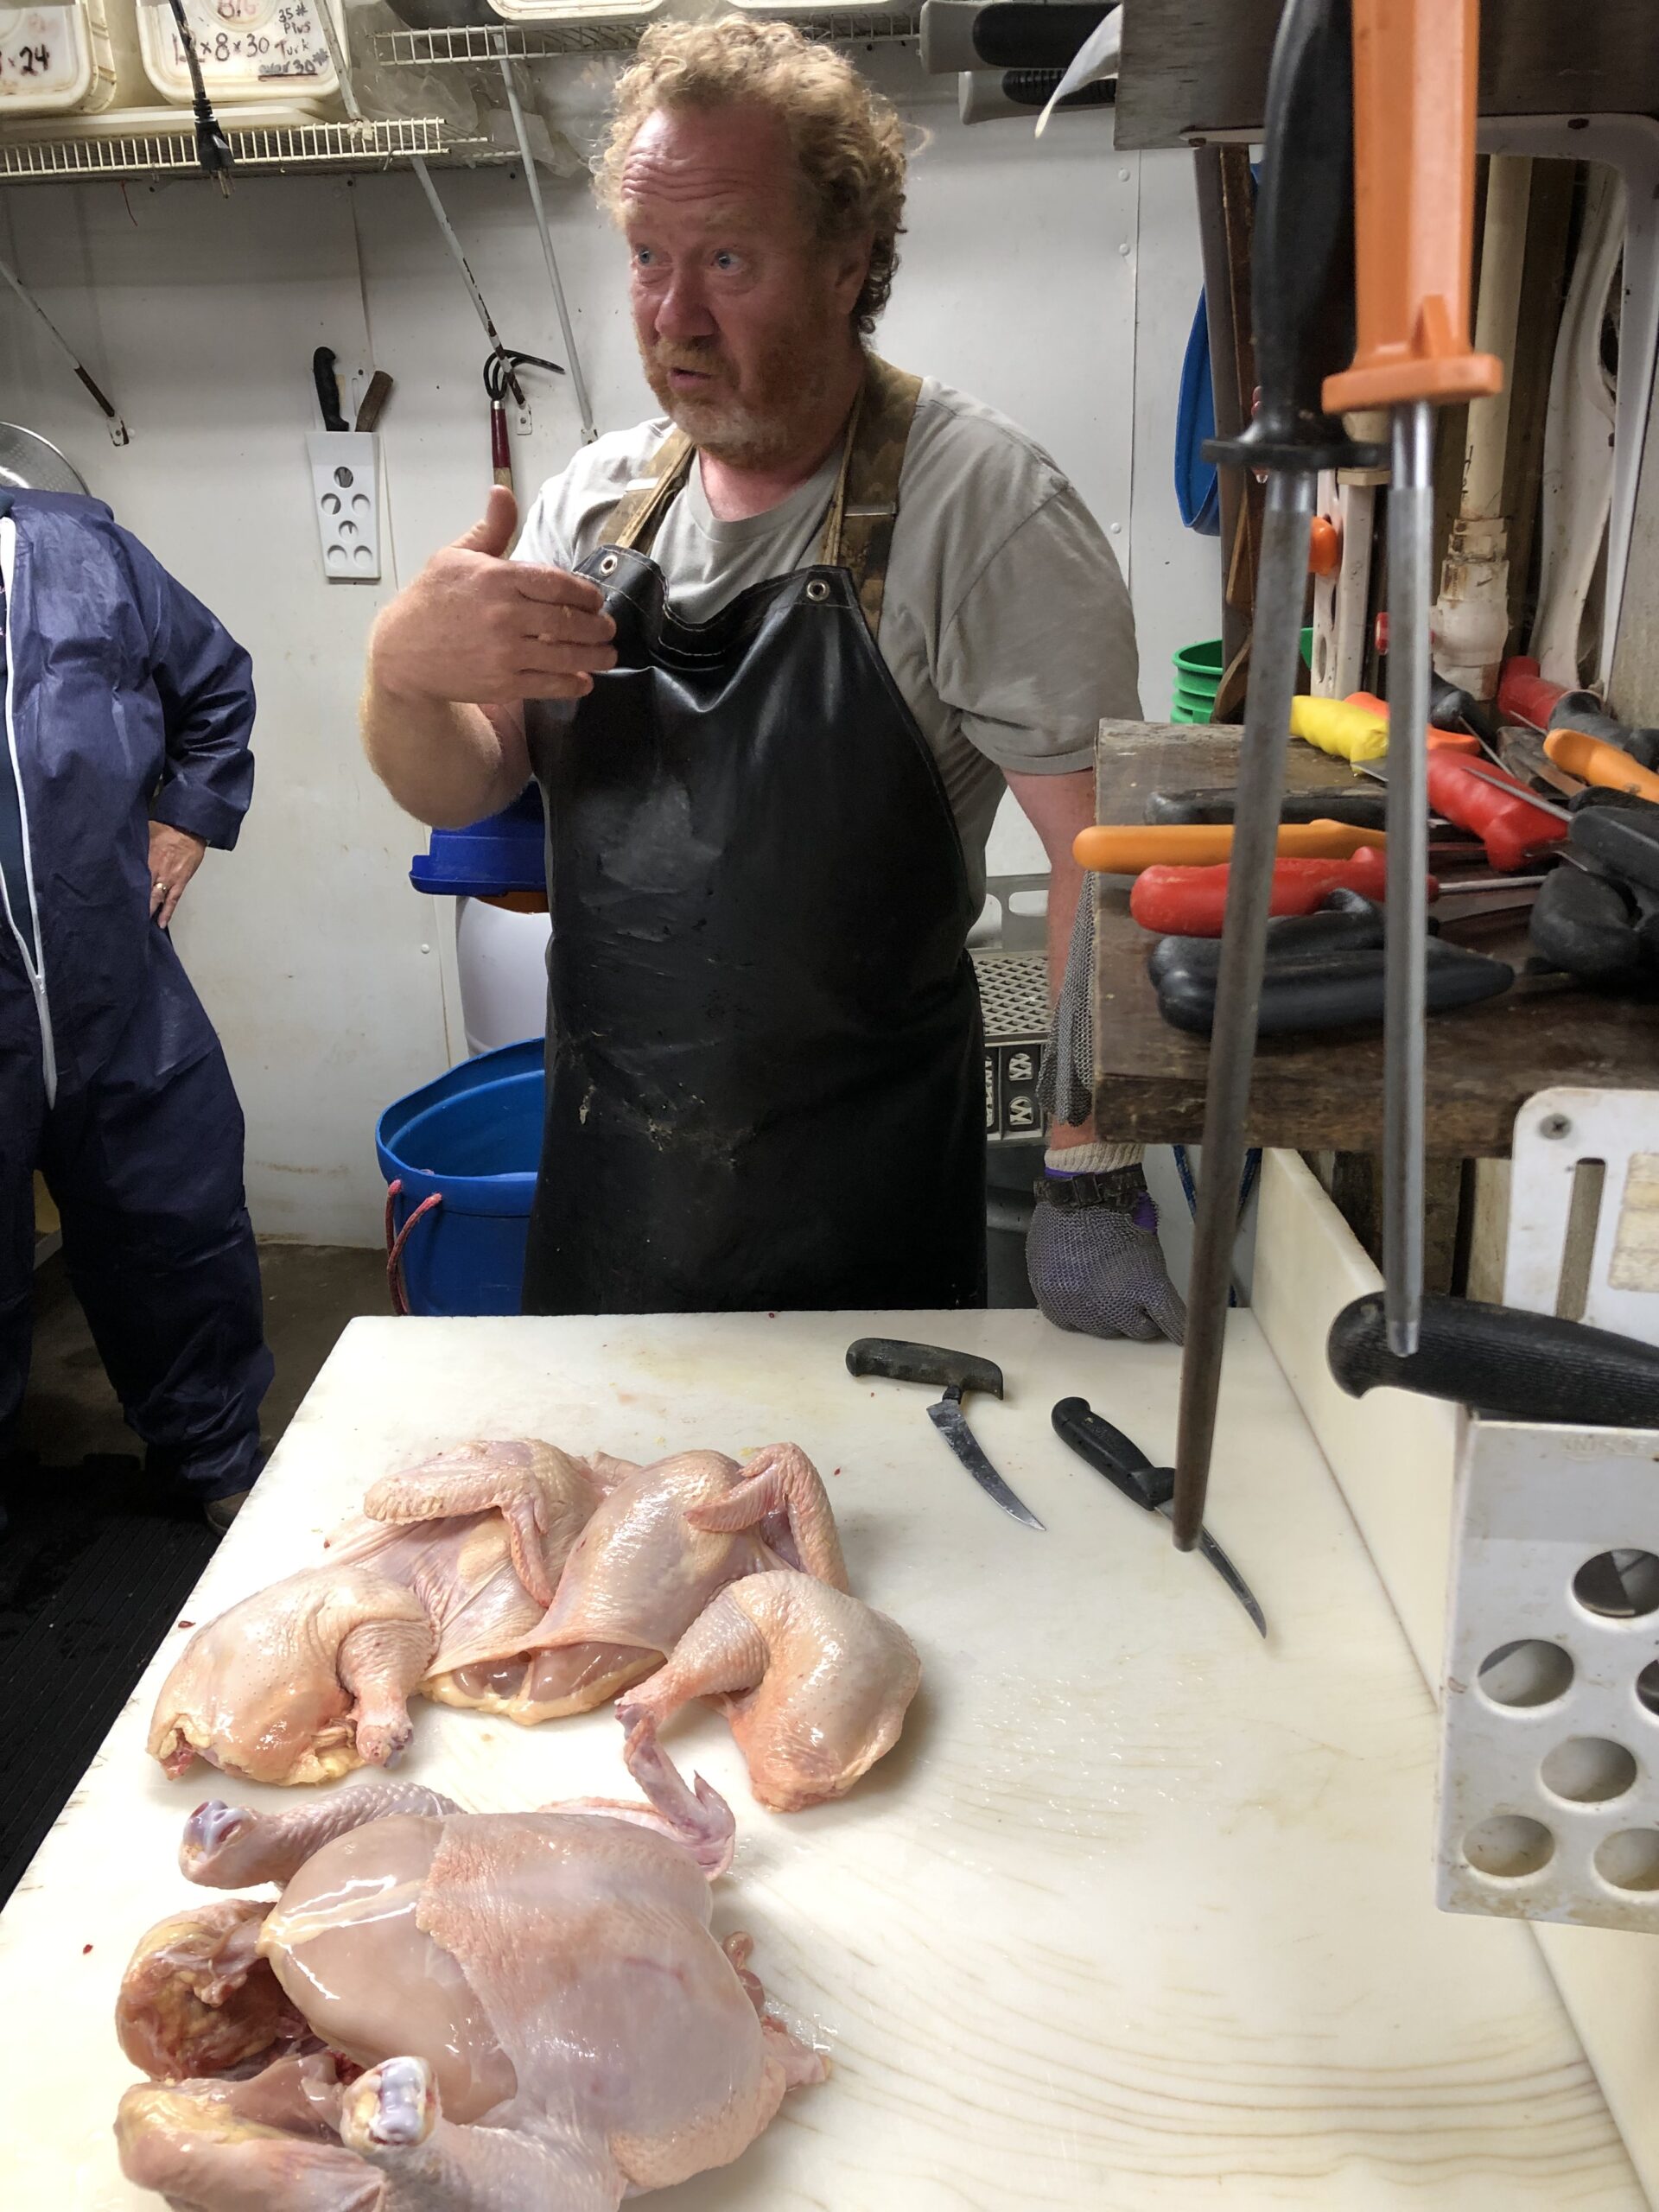
On processing day, final live weights were collected on the banded birds, and those birds' carcass weights, without necks or giblets, were be taken. Farmers had the choice to part the project birds out into standard retail cuts (breasts, thighs, legs, wings, necks, feet, soup bones, and organ meats). If farmers did not know how to cut whole carcasses into value-added cuts, their educator taught them how to accomplish this as well as weigh the individual parts to calculate their percentage of the whole carcass. There were a significant portion of farmers that didn't have experience processing their own chickens, and these skills were taught by their assigned educator as well.
The data collected for this project included:
• Feed
• Brooding time
• Chick costs (including shipping)
• Death loss (mortality, predation, etc.)
• Supplement use (grit, vaccines, vitamins/minerals, apple cider vinegar)
• Electricity use
• Equipment (brooder lamps, waterers, feeders, etc.)
• Direct expenses per flock (feed, chicks, bedding, etc.)
• Time caring for birds
• Time to process birds, if processed on-farm
• Time and travel to custom processing, if processed off-farm
• Processing equipment and single-use packaging costs
• Time and travel associated with selling birds, regardless of market
• Refrigeration/freezing storage costs
• Marketing costs (website hosting fees, online sales platform fees, etc.)
Following the completion of all 3 growing seasons, the complete data set was analyzed to find:
• Average input costs of common input categories
• Percentages of each input cost that contributed to the total cost of production
• The cost per broiler processed with and without labor included
• Growth rates and live weights for Cornish cross and slow growth broilers
• Feed conversion by variety for both live and processed chickens
• Dressing percentage of each bird type
• Carcass part-out values for each bird type
Because of the natural variability in production data, even within the same farm, we did not perform a complete statistical analyses. Instead, this report shares ranges, medians, and means, with the intention of finding the true average production costs of raising broilers on a small scale in the Northeast.
Study Demographics:
- Year 1: 50 Cornish flocks (4,726 birds), 15 slow growth flocks (1,485 birds). Slow growth breeds consisted of Royal Grey Broiler, Freedom Rangers, Kosher Kings, and Meyer’s Red Broiler.
- Year 2: 47 Cornish flocks (4,487 birds), 11 slow growth flocks (1,344 birds). Slow growth breeds consisted of Royal Grey Broilers, Royal Red Broilers, Red Broilers, Freedom Ranger Broilers, and Red Jackies.
While our intention with this project was to have a 50/50 split between slow growth and conventional broiler farmers, this proved more difficult to achieve than anticipated. First, while a good number of the project farms had tried raising slow-growth broilers as an experiment, they realized that for one reason or another, they didn’t want to continue with this variety. Some of these reasons include: not being able to get the market price they needed to be profitable; fewer pounds of meat produced by the same number of slow growth chickens as compared to the Cornish crosses; and the fact that fewer birds can be raised over the course of the growing season if slow growth birds are used. At the start of the study, there were some farmers that had historically only raised slow growth broilers who moved to raising Cornish crosses because of the significant increase in feed prices in 2022; Cornish were just more efficient to raise. Once the project started, we did not see farmers move away from slow growth from year 1 to year 2, but we did see the breed of slow growth chicken change as farmers selected those that better helped them meet their goals.
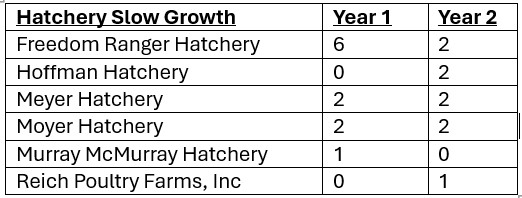
The hatcheries that were part of this study included the following, with the first table illustrating the number of flocks originating from hatcheries offering Cornish cross chickens and the second showing the hatcheries involved in the study that offered slow growth broilers.
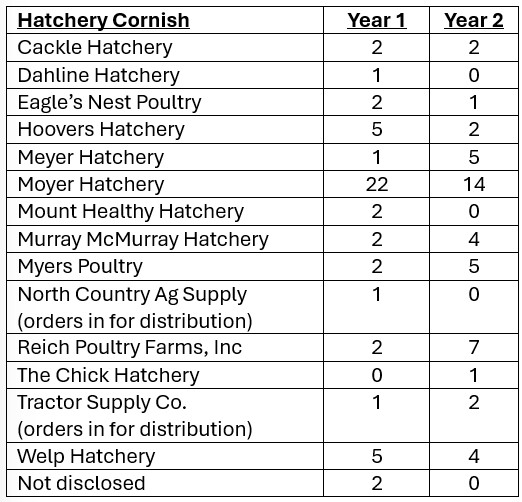
Project farms were not necessarily hatchery loyal. If they had a poor performing batch of chicks, they would switch hatcheries to either switch genetics or order from a hatchery that was closer to reduce the stress on the chicks during shipment. Likewise, if they didn’t like how the birds tolerated their production system once on pasture, they would switch as well. Another factor that strongly influenced hatchery use was chick availability; in the years of the study (2022-2024), there were chick shortages and farmers who didn’t place their orders by late winter were usually not able to get chicks from their hatchery of choice. The bias towards Moyer for Cornish cross chicks is because there was a WNY distributor who ordered in chicks for regional farmers to pick up, reducing the purchase price and shipping stress, which was attractive to many of our producers.
There were fewer hatcheries represented for slow growth broilers, both because we had fewer slow growth flocks on the project and because there are a limited number of hatcheries that offer slow-growth broiler chicks. While many hatcheries offer males of egg-type chicks to raise out for meat, these were not considered as part of the study; only slower growing meat-type chickens were. Within this classification of chickens, there was a bias toward Freedom Ranger Hatchery in part because of name recognition.
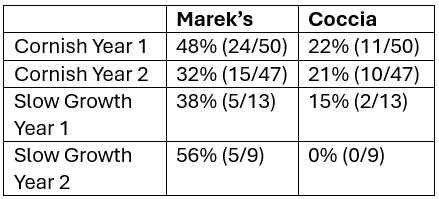
Vaccinations of Chicks:
The vaccinations available for chicks were hatchery dependent, though most offered at least Marek’s and Coccidia. Marek’s disease is a viral cancer of chickens that causes leg failure due to sciatic nerve enlargement, ocular damage, and internal tumors, among other symptoms. The affected percentage of the flock will range between 1% - 50% depending on the virulence of the strain. While typically an ailment of laying hens, exposed broilers that have not been vaccinated at the hatchery as chicks can end up with symptoms as early as 6 weeks of age (Pendleton, 2023). We did not find apparent evidence of Marek’s in our project flocks. We did not ask participants if they had Marek’s in their other poultry, which provide a reservoir of Marek’s, so it’s uncertain if the vaccine was helpful for those affected farms.
Coccidiosis is a parasitic infection that is picked up from the environment and can affect chickens as young as 3 weeks of age. By 12 weeks of age, the birds have generally developed an immunotolerance to the parasite. Affected broilers end up with lower rates of gain and may die from intestinal damage in severe infections. Vaccination at the hatchery is one way to manage the disease and feeding a coccidiostat in the feed (known as medicated feed) is another. However, these cannot be fed simultaneously or they negate each other (Lorenzoni, 2023). The flocks that are most at risk are those which live extended lives in brooders or are not moved frequently. The parasite thrives in warm, wet conditions.
In our project flocks, one flock had a coccidia infection at 4 weeks of age resulting in the loss of about 20% of the flock. They were not vaccinated for coccidia and were not fed a coccidiostat. One other flock on the project reported feeding a coccidiostat to vaccinated birds, which presented a learning opportunity.
Sometimes these vaccines come standard as part of hatchery’s shipment protocol, and other times they need to be opted into. Selecting vaccines that protect against known challenges on the farm are going to be the most cost-effective strategy. That said, if there is uncertainty if a premise has had these challenges in the past, getting the vaccines can provide insurance against losing a portion of a broiler flock moving forward.
The table below shows the percentage and (number of total flocks) where chicks were given vaccines for Marek's and coccidiosis in year 1 and year 2.
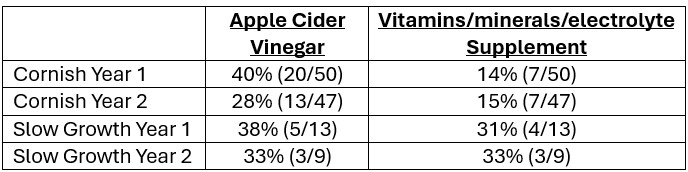
Supplement Use:
Preventative measures to improve resilience and performance of broilers under stressful conditions included providing feed additives such as apple cider vinegar and vitamins/minerals/electrolytes in the water. Apple cider vinegar provided at a rate of about 1-2 tablespoons per gallon continuously acts as a gut acidifier, improving performance and increasing immune strength (Jahantigh et al., 2020) (Adeleye et al., 2021). It performs best when provided regularly vs for a short period. Vitamins/minerals/electrolytes, on the other hand, can be placed in the water for a few days prior to and following stress events (shipping, movement onto pasture, heat stress, or cold stress) to improve the immune response to these events, decreasing the severity of production depressions resulting from them. We did not have enough complete data sets from producers using vitamins/minerals/electrolytes consistently to compare those who used them to those who did not. The table below shows the percentage and number of flocks using apple cider vinegar and supplements of vitamins, minerals, and/or electrolytes.
Use of Grit:
Grit is widely recommended by small poultry producers because it is said to aid in the grinding of feed in the gizzard, making production more efficient. However, the research isn’t as straightforward. Studies indicate a variety of effects, including none (Svihus et al, 2017), a positive effect on weight gain and feed conversion (Bras, 2017), and no effect on performance, but an effect on gut length and gizzard weight (Garipoglu, et al., 2006).
In our study, 29% (18/63) of first year flocks and 29% (16/55) of second year flocks were provided with grit. While the use rate for this supplement was high, we couldn’t compare gizzard size or conclude if grit was helpful for rate of gain because of the variations in breed, age of birds harvested, type of grit used, the length of time the grit was offered for, and when the grit was offered. These data are only comparable through replicate studies in more of a lab-type setting. However, feeding grit free choice is not a harmful practice, based on literature.
Feeding Schemes:
Generally, feed protein percentages did not follow outlined production standards. This is an area where feeding management can be dialed in to not leave production on the table while also saving spending money on a higher-than-useful protein percent that will not be utilized by the bird for bodily functions or muscle development.
The highest percentage of protein used in our project flocks was 28%, while the lowest used was 16%. The average protein percentage used was just around 20%, but the range by producer varied widely. Some producers opted to feed a 28% protein feed all the way through the flock rearing period, some chose a 17.5% protein concentration all the way through, and still others changed protein percentages without a regard to the age of the bird but instead based on what feed was available. These are all problematic in different ways.
Broilers require specific protein percentages to ensure performance to their genetic standard and generally follow the pattern of needing higher protein when they’re just hatched, which slowly decreases as they age. The chart below shows the percentages of protein needed by age for Cornish cross broilers. Keep in mind that the protein needs for slow-growth broilers are going to be lower because of their lower genetic rate of gain and overall size potential. Being that protein is very expensive, feeding to the standard helps to save money.
This snip of a chart is from Poultry Nutrition, 3rd edition. It outlines the crude protein needs for Cornish cross chicks from 0-18 days, 19-30 days, 31-41 days, and over 42 days.
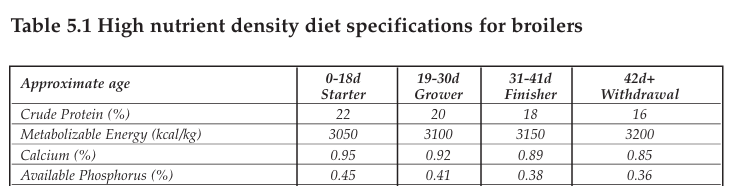
This table is from Commercial Poultry Nutrition: 3rd Edition.
Mortality:
Limiting mortalities is the most important way to improve profitability from the production perspective. For each bird that is lost, the indirect costs of raising that bird have to be absorbed by the flock members that make it to processing. Significant losses later in the growing cycle will impact the profitability per bird processed much more than chicks lost in the brooder. Our project revealed that the losses in raising pastured poultry far exceed those that are outlined by commercial production guides.
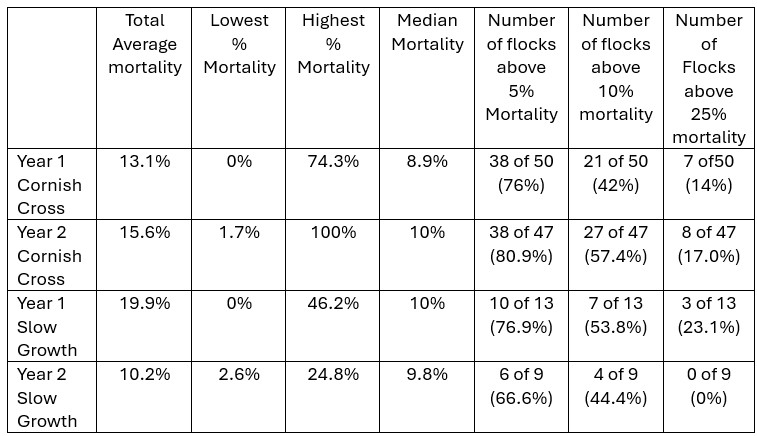
Commercial production guides for Cornish cross list that a 5% mortality rate is too high for conventional production systems (Vencomatic, 2022) and that the target should be no more than 2% (Champrix, 2025). Ideally, mortality in the first week should be less than 1% (Cobb Broiler Management Guide). In our project, median mortality rates were right around 10% for both breeds. What we found startling, however, was the percentage of individual flocks with mortality numbers higher than 10% (42% - 57.4% of flocks) and higher than 25% (0% - 23% of flocks). There was no obvious difference between the mortality rates by year for Cornish cross and slow growth broilers. The chart below outlines the average mortality losses for the two varieties of broilers by year. It shares this information in more detail in addition to mean, median, and the range of mortality rates that our project flocks experienced.
The causes of mortality in year one were highly varied across both classifications of broilers. The top three highest mortality causes were brooder mortality/shipping stress (20/63 flocks), predation (6/63 flocks), and cardiorespiratory failure from temperature fluctuations (5/63 flocks). In year two, we saw the highest mortality causes from brooder mortality/shipping stress (15/56), predation (9/56), and cardiorespiratory failure from temperature fluctuations (6/56). The same farmer didn’t generally have the same single cause of mortality from year 1 to year 2 due to fixing the root cause in year 1. It should also be noted that farmers had widely variable death rates when comparing flocks across the two years on the project, and just because they had good mortality numbers one year didn’t mean that they were good the next year and vice versa.
Generally, very high death loss occurs when something happens outside of the farmer’s control during grow-out, showing where the weakness is in their system. For many farmers, the springs of 2022 and 2024 were cold and wet, resulting in cardiorespiratory failure in some flocks that were either forced to stay in the brooder for too long, resulting in depressed immune systems from increased stress levels, or were put onto pasture too early, leading to chilling from constantly cold and damp ground. We did not find a strong correlation between time of year for flock placement and how well the flocks performed. Managing death losses from weather comes back to creating a resilient system where indoor space is allocated for the flocks to be raised inside if cold weather persists, since we know chickens are sensitive to cold, wet environments. This management may also look like pushing flock dates forward so that chickens can be raised in the more temperate weather of summer and early fall.
Cold or heat stress during transport can affect the performance of chicks once they’re in the brooder, with most of the death losses occurring during the first three days and up to a week. This is a difficult loss potential to manage, especially in shipped chicks. Moving flock dates forward to reduce the risk of shipping chicks in the cold and changing the hatchery used to be closer to reduce the number of days chicks spend in transport can improve early brooder livability. Outside of shipping, other brooder deaths were caused by overcrowded conditions, improper heat sources, and exposure to cold and/or damp drafts. It’s straightforward to manage around these issues by increasing the number of heat sources for the number of chicks and oversizing the brooder for the number of chicks reared per flock.
Production Data:
We used the data collected by our producers to determine production parameters for Cornish cross and slow growth broiler chickens raised on pasture. We removed outliers prior to analyzing the data. Those flocks of data that were removed include:
- Flocks were excluded if mortality exceeded 10% over the full grow-out period or 15% when the majority of losses occurred during the brooder phase. This distinction was made because birds that die later in the production cycle have consumed more feed, which disproportionately skews production and efficiency metrics. As a result, higher mortality early in the cycle is more acceptable for comparative analyses of production efficiency. A 10% mortality threshold is commonly accepted for chickens raised in pasture-based systems, though this is higher than the commercial industry standard of approximately 5% over the life of the flock. We acknowledge that this higher threshold may slightly bias results; however, applying a 5% cutoff would have yielded an insufficiently representative dataset, as 66.7%–80.9% of participating flocks experienced mortality exceeding 5%.
- Farms that fed excess supplemental foods (food waste) as part of the diet were not used in the averages, since alternative feeds skew the consumption of pelleted feed and impact rates of gain.
- Farms sharing that they restricted feed outside of a typical restriction of a 12 hours on, 12 hours off pattern did not have their data used in the averages. Purposeful restriction of feed outside of a scheme that full feeds for 12 hours at a time can cause stunting in the flock, as they’re not able to meet their genetic potential for growth.
- If feed consumption or conversion was outside of the standard deviation of production values for the breed, it was not used. Data that were way outside of the average were generally caused by incomplete data collection. In one case, it was caused by feed with insufficient protein levels.
- The data from flocks that were raised for longer than 16 weeks were not used. This was only seen for one of our slow growth flocks. Because of the rapid maturity of broiler chickens, chickens older than this are sexually mature and instead of increasing in weight, their weight will decrease as they focus their efforts less on feeding and more on fighting and mating.
Overall Performance Metrics:
Performance metrics were taken for each of the flocks multiple times. Cornish cross broilers were weighed the day of processing and one week prior to processing. Slow growth broilers were weighed at the day of processing, one week prior, and two weeks prior. Feed weigh backs, which helped us to calculate the amount of feed consumed during the production period, were taken at the time of each weigh date. The data was recorded this way so that when farmers were reviewing their production data, they could see if processing sooner or later would help them reach their efficiency goals. So, when interpreting the data, the averages shared in the charts for live production data are 3.5 days prior to the actual processing date for Cornish Crosses and 7 days prior to the actual processing date for slow growth broilers.
In straight run flocks, five average males and five females were selected at the first weigh date and were banded so that they could be followed through processing. In all female or all male flocks, ten average birds were selected of the same sex. We did not separate all male flocks and all female flocks from the straight run flocks when the following tables were created. We did have one female flock and a handful of male only flocks. Knowing this, the live weights shown are slightly heavier and feed conversions are slightly better than they would be if there were only straight run flocks on the project.
We did not see a significant change in the age of the Cornish crosses from year 1 to year 2, indicating that farmers tended to raise them to a certain age, rather than weight. That said, we do know some individual farmers processed based on weight in year 2 when they had previously processed based on age in year 1. It was noted that the birds in year 2 consumed more feed per bird, were less efficient, and had a lower live weight in year 1. This could have been from a variety of factors, including those impacted by individual farm management differences due to uncontrollable factors during the growing season year over year.
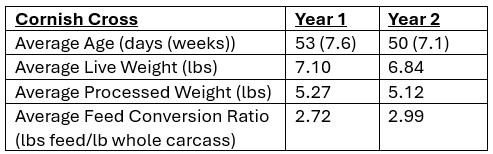
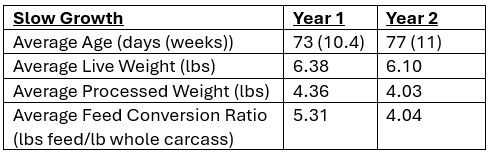
The two charts below show average age, feed consumption, live weights, and feed conversion ratios for Cornish cross and slow growth broilers from year 1 and year 2.
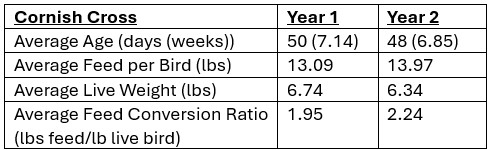
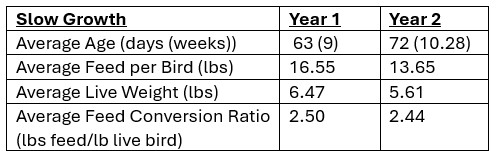
Slow growth broilers were raised longer than their Cornish counterparts, generally to around 10-12 weeks of age instead of 7.5-9 weeks. This additional time for growth is necessary because these breeds are slower at accumulating fleshing and body size than the Cornish crosses. Feed conversion was worse for the slow-growth flocks, which matches what we find in the published literature for commercially raised flocks, even though the average live-weight per bird was similar at their processing dates.
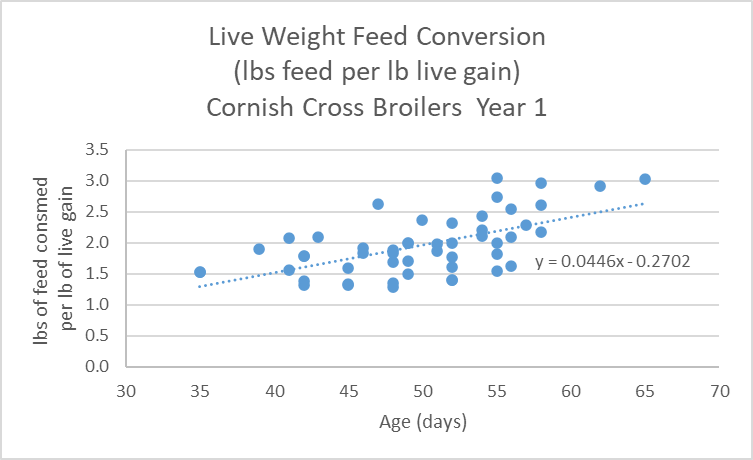
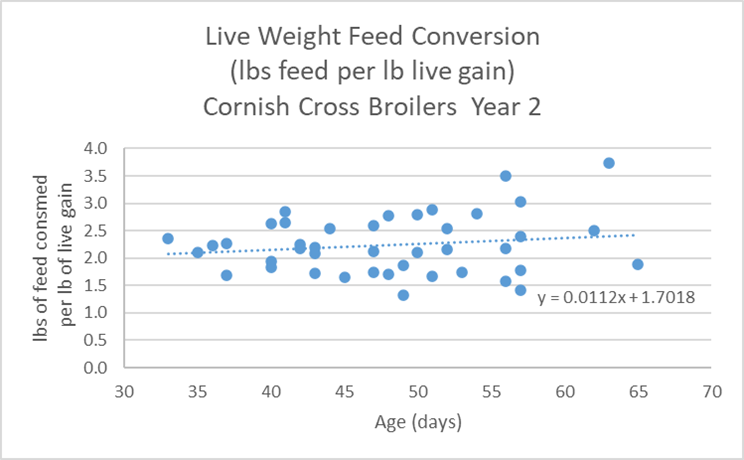
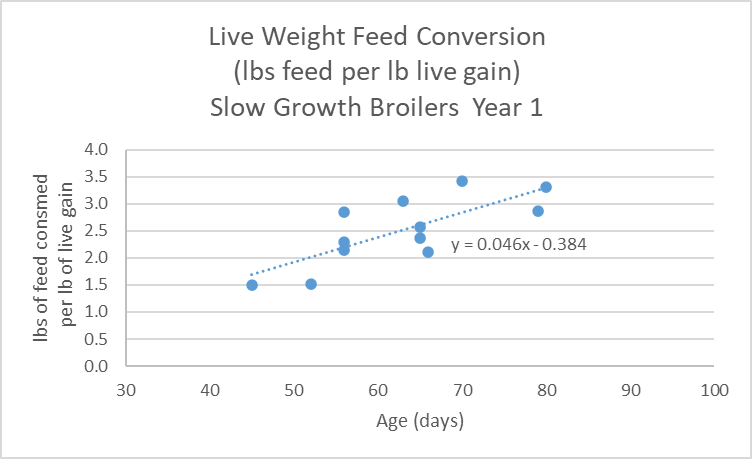
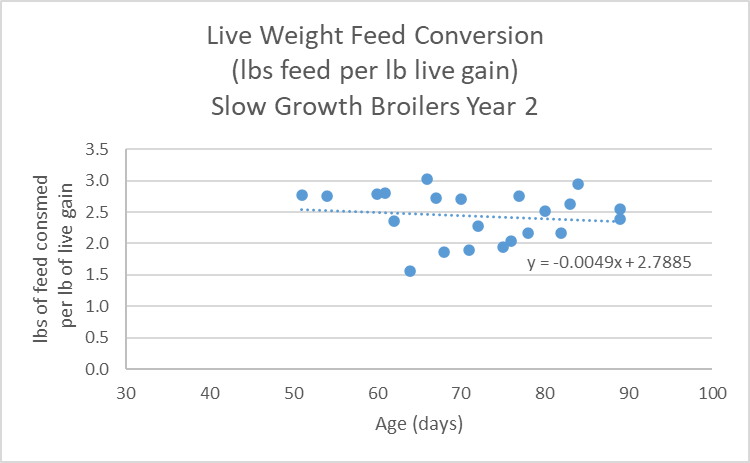
A key trend highlighted in commercial broiler production management guides is that production efficiency declines as birds age. Broilers grow most rapidly early in the production cycle as they build muscle and bone, with growth rates slowing as they mature. As a result, there is a “sweet spot” for processing broilers: when birds reach a desirable market weight while requiring the least amount of feed per pound of gain.
In this study, Cornish cross birds exhibited a more pronounced growth curve in year 1 than in year 2; however, flocks were generally not raised long enough in either year to observe a significant decline in efficiency toward the end of the production cycle. Slow growth birds showed a similar pattern in year 1, but this trend was reversed in year 2, with greater variation in feed conversion by age. This increased variability reflects the use of different breeds in year 2 compared to year 1. Because farmers chose when to process their slow-growth flocks, birds with different genetics were harvested at different end points, altering the well-documented efficiency trends typically observed in commercial production guides. In contrast, Cornish cross birds have a much narrower genetic pool, resulting in trendlines that more closely align with published commercial data. These patterns are reflected in the tables below, which present growth efficiency (pounds of feed per pound of live gain) by age.
Below are four tables showing scatter plots depicting the relationship between age and feed conversion efficiency noted in pounds of feed consumed per pound of gain observed. The first two are for year 1 and year 2 Cornish cross flocks, respectively, and the last two are for slow growth flocks in year 1 and year 2.
General opportunities that we identified for improving efficiency for our producers included the following:
- Raising all male birds can improve the overall efficiency and pounds gained for a flock. According to 2022 commercial management guides for Cornish crosses, males have the potential to have live weights that are 1.37 - 1.75 pounds more over females raised to 8 weeks of age. These commercial management guides also show a better feed conversion for males by around one twentieth to one tenth of a point (Cobb, 2022) (Ross, 2022).
- Managing broilers to a target weight rather than a specific age allows farmers to optimize flock efficiency while meeting desired average bird weights. Characteristics of the growing season (temperature, daylight hours, humidity, precipitation) have a significant impact on how well broilers perform. Colder, wetter conditions stunt growth, as do hot and humid conditions. In the first, the birds cannot consume enough calories to keep warm and grow efficiently. In the second, the volume of feed consumption is reduced as the birds seek out more water, thereby reducing growth. In some situations, producers on our study encountered very cold and wet conditions, prohibiting them from moving birds from the brooder to out on pasture in a timely manner, stunting growth from overcrowding in some scenarios. In others, it got very hot and humid immediately following a prolonged stretch of cold/wet, which resulted in high rates of cardiorespiratory failure in some flocks. Separately, the longer days of late spring and summer meant that there were more hours for the birds to consume feed, thereby increasing the calories consumed to put into growth.
- Making the decision to cut losses on stunted flocks was one that wasn’t made lightly by our producers, but was necessary for profitability in some cases. Observationally, we noticed that birds that had suffered significant hardship early in grow-out never caught up to peers that didn’t have the same experience. These included brooder stress, disease, and weather-related health challenges. We recommended that farmers move those troubled flocks to processing earlier in an effort to not put more feed into birds that weren’t converting it efficiently and to give them the space to raise another flock.
Charging appropriately for slow growth vs Cornish cross chickens is important and should be based on their cost of production. Slow growth birds have smaller carcasses in general, so it takes more birds to produce the same number of pounds of chicken annually. They also take more time to raise than Cornish crosses, so fewer birds can be raised in a pasture system of the same scale. They are also less efficient than the Cornish crosses.
Processing Metrics:
The birds selected by producers for weighing in each trial flock were processed individually. Carcass weights, as well as the weights of individual parts and pieces, were recorded to calculate carcass yield as a percentage of live weight and part yields as a percentage of whole carcass weight. Participating farmers could choose to keep birds as whole carcasses or to part them out. For birds that were further processed, farmers determined which cuts to produce and whether or not to retain edible offal.
The charts below show the average age of chickens at processing as well as their live weights, processed weights, and feed conversions. The first chart's data is for Cornish Crosses while the second is for slow growth broilers
The chart below shows the percentage of carcass yield from live weight when Cornish Cross and slow growth broilers were processed.
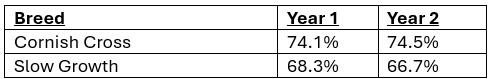
Slow growth broiler average age at processing was just about 4 weeks more than the processing age for the Cornish crosses. Cornish crosses dressed out at an average of 6.8% better than the slow growth chickens and yielded average weights at just over 5 pounds while the slow growth chickens were about a pound lighter at the time of processing. When comparing live and processed feed conversion ratios, Cornish crosses performed better.
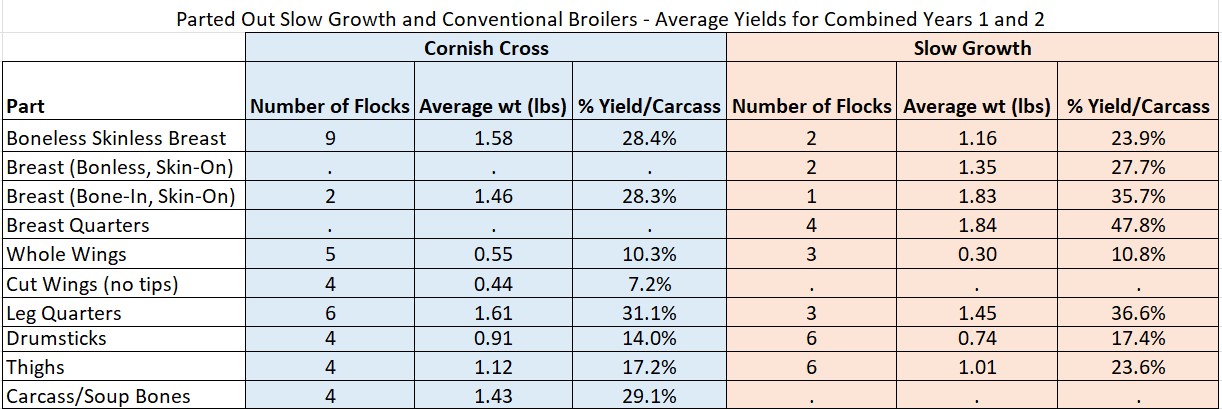
When the carcasses were parted out, we found that Cornish cross chickens yielded parts percentages that were between 64%-74% of the whole carcass while slow growth parts yielded between 70% - 90% of the whole carcass. The range of numbers for each of the two varieties is a result of how each producer processed their chickens – those who kept more bone-in, skin-on cuts saw a larger yield of parts per chicken. Cornish cross chickens had more meat on their carcasses when comparing carcasses processed into like cuts (boneless skinless breasts, thighs, drumsticks, and whole wings). As a whole percentage of the carcass, slow growth chickens had a larger proportion of leg meat than Cornish cross chickens.
The chart below illustrates parted out carcass data for Cornish cross and slow growth broilers, combining all flocks from years 1 and 2 for each variety.
Some producers opted to keep necks, feet, livers, hearts, gizzards, and fat pads from their birds. If producers kept all of these parts (minus the fat pad, because this varies based on too wide of a variety of factors), they were able to capture an additional 10% of the live weight of their bird to sell.
There are some challenges with keeping these other parts, though. First, a market should be identified. Some producers on our project had excellent markets for these parts, while others did not. If they didn't the parts set in the freezer until the producer either sold them at a steep discount or threw them away. The second question that should be answered is if the extra time to harvest these parts is worth the return on the time investment. Some parts, like gizzards and feet, take a greater time input to process because they require peeling. Hearts require a time investment to remove the pericardial sac and the livers need to have the gall bladders removed. Necks are generally the easiest part to keep.
In the table below, data for other parts, including average weights and the percent yield from live, are shared for both Cornish cross and slow growth broilers. Flocks from years 1 and 2 are combined for each variety.
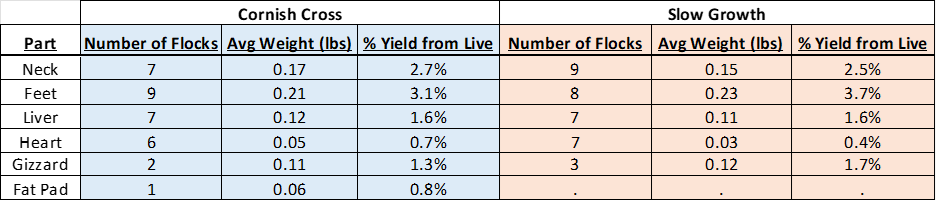
One important consideration when interpreting the yield table above is that some parts were calculated using a relatively small number of birds. As a result, these averages may be less representative of true population means than if they were based on larger sample sizes, due to natural variation among individual birds and flocks.
Financial Data Results and Discussion
The financial portion of this project focused on documenting costs, identifying cost benchmarks, and determining if changes made by producers in year 1 of the project improved year 2 profitability. Data were collected on all costs that went into the broiler enterprise via sectioned binders. Each farm had their data individually analyzed and given back to them at the end of year 1. This allowed them to see how their business performed, including making comparisons to statewide benchmarks, which were created from the averages of the individual enterprise analyses. Producers benchmarked their improvement in profitability in year 2 against their profitability figures from year 1.
Expenses were grouped into three main categories: direct, indirect, and non-cash. Direct costs were classified as those directly tied to production of an animal unit, and included items such as chicks, feed, and bedding. Indirect costs, also considered overhead costs, included depreciable equipment like brooding equipment, chicken tractors, and processing equipment, as well as insurance and farmers’ market fees. Milage was recorded as was labor. While these indirect and other non-cash costs aren’t typically realized by farms when calculating costs of production because they typically don’t directly impact the checkbook during the growing season, they’re an important part of determining if the enterprise was profitable or not.
The goal of the benchmarking process, for both individual farmers and the cohorts, was to establish reliable financial reference points that allow farms to compare performance year after year and identify parts of their operation where costs may be higher than what they’d like them to be. In this analysis, the units were documented on a “per broiler processed” basis. This approach gave the most consistent and practical metric as it accounted for issues like chick mortality and processing constraints that other benchmarks, such as “per chick started” or “per pound processed" would have been heavily skewed by.
General Farm Demographics:
Recordkeeping practices varied, with 33% using paper notebooks, 60% using digital spreadsheets, and 18% using accounting software such as Quicken or QuickBooks. More than a quarter of farms reported using multiple methods, and a small number noted receiving support from professional accountants to complete their enterprise analyses.
Chicken was sold to a variety of customers through an equally varied array of outlets, with the majority of farms selling through multiple market channels. In the first year, 55% of farms reported that they sold to their community, friends, and/or family members. Sales via CSA, on-premise farm stores, and off-site retail stores each contributed to 16% percent of the sales outlets.
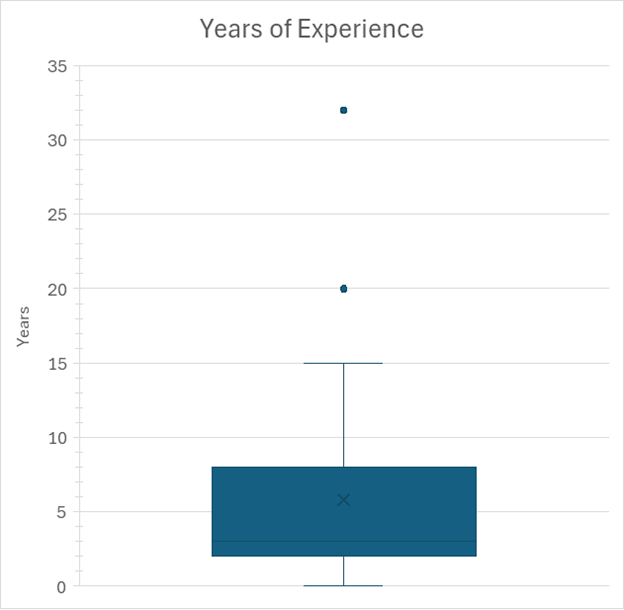
The project included farmers with a wide range of experience managing broilers, including farms that just began raising broilers as the project began, and others that had been raising broilers for over 32 years prior. The distribution can be seen in the chart below. However, the median years of experience reported was only 4. Most farms noted that they had been keeping at least some form of records for the entire time that they had been raising broilers. For the few that had not started out keeping records at the time they started raising chickens, they started keeping records by year 3.
When asked why they were participating in this research, farmers gave different answers, and often multiple answers. Only about 30 percent directly stated that they were participating to better understand their own costs of production and improve profitability. Another 30 percent reported the desire to learn more about various elements of broiler production, including processing, record keeping, and the potential to share what they’ve learned with others. Many of the farms had altruistic goals in mind, hoping that their involvement could help others, the poultry industry, and/or science as a whole.
Expenses
When considering direct costs alone, the average broiler took $20 in direct expenses to raise and process. However, with non-cash costs included, such as labor and depreciation of equipment, total inputs rose to $35 per broiler. This means that farmers on the project saw an overall loss of $13 per broiler raised. Excluding labor, this becomes a modest profit of $1.26 per broiler processed. These figures highlight the importance of understanding all costs, but especially non-cash costs, as they can easily be the deciding factor for net profitability.
The largest single expense in raising pastured chicken is feed, which accounted for nearly 22% of total costs. It was found that per broiler, feed costs averaged $6.00 each, chick costs were $2.70 each, marketing costs were $2.74 each, and processing costs were $8.76 each. There was no statistical difference when we compared costs for farms processing chickens on-farm to those sending their birds out for processing when all time, equipment, packaging, and mileage categories surrounding processing were accounted for.
Pricing
In year 1, farms sold an average of 75 percent of broilers as whole birds and 25 percent as parts. Pricing data suggests that farmers who sold a mix of whole birds and parted out birds had higher pricing on their whole birds. In year 1, farms selling only whole birds had a median whole-bird price of $4 per pound, compared to $5.25 per pound for farms selling both whole birds and parts. However, this difference was not statistically significant, meaning it could have occurred by chance. By year 2, the gap widened, with median whole-bird prices rising to $4.25 per pound for whole-only farms and $5.63 per pound for farms selling both whole birds and parts. This difference was statistically significant, indicating a more reliable association between diversified product offerings and higher whole-bird sale prices. These results suggest that pricing parts helps producers to better understand the value of their whole birds and raising their prices of whole carcasses. However, additional data would be necessary to confidently confirm this pattern.
Average whole-bird prices across the project were $5 per pound, but prices ranged widely from $2.50 to $11 per pound. Observationally, farms charging higher prices tended to report greater profitability, as well as lower storage (freezer) needs and reduced marketing costs. While this can suggest that price-setting plays a significant role in financial outcomes, other factors such as how well a farm has developed a market for their product are likely play a greater role in lowering these common non-cash expenses.
While 69% of farms operated a profitable broiler enterprise when unpaid labor was excluded, only 26% remained profitable once non-cash labor was included, valued at a minimum wage of $15 per hour.
There was no statistically significant difference in earnings based on processing methods (on-site versus off-site), even though farmers processing on their own were generally more profitable (32%) than those with off-site processing (18%), showing the variability in the data. Ultimately, the labor inputs needed to take birds to and from the processor plus the costs of processing equal the depreciation on processing equipment, labor, and direct inputs (ice, packing bags, propane) needed to process chickens on the farm. Individual farms should consider their distance to a processor and their pricing as they make the decision of if processing on-farm is a worthwhile venture for them.
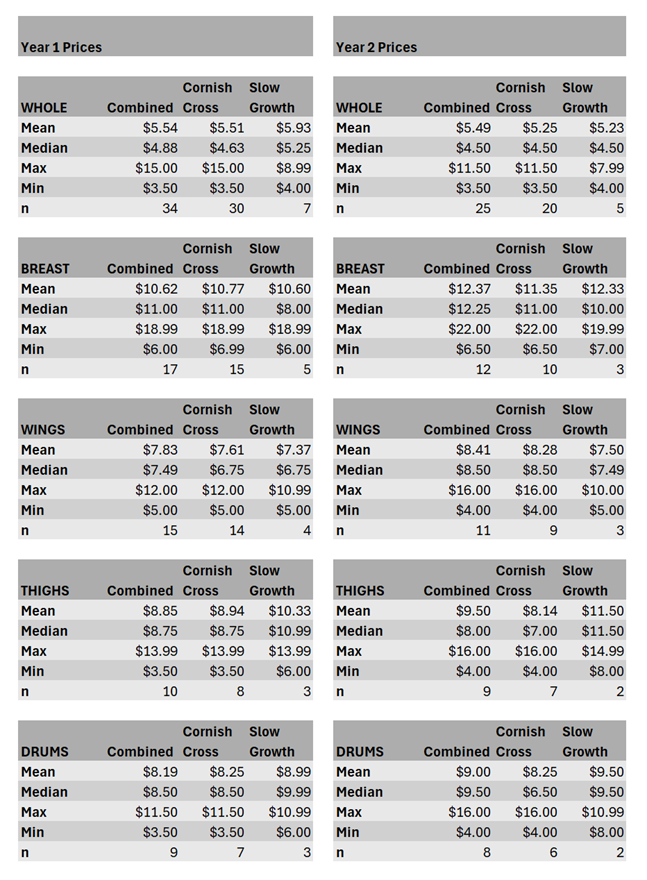
Price breakdowns (seen in the table below) between Cornish cross and slow growth broilers did not show statistically significant pricing differences within or between years. This is discouraging because of the documented increased production inputs involved with raising slow growth broilers (longer flock cycle, smaller processed weight, higher amount of feed per pound of chicken produced).
In the first year, median whole-bird prices were higher for slow growth broilers ($5.25) than Cornish Cross broilers ($4.63), while Cornish Cross birds tended to see higher prices for breasts ($11.00) than slow growth ($8.00). The median price for wings was the same across both types ($6.75), while slow growth birds generally saw higher prices for thighs ($10.99) than Cornish Cross ($8.75). Drumsticks also followed this trend, with slow growth thighs ($9.99) selling higher than Cornish Cross thighs ($8.50). Across all categories, the price data was more robust for Cornish Cross broilers due to larger sample sizes.
The second year’s price values dealt with even smaller sample sizes due to more incomplete data being turned in for analysis. However, notable differences for year 2 include: the same median whole price for both broiler types ($4.50); an increase in slow growth median breast price ($10.00) while Cornish Cross breast remained the same ($11.00); and an increase in median wing prices, with Cornish Cross ($8.50) being sold for more than slow growth ($7.49). Drums and thighs had no confident comparative values for year 2, with slow growth prices for each relying on two flocks for their data.
Other parts, such as carcasses, hearts, livers, necks, and feet had similarly little data. From year 1 to year 2, the median prices of each changed as follows: carcasses from $3.99 to $3.00, hearts from $7.00 to $12.99, livers from $9.50 to $13.99, necks from $4.99 to $3.99, and feet remaining at $3.99 both years. However, the small numbers of flocks reporting data included in these averages mean that we cannot make confident comparisons year over year; they are only snapshots of what our producers are charging.
The table below shows the breakdown of farmer pricing for whole birds and parts for both Cornish cross and slow growth broilers in year 1 and year 2. The letter "n" indicates the number of flocks used to make up the calculation.
Profitability
Over the course of the project, 81% of participating farms improved their profitability from year 1 to year 2. This improvement was largely attributed to better management driven by closer financial scrutiny and more defined goal setting following their year 1 experience on the project. Farmers identified specific areas to change at the end of the year according to their farm business strategy and goals, including tighter cost control through reduced waste; adjustments to flock size to better match labor capacity or achieve better economies of scale; and more efficient mileage management, such as scheduling regular feed deliveries vs picking up a bag of feed here and there from the mill. Many farmers also focused on improving labor efficiency, refining marketing strategies, and, in some cases, simply raising prices. Together, these changes suggest that profitability gains were less about dramatic shifts and more about incremental improvements, often informed by a more thorough understanding of their financial data.
If they’re not making a profit with broilers, farmers have a few options. One is to reduce expenses, which can be difficult given high feed and overhead costs. Some of these costs, such as mileage and equipment, can be somewhat compensated for if broilers are just one part of a larger operation, but standalone broiler producers will be facing an uphill battle. Another option is to increase income per bird, which can be done by increasing prices, reducing losses, or in some cases just reconsidering how many broilers are saved for home use when their costs are lumped into the farm business’s enterprise costs. Lastly, given that broilers are not a great standalone enterprise, the best option for some farmers may simply be to stop raising broilers and invest in other operations.
Opportunities for Improvement:
The most common issue we saw over the course of this project was that many farmers kept sparse or incomplete records that made it difficult to come to any confident and statistically-sound conclusions. Farmers noted, understandably, that record keeping is not always a top priority, and that it can be extremely difficult to accurately account for all of the different expenses that count towards their broiler enterprise. However, many farmers reported that taking more complete and accurate records was one of the changes they wanted to make during the project.
When asked what improvements and changes they planned to make at the end of year 1 to be more profitable in year 2 and at the end of year 2 for their broiler enterprise moving forward, farmers gave a wide variety of answers. This is because each operation experiences and approaches raising chickens differently, providing a range of areas for improvement. A significant plurality of farmers chose improving their record keeping as one of, if not the only, changes they planned to make, with many describing a desire to record expenses more regularly and improve how they organized their financial data. Record keeping was by far the most commonly cited category of goal, having over twice as many farmers report it compared to the next most common category, which were goals that involved optimizing throughput. Many also had changes related to chicken tractors: planning to start using them rather than their current set-up, fix aspects of existing ones, and/or add additional ones. Some singular goals mentioned include reducing mortality, expanding freezer storage capacity, improving on-farm processing facilities to become NYS 5A compliant, and finding a new feed distributor for higher quality feed. At the start of both years, only a few farmers cited an interest in downsizing, with none openly indicating an intent to completely stop raising broilers.
Interestingly, market aggregation and collective purchasing, which are ways to decrease costs and improve access to markets, were not identified by the producers as ways that they could increase profitability from year 1 to year 2, so they were not explored with educators during the course of this project. Instead, the goals were very much individually focused and not focused on improving profitability for broiler producers across the region.
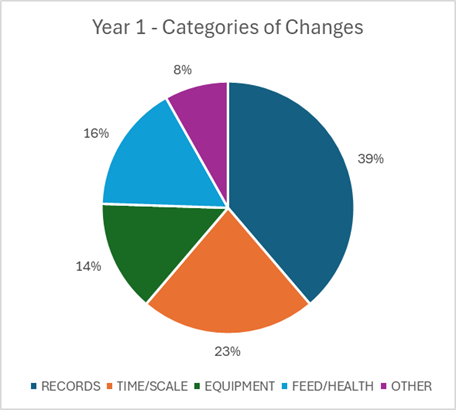
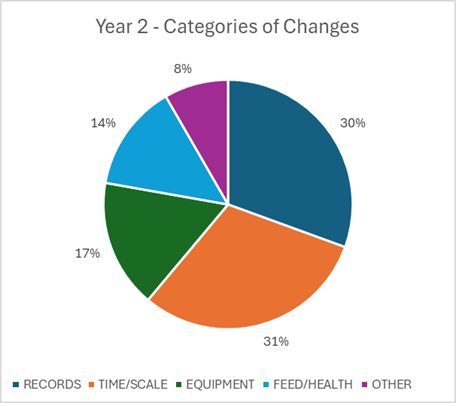
The pie charts below show the breakdown of changes made at the end of year 1 and year 2 to improve profitability of farmers' broiler enterprises.
Literature Cited:
Adeleye, O. et al. (2021). Apple cider vinegar administration on carcass characteristics and meat quality of broiler chickens. Tropical Animal Health and Production. 53(530).
Bras, R. (2016). Insoluble granite-grit allows broiler chicks to have better growth performance and gut health. R. Bras. Zootec. 45 (11).
Champrix Animal Nutrition. (2025). Mortality in Broilers and Laying Hens. From https://champrix.com/articles/mortality-in-broilers-and-laying-hens
Cobb-Vantress. (2022). Cobb 500 Broiler Performance & Nutrition Supplement. Pages 3-5. https://www.cobbgenetics.com/assets/Cobb-Files/2022-Cobb500-Broiler-Performance-Nutrition-Supplement.pdf
Cobb. (2021). Cobb Broiler Management Guide. From https://www.cobbgenetics.com/assets/Cobb-Files/Broiler-Guide_English-2021-min.pdf
Garipoglu, A. V., Erener, G., and Ocak, N. (2006) Voluntary intake of insoluble granite grit offered in free choice by broilers: its effect on their digestive tract traits and performance. Asian-Australian Journal of Animal Sciences. 4(549-553).
Jahantigh, M., Kalantari, H., Davari, S., and Daadati, D. (2020). Effects of dietary vinegar on performance, immune response, and small intestine histomorphology in 1- to 28-day broiler chickens. Vet Med Sci. 7(3):766–772
Leeson, S. and Summers, J.D. (2008). Commercial Poultry Nutrition: 3rd Edition. Nottingham University Press.
Lorenzoni, G. (2023). Avian Coccidiosis. Penn State Extension. From https://extension.psu.edu/avian-coccidiosis
Pendleton, E. (2023). Marek’s Disease in Chickens. Penn State Extension. From https://extension.psu.edu/mareks-disease-in-chickens
Ross. (2022). Ross 308 and Ross 308 FF Performance Objectives. Pages 3-5. https://aviagen.com/assets/Tech_Center/Ross_Broiler/RossxRoss308-BroilerPerformanceObjectives2022-EN.pdf
Sivus, B., et al. (2017). Performance and digestive function of broiler chickens given grit in the diet. Nutrition and Metabolism. 58 (660).
Vencomatic Group. (2022). Broiler Mortality: 7 contributing factors and how to reduce it. From https://www.vencomaticgroup.com/blog/broiler-mortality-contributing-factors-and-how-to-reduce-it
Performance:
- Mortality was the leading cause of production losses in our study, with predators being the primary reason for losses later in the growing cycle. Better management around predators can mean the difference between a profit or a loss in a flock. Our project revealed that the losses in raising pastured poultry far exceed those that are outlined by commercial production guides.
- There are opportunities to decrease the feed bill and optimize growth by providing a feed with a protein concentration that is matched to the age of the flock.
- Managing brooders to improve conditions (warmer, more space, less moisture) can help set young chicks up for success on pasture. Disease and unthriftiness resulting from poor brooder management can result in depressed weight gain and finished weights.
- Targeting an average finished weight per flock rather than an average flock age can help producers meet their goals for pounds of chicken produced in a season.
- All male flocks tend to finish out birds that are significantly heavier (1.37-1.75 pounds more) and are slightly more feed efficient than all female flocks, which may be a strategy the can be used by producers to get more pounds of meat from their production system.
- Slow growth chickens take about 50% longer to raise out than Cornish cross chickens to achieve similar finished weights and are less feed efficient.
- The carcasses of Cornish cross birds yield 6.8% more saleable parts than slow growth chickens. Slow growth chickens had a larger portion of leg meat as a percentage of the whole carcass vs the Cornish cross.
- Parting out carcasses with more bone-in, skin-on cuts results in a larger % of the whole bird to sell.
Financial:
- Accurate recordkeeping was the most challenging part of this project for farmers. Many farmers commented that there were more input costs associated with raising broiler chickens than they'd initially realized.
- Farmers who knew their true costs of production were able to more critically evaluate their enterprise and make changes that led them to be more profitable.
- On average, farmers on the project improved their income per broiler sold by $7.29 (+/- 2.19). With an average flock on the project containing 101 birds, that is a total increased average income of $736.29/flock (+/- $221.19).
- 81% of the farmers on the project increased their profitability from year 1 to year 2. Small, incremental improvements from year 1 to year 2 helped to accomplish this goal.
- The biggest changes that our farmers made from year 1 to year 2 included recordkeeping (39%), time management and scaling the enterprise (23%), improving processing or pasturing equipment (14%), and improving feeding regimes and general health related parameters for the flock (16%). Interestingly, market aggregation and collective purchasing, which are ways to decrease costs and improve access to markets, were not identified by the producers as pathways to profitability.
- When farmers were asked about the changes they'd make into year 3 and beyond, the categories remained the same as they did at the end of year 1, with a a shift away from record keeping improvements (down to 30% from 31%) and towards feed and health related changes (increase to 31% from 23%).
Education
Twenty farms raising slow-growth broilers on pasture and twenty farms raising conventional broilers on pasture were selected from a list of farms that had either shown interest in participating in our project from our state-wide survey or had worked successfully with Extension in the past. Each farmer worked with their regional or county educator on this project over the course of two years to share their year 1 costs of production, determine ways to improve profitability, and then implement those changes from year 1 to year 2.
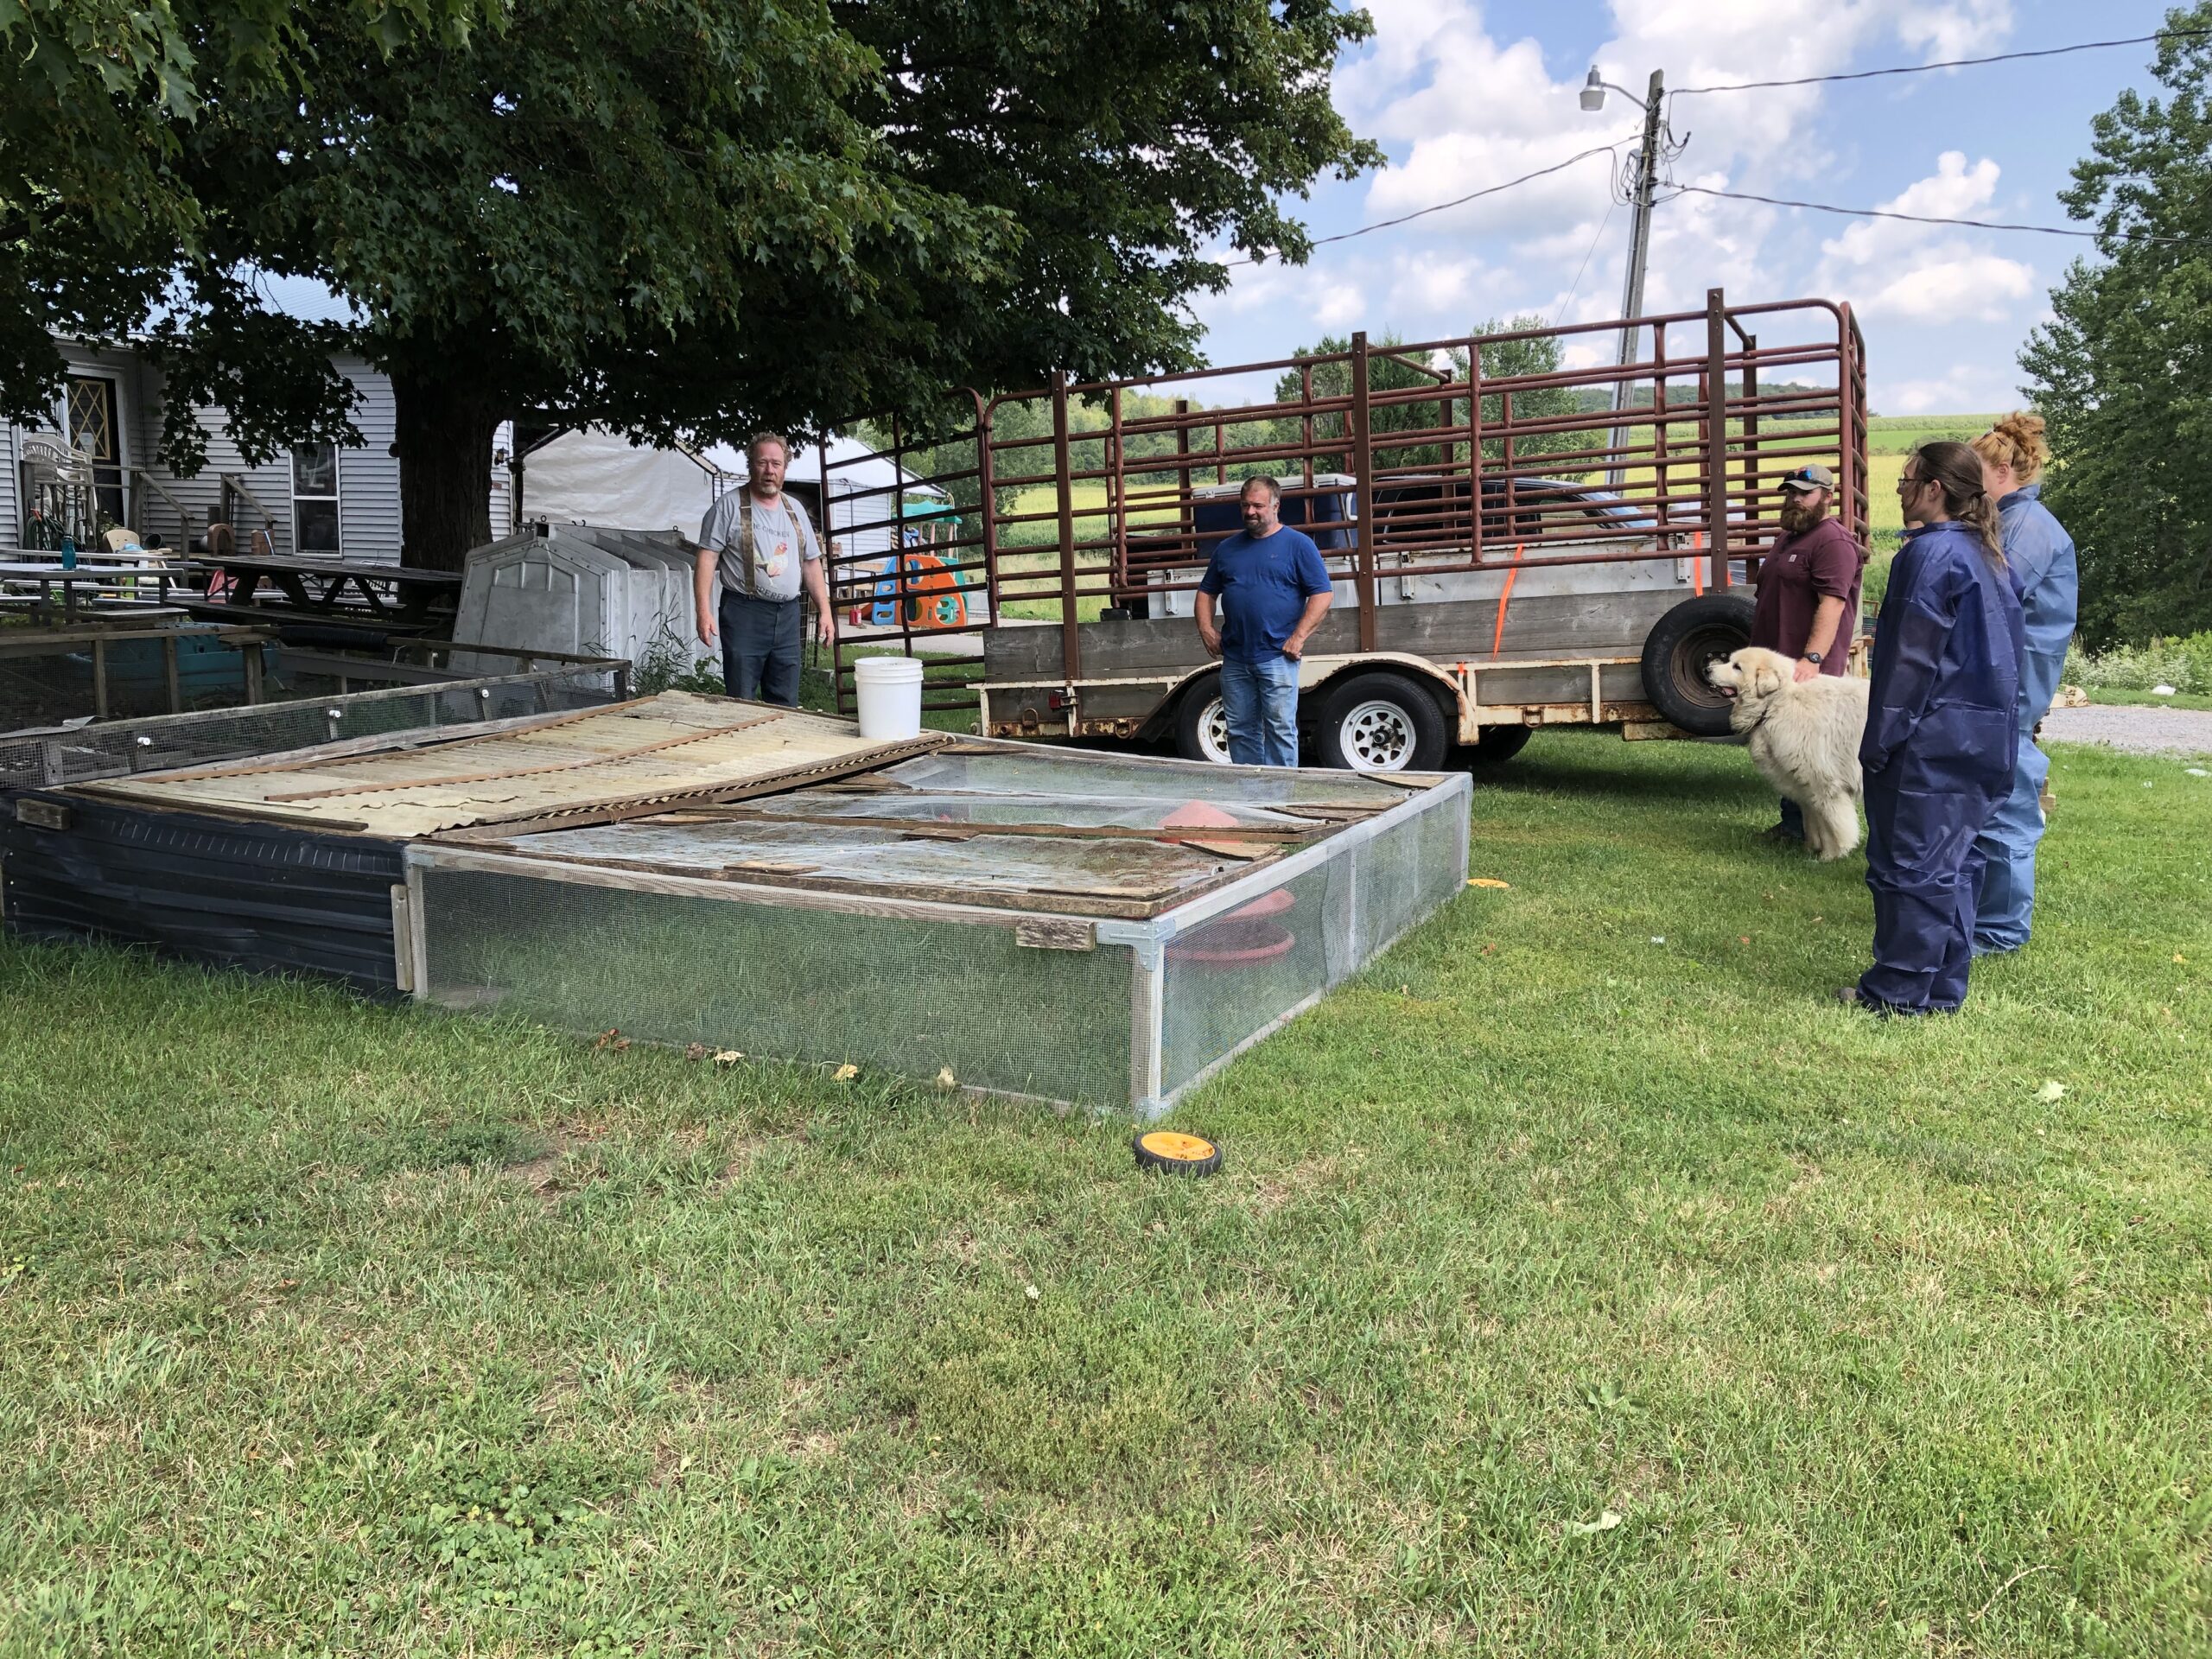
Six field days and 1 project summary webinar were hosted state-wide, reaching 175 individuals. These focused on reducing production costs and adding value in commercial broiler enterprises. They were targeted towards farmers who were either currently raising or looking to raise broilers. The field days were hosted in the following counties: Wyoming, Allegany, Rensselaer, Chautauqua, and Erie. One virtual field day was hosted via Zoom. Attendees received support from their local educators and the project team if they had questions regarding applying changes to their enterprises to make a better profit, or if they needed assistance in planning their enterprise.
The results of the project were shared at various stages of the project at the Catskills Regional Agriculture Conference (2023), Cornell Cooperative Extension's In-Service (2024), and the New England Grazing Network's Northeast Grazing and Livestock Conference (2024). This forum allowed our team to share the data from our project with other extension agents, farm service providers, and grazing-focused livestock producers from across the Northeast.
Milestones

Milestone 1 – Engagement, Learning, and Evaluation: Complete
- Participants: Cohort 1, target of 30 farmers.
- What farmers will learn or do: 30 farmers will take the first survey to provide a baseline for budgeting, costs of production, and current pricing. Farmers work with their assigned educator to record their true costs of production and income over two flocks.
- Proposed completion date: October 2022
- Project Team involvement: Katelyn will develop the enterprise budget tool. Educators will help collect production and cost data. They will teach on-farm and value-added processing, as requested, and distribute the verification survey. Amy will collect and evaluate the survey data.
Milestone 1 Accomplishments:
Cohort 1 ended up only having 18 farmers participate in the research portion of the project in year 1 due to challenges with increased costs, the threat of Highly Pathogenic Avian Influenza, and getting out of broilers for one reason or another.
The survey and data collection tools for the project were created by Amy and Katelyn and farmers worked with their assigned educators to collect the data.
In this first year, farmers were really supportive of the project, and appreciated the opportunity to review their enterprises, experiences, and decisions one-on-one with their local extension specialists. Several producers learned processing and parting out on-farm this year and many learned what it takes to keep accurate and complete records. Farmers also made note of the changes they'd make to be more profitable in year 2, which ranged to keeping better records to improving flock management to increasing prices and finding additional markets.
Milestone 2 – Learning: Complete
- Participants: Cohort 1, target of 30 farmers
- What farmers will learn or do: 30 farmers will be provided their year 1 data summary and discuss changes in production, management, pricing, and markets which will yield a profitability increase with their educator. They will join a Zoom call to discuss these changes with other farmers and compare their data to the average benchmark of farms on the project.
- Proposed completion date: March 2023
- Project Team involvement: Katelyn will provide enterprise summaries. Educators will provide enterprise feedback to their assigned farmers. Amy will lead the discussion group.
Milestone 2 Accomplishments:
The data from the first cohort of 18 farmers on the project was evaluated by Katelyn Walley-Stoll and Amy Barkley and presented in a virtual farmer discussion circle hosted on March 23, 2023. Participating farmers received an individualized production analysis report, profitability report, and the state-wide averages to benchmark themselves against. They also outlined changes that they were making heading into the second growing season on the project to increase profitability.
Milestone 3 – Engagement, Learning, and Evaluation: Complete
- Participants: Cohort 1 consisting of the target of 30 farmers and Cohort 2 consisting of a target of 10 additional farmers.
- What farmers will learn or do: These 10 additional farmers will be officially recruited to the project, take the first survey, and collect data for year 1. Farmers work with their assigned educator to record their true costs of production and income over two flocks. The 30 original farmers will collect year 2 production and pricing data.
- Proposed completion date: October 2023
- Project Team involvement: Educators will collect production and cost data with the farm. They will teach on-farm and value-added processing as requested to individual farmers. Educators will distribute the survey. Amy will collect and evaluate the survey data.
Milestone 3 Accomplishments:
In early 2023, 18 additional farms were recruited to the project, bringing the total farm participants to 36. The challenges faced in recruitment in 2022 continued in 2023 as feed prices stayed high, keeping farms from raising broilers in 2023 and forcing some farms raising slow-growth broilers to switch over to Cornish Cross for their added efficiency. Added to this was the challenge of a chick shortage from HPAI, resulting in some farms not getting access to chicks in a timely manner.
Farmers participating in cohort 2 were introduced to the project in the spring of 2023 and collected year 1 data on their two flocks using the survey and data collection tools. Four farmers requested education in broiler processing and received one-on-one training over the course of the season.
During this time farmers in cohort 1 collected their year 2 data, requesting guidance as needed from their educators.
Milestone 4 - Engagement, Learning, and Evaluation: Complete
- Participants: 125 current and potential pasture-raised broiler producers
- What farmers will learn or do: Farmers will participate in scheduled and peer-to-peer learning through the pastured broiler field days. The scheduled program will cover feeding schedules and types of feeds; management to limit mortality and promote growth; enterprise budgeting; and an opportunity to gain hands-on practice with further processing techniques allowed under the 1,000 bird exemption. Farmers will fill out the pre-and post field day verification tool.
- Proposed completion date: December 2023
- Project Team involvement: Amy and one additional educator will secure the farms, plan and host the field days, and teach the presentations/demonstrations. Amy will distribute the verification tool and collect & evaluate the survey data.
Over 2023 and 2024, six field days were hosted as part of this project, with one being a partnership with the American Farmland Trust and one being a virtual webinar.
The 2023 field day was held at HLW Acres Poultry Processing in Attica, NY. In addition to the scheduled programming on poultry rearing, poultry processing, and enterprise viability, participants had the opportunity to tour the host's certified 5A poultry processing facility. We had 8 individuals in attendance.
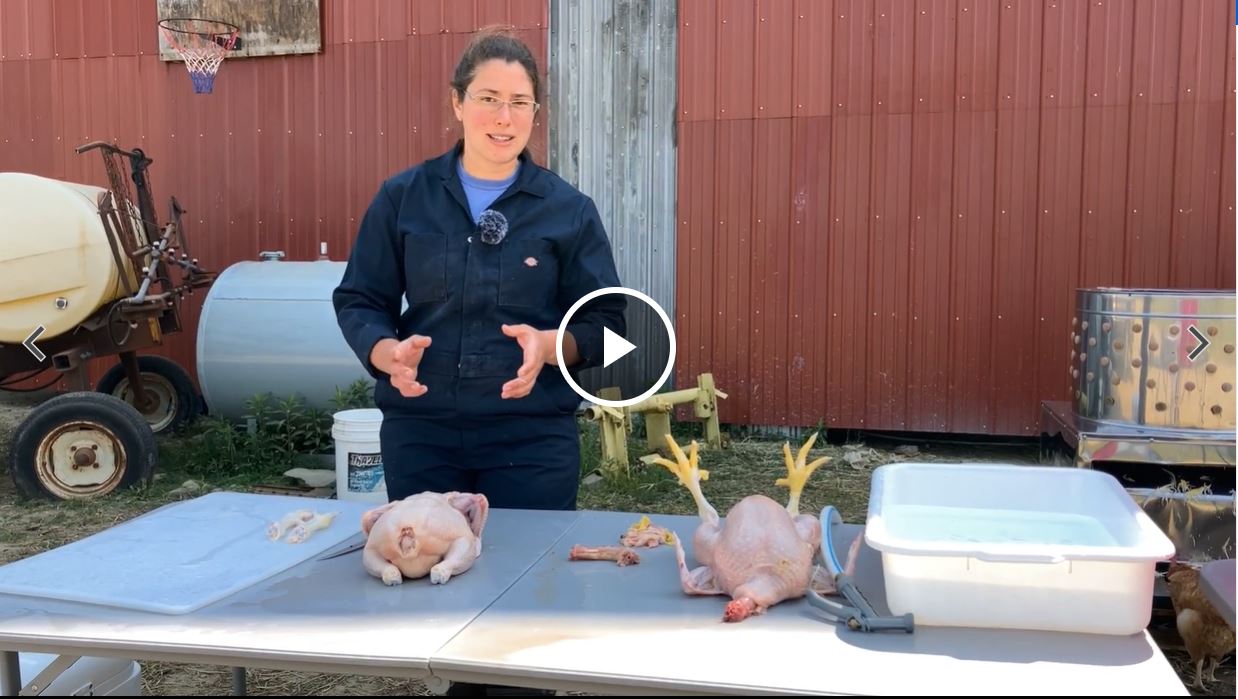
The virtual broiler field day was held on September 20, 2023. This program was unique because in addition to the concepts learned at the in-person field days, we used the support of the Cornell Small Farms Farm Ops Program to record videos of humane poultry handling and processing that were shared with participants. This program had 31 live viewers and the YouTube recording had 97 views since it was uploaded (as of 1/27/26). You can view the recording here: https://www.youtube.com/watch?v=RyH61R8rSCc&t=5597s.
In 2024, we were able to host 3 additional in-person broiler field days. The first was held at Sunny Cove Farm in Alfred, NY on 6/6/24 and had 12 participants. The second was hosted at Green Heron Growers in Panama, NY on 9/17/24 and had 7 participants. The final field day was hosted at Laughing Earth Farm in Cropseyville, NY on 8/19/24 with 14 participants.
In addition, Amy was invited to teach broiler production and processing as part of a Women for the Land learning circle in 2024. She partnered with Kate Geiger from Boston Hills Farm in Hamburg, NY for the 4 hour education session on poultry rearing, processing, and profitability, reaching 13 women farmers. This program was hosted on 7/11/24.
All-together, our field days reached 182 individuals through in-person workshops (54 individuals), field day webinar viewers (31 individuals), and field day webinar recording viewers (97 individuals).
In addition to meeting this milestone's goals, Amy presented general guidelines for broiler production, processing, and pricing to a large, diverse farmer/educator audiences, including preliminary project results. These conferences included:
- Catskills Regional Ag Conference on 1/13/23 (40 individuals)
- Northeast Grazing Network Annual Conference on 1/7/24 (25 individuals)
- Cornell Cooperative Extension In-Service on 11/19/24 (20 individuals)
Participants were surveyed as part of this milestone to determine and verify learning. These results are shared below:
Thirty-one farmers participated in the field day surveys that were given immediately prior to the field day and immediately following the field day. Survey participants indicated that 20 currently raised broilers and 11 did not. Of those that did not, 9 were planning on raising them in the future. Of those who were planning on raising broilers in the future, 50% indicated that they wanted to raise Cornish cross broilers while 25% wanted to raise slow-growth breeds and 25% wanted to raise heritage egg-type cockerels or dual purpose breeds.
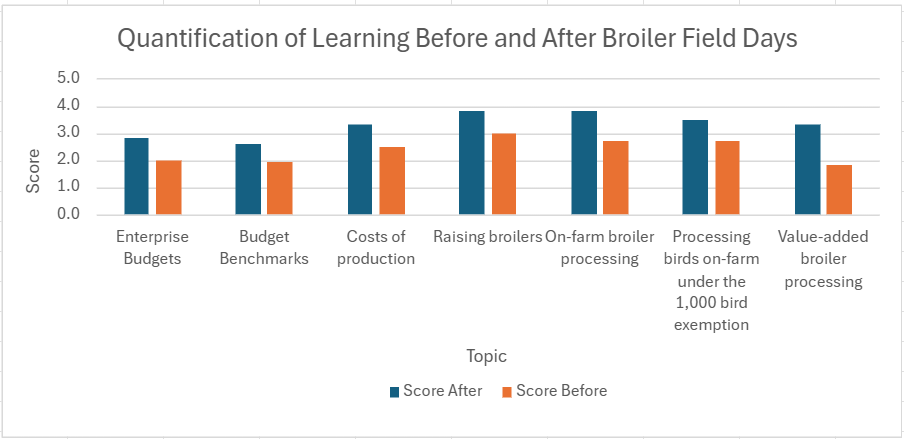
As part of the survey, participants rated their knowledge on a 1-5 scale regarding different aspects of raising broilers and running a broiler enterprise. The majority of participants (77%) had experience with raising broilers in some capacity, and broiler rearing categories were ranked highest in terms of knowledge before the workshops. As anticipated, the base knowledge for enterprise budgets, budget benchmarks, and value-added processing were the lowest rated categories.
Following each two-hour long workshop, attendees showed an overall increase in knowledge across all topics covered at the workshop.
Feedback from attendees was overwhelmingly positive, with the most value being derived from the farm tours and having experts available at the event to guide them through the various topics presented.
The pre-workshop survey also asked ten questions about the participant's agreement with topics related to broiler production and enterprise profitability, ranked on a 1-5 scale. The three statements that attendees agreed with most were, "I would benefit from working with Cornell Cooperative Extension to review my pastured broiler enterprise", "If I knew what it cost, on average, to produce a pound of meat in a pasture broiler enterprise, I could be more profitable", and “I need more data to decide if I can make money on pastured broilers”.
From the data and feedback we received in the post-workshop survey, we confirmed that we were able to meet our workshop goals, providing valued education around broiler production, management, and enterprise budgeting.
The table below shows participant learning from the field days by comparing quantitative scores before and after the workshops on a variety of topics. A score of 1 indicates very little familiarity with a topic, while a score of 5 indicates that one is very familiar with the topic.
Milestone 5 – Learning: Complete
- Participants: Cohort 2 (just finished year 2 data collection) and Cohort 1 (just finished year 1 data collection)
- What farmers will learn or do: Farmers will be provided with their data and discuss changes in production, management, pricing, and markets which will or have yielded a profitability increase. They will join a Zoom call to discuss these changes with other farmers and compare their data to the average benchmark of farms on the project.
- Proposed completion date: March 2024
- Project Team involvement: Katelyn will provide enterprise summaries, and educators will provide feedback to their farms. Amy will lead the discussion group.
Our team collected and evaluated Cohort 1's second year data and Cohort 2's first year data in early 2024. Farmers received their individualized production and financial reports in April 2024.
Cohort 1 received a report of their year 2 enterprise summaries (production and financial) that they could compare against how their enterprise performed in year 1. This was in addition to the statewide benchmark data for their cohort for year 2. This cohort's discussion circle to review their benchmarks was hosted on on 4/16/24
Cohort 2 had their discussion circle on 4/11/24. Because they only had one year of data, they were only able to compare their production and financial summaries to the statewide benchmark.
Milestone 6 – Evaluation: Complete
- Participants: Cohort 1 and Cohort 2
- What farmers will learn or do: Farmers will take post-project survey to provide their new baseline for budgeting, costs of production, and their updated prices.
- Proposed completion date: March 2024
- Project Team involvement: Educators will distribute the survey. Amy will collect and evaluate the data.
Through their data collection and survey binders, farmers in Cohort 1 took their end of project survey. Through the reports shared with them and meetings with their project educators, they determined ways to further improve their broiler enterprise profitability moving forward.
Farmers in Cohort 2 took their end of year 1 project survey through their data binders, which included changes they intended to make in year 2 to improve profitability. The reports created from this data helped them to understand their baseline for budgeting, costs of production, and their updated prices.
Milestone 7 – Engagement: Complete
- Participants: Cohort 2 farmers
- What farmers will learn or do: The second cohort of 10 farmers will collect year 2 production and pricing data.
- Proposed completion date: October 2024
- Project Team involvement: Educators will collect production and cost data with the farm and provide support as needed.
Farmers in cohort 2 worked with their educators in 2024 to collect year 2 data, including the verification surveys embedded within their data collection binders. There was some additional educational support needed by some of the farms during the growing season, which was provided by the educators.
Milestone 8 – Evaluation: Complete
- Participants: 125 field day participant farmers recruited, 42 expected to answer the survey.
- What farmers will learn or do: Farmers will take post-field day survey, distributed 12 months out from the date of completion of each field day to provide the project team with each’s updated baseline for budgeting, costs of production, and their current pricing.
- Proposed completion date: December 2024
- Project Team involvement: Educators will distribute the survey. Amy will collect and evaluate the data.
Field day participants were sent a learning survey at the end of the grant period, rather than 12 months out from the time of each field day to make data management easier. Unfortunately, this decision resulted in a limited number of responses (8 useable responses) that did not meet the target set in this milestone (42 responses). However, what the data uncovered here was interesting. Of the 8 respondents, 3 left raising broilers all together since they attended our workshops. Two individuals never got into raising broilers, even though they showed interest by attending our workshops.
Unfortunately, the sample size for individuals raising broilers is too small to draw many other conclusions. The variance of time raising broilers ranged from less than a year to over 10 years, and the breeds included Cornish Cross and heritage breeds, raised in groups to total between 50 - 800 birds. The economies of scale vary so much between these three producers that budgeting, costs of production, and pricing conclusions could not be drawn.
Milestone 9 – Engagement, Learning, and Evaluation: Complete
- Participants: 50 current or potential pasture-raised broiler farmers will participate in one of 2 pastured broiler webinars
- What farmers will learn or do: Farmers will learn how to manage production costs, including feeding schedules and types; management to limit mortality and promote growth; enterprise budgeting; and value-added processing as well as gain tips on identifying markets and raising prices.
- Proposed completion date: January 2025
- Project Team involvement: Amy and Katelyn will develop and teach the webinars. Amy will distribute the verification tool and collect & evaluate the survey data.
While we planned to host this webinar set in the spring of 2025, transitions within our research team pushed that timeline to November 2025.
Instead of hosting two webinars as planned, we felt that it would be a better use of time to share one webinar that covered both the production and financial management of raising broilers, using the summarized data from our research project. The webinar took place on November 13, 2025, and had 55 registrants. We made a recording of the webinar, which was sent to all registrants and posted on our team's YouTube channel for reference by anyone who may be interested in the topic. At the time of this report (1/27/26), there were 48 views of the recording. That can be found here: https://www.youtube.com/watch?v=t7FZi1-_4Fw
The two-hour long webinar covered the final benchmark data related to the project and shared information about production costs, rearing nuances, management to limit mortality and promote growth, carcass yields from live, parts yields from whole carcasses, the most significant costs associated with raising broilers, and the ways to improve profitability. We also shared some of the common recordkeeping challenges for farmers who are looking to better understand their production costs.
A follow-up survey made through Qualtrics was shared following the webinar, but only one person responded. We are unsure why the response rate was so low. In hindsight, we could have had a new window pop up with the survey when the webinar ended. That strategy may have garnered more responses than sending out the survey with the webinar recording the next day.
Milestone 10 – Learning: Complete
- Participants: Cohort 2 farmers
- What farmers will learn or do: Farmers will be provided with their data and discuss changes they’ve made in production, management, pricing, and markets which have yielded a profitability increase. They will join a Zoom call to discuss these changes with other farmers and compare their data to the average benchmark of farms on the project.
- Proposed completion date: December 2025
- Project Team involvement: Katelyn will provide enterprise summaries. Educators will provide enterprise feedback to their assigned farmers. Amy will lead the discussion group.
The second cohort's year 2 project data and survey binders were collected and analyzed by Katelyn and Amy, with reports being created for both production and enterprise finances. These were shared back with the farmers, who were able to compare to how they did in year 2 vs year 1 on an individual benchmark basis. Their discussion circle was completed on April 23, 2025. At this discussion circle, they were able to compare their individual farm performance to the statewide benchmarks for their cohort.
Milestone activities and participation summary
Educational activities:
Participation summary:
Learning Outcomes
Performance Target Outcomes
Target #1
40
Farmers on the project will make changes in the production and financial management of their broiler enterprises to improve profitability per chicken processed.
Each of the farmers' whole farm production will be impacted, not just the project flocks. That number varies by year for each farm, but 8,000 is a good target if we estimate each farmer to raise 200 chickens/year.
Farms that are part of the project will look critically at flock performance and financial balance sheets while making changes to increase income by $4.85/bird, or $363.75/flock.
36
Each farm critically evaluated their production financial data from their first year on the project to see where they could make changes that would increase their profitability in year 2. Changes included improving recordkeeping, increasing time efficiency, updating or purchasing new or better equipment, improving chicken health, and decreasing feed costs.
Farmers in year 2 on the project raised 8,111 total chickens.
Farmers improved their income per broiler sold by $7.29 (+/- 2.19). With an average flock on the project containing 101 birds, that is a total increased average income of $736.29/flock (+/- $221.19).
We will verify learning from the 40 farmers on the project through a pre-participation and post-participation survey, which will include estimates of the costs of production and profitability per bird. Flock costs of production and income values collected by educators and evaluated by our team's farm business management specialist will verify what has been shared in the survey; these numbers will be used to show the difference in profitability per bird from year 1 to year 2.
Evaluation of learning from the webinars and field days will be assessed through three surveys (before, immediately following, and 12 months out from program completion [field days only]) to determine significant changes in understanding, attitudes, practices, and flock income and how they change over time.
The verification survey tool has four major sections:
- Familiarity with different concepts around budgeting and raising broilers
- Level of agreement with statements regarding profitability of broiler enterprises
- How standard costs of production affect their enterprise
- Current price of their broilers and estimated production costs.
Additional Project Outcomes
None at this time.
Comments from some of our farmers and program participants:
"We GREATLY appreciate taking part in this project. Previous to COVID, we had averaged around 500 birds/year and, with this partnership, decided to ramp up again following a 3 year break. So far, so good. We’ve sold almost all the birds we raised for this program and have received good feedback."
"I now know the amount of money we weren't capturing on chicken because thighs and drums don't sell as well as breast meat. We've changed our pricing scheme to make the money back from the breast meat, and then whatever we sell from the rest of the bird is profit."
"This process has been very eye-opening... I almost want to take data on everything!"
"We're not going to raise chicken next year. Our freezer space is better spent on storing pork, which is very profitable for us."
"It was an interesting day! I learned a bunch about cutting up birds efficiently."
"Hi Amy - thank you for doing this webinar, it is may be the single most useful CCE training I've ever attended. We raised 400 broilers this summer and have all the struggles you mention trying to be profitable, even selling at $6.50/lb ($5/lb wholesale to local farmstands). This is both validating and distressing! I was hoping there was something obvious we could fix, but it appears no. Our pre-labor margin on each bird remains about $5 each (better than most I guess). My only question: when will the [published project summary] be available? I expect it to be extremely useful as well."
Through this project we have some reflections and have identified areas for further study.
The first was that if this study of this type was ever to be repeated, regardless of agriculture enterprise, extra attention would need to be made to ensure farmers record data properly and completely. We knew this would be a challenge before the project started, so we provided sectioned notebooks with step-by-step instructions on how to fill them out in addition to farm visits by our team's educators. Those producers who had educators working with them more regularly throughout the growing season provided more complete data sets than those who didn't. The other challenge is that an extensive data documentation ask like this one is difficult to stick with for two years. We believe that our farmers had the best of intentions when starting out on the project, but as life got in the way and things got busy during the growing seasons, they were not able to keep up on the data recording.
An area for future research is to repeat this project, but with larger producers that have better economies of scale. Producers raising over a thousand birds a year can take advantage of decreased feed costs, lower chick costs, lower processing costs, and access to USDA and other large processors, which may decrease expenses and increase income per bird. Having a data set from this scale of producers would complement the one that we currently have as well as update the data set from "Niche Poultry Enterprise in New England". A data set composed of a wide range of farms across the state would get us to the true average of production and profitability moreso than data sets for the scaled single enterprises that are regularly referred to in part because of media attention (Salatin and Suscovich, for example). We had two producers reach out to us who are interested in participating in a project like this, should it be developed.
Another area for further study is one that finds the production and performance parameters for different strains of slow growth broilers. The high level of variation of growth rates, feed conversions, and finished weight potentials between strains was apparent in this project, and it would be helpful for producers to have a better understanding of what the genetic potential is for the breed they select to raise. Not only would strain-specific data be helpful for straight run chicks, but also sexed male and female chicks.
When reviewing the changes that producers made to improve the efficiency and profitability of their enterprises from year 1 to year 2, we realized that they were focused on making changes that benefited only their enterprise and did not take into account changes that would, in theory, benefit both them and other producers in their region. The strategies of aggregating and marketing collectively in addition to collective purchasing, are opportunities to explore in another project.