Final report for LNE22-444
Project Information
Problem and Justification:
Diverse, profitable crop rotations are essential to regenerative agriculture and food systems in the Northeast. With the expansion of regional small grains production, farmers need other high-value crops to improve overall farm profitability. As a food-grade legume, dry bean (Phaseolus vulgaris, also known as common bean) has potential to fill this niche and increase regional food system self-sufficiency. However, despite high demand for organic, regionally grown dry beans, regional production has not risen to meet this demand.
Solution and Approach:
Research Approach and Findings
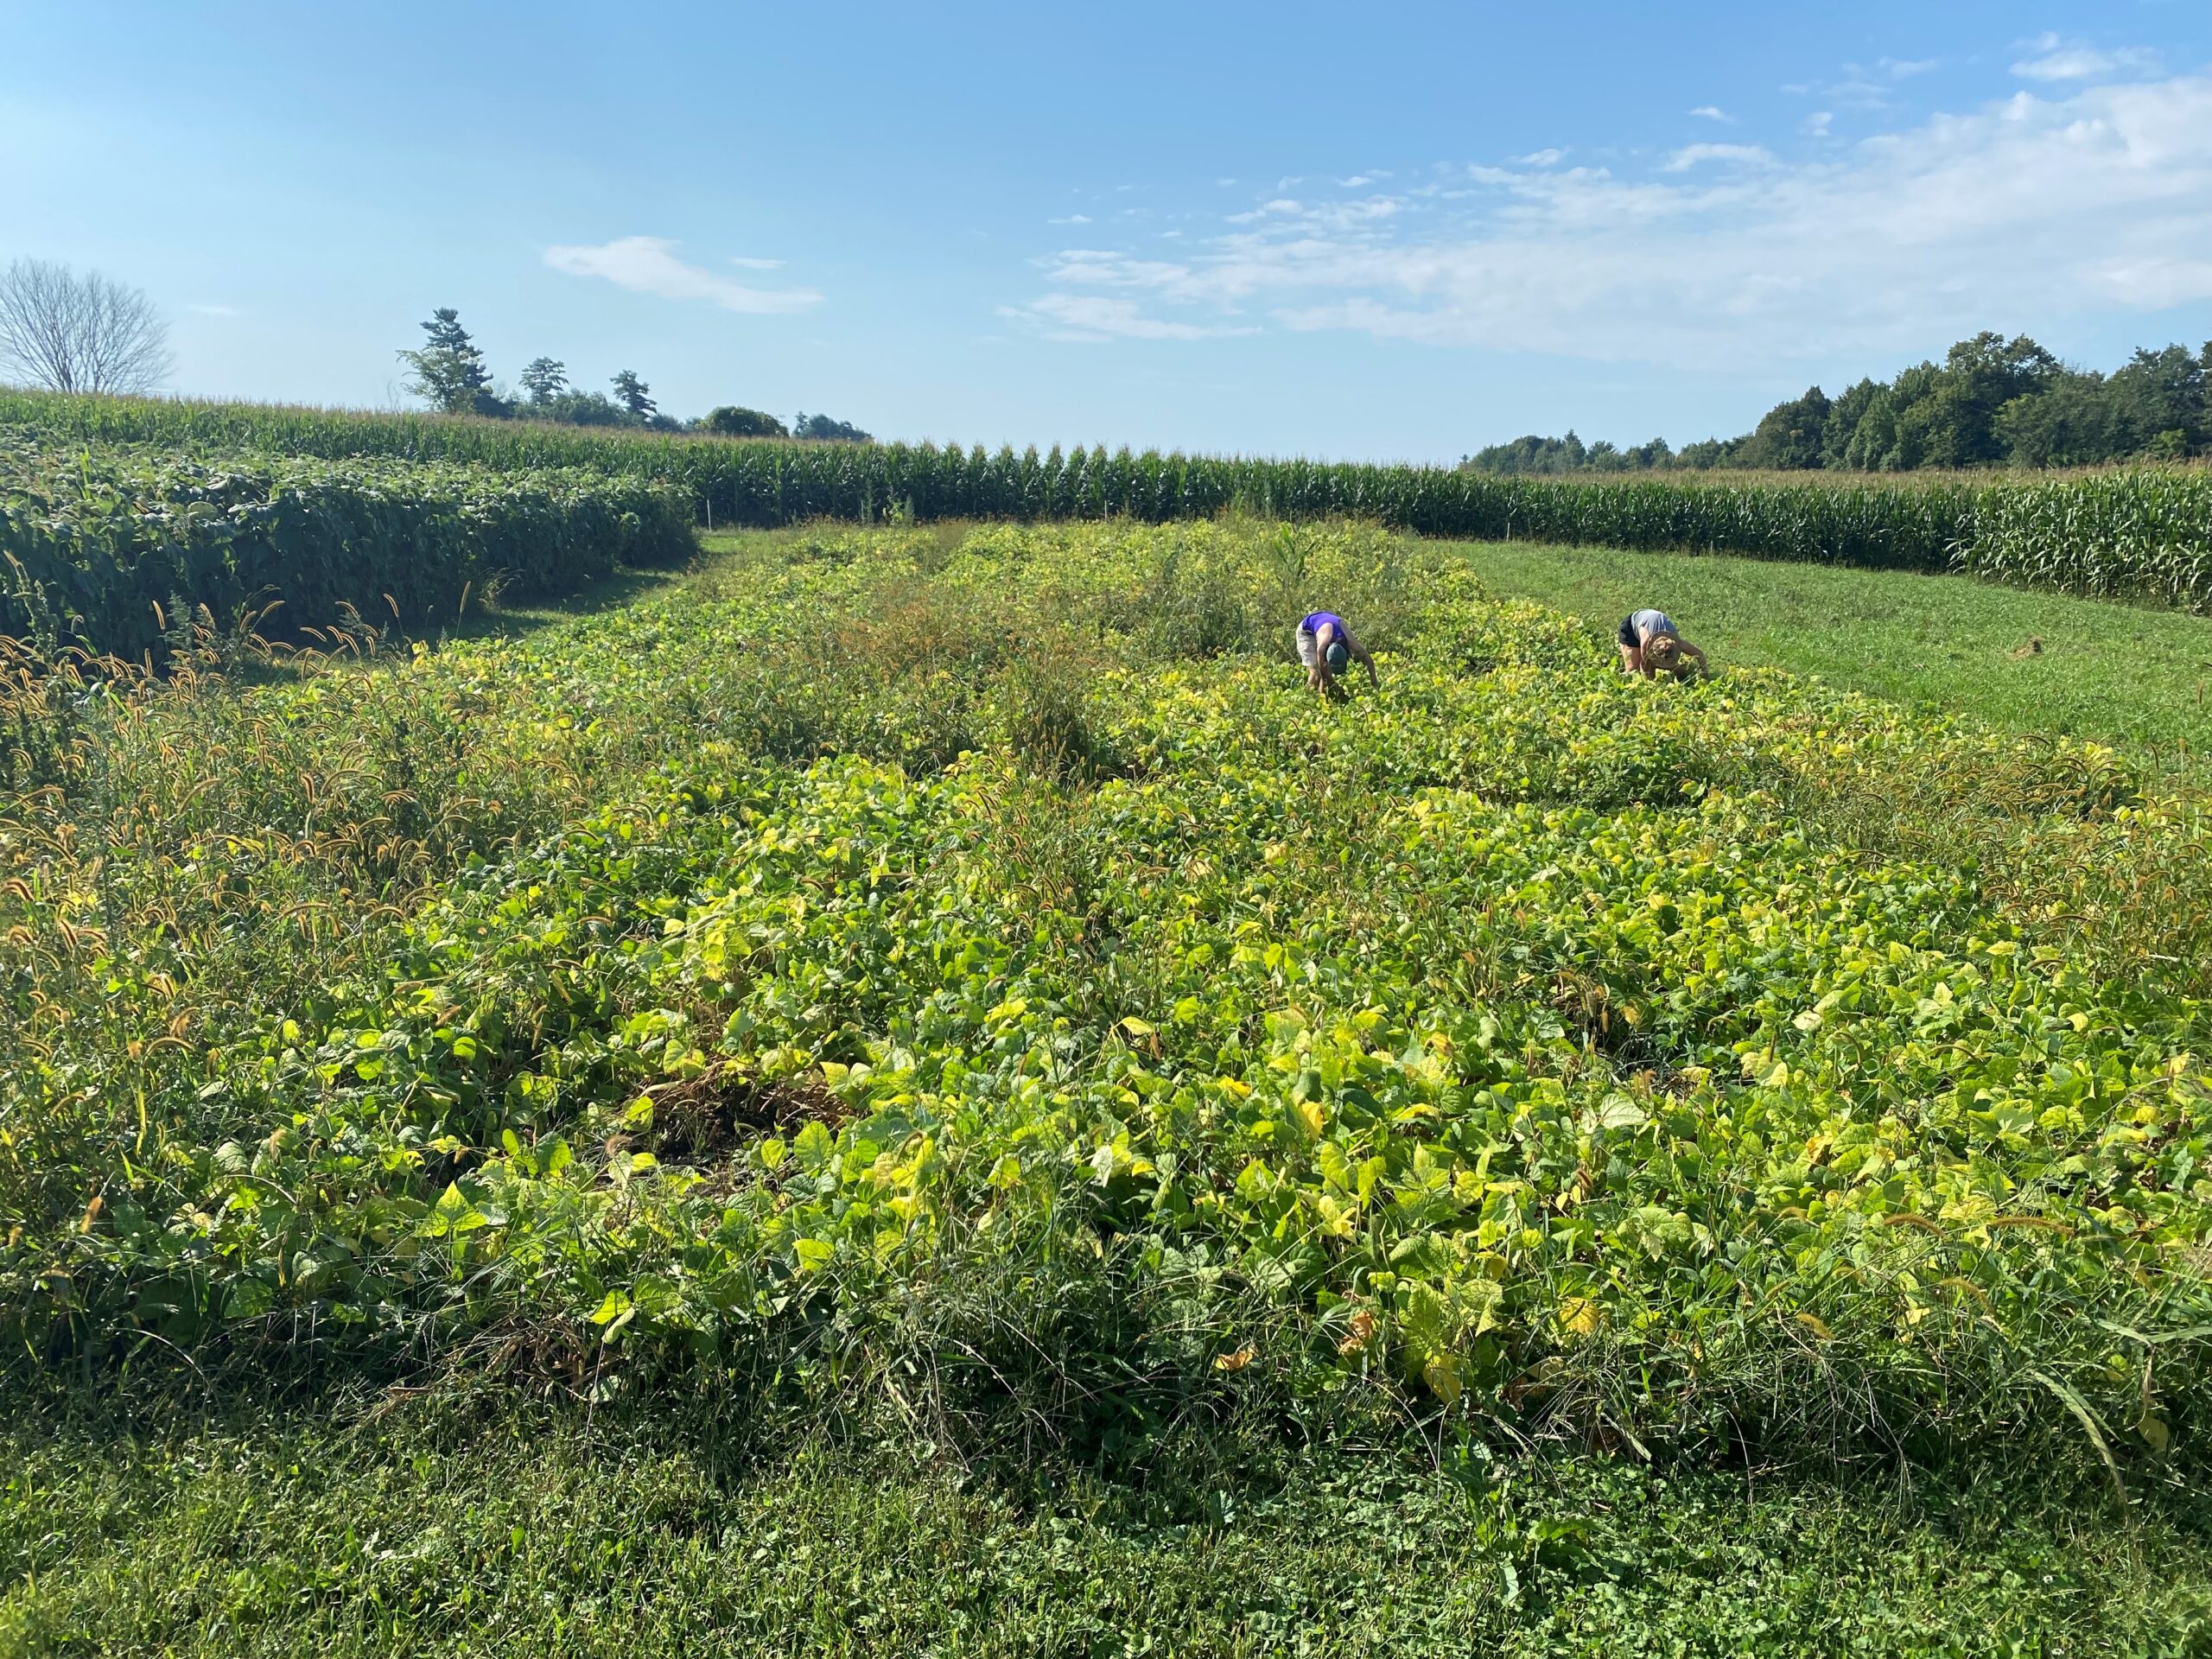
This project worked closely with farmer collaborators to answer research questions and effectively share information through farmer-to-farmer learning. Our research activities included: 1) variety trials of alternative market classes, 2) an experiment on effect of seeding rate on black bean performance in rolled-crimped rye and full tillage systems, and 3) an experiment evaluating four market classes (black, navy, small red and pinto) in tilled vs. organic no-till systems.
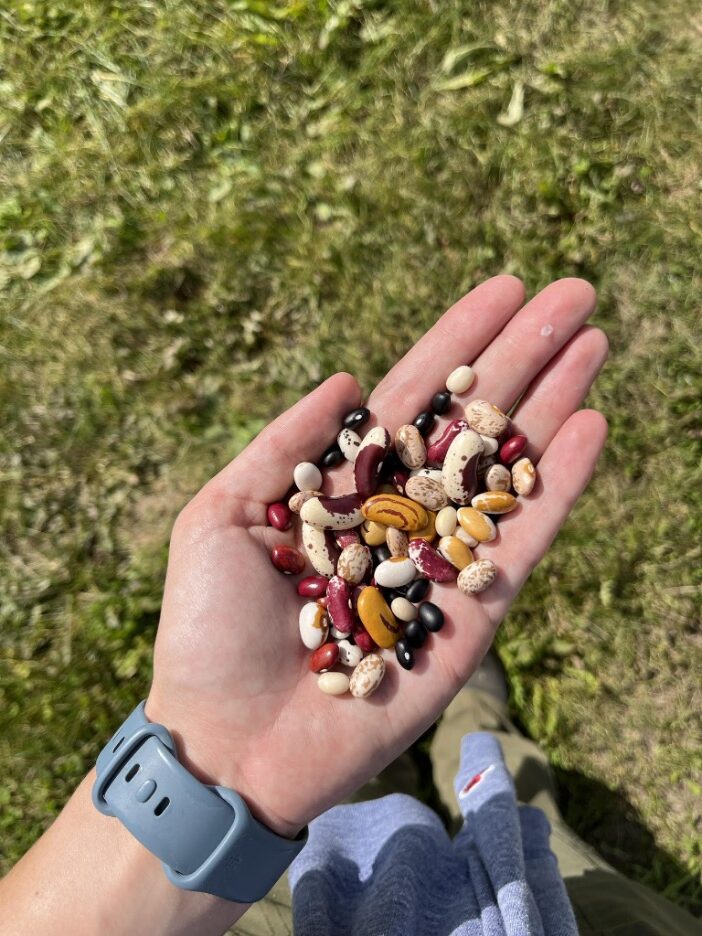
Variety Trials: In the Northeast and in New York especially, most dry bean acreage remaining is devoted to black and kidney bean production. Our research showed that many other market classes and varieties can be successful in the Northeast climate, and that there is demand for an expanded array of varieties regionally.
Black Bean Seeding Rates: Higher seeding rates (greater than 200,000 seeds/ac in both no-till and tillage systems) compensated for reduced emergence and stand loss and resulted in the highest partial returns. Increased plant densities improve weed suppression and increase yield, with relatively high price premiums for organic black beans justifying greater investment in seed cost to ensure top yields. Overall, both yields and maximum partial returns were lower in the no-till system.
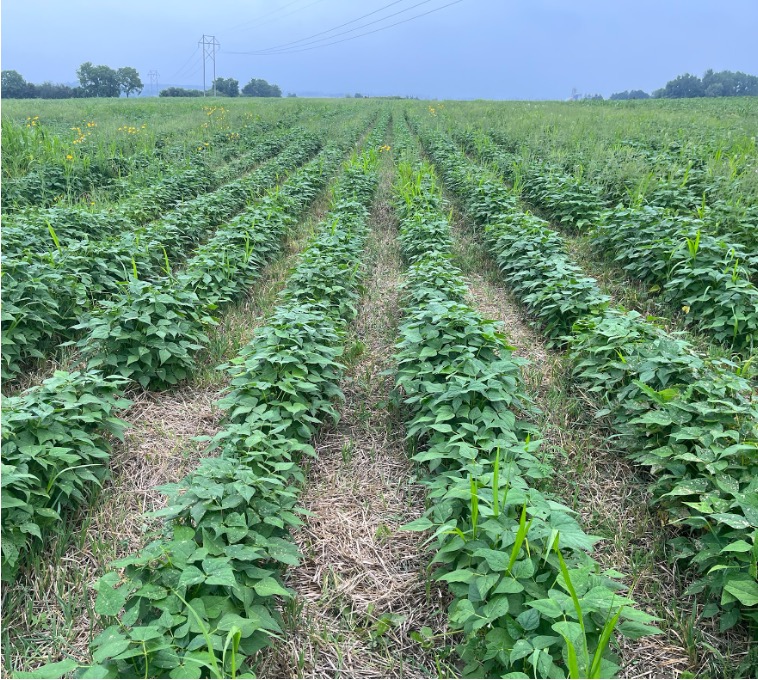
No-till vs. Tillage across market classes: Challenges to reducing tillage in dry bean production using a rolled-crimped rye system remain. On average resulted in reduced crop growth and yield across all market classes, though the no-till system may excel in excessively wet springs where the cover crop can help to remove excess soil moisture, improving dry bean germination and helping to control weeds when timely cultivation is not possible.
Educational Approach and Learning Outcomes
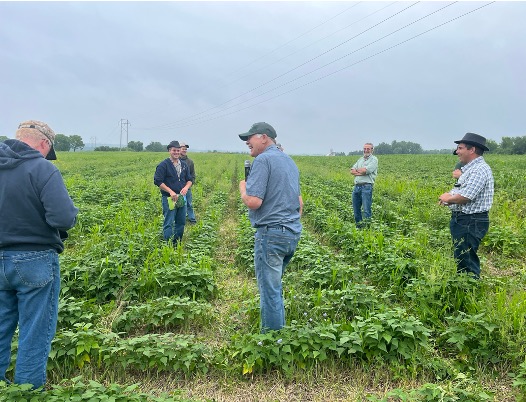
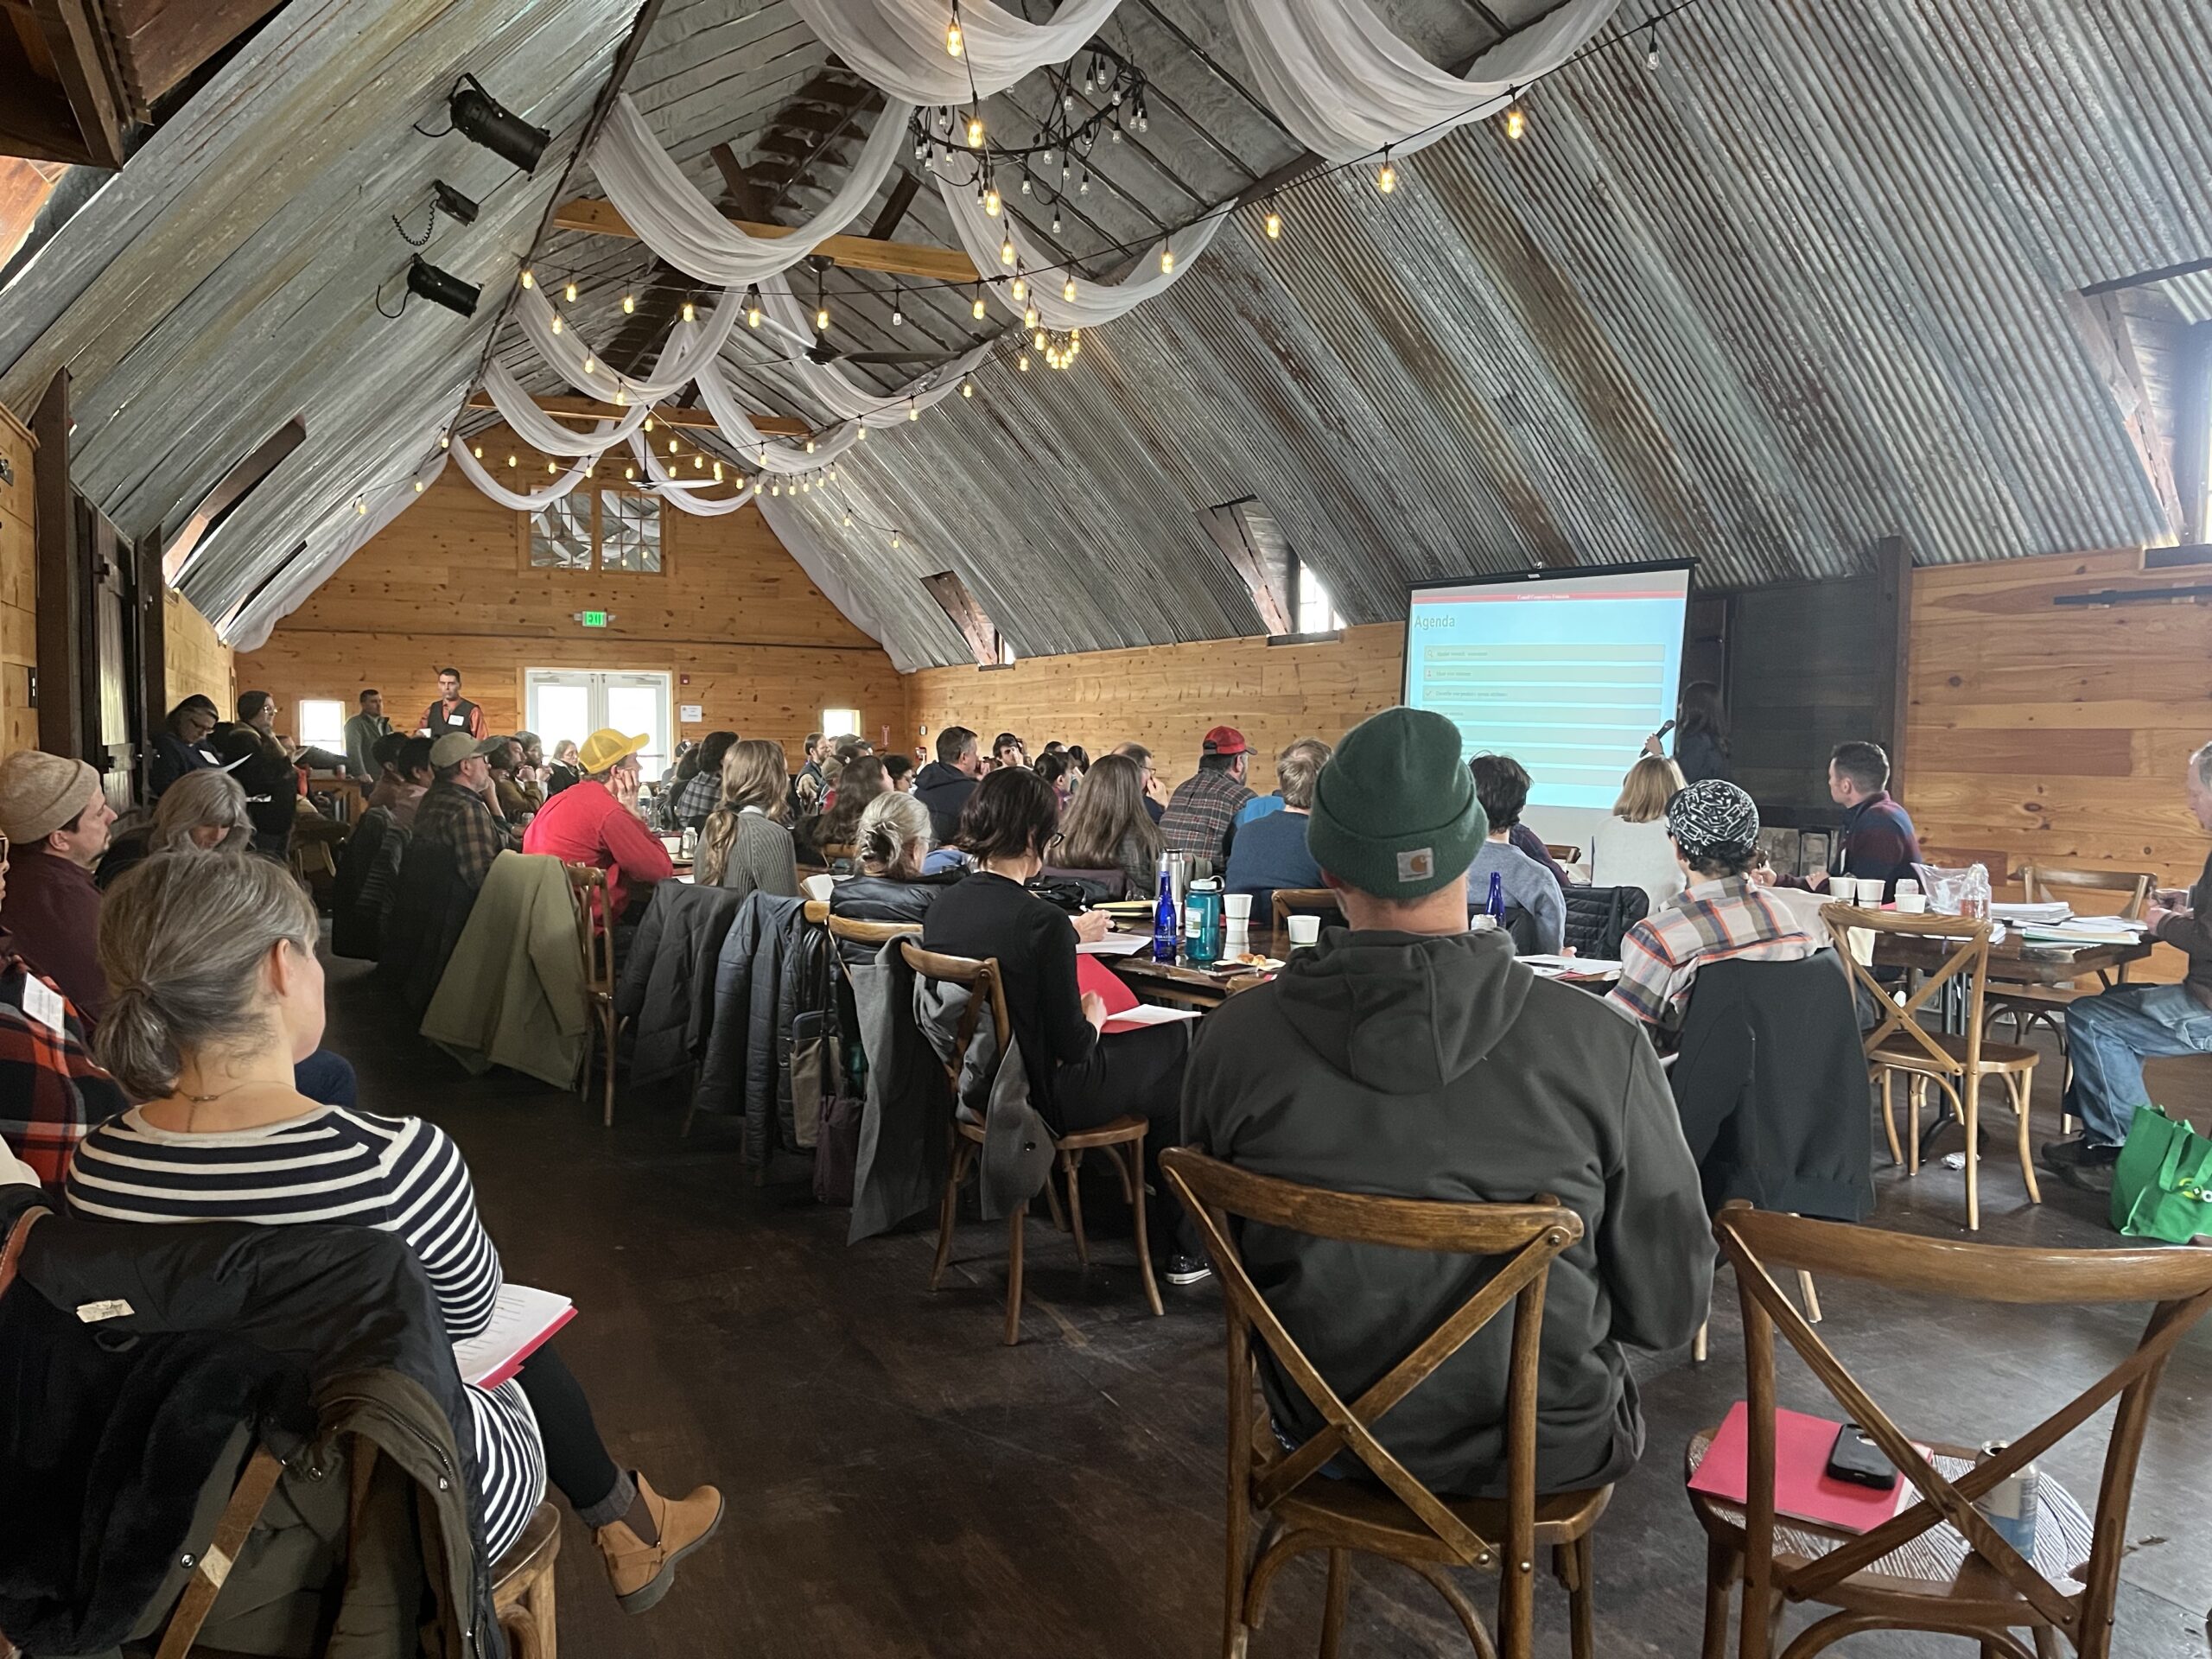
This project sought to help build a dry bean farmer community of practice in the Northeast, facilitating knowledge exchange and sharing research-based best practices on dry bean production as part of a regenerative cropping system. We did this by presenting our research at winter conferences and field days, including at on-farm field days that integrated farmer experimentation and experiences. We also facilitated broader knowledge sharing across the Northeast and beyond via virtual coffee hours and webinars that integrated researcher and farmer voices. Finally, we maintained an email listserv to better connect current and interested dry bean producers in the Northeast and share resources and event information. This community of practice helped connect farmers to agronomic information and networking opportunities that are crucial to successfully growing dry beans for regional markets.
25 dry bean farmers will make at least one behavior change (such as tillage reduction, cover cropping strategy or variety selection) on 300 acres. This will increase marketable yields or price received, resulting in increased gross return of $150,000 across 25 farms. Additionally, 25 farms not previously growing dry beans will begin growing them for sale on a total of 150 acres, resulting in 50 tons of Northeast-grown dry beans sold through regional market channels, increased crop rotation diversity and increased farm profitability.
This project convened farmers and researchers to build a regional base of knowledge surrounding dry bean production and marketing in the Northeastern United States. Consumer interest in dry beans is increasing and legumes are a crucial part of regenerative agricultural systems, but much regional knowledge around this crop has been lost and production is a shadow of its former self in most regions of the Northeast. Project leaders and our advisory team used field research, on-farm trials and farmer-to-farmer knowledge exchange to lower barriers to dry bean production in NY and VT and increase profitability of production systems through research and deployment of best practices.
Cooperators
- (Researcher)
- (Educator)
Research
The following hypotheses were tested:
- Alternative market classes (navy, small red, black, pinto) can perform comparably to black beans in an organic no-till system.
- Heirloom and specialty varieties can perform comparably to conventional market classes under organic production.
- Higher seeding rates of black bean can improve yields and weed suppression in tillage-based and rolled-crimped rye systems.
Research addressed grower interests of weed management, tillage reduction and new market classes. We translated findings into educational resources through production guides, a virtual Short Course and winter meetings. Research occurred both on research farms at Cornell and UVM as well as on cooperating grower farms to gather more accurate data and increase farmer engagement across regions.
- Effects of black bean seeding rate in rolled-crimped rye systems and tilled systems
Weed management is the biggest challenge for organic dry bean growers. Rolled-crimped rye has shown promise in previous research to reduce weed and disease pressure in soybeans, dry beans and other crops. To date, only a single dry bean seeding rate has been trialed in this system. In comparable work with soybean, higher than typical seeding rates were found to be most profitable taking into account seed costs, and to best control weeds. Black bean seeding rates have also not been optimized for organic production systems in the Northeast, so this trial occurred in tilled system at both research locations.
Treatment: Five seeding rates of black bean for organic no-till and tilled systems (side-by-side trials) (cv. “Zorro”)
Table 1. List of black bean seeding rates at Alburgh, VT & Aurora, NY in 2022 & 2023.
|
Treatment |
Black bean seeding rate: VT 2022 & 2023; NY 2023 |
Black bean seeding rate: NY 2022 |
|
A |
60,000 seeds/ac (with 0 seeds/ac sub-plot) |
75,000 seeds/ac (with 0 seeds/ac sub-plot) |
|
B |
120,000 seeds/ac |
150,000 seeds/ac |
|
C |
180,000 seeds/ac |
225,000 seeds/ac |
|
D |
240,000 seeds/ac |
300,000 seeds/ac |
|
E |
300,000 seeds/ac |
375,000 seeds/ac |
Methods: We assessed the effect of seeding rate on yield and weed biomass in black bean in both organic no till (roll-crimped rye) and tilled systems. We used a spatially balanced random complete block design (RCBD) with four replicates. Cereal rye was be seeded in September preceding the dry bean crop. In the tilled system, cereal rye was plowed under approximately two weeks before planting. The experiment was conducted for two years at both NY and VT sites.
Data collection and analysis: We collected data on plant population, cover crop biomass, dry bean biomass and weed biomass, and yield. Data was analyzed using mixed model ANOVA to determine a significant effect of treatments. Profitability incorporating seed costs was also be assessed.
Farmer input: This experiment reflects farmer feedback that weed control is a primary challenge in organic dry bean production as well as lack of basic information such as optimal seeding rates for our region. Growers also expressed high interest in organic no-till and reduction of tillage in organic dry bean production.
- Effect of market class x tillage system on dry bean performance
Previously only the black bean market class had been grown in an organic no-till system in a research context, though preliminary trials by the Hudson Valley Farm Hub indicated that other market classes are well suited. This experiment compared four market classes in tilled vs. organic no-till systems to explore the relative suitability of market classes beyond black bean to an organic no-till production method.
Treatment: Four market classes, two tillage treatments.
Methods: We used a split-plot random complete block design (RCBD) with four replicates. Cereal rye was seeded in September preceding the dry bean crop. In tilled treatment areas, cereal rye was be plowed, disced and harrowed before planting. We compared a single variety of four different market classes planted into tilled soil vs. no-till planted into rolled cereal rye in each year of the project. The experiment was conducted for two years at two sites (NY and VT).
Goal: Assess performance of four contrasting dry edible bean market classes in organic no-till vs. tillage-based organic production systems. A single variety of the navy, black, small red and pinto dry bean classes were evaluated. These market classes are associated with different P. vulgaris gene pools and so may display contrasting adaptiveness to organic no-till conditions.
Varieties tested:
‘Zorro’ black bean
‘Rojo Chiquito’ small red
‘Alpena’ navy
‘Max’ pinto (2022) and 'Lariat' pinto (2023)
Data Collection and analysis: We collected data on plant population, crop and weed biomass, yield and seed loss from direct harvest. Soil health of tilled vs. no-till plots were be compared, assessing aggregate stability, respiration, active carbon and root disease complexes. Data was be analyzed using mixed model ANOVA to determine a significant effect of treatments.
Farmer input: This experiment reflects farmer interest in reducing tillage in their organic field crop systems, as well as interest in new market classes beyond black beans that can be direct harvested.
- Organic variety trial in two Northeastern environments
Little evaluation of alternative market classes (beyond black and kidney) and specialty dry bean varieties has taken place in the Northeast in recent decades, but available data indicate that some varieties can perform well while offering a higher premium, as they are valued by consumers for distinct culinary characteristics and visual appeal. Some varieties resulting from modern breeding efforts have desirable yield, growth habit and disease resistance traits. Though less “improved”, some heirlooms may also perform well, especially in short season Northeastern environments, and for smaller growers with access to higher-value markets. Entries were be chosen based on feedback from many stakeholders and knowledge of available varieties. Replication of the trial in the southern tier of NY and northern VT gave us important data on variation in adaptation across a range of Northeastern environments, as most of the cultivars under evaluation were bred in other regions.
Treatment: Variety, tillage (Year 1 only)
Methods: A spatially balanced Random Complete Block Design design (RCBD) with four replicates at NY and VT research farms, across two seasons. In Year 1 (2022), all varieties were tested in both no-till and full tillage (with inter-row cultivation) systems. In Year 2 (2023), varieties were planted into tilled soil and cultivated using inter-row cultivation until flowering.
Variety: Market Class:
| Zorro | black |
| Zenith | black |
| Eclipse | black |
| Black Tails | black |
| Merlin | navy |
| Alpena | navy |
| Blizzard | navy |
| Cowboy | pinto |
| Lariat | pinto |
| Charro | pinto |
| Max | pinto |
| Monterrey | pinto |
| Cayenne | small red |
| Rojo Chiquito | small red |
| Merlot | small red |
| Orca | specialty |
| UC Southwest Gold | specialty |
| UC Tiger's Eye | specialty |
| Gypsy Rose | specialty |
| Desert Song | specialty |
| Pencil Pod Soldier | specialty |
| Jacob's Cattle | specialty |
| Tigers Eye | specialty |
| GTS 1701 yellow eye | specialty |
| Kenearly Yellow Eye | specialty |
| UC Jacob's Cattle | specialty |
| UC Holstein | specialty |
| UC Andino | specialty |
| UC 1004 | specialty |
| UC 1005 | specialty |
Data collection and analysis: Yield, lodging, pest damage and disease (if present), and growth habit were recorded for each plot. A mixed model ANOVA was used to determine significant effect of treatments on recorded traits (except for growth habit). Plots were direct harvested with a plot combine.
Farmer input: Some farmers and processors have already adopted some of these alternative market classes, in particular pinto, navy and small red, and cite high demand that is not currently being met by production. One farmer-processor noted that regional variety trials for these market classes would be useful to their operation. Recent advances in breeding for direct harvestable types makes these market classes well-suited to the Northeast, and these trials can reduce risk to farmers and encourage adoption of a profitable new crop or market class.
Full-Length Research Trial Reports:
Black Bean Seeding Rate Trial
2022 + 2023 Organic Black Bean Seeding Rate Trial (New York and Vermont sites): BBSR-Final-Report_Till-and-No-Till
Market Class x Tillage Trial
2023 VT Market Class x Tillage Trial - 2023_Dry_Bean_Variety_X_Tillage_Trial
Variety Trial
2022 VT and NY Dry Bean Variety Trial Report: 2022-NY-VT-Organic-Dry-Bean-Variety-Trial_final
2022 Organic Dry Bean Variety Trial (VT only): 2022_Organic_Dry_Bean_Variety_Trial_Report
2023 Organic Dry Bean Variety Trial (VT Only): 2023_Organic_Dry_Bean_Variety_Trial_Report_Final
2023 Dry Bean Variety Trial - all sites:2023 Variety Trial Results
2024 VT Market Class x Tillage Trial - 2024-No-tillage-and-dry-bean-variety-trial-report
Research Highlights
Black Bean Seeding Rate Trial -- Cultivated and Organic No-Till systems
Effect of black bean seeding rate on black bean density
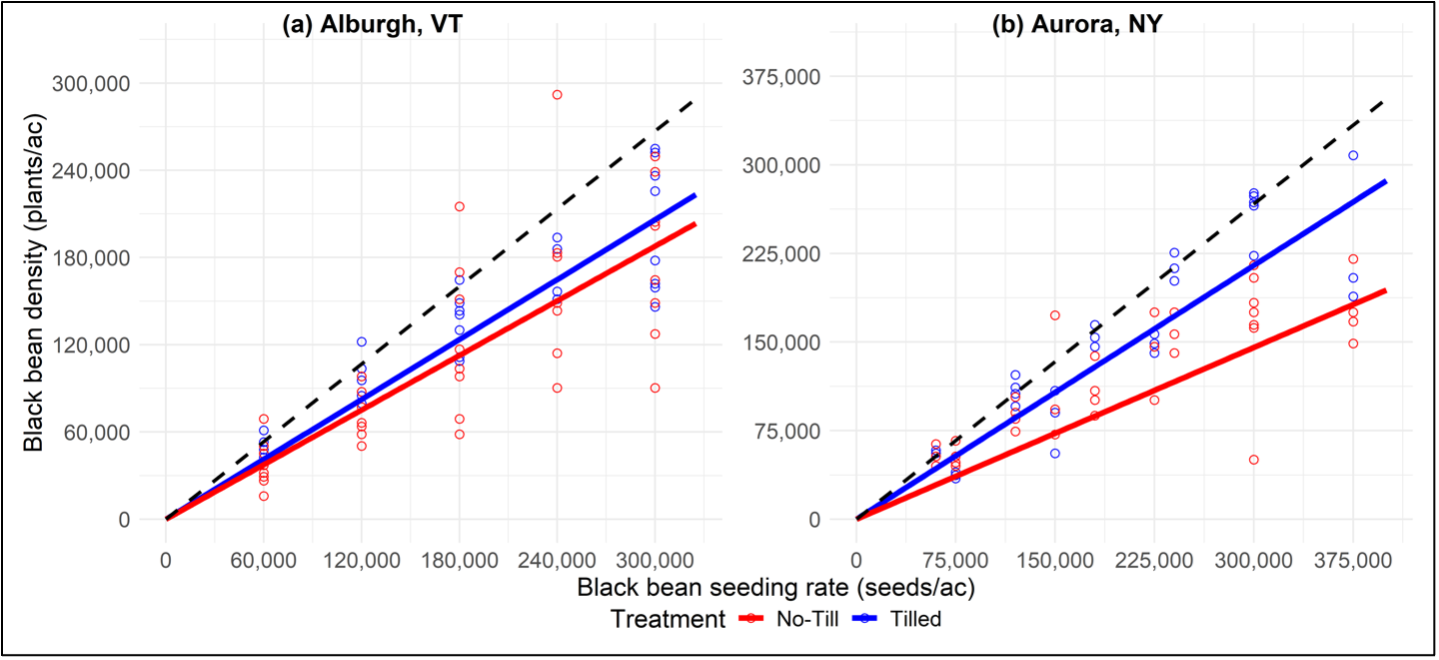
Figure 1. Effect of black bean seeding rate (seeds/ac) on black bean density (plants/ac) in no-till and tilled system in (a) Alburgh, VT and (b) Aurora, NY pooled over 2022 and 2023. The red lines and data points represent the no-till trials and the tilled trials are denoted in blue as indicated by the legend. The dashed black lines indicate expected germination at 89% based on seed tag information for black bean (cv. “Zorro”).
Across both sites, tilled systems outperformed no-till in terms of black bean density establishment. As seeding rates increased across both sites and tillage systems, black bean density also increased (P < 0.001). However, the observed densities increasingly deviated from the target density at higher seeding rates. No-till exhibited a greater deviation from the target density compared to tilled systems. In Aurora, the difference in density between the two management systems was more pronounced than in Alburgh.
Effect of black bean density on weed biomass
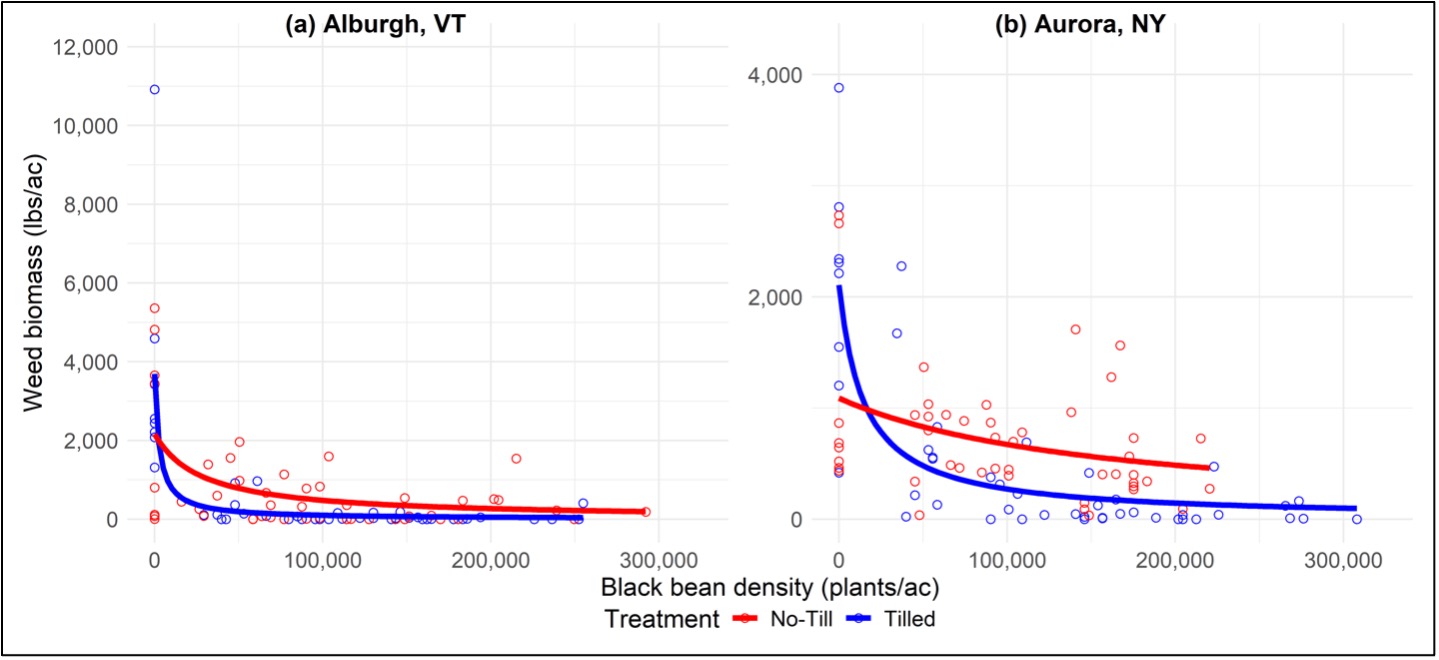
Figure 2. Effect of black bean density (plants/ac) on weed biomass (lbs/ac) in no-till and tilled system in (a) Alburgh, VT and (b) Aurora, NY pooled over 2022 and 2023. The red lines and data points represent the no-till trials and the tilled trials are denoted in blue as indicated by the legend.
As the density of black beans increased, weed biomass exhibited a non-linear decline (Figure 2). However, the impact of black bean density on weed suppression was stronger in tilled systems. In both Alburgh and Aurora, tilled trials showed a sharp initial decrease in weed biomass with increasing density while no-till treatments exhibited a more gradual decline. While a significant reduction in weed biomass was observed with increasing black bean density in the tilled trials across both sites (P < 0.001), only the Alburgh no-till trials showed a statistically significant decline (P < 0.05).
Effect of black bean density on black bean yield
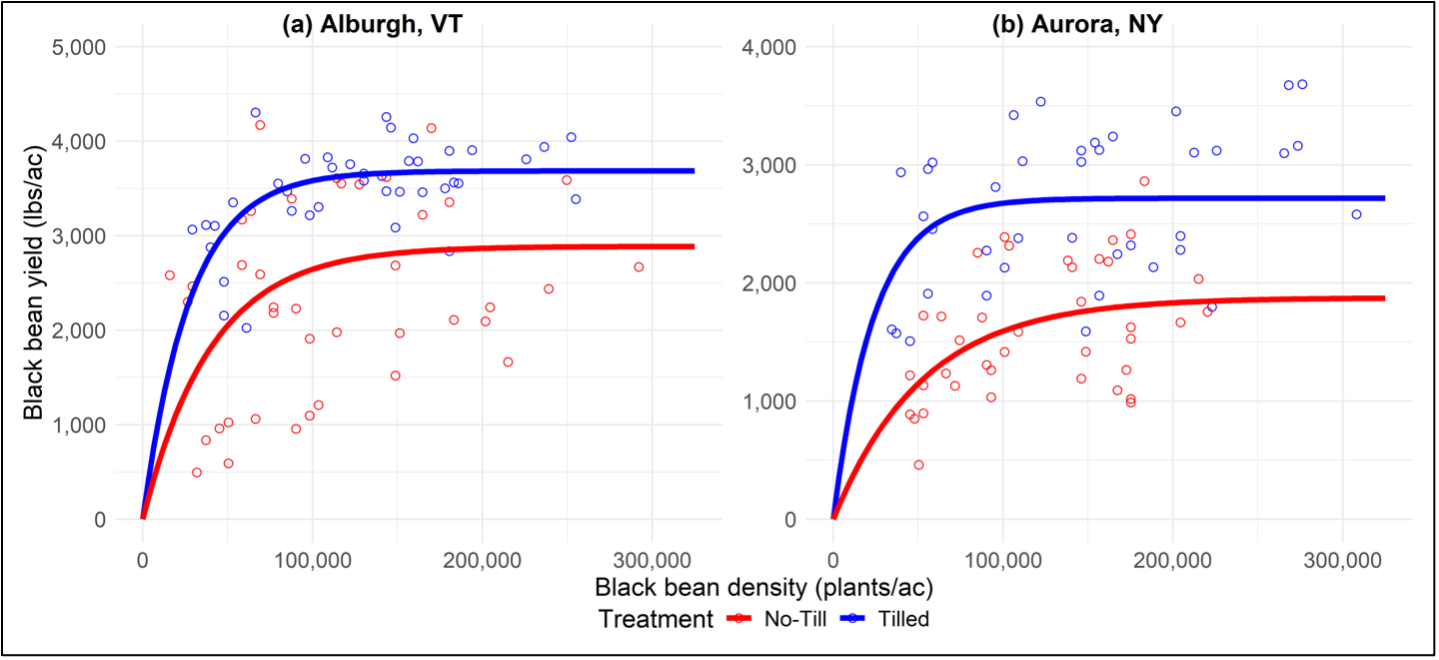
Figure 3. Effect of black bean density (plants/ac) on black bean yield (lbs/ac) in no-till and tilled system in (a) Alburgh, VT and (b) Aurora, NY pooled over 2022 and 2023. The red lines and data points represent the no-till trials and the tilled trials are denoted in blue as indicated by the legend. Black bean yield was adjusted to 14% moisture.
In Alburgh, black bean yield ranged from 2,025 lbs/ac to 4,306 lbs/ac in the tilled and 496 lbs/ac to 4,171 lbs/ac in the no-till. In Aurora, black bean yield ranged from 1,508 lbs/ac to 3,682 lbs/ac in the tilled and 461 lbs/ac to 2,862 lbs/ac in the no-till. As black bean density increased, black bean yield increased asymptotically in both sites and management systems. However, the maximum achievable yield was different in each site and management system. In Alburgh, the maximum yield was predicted to be 2,887 lbs/ac in the no-till trials (P < 0.001), while the tilled trials had a higher predicted maximum yield at 3,685 lbs/ac (P < 0.001). The average yield across black bean densities for Alburgh was 2,336 lbs/ac in the no-till trials and 3,481 lbs/ac for tilled trials. In Aurora, the maximum yield was predicted to be 1,874 lbs/ac in the no-till trials (P < 0.001), while the tilled trials had a higher predicted maximum yield at 2,717 lbs/ac (P < 0.001).
Effect of black bean seeding rate on partial returns
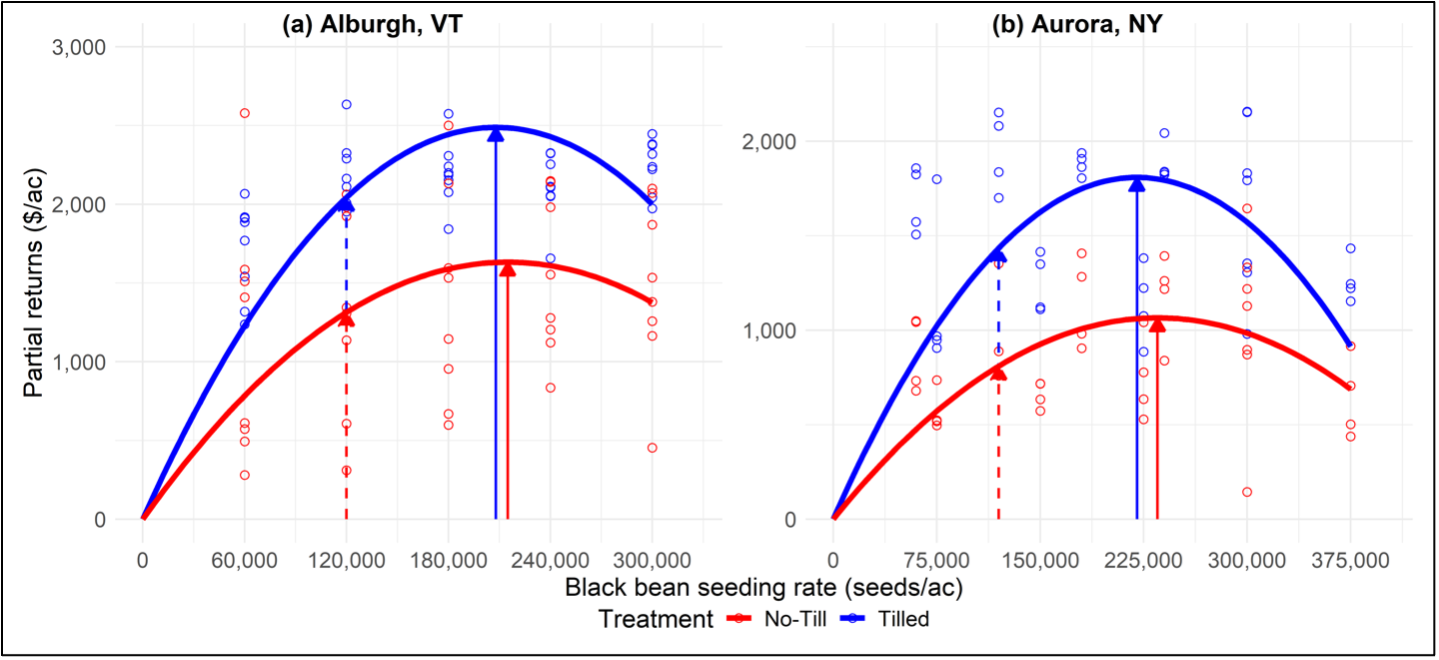
Figure 4. Effect of black bean seeding rate (seeds/ac) on partial profitability ($/ac) in no-till and tilled system in (a) Alburgh, VT and (b) Aurora, NY pooled over 2022 and 2023. The red lines and data points represent the no-till trials and the tilled trials are denoted in blue as indicated by the legend. Vertical lines denote the recommended seeding rate for conventional black bean production at 30-inch-wide rows (120,000 seeds/ac, dashed line), and the predicted economically optimal seeding rate for each respective site and tillage system (solid line).
Table 4. Profitability characteristics for Alburgh, VT and Aurora, NY in 2022 and 2023 by site and tillage system.
|
Site and tillage system |
Optimal seeding rate for maximum partial return (seeds/ac) |
Maximum partial return at optimal seeding rate ($/ac) |
Partial return at recommended conventional seeding rate* ($/ac) |
Gain in partial return at optimal vs. conventional seeding rate ($/ac) |
|
VT tilled |
207,877 |
2,488 |
2,043 |
445 |
|
VT no-till |
214,937 |
1,632 |
1,314 |
318 |
|
NY tilled |
220,144 |
1,809 |
1,434 |
374 |
|
NY no-till |
235,036 |
1,066 |
810 |
255 |
*Conventional seeding rate was denoted at 120,000 seeds/ac
In conventional black bean production, growers typically plant at a seeding rate no greater than 120,000 seeds/ac. In organic tilled black bean systems, results from both Alburgh and Aurora indicate that maximum partial returns were achieved at seeding rates exceeding 200,000 seeds/ac with gains in partial returns up to $445/ac relative to the conventional seeding rate (Table 4). In organic no-till black bean systems, profitability was maximized at seeding rates greater than 210,000 seeds/ac across sites with corresponding gains in partial returns up to $318/ac compared to the conventional seeding rate.
Discussion
Higher seeding rates in organic black bean production serve multiple functions, particularly in no-till systems with rolled-crimped cereal rye. While increasing seeding rates beyond 120,000 seeds/ac resulted in only modest yield gains, our profitability analysis suggests that the optimal seeding rate exceeds 200,000 seeds/ac. This recommendation is driven by two key factors: (1) stand establishment challenges, particularly in no-till systems, and (2) the price premium associated with organic black beans.
The price premium for certified organic black bean significantly influences the economic viability of higher seeding rates. In 2023, organic food-grade black beans were priced at $0.63/lb, approximately 1.5 times higher than conventional black beans ($0.40/lb). As a result, very high seeding rates may not be justified in conventional black bean production, where increased seed costs may not be offset by higher returns.
Although partial return estimates from this analysis were higher in tilled systems, profitability comparisons between tillage systems should be interpreted with caution. This analysis did not account for several field management costs, including fuel and labor associated with roller-crimping, seedbed preparation, or cultivation, nor did it include the cost of cereal rye seed in the no-till system. Potential long-term benefits of no-till management, such as improved soil health, soil structure, and erosion control, were also not captured in this partial budget analysis. While no-till systems may offer labor and time savings, this evaluation focused solely on black bean seed costs and seeding rates. No-till black bean production remains a viable option, particularly if challenges related to crop establishment and fertility management can be addressed. Future research should focus on strategies to reduce stand losses and optimize nitrogen management in organic no-till black bean systems.
Key Takeaways:
1. Higher seeding rates (>200,000 seeds/ac) compensate for establishment challenges in no-till systems.
2. Increased plant densities improve weed suppression, reducing reliance on tillage and cultivation.
3. Profitability is strongly influenced by the organic price premium, making higher seeding rates a viable strategy in organic systems.
4. Organic no-till systems require further optimization to match the productivity and profitability of tilled systems.
Market class x Tillage Trial
2023 Results:
Discussion
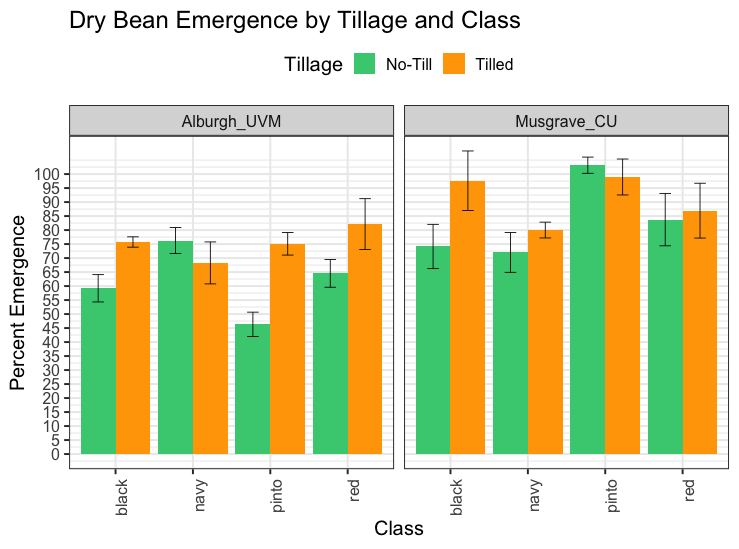
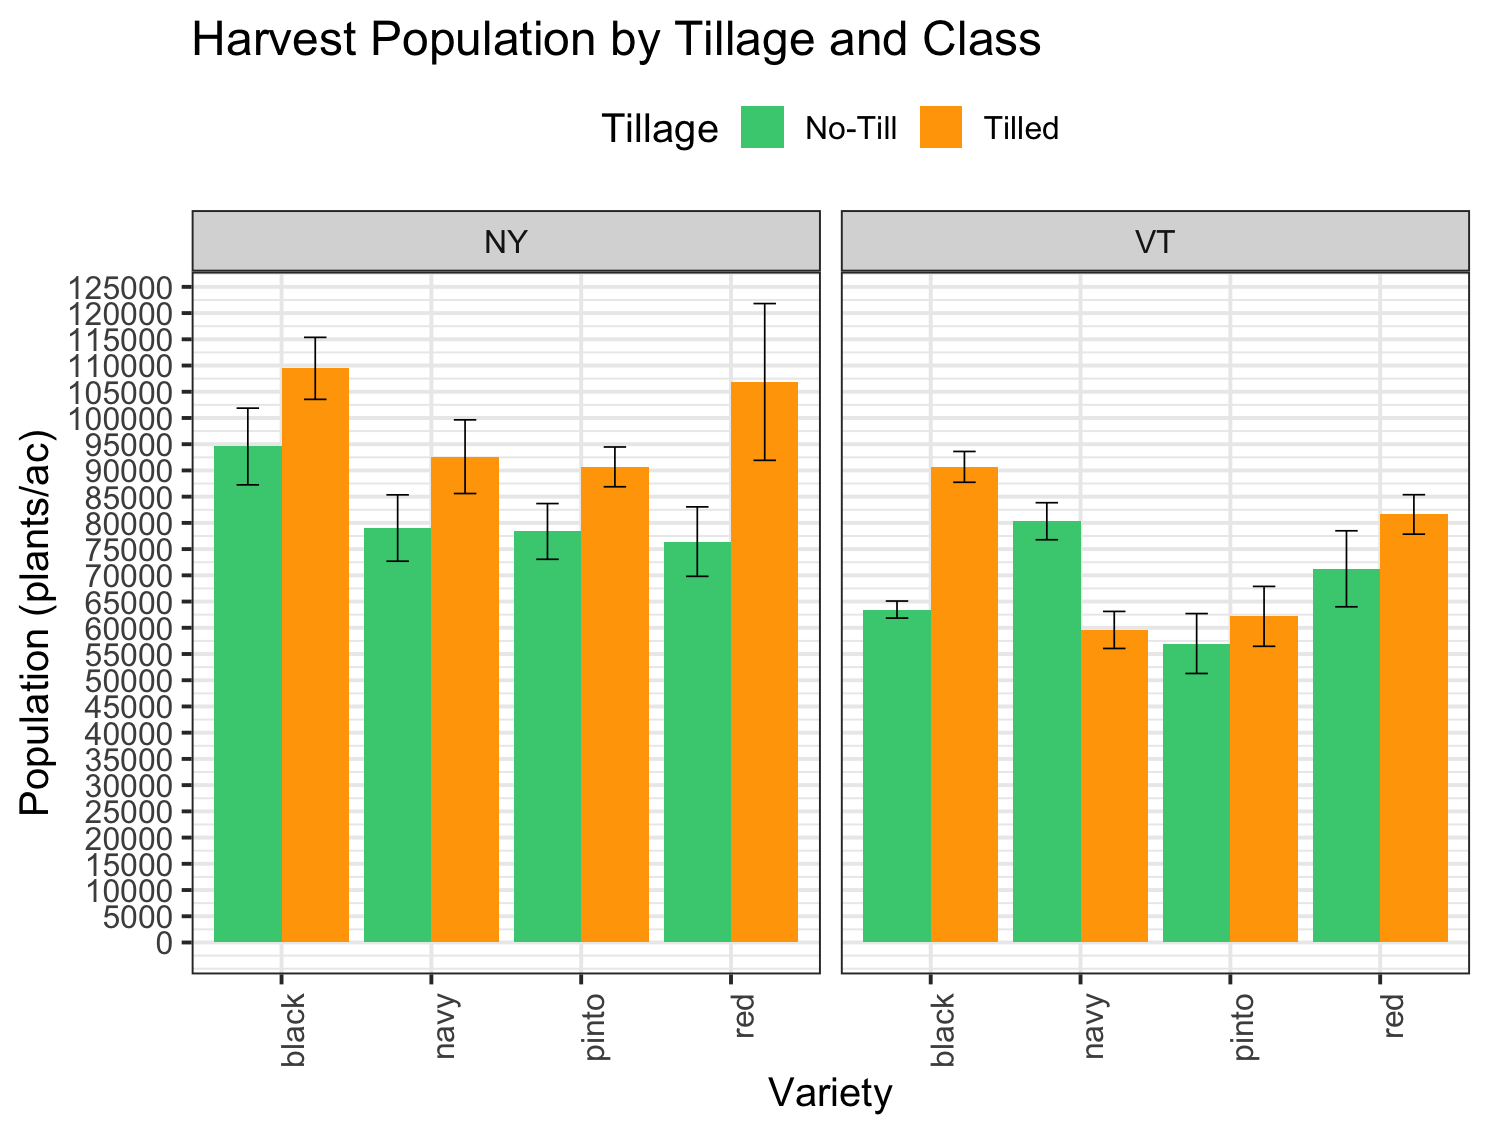
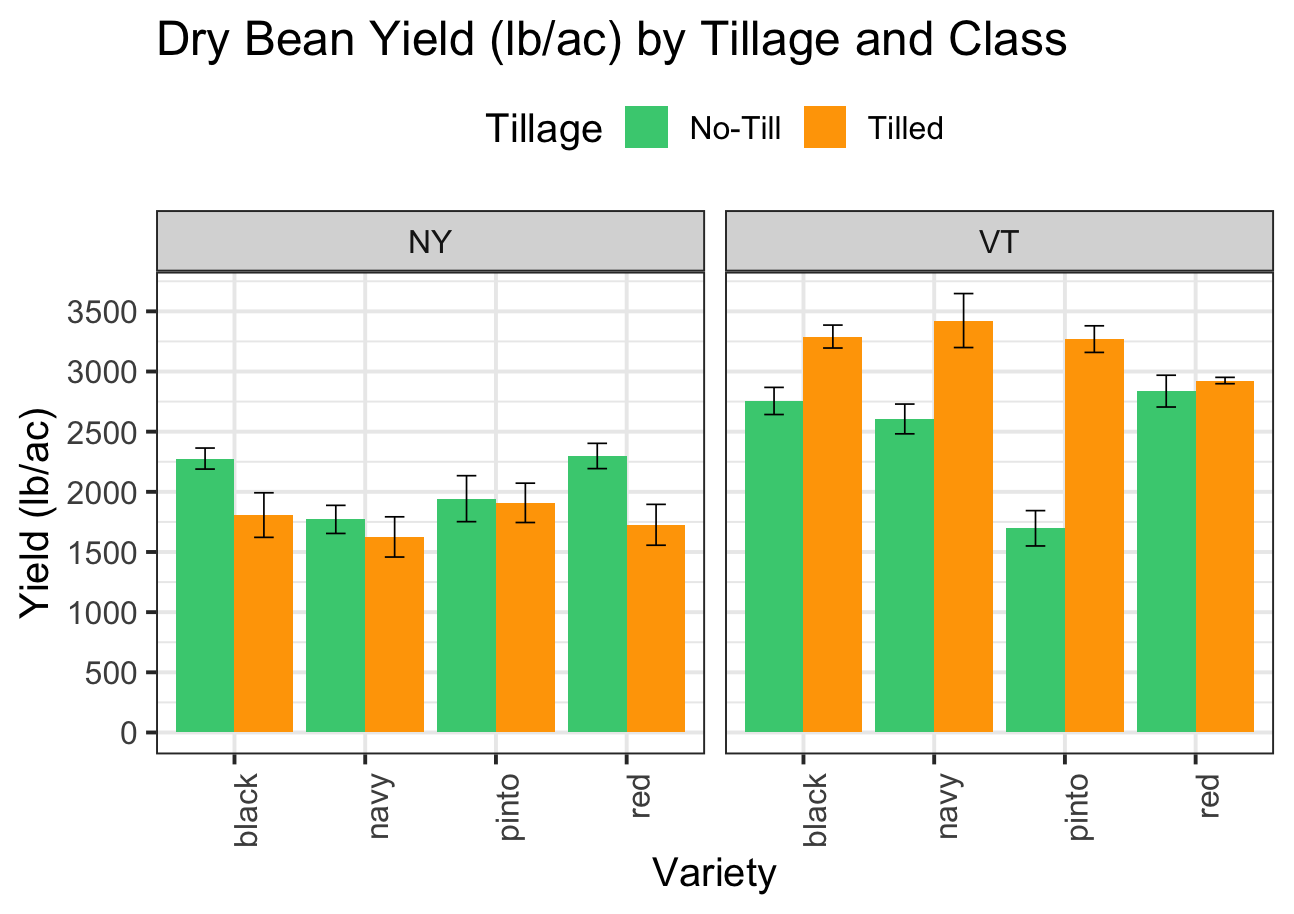
Both New York and Vermont sites experienced a generally wet early season in 2023, with abnormally wet weather enduring throughout the 2023 season in Vermont, whereas New York site experienced abnormally dry weather in summer and fall. Across sites, relative performance of market class between no till and tillage systems was variable. At both sites, there was not a clear trend in emergence rate amongst classes when no-till and tillage systems were compared, though harvest population was generally higher in tillage systems across all market classes except for pinto. Relative yield performance was generally better in no-till systems in New York in 2023 due to poor emergence and weed control in the tilled plots, whereas yields were higher in the tillage system for all market classes at the Vermont site in 2023, as well as both sites in 2024.
Dry Bean Variety Trial
Year 1 cultivated and no-till, Year 2 cultivated only
Organic variety trials were conducted in two Northeastern locations (Aurora, NY and Alburgh, VT) to evaluate alternative market classes to better understand variation in adaptation across a range of Northeastern environments. Little evaluation of alternative market classes has taken place in the Northeast in recent decades despite the increase in consumer demand. Consumers are interested in these alternative market classes (such as navy, small red, pink, pinto, great northern, cranberry, yellow, and heirloom/specialty) for their distinct culinary characteristics and visual appeal. Entries were chosen based on feedback from local stakeholders to identify varieties with high market demand and value as well as for agronomic performance (Table 1).
Organic variety trials were conducted in two Northeastern locations (Aurora, NY and Alburgh, VT) to evaluate alternative market classes to better understand variation in adaptation across a range of Northeastern environments. Little evaluation of alternative market classes has taken place in the Northeast in recent decades despite the increase in consumer demand. Consumers are interested in these alternative market classes (such as navy, small red, pink, pinto, great northern, cranberry, yellow, and heirloom/specialty) for their distinct culinary characteristics and visual appeal. Entries were chosen based on feedback from local stakeholders to identify varieties with high market demand and value as well as for agronomic performance (Table 1).
Table 1a. Organic dry bean varieties evaluated in Alburgh, VT, 2022.
|
Variety |
Seed Source |
Market Class |
|
Alpena |
Central Bean Co. |
Navy |
|
Black Tails |
Treasure Valley Seeds |
Black |
|
Blizzard |
Treasure Valley Seeds |
Navy |
|
California Early |
University of California, Davis |
Light Red Kidney |
|
Calypso |
GenTec Seeds LTD |
Specialty |
|
Cayenne |
Central Bean Co. |
Small Red |
|
Desert Song |
GenTec Seeds LTD |
Flor de Junio |
|
Dr Wood |
Kelley Bean Co. |
Pinto |
|
GTS 1701 |
GenTec Seeds LTD |
Yellow Eye |
|
Gypsy Rose |
GenTec Seeds LTD |
Flor de Mayo |
|
Jacob's Cattle |
GenTec Seeds LTD |
Specialty |
|
Lariat |
Treasure Valley Seeds |
Pinto |
|
Merlin |
Treasure Valley Seeds |
Navy |
|
Merlot |
Treasure Valley Seeds |
Small Red |
|
ND Palomino |
Treasure Valley Seeds |
Pinto |
|
Rojo Chiquito |
Central Bean Co. |
Small Red |
|
Soldier |
GenTec Seeds LTD |
Specialty |
|
Tiger's Eye |
GenTec Seeds LTD |
Specialty |
|
UC Andino |
University of California, Davis |
Specialty |
|
UC Southwest Gold |
University of California, Davis |
Specialty |
|
UC Tiger's Eye |
University of California, Davis |
Specialty |
|
UCD 1004 |
University of California, Davis |
Specialty |
|
UCD 1005 |
University of California, Davis |
Specialty |
|
UCD Holstein |
University of California, Davis |
Specialty |
|
UCD Jacob's Cattle |
University of California, Davis |
Specialty |
|
Zenith |
Central Bean Co. |
Black |
|
Zorro |
Treasure Valley Seeds |
Black |
Table 1b. Organic dry bean varieties evaluated in Geneva, NY, 2022.
|
Variety |
Seed Source |
Market Class |
|
Alpena |
Central Bean Co. |
Navy |
|
Black Tails |
Treasure Valley Seed |
Black |
|
Blizzard |
Treasure Valley Seed |
Navy |
|
Dr Wood |
Kelley Bean Co. |
Pinto |
|
Lariat |
Treasure Valley Seed |
Pinto |
|
Merlin |
Treasure Valley Seed |
Navy |
|
ND Palomino |
Treasure Valley Seed |
Pinto |
|
Rojo Chiquito |
Central Bean Co. |
Small Red |
|
Zenith |
Central Bean Co. |
Black |
|
Zorro |
Treasure Valley Seed |
Black |
Organic dry bean variety trials in a tilled system were conducted at both NY and VT locations. At the NY location, the variety trial was replicated in both a tilled and an organic no-till system. The organic no-till system entails planting cereal rye the previous fall, and terminating standing cereal rye at anthesis using a front-mounted I&J roller crimper at time of dry bean planting, creating a crimped cereal rye mulch that persists throughout the growing season.
The experimental design was a randomized complete block with four replications (Table 2). All soil fertility deficiencies were addressed prior to planting in accordance with state and regional soil test results. For the no-till variety trial, cereal rye (ND Gardner) was planted at the Geneva, NY location on 11-Sep 2021 at a rate of 160 lbs ac-1 (3 million pure live seeds ac-1). Prior to cover crop planting, 5-4-3 dry poultry manure was applied at a rate of 1,000 lbs ac-1. In the tilled system, primary and secondary tillage were used to prepare an adequate seedbed for dry bean planting. Dry beans were planted on 31-May 2022 at the Alburgh, VT location, and on 15-Jun 2022 at the Geneva, NY location. At planting, 25 lbs N ac-1 were applied as starter fertilizer. Dry beans were planted in 30-in rows at a depth of 1.5 to 2.5-in. Plant populations were based on seed size and market class and adjusted for germination. Small seeded varieties were planted at a target seeding rate of 110,000 pure live seeds ac-1 and large seeded varieties were planted at a target seeding rate of 85,000 pure live seeds ac-1. Weeds were managed before and after dry bean emergence according to best organic practices.
Table 2. Management details for dry bean variety trials at both trial locations, 2022.
|
Location |
Borderview Research Farm, Alburgh, VT |
Musgrave Research Farm, Aurora, NY |
|
Soil type |
Benson rocky silt loam, over shaly limestone, 8 to 15 % slopes |
Lima silt loam, 3-8% slopes |
|
Previous crop |
Spring wheat |
Cereal rye/buckwheat cover crop |
|
Tillage operations |
Pottinger TerraDisc |
Tilled trial: Moldboard plow, disc, harrow, cultimulch |
|
Plot size |
10ft x 20ft |
10ft x 45 ft |
|
Cover crop information |
N/A |
Cereal rye (var. ND Gardner) planted 11-Sep 2021 at 160 lbs ac-1 |
|
Weed management |
Tilmor Power Ox two-wheel tractor with finger weeder and hand weeding on 15, 22, 29-Jun and 20, 27-Jul 2022 |
Tilled trial: Inter-row cultivation 2x with John Deere S-tine cultivator |
|
Dry bean planting date |
31-May 2022 |
15-Jun 2022 |
|
Dry bean harvest date |
9, 15, and 21-Sep 2022 |
26-Oct 2022 |
Growth habit was assessed, and each variety was given a rating according to the growth habit classifications for dry beans, described in Table 2 below. Days to maturity was measured by recording the date at which most plants in each plot had reached maturity (growth stage R9: mature, at least 80% of the pods showing yellow and mostly ripe, only 30-40% of leaves still green). Growth habit classification for organic dry bean varieties for both locations are listed in Table 3 below. Statistical analysis was not conducted on growth habit.
Table 3. Growth habit classifications for dry beans.
|
Growth Habit Classification |
Description |
|
I |
Determinate bush |
|
IIa |
Indeterminate; completely upright with no vine or weak vine |
|
IIb |
Indeterminate; inclined upright with substantial vine |
|
III |
Indeterminate prostrate |
Table 3a. Growth habits of organic dry bean varieties evaluated in Alburgh, VT 2022.
|
Variety |
Growth habit |
100-seed weight |
|
Alpena |
IIb |
18.0 |
|
Black Tails |
IIb |
20.3 |
|
Blizzard |
IIb |
20.3 |
|
California Early |
I |
48.9 |
|
Calypso |
I |
42.3 |
|
Cayenne |
IIb |
31.0 |
|
Desert Song |
IIb |
30.9 |
|
Dr Wood |
IIb |
33.1 |
|
GTS 1701 |
III |
43.1 |
|
Gypsy Rose |
III |
27.3 |
|
Jacob's Cattle |
I |
48.9 |
|
Lariat |
III |
34.0 |
|
Merlin |
IIa |
17.3 |
|
Merlot |
III |
28.7 |
|
ND Palomino |
III |
36.3 |
|
Rojo Chiquito |
IIb |
22.5 |
|
Soldier |
IIa |
54.6 |
|
Tiger's Eye |
IIb |
50.2 |
|
UC Andino |
IIa |
36.8 |
|
UC Southwest Gold |
IIa |
27.3 |
|
UC Tiger's Eye |
IIb |
52.7 |
|
UCD 1004 |
IIa |
33.4 |
|
UCD 1005 |
I |
34.7 |
|
UCD Holstein |
IIa |
45.9 |
|
UCD Jacob's Cattle |
IIa |
N/A |
|
Zenith |
IIb |
20.9 |
|
Zorro |
IIa |
21.1 |
Table 3a. Growth habits and average 100-seed weight of organic dry bean varieties evaluated in Aurora, NY 2022.
|
Variety |
Growth habit |
100-seed weight (g) |
|
Alpena |
IIa |
14.1 |
|
Black Tails |
IIa |
18.9 |
|
Blizzard |
IIa |
18.3 |
|
Dr Wood |
IIb |
31.7 |
|
Lariat |
IIa |
31.4 |
|
Merlin |
IIa |
38.3 |
|
ND Palomino |
IIb |
16.3 |
|
Rojo Chiquito |
IIa |
22.8 |
|
Zenith |
IIa |
19.2 |
|
Zorro |
IIa |
19.9 |
Plants were harvested about 5 days after 95% of pods were brown or yellow. At the Alburgh, VT location, dry beans were harvested on 9, 15, and 21-Sep 2022 due to differences in harvest maturity between varieties. At the Geneva, NY location, all varieties were harvested on 26-Oct 2022. At harvest, pod height, lodging, and yield were assessed. Evaluations were done within two 1-m representative row lengths per plot from the center two rows. Pod height is the distance (cm) from the soil surface to the bottom of the lowest pod from 5 randomly selected plants in each of the two 1-m row lengths. Plots were given a lodging score on a 1 to 5 scale, where 1 means almost all plants are erect and 5 means all planted are down. Then all plants were removed and counted from the two 1-m row lengths and dried for 7 days at 60°C. Plants were then threshed to obtain and record seed yield. Seed moisture at time was adjusted to 14% moisture.
Results
Weather data were recorded with a Davis Instruments Vantage Pro2 weather station, equipped with a WeatherLink data logger at Borderview Research Farm in Alburgh, VT (Table X). The 2022 growing was cooler than normal with above average rainfall. There was a total of 20.53 inches of precipitation from June to September, 5 inches above average. The cooler temperatures resulted in a total of 2,106 accumulated Growing Degree Days (GDDs), 139 less than normal. The wet field conditions were challenging for timely weed management and mechanical cultivation, resulting in increased weed pressure especially later in the season.
Table X. Weather data for Alburgh, VT, 2022.
|
|
2022 |
|||
|
Alburgh, VT |
Jun |
Jul |
Aug |
Sep |
|
Average temperature (°F) |
65.3 |
71.9 |
70.5 |
60.7 |
|
Departure from normal |
-2.18 |
-0.54 |
-0.20 |
-1.99 |
|
|
||||
|
Precipitation (inches) |
8.19 |
3.00 |
4.94 |
4.40 |
|
Departure from normal |
3.93 |
-1.06 |
1.40 |
0.73 |
|
|
||||
|
Growing Degree Days (50-86°F) |
459 |
674 |
630 |
343 |
|
Departure from normal |
-64 |
-20 |
-11 |
-44 |
Based on weather data from a Davis Instruments Vantage Pro2 with WeatherLink data logger.
Historical averages are for 30 years of NOAA data (1991-2020) from Burlington, VT.
Table. Weather data for Aurora, NY, 2022.
|
2022 |
||||||
|
|
May |
June |
July |
August |
Sept |
Oct |
|
Precipitation (in) |
3.09 |
3.32 |
2.01 |
4.99 |
5.38 |
0.72 |
|
Departure from normal |
-0.09 |
-0.32 |
-1.8 |
1.52 |
1.39 |
-3.16 |
|
|
|
|
|
|
|
|
|
Average temp (F) |
60.9 |
66.4 |
71.9 |
71 |
62.3 |
53 |
|
Departure from normal |
3.3 |
-0.3 |
1 |
1.5 |
-0.6 |
1.4 |
|
|
|
|
|
|
|
|
|
GDD base 86/50 |
396 |
889 |
1551.5 |
2199 |
2599 |
2766 |
|
Departure from normal |
125 |
109 |
117.5 |
151 |
156 |
189 |
Based on weather data from Musgrave Research Station weather station and 30 yr averages from Northeast RCC CLIMOD2
The results of the organic dry bean variety trial at the Alburgh, VT location are listed below in Table 4. The top performers for each metric are in bold and any variety that was not statistically different (p=0.10) are marked with an asterisk (*). The earliest maturing variety was UC Southwest Gold, reaching R9 stage 85 days after planting. This was not statistically different from five other varieties, Cayenne, Desert Song, GTS 1701, California Early, and Merlot. The varieties Dr Wood, Soldier, UC Andino, UCD Holstein, and UCD Jacobs Cattle took the longest to mature, reaching R9 stage 113 days after planting, almost a month after the earliest maturing variety. At harvest, UCD Holstein had the highest population, 86,301 plants ac-1, and that was not significantly different from eleven dry bean varieties. Dry bean yield at 14% moisture ranged from 569 lbs ac-1 (Calypso) to 3,451 lbs ac-1 (Blizzard). The top performer was not statistically different from nineteen dry bean varieties. The trial average score for lodging at harvest was 2.28, and the variety Desert Song had the most lodging with a score of 4.50, indicating that nearly all the plants were completely horizontal. This was not statistically different from nine other varieties. There was an average pod height of 3.30-cm. Zenith had the greatest pod height, 7.80-cm, and was not statistically different from eleven varieties.
Table 4. Organic dry bean variety trial performance summary, Alburgh, VT, 2022.
|
Variety |
Days to maturity |
Harvest population |
Lodging |
Pod height |
Yield at 14% moisture |
|
|
DAP1 |
plants ac-1 |
1-5 rating2 |
cm |
lbs ac-1 |
||
|
Alpena |
97 |
58419* |
1.75 |
3.33* |
3081* |
|
|
Black Tails |
97 |
73024* |
2.75* |
6.83* |
3205* |
|
|
Blizzard |
99 |
62402* |
2.00 |
6.43* |
3451 |
|
|
California Early |
94* |
57091 |
1.50 |
3.20* |
2471* |
|
|
Calypso |
105 |
17260 |
1.75 |
0.25 |
569 |
|
|
Cayenne |
90* |
47134 |
1.50 |
4.98* |
2462* |
|
|
Desert Song |
95* |
48461 |
4.50 |
0.70 |
2171* |
|
|
Dr Wood |
113 |
53108 |
3.25* |
3.23* |
2601* |
|
|
GTS 1701 |
89* |
61075* |
3.50* |
1.80 |
1987 |
|
|
Gypsy Rose |
99 |
65058* |
4.25* |
1.40 |
1964 |
|
|
Jacobs Cattle |
100 |
36512 |
3.75* |
0.93 |
1068 |
|
|
Lariat |
96 |
55100 |
2.50* |
7.08* |
2897* |
|
|
Merlin |
102 |
73024* |
2.00 |
4.75* |
3016* |
|
|
Merlot |
93* |
63730* |
3.00* |
5.50* |
2322* |
|
|
ND Palomino |
97 |
40495 |
2.00 |
2.48 |
2699* |
|
|
Rojo Chiquito |
109 |
71032* |
2.75* |
5.23* |
2686* |
|
|
Soldier |
113 |
59747* |
3.00* |
1.15 |
2308* |
|
|
Tigers Eye |
109 |
43151 |
2.00 |
1.30 |
626 |
|
|
UC Andino |
113 |
37575 |
1.64 |
1.45 |
2527* |
|
|
UC Southwest Gold |
85 |
45142 |
1.75 |
1.18 |
1978 |
|
|
UC Tigers Eye |
105 |
53108 |
1.50 |
1.35 |
1842 |
|
|
UCD 1004 |
107 |
54234 |
1.13 |
0.99 |
3057* |
|
|
UCD 1005 |
106 |
39186 |
1.47 |
1.12 |
2245* |
|
|
UCD Holstein |
113 |
86301 |
1.00 |
2.40 |
2390* |
|
|
UCD Jacobs Cattle |
113 |
75016* |
1.75 |
2.95 |
2903* |
|
|
Zenith |
100 |
57755 |
1.00 |
7.80 |
2809* |
|
|
Zorro |
109 |
68377* |
2.00 |
6.75* |
2632* |
|
|
LSD (p=0.10) |
|
|
|
|
|
|
|
Trial Mean |
101 |
56198 |
2.28 |
3.30 |
2371 |
1 Days after planting
2 Lodging scale- 1= almost all plants erect, 2= either all plants leaning slightly or a few plants down, 3= either all plants leaning moderately (45°angle) or 25-50% down, 4= either all plants leaning considerably or 50-80% down, 5= all plants down
Table. Organic dry bean variety trial performance summary, Aurora, NY, 2022 – Tilled Trial.
|
Variety |
Market Class |
Days to Maturity |
Harvest Population |
Lodge Score |
Pod Height |
Yield (14% moisture) |
|||||
|
DAP |
plants ac-1 |
1-5 rating |
cm |
lbs ac-1 |
|||||||
|
Alpena |
navy |
113 |
bc |
39348 |
abc |
1.75 |
cd |
1.13 |
bcd |
2989 |
ab |
|
Black Tails |
black |
115 |
bc |
42683 |
ab |
1.75 |
cd |
1.95 |
bc |
2535 |
abc |
|
Blizzard |
navy |
119 |
bc |
34680 |
abc |
2.5 |
bc |
2.45 |
b |
2387 |
bc |
|
Dr Wood |
pinto |
121 |
bc |
37348 |
abc |
3.25 |
ab |
4.23 |
a |
3758 |
a |
|
Lariat |
pinto |
109 |
c |
27344 |
bc |
3.25 |
ab |
2.00 |
bc |
3529 |
ab |
|
Merlin |
navy |
118 |
bc |
41349 |
ab |
1.25 |
d |
2.05 |
bc |
3053 |
ab |
|
ND Palomino |
pinto |
136 |
a |
21675 |
c |
4 |
a |
0.03 |
d |
1741 |
c |
|
Rojo Chiquito |
small red |
126 |
ab |
43017 |
ab |
2.5 |
bc |
1.55 |
bcd |
2591 |
abc |
|
Zenith |
black |
116 |
bc |
28011 |
bc |
1.25 |
d |
0.78 |
cd |
2716 |
abc |
|
Zorro |
black |
125 |
ab |
47018 |
a |
3 |
ab |
0.83 |
bcd |
2449 |
bc |
|
LSD (p=.10) |
|
|
|
|
|
|
|||||
|
Trial Mean: |
|
120 |
36247 |
2.45 |
1.70 |
2775 |
|||||
Table. Organic dry bean variety trial performance summary, Aurora, NY, 2022 – Organic No-Till Trial.
|
Variety |
Market Class |
Days to Maturity |
Harvest Population |
Lodge Score |
Pod Height (cm) |
Yield (14% moisture) |
|||||
|
DAP |
1-5 rating |
cm |
|
lbs ac-1 |
plants ac-1 |
||||||
|
Alpena |
navy |
120 |
cd |
22342 |
abcd |
1 |
b |
1.53 |
abc |
1084 |
bc |
|
Black Tails |
black |
124 |
bcd |
25010 |
abcd |
1 |
b |
3.00 |
a |
1672 |
ab |
|
Blizzard |
navy |
123 |
bcd |
19674 |
bcd |
1 |
b |
2.93 |
ab |
1274 |
bc |
|
Dr Wood |
pinto |
128 |
abcd |
22008 |
abcd |
2.75 |
a |
1.15 |
c |
2155 |
a |
|
Lariat |
pinto |
116 |
d |
20008 |
abcd |
2.75 |
a |
2.37 |
abc |
1684 |
ab |
|
Merlin |
navy |
135 |
ab |
16006 |
cd |
1.25 |
b |
2.68 |
abc |
1159 |
bc |
|
ND Palomino |
pinto |
139 |
a |
13005 |
d |
2.75 |
a |
1.30 |
bc |
803 |
c |
|
Rojo Chiquito |
small red |
128 |
abcd |
32012 |
ab |
1.02 |
b |
2.25 |
abc |
1640 |
ab |
|
Zenith |
black |
126 |
abcd |
27677 |
abc |
1 |
b |
1.73 |
abc |
1409 |
bc |
|
Zorro |
black |
131 |
abc |
32012 |
a |
1 |
b |
2.25 |
abc |
1558 |
ab |
|
LSD (p=.10) |
|
|
|
|
|
|
|||||
|
Trial Mean: |
|
127 |
22975.385 |
1.55 |
2 |
1444 |
|||||
Discussion
At the Alburgh, VT location despite cool, wet conditions during the growing season, many of the dry bean varieties included performed well. Days to maturity ranged from 85 to 113 day after planting. The cool, wet conditions made timely weed management challenging especially as the dry beans approached harvest maturity. Weed pressure was not measured in this trial but did result in some yield loss for varieties that had poor emergence. For example, Calypso (specialty/heirloom), a late maturing variety, had significant weed pressure resulting in low yields. Top yielding varieties ranged from early to late maturing varieties indicating that varieties with a range of maturities can achieve good seed yields in northern Vermont. The lowest yielding varieties were all specialty/heirloom varieties. The top yielding varieties were navy and black bean varieties, but specialty varieties like UCD 1004 and UCD Jacobs Cattle had comparable yields.
At the Aurora, NY location periods of cool weather in June may have resulted in poor emergence and lower plant populations in the organic no-till trial. Drier than normal June and July followed by above average precipitation in August and September caused many varieties, particularly in the tilled trial, to put on new vegetative growth and flowers later in the season, causing excessive vining and uneven maturity. As a result, harvest was delayed until late October due to delayed dry down in many plots. Despite these anomalies, yields were overall high in the tilled trial. Yields were significantly lower in the organic no-till trial, in part due to much lower plant populations for most varieties. Weed pressure was low in the tilled trial and moderate to high in the organic no-till plots.
Alburgh VT Trials (2023):
Freeville NY Trials (2023)
Seeding Rate Trial - Key Takeaways:
1. Higher dry bean seeding rates (>200,000 seeds/ac) compensate for establishment challenges in no-till systems.
2. Increased dry bean plant densities improve weed suppression, reducing reliance on tillage and cultivation.
3. Profitability is strongly influenced by the organic price premium, making higher seeding rates a viable strategy in organic systems.
4. Organic no-till systems require further optimization to match the productivity and profitability of tilled systems.
Variety Trial and Market Class Trial - Key Takeaways:
- Heirloom or specialty varieties can be as high yielding as predominant major market class varieties, but performance varies widely. Testing varieties in your farm's environment is the best way to ensure performance.
- Weather can greatly affect growth habit, especially of indeterminate varieties. This can make reliable direct harvestability difficult.
- Black and navy beans are most reliably able to be direct harvested in our climate without significant yield loss. Pinto varieties tend to become vinier in a high moisture environment such as the Northeast, and varieties that may be suited for direct harvest in more arid regions may not be so in the Northeast.
- Organic no till dry bean systems had overall lower yields, and can't be recommended to growers as an equally or more profitable production system in most production years.
Education
Engagement
Participants were recruited through the Northern Grain Growers Conference (average 125 attendees), the UVM Northwest Crops and Soils e-list, OGRAIN, the NEOGRAIN listserv, and Extension Educator contacts. This list of bean growers was targeted for virtual content and invited to events. An average of 350 individuals engaged with the project via outreach events annually.
Learning
Project Listserv: Was used for project outreach, event publicity and resource sharing , facilitated by project leaders. This list grew from 80 to 158 farmers. (Loria)
Online Dry Bean Short Course: New farmers (or existing) participated in an three-part webinar series in 2023 and 2024 covering basics of dry bean production, processing, and marketing. This course used a Zoom seminar platform and include recorded video and results from research trials, resource guides, as well as live content provided by project leaders and experienced farmers. Participants accessed continuing education via Virtual Coffee Club and field days during the season. An estimated 120 farmers participated based on webinar polling. (Winter 2023 and 2024). (Darby and Loria).
Bean Cleaning/Processing Workshop: 1 bean processor/farmer in NY hosted a field day and facility tour to educate farmers on equipment needed to produce high quality bean products necessary for high-value markets. Farmers also learned about opportunities for custom processing and selling to processors wholesale. 120 attendees at the field day. (Summer 2023). (Martens).
Grower-led research: 2 collaborating farmers planted on-farm research plots that were shared at field days. These trials provided a site for twilight meetings, serve as case studies to share with other farmers, and facilitate farmer-to-farmer learning. Trial reports were shared at winter farmer meetings (Summer 2023 and 2024; also Summer 2022 in NY) (Casner, Martens).
Virtual Coffee Club: A biweekly virtual mentoring session targeted to short course participants, expert presented on a management challenge and farmers brought questions for group troubleshooting, timely management decisions were reviewed, research updates shared. (Darby and Loria)
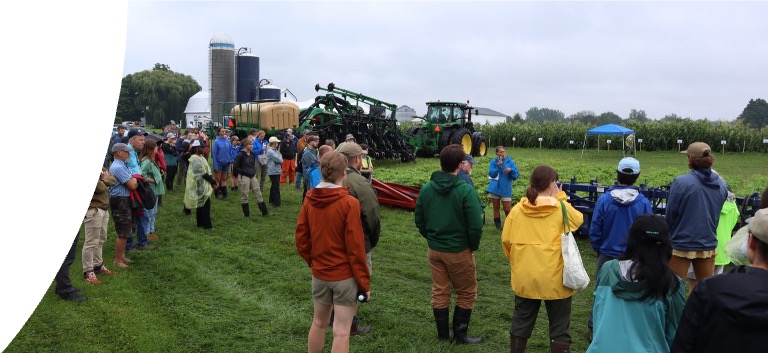
Field Days/Twilight meetings: Cornell Aurora Farm Field Days (average annual attendees = 140), Borderview Research Farm Field Day (average annual attendees = 200), an on-farm field day at Martens Farm / Seneca Grain and Bean in 2023 (140 attendees) These events allowed regional relationship building and resource sharing around bean production and processing, hosted by well-known researchers and respected farmers.
Winter Farmer Meetings: Results and resources were presented at the Northern Grain Growers Conference, New York Certified Organic (NYCO) meetings, OGRAIN and the Hudson Valley Grain School. (Ryan, Darby, Loria).
Dry Bean Grower Library: A new and updated Dry Bean Production Guide was developed and disseminated (Darby)
Evaluation (Darby and Loria)
- Baseline survey administered prior to project
- Quick-poll surveys to verify knowledge gained on the topics presented during the course. (early 2023 and 2024)
Participants were surveyed following each conference or workshop participation event to further assess knowledge gained and any changes to production they have adopted (fall of 2023 and 2024).
Participants in the coffee club were surveyed at the end of each season to assess knowledge gained and any changes to production they have adopted (Fall of 2023 and 2024).
Supportive Guidance and Tools
All webinars were recorded and remain accessible via the UVM YouTube channel, which has 4500 followers.
Milestones
- 80 farmers signed up for the project e-list after learning about the project through the 2023 Northern Grain Growers Conference and online outreach (January 2023)
Status: Complete
Accomplishments:
- 130 individuals signed up for 2023 webinar series, after publicizing the event through our existing dry bean e-list (80 members) and UVM and Cornell Extension and social media networks.
- 152 Individuals are now subscribed to the NE dry bean listserv.
- Social media: Our research trial updates, reports, and events got shared through our social media channels
-
- Facebook – https://www.facebook.com/uvmcropsoil 1.5K followers as of 1/27/26
- Instagram – https://www.instagram.com/uvm_nwcropsoil/ 1,291 followers as of 1/27/26
- Twitter – https://twitter.com/UVMExtcropsoil 289 followers, as of 1/27/26
- YouTube – https://www.youtube.com/user/cropsoilsvteam - 4.49K subscribers and 333 videos as of 1/27/26
4. The information also gets shared with the NGGA listserv and in their newsletter which has 555 members.
- Two farmer collaborators host on-farm research in project years 2 and 3 (also year 1 in New York) including a subset of variety trials, harvest method trials, and rolled-crimped rye trials. They will learn how alternative varieties produce on their farms, document new practices as well as outcomes from the trial, and incorporate successful varieties into future production (end 2024)
Status: Complete
Accomplishments:
In 2022 one farmer collaborator, the Hudson Valley Farm Hub, hosted a strip trial of the black bean seeding rate trial in organic no-till in 2022. While statistically significantly different results were not determined, the trial was reported has useful to the farm for thinking about their seeding rate practices.
In 2023 a farmer collaborator, Peter and Klaas Martens, planted a demonstration trial of no-till planted black beans into harvested barley stubble in the first week of July. Both 15" and 30" row spacings were trialed and some 30" row sections were also run through with the Ryan Lab's interrow mower to manage weeds. Yields were roughly half of full-season tilled plots, which would be comparable profitability to a buckwheat crop planted in the same rotation slot.
In 2023 and 2024, a New York farmer collaborator, Stuart Farr planted demonstration trials of organic no till black bean, planted into both roll-crimped cereal rye and a cereal rye - crimson clover intercrop. Yields were excellent in 2023 and good in 2024. A home-built inter-row mower was used to manage weeds in between dry bean rows as needed. The trial host felt that building soil health ahead of the cereal rye cover crop was beneficial to achieving high levels of cover crop biomass to suppress weeds and favorable soil tilth for successful dry bean establishment and vigor.
- 80 farmers and 10 Extension Educators attend a summer twilight meeting or field day and learn about promising dry bean varieties, weed management and harvest methods at a cooperating farm or research station. Farmers leverage information into behavior change for the current or future production year. Occurs in years 1-3. (end 2025).
Status: Complete
Accomplishments:
-
7/27/23: UVM Annual Crops & Soils Field Day (181 attendees) where we highlighted the research trials. Plots were labeled with treatment or variety information for attendees to read. Printed copies of dry bean research reports were made available as well.
- 8/15/23: Reduced Tillage Field Day at Martens Farm / Seneca Grain and Bean in Penn Yan, NY. 160 attendees heard presentations on reduced tillage research, toured no-till dry bean and soybean demonstration plots, and toured the grain and bean cleaning facility. Printed research reports and SARE published books were available for free to attendees.
- .
- 2024 Northwest Crops and Soils Field Day - 176 attendees attended the field day, including touring the variety trial, market class x tillage and black bean interrow mowing trials, with past year results shared on a poster and via handouts.
- 2024 Musgrave Research Farm Field Day - 140 attendees toured the dry bean market class x tillage and black bean interrow mowing trials, and learned about adaptive weed management strategies for organic no-till production systems. A public sensory evaluation of dry bean variety trial entries was conducted to get consumer feedback on sensory quality of heirloom and improved heirloom varieties.
- Freeville Farm Field Day - 58 attendees toured the variety trial and learned about specialty dry bean varieties.
- 2025 Northwest Crops and Soils Field Day - 201 attendees attended the field day, including touring the variety trial, with past year results shared on a poster and via handouts.
Do to the format of the field days, data on farmer behavior change was not collected but surveying of behavior change occurred via other avenues.
- 100 farmers attend winter presentations or conferences and learn about dry bean production, processing and marketing. Farmers use new knowledge to improve management decisions in following production year. Occurs Winter of years 1, 2 and 3 (end 2025).
Status: Complete
Accomplishments:
- Presented at Hudson Valley Grain School (Brewster, NY) to 150 attendees about dry bean production, niche marketing and our SARE project, and advertised the upcoming webinar. Two farmers personally reported a change in plans for the season after the session; written feedback from participants has not yet been received from meeting organizers. Significant interest in dry beans in the Hudson Valley, with a new potential processor having been started recently (Milestone Mill). Connections also made with GrowNYC wholesale purchaser interested in being connected with Northeast farmers, and Farm-to-School Extension specialists interested in collaborating on school purchasing of dry beans.

- "Diversifying with Dry Beans" presentation at OGRAIN February 2024 conference in Madison WI, estimated 250 attendees at entire conference, approximately 65 attendees in dry bean session.
- Presented project-end findings at the Northern Grain Growers Conference in March 2025 (40 attendees).
- 100 farmers attend a winter workshop and learn about dry bean processing and marketing, hosted by a cooperating farmer-processor. Farmers use information gained to improve bean cleaning operations on their own farms or access services of processors, as well as access new market opportunities. Occurs winter of years 2 and 3. (end 2024).
Status: Complete
- 2023 Field Day at Seneca Grain and Bean in Penn Yan, NY included tour of innovative dry bean and grain cleaning line. Methods and equipment for optimal dry bean cleaning and handling were shared, as well as opportunities to access custom cleaning services at Seneca Grain and Bean.
- Due to geographic spread of dry bean growers, project collaborators discussed using webinar format rather than an in-person workshop to more effectively share knowledge about dry bean cleaning via virtual events and videos.
- 2025 Northern Grain Growers Conference: Presentation on dry bean production, variety selection and marketing (40 attendees).
- 200 Farmers are recruited for participation in online Dry Bean Short Course through project listserv and winter meetings. 50 farmers enroll and learn about production, variety choices, processing and marketing of dry beans in the Northeast. Occurs in winter of year 1 and year 2. (end 2024).
Status: Complete
Accomplishments:
-
Two-part webinar series- Dry Bean Production (Flyer: dry_bean_webinar_flyer.pdf (uvm.edu))
2/17/23: Growing Dry Beans in the Northeast (94 attendees)
3/3/23: The Basics of Dry Bean Production (72 attendees)
Both recording posted to our NWCS YouTube page:
https://www.youtube.com/watch?v=96mC8qGwL2Y&feature=youtu.be
https://www.youtube.com/watch?v=vtf_5lTSYxQ&feature=youtu.be
- Three-part short course took place on Feb 20, Feb 27, and Mar 5 2024. Topics include dry bean disease management, developing new dry bean varieties, and a dry bean farmer panel.
- 30 farmers complete online short course, document improved knowledge and incorporate new knowledge into their upcoming crop plans. These farmers continue to engage in farmer-to-farmer learning activities such as Virtual Coffee Club. Occurs winter of year 1 and year 2. (end 2024).
Status: Complete
Accomplishments:
- 98% and 94% of 2023 short course attendees respectively reported learning something new about dry beans. 54% and 53% of attendees were farmers, with the next majority being researchers and Extension personnel. 94 attendees attended the first webinar and 72 attendees attended the second.
40 farmers participate in a biweekly virtual coffee club from April-September where they will learn about timely field management activities, submit questions and troubleshoot as a group and receive research updates. Occurs during growing season of year 2 and 3. (end 2024).
Status: Complete
-
"Beans for lunch" webinar series in Summer of 2024 continued farmer learning opportunities through the growing season. Farmer attendee numbers were low due to farmer constraints in the growing season, but attendees did have the opportunity to engage with experts one-on-one to troubleshoot issues. One attendee reported that it was a unique and very valuable experience to have a professional pathologist available to consult in this way.
- June 21st: Managing dry bean insect pests with Clark Moore, CCA (13 attendees) - recording posted on youtube (67 views to date)
- July 19th: Managing dry bean diseases with Dr. Sarah Pethybridge (15 attendees) - recording posted on youtube (95 views to date)
Milestone activities and participation summary
Educational activities:
Participation summary:
Learning Outcomes
Performance Target Outcomes
Target #1
5
reduced tillage planting of black bean
45
Reduced labor and fuel input was verified. Reduced erosion risk and benefit to soil health was not measured.
Target #2
4
added acreage of dry bean
25
additional regional dry bean production; added farm income
Target #3
10
changed variety grown on farm
85
improved performance and widened market share due to novel market class availability.
Much of the verification (in terms of acreage added, new varieties grown or no-till practices adopted) has come via direct conversation with farmers at outreach events. We did conduct pre and post-webinar polling for our short courses and coffee club sessions. These assessments focused on changes in knowledge rather than changes in practice implemented. Due to unexpected staffing shifts in the final year (2025), a project-end survey of all project participants was never conducted, so our ability to assess acreage change and sustained practice adoption across all participants in a quantitative way is limited. We do think that informal assessment of impact via sustained relationships and conversations at outreach events over the course of the project does reflect on the ground impact of our programming.
Additional Project Outcomes
This project has been leveraged to successfully obtain USDA-NIFA OREI funding focused on regenerative dry bean production, expanding our reach beyond New York and Vermont to include Maine and Wisconsin, and involving new collaborators in the fields of plant breeding and plant pathology, as well as expanding our work with agricultural economists and non-profit market development actors to address key marketing and supply chain aspects of supporting regional dry bean production.
One unexpected project outcome was a 2022 on-farm research collaboration with two regional Extension specialists, that included Mexican Bean Beetle scouting and beneficial insect release on two organic dry bean farms, where this pest was having severe economic impact. According to one farmer, "Damage from the pest cost us tens of thousands of dollars in 2021 alone, so the expense of the beneficial wasps is more than worth the cost and other management strategies we've tried have not been effective." The farmer noted that finding a strategy to manage this pest will influence their ability to be able to continue maintaining or increasing their dry bean acreage in addition to improving profitability.We recently learned that one of these Extension specialists have obtained funding to research variable rate drone pesticide applications in dry bean to manage Mexican Bean Beetle.