Final report for LNE22-448R
Project Information
Maine is the largest and only commercial producing state of wild (lowbush) blueberry in the US. Wild blueberry is the second most important crop to Maine’s economy and grown on 46,000 acres by 512 farmers. Wild blueberry growers face numerous challenges from seasonal drought and frost during bloom to the low market value of their crop. Interest in solar installations on wild blueberry fields has grown in the wake of similar, successful installations on cranberry bogs in Massachusetts. Similar to cranberry, this native perennial ground cover is tolerant of shade and moderate physical disturbance. Solar development firms are interested in installing on agricultural land and wild blueberry farmers are interested in diversifying their revenue streams. To our knowledge, farmers have been offered approximately $2,500/acre within solar contracts. On average a wild blueberry farmer produces 3,000lbs/acre at $0.40 cents/lb for a total of $1,200/acre, making a solar deal look very attractive.
This project will investigate if it is feasible to continue wild blueberry production within a solar array and host outreach events at wild blueberry solar development sites that are both dual-use and traditional. In 2021, Dr. Calderwood was approached by a farmer for assistance figuring out how to farm wild blueberry under a solar array in Rockport as a dual-use system. Construction of this dual-use array occurred from March-July 2021 when Dr. Calderwood and her team were able to discuss options with the farmer and solar company in addition to collecting preliminary data. The solar developer agreed to test out three methods of construction (careful, mindful, and standard) in order to identify ways to install the solar array with little damage to future wild blueberry production. Under these three construction methods, research included monitoring plant health and productivity using photosynthetic active radiation (PAR) sensors to measure sunlight penetration, plant development measures including emergence date, bud, flower, and fruit counts, plant heights, crop cover, and pest scouting. The wild blueberry farming community was engaged through a research and education program including field meetings, an advisory group, annual conferences and distributed annual reports, a solar factsheet, and solar specific web page. A cost of production analysis and solar vs. traditional production comparison was attempted with the Rockport farmer.
Ultimately our goal was to increase research based knowledge about growing wild blueberries under a solar array for environmental protection and as a diversified income stream option. We found that wild blueberry recovered well from all three methods of solar array installation yet the shade caused by the 8ft row spacing and 8ft high panels was too great for economically sustainable production. Yield was reduced by 91%. It was also more difficult for the farmer to get under panel rows for field management than expected.
Our biggest take-home message for landowners considering a solar array is to determine whether the project is primarily for energy production or crop production and to determine if you have three-phase power at the road or not. Finally, make sure you have excellent communication between yourself, the solar developer, and the construction company.
The project goal is to increase research-based knowledge on dual-use solar for wild blueberry farmers. Without university research on the feasibility of dual-use, growers will either A) not consider solar as a diversification option, or B) stop wild blueberry production for a solar contract. In 2019, 50% of the wild blueberry crop was lost to a spring freeze event and in 2020, 45% of the crop was lost to drought conditions, all while the price for wild blueberries averages a low $0.40/lb. Dual-use may be a practical solution to address both environmental and market stressors for this industry.
Cooperators
- (Educator)
Research
2022 and 2023 Research Questions: How does solar array installation impact wild blueberry sod? How does wild blueberry react to shading from solar panels spaced 8ft apart and 8ft off the ground?
2024 Research Question: What percent shade can wild blueberry withstand while maintaining crop production?
2022 and 2023 Studies in Rockport
Installation (completed by the construction team)
During construction of the 40-acre site, 12 acres were set aside for this research and panel installation was done in one of three ways within the research section. The three construction methods were named Standard, Mindful, and Careful. In Standard: construction and installation methods were unaltered from industry and company standards. Equipment could drive and operate anywhere and was not restricted from turning or rotating, and foot traffic was not limited. In Mindful: equipment could only enter and exit the site along one path, equipment could only rotate 90°, and foot traffic was limited to as few paths as possible. In Careful: poly mats (Figure 1) were placed on top of the blueberry plants to work and drive equipment on. Poly mats could remain in place for only four weeks at a time in spring and as summer progressed the mats could only be in place one workday at a time. Equipment could only turn 90° if the equipment was situated fully on plywood (otherwise, equipment could only drive straight in and straight out), and foot traffic was allowed only along one path.
Monofacial and bifacial panels were installed in this array. Monofacial panels are standard panels that have solar receptors only on the sun-facing side of the panel and generate energy just from that side. Bifacial panels are a newer technology with solar receptors on both sides of the panel that can generate energy from both sides. Bifacial panels allow more sunlight through the panel and generate energy from solar energy reflected off the surface underneath the panels. Monofacial panels were installed in the area constructed with the Standard treatment. Bifacial panels were installed in the areas constructed with Mindful and Careful treatments. Additionally, it’s worth noting there are terrain differences between steep slope where the bifacial panels are located and the shallow slope at the bottom of a hill, where the monofacial panels are located.
Data collection (completed by University of Maine Team)
Onset HOBO (Onset Computer Corporation, Bourne, MA, USA) temperature and relative humidity sensors (MX2300) were installed on wooden stakes driven into the ground to continuously track these metrics over time. One sensor was installed under monofacial panels, one under bifacial panels, and one in the array control underneath no panels.
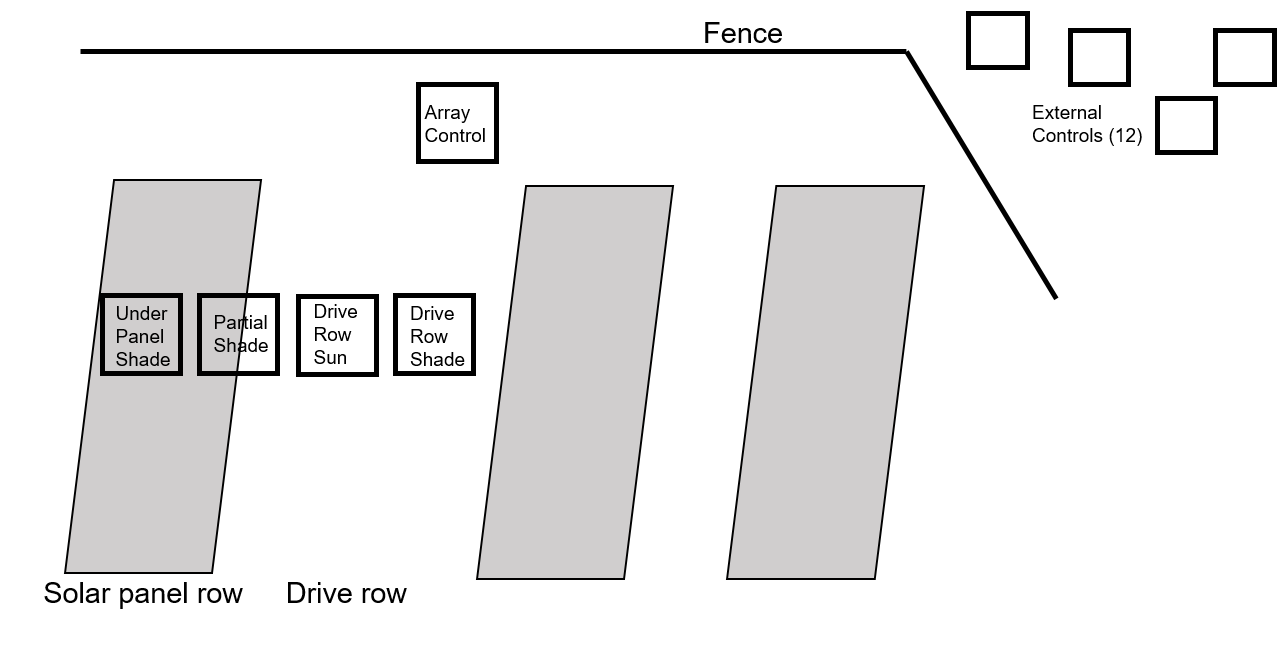
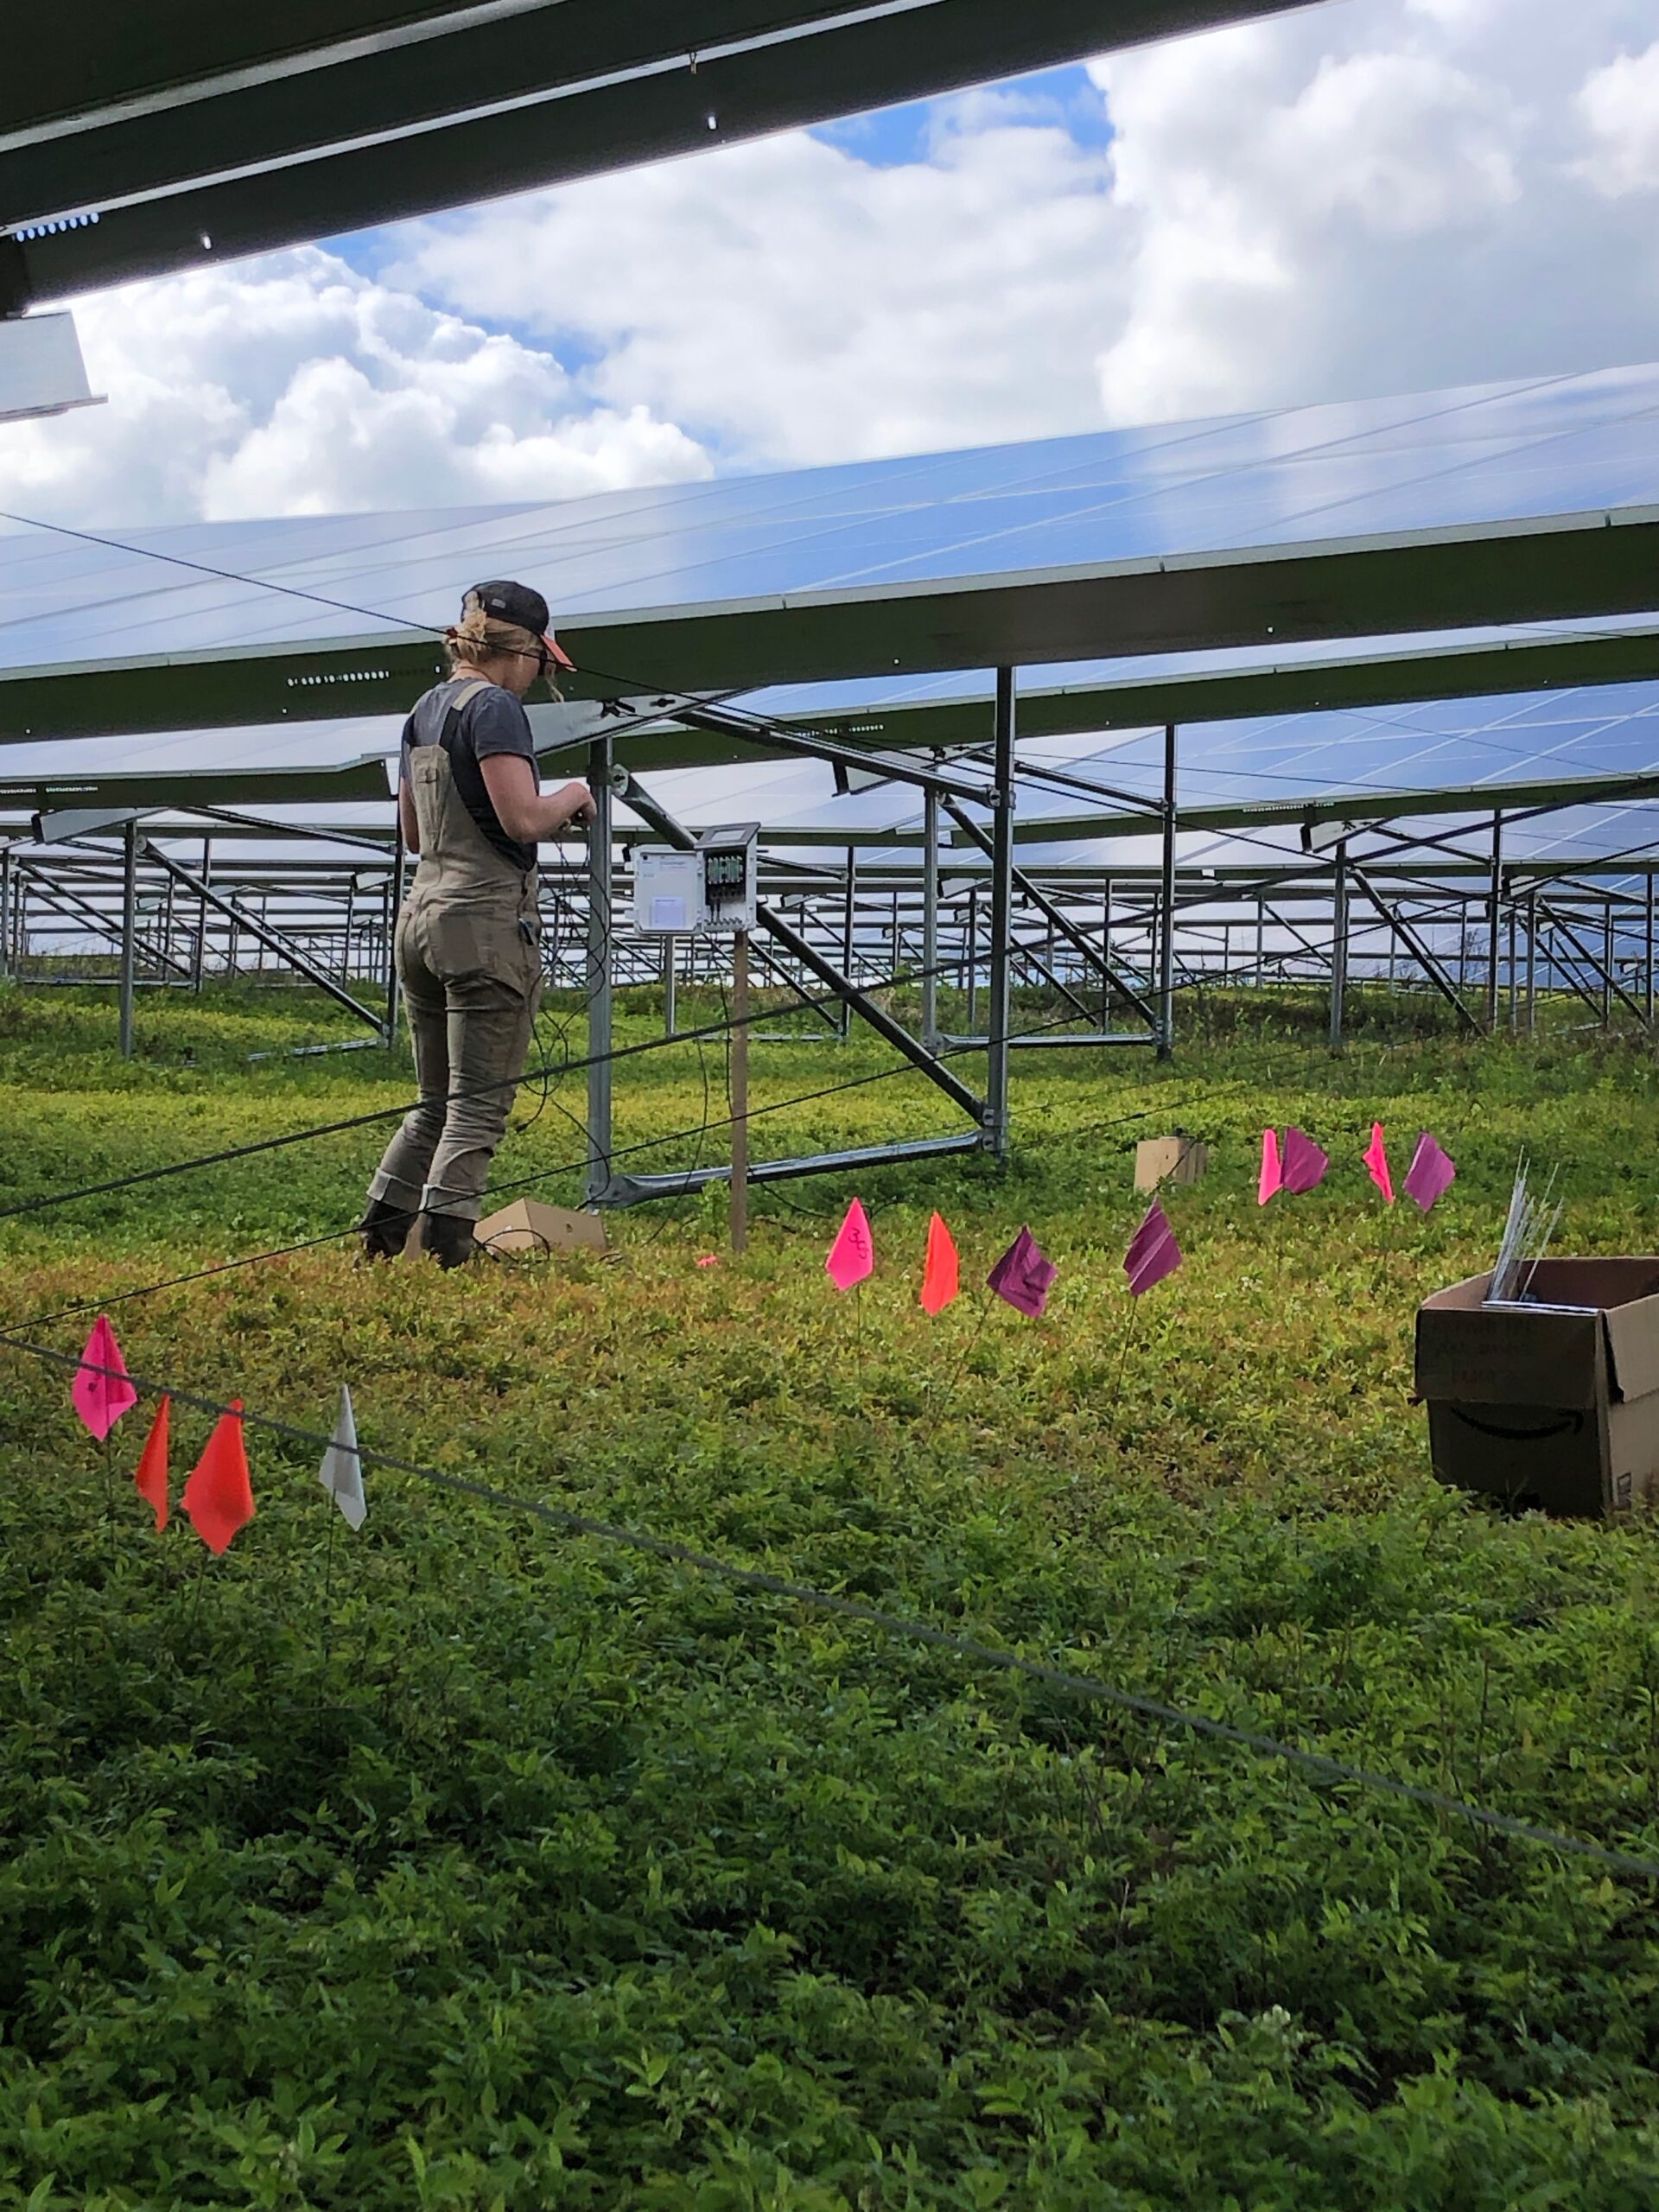
Multiple Photosynthetically Active Radiation (PAR) sensors with data loggers (ZL6 from METER group, Pullman, WA) were installed on wooden stakes on June 27, 2022. These wooden stakes also supported the temperature and humidity sensors described above. These sensors measured, in 15-minute intervals, the amount of sunlight penetrating the solar panel array; this light was assumed to be available to wild blueberry plants growing underneath the panels. Sunlight penetrating the panels was measured directly under panels, called “shade under panel”, partial shade (in drive rows behind panels, called “shade drive row"), and full sunlight conditions (in drive rows between solar arrays, called “sun drive row"). There were 4 sensors (full shade, partial shade, full sun, and a localized control, called “array control”) installed in each construction category (Standard, Mindful, Careful), for a total of 12 PAR sensors (Figure 1, below). No PAR sensors were installed in the control plots situated outside of the array perimeter (called “external control”). PAR sensors in full sunlight provided the localized control value, or “light quantities,” for comparison with the partial and full shade conditions.
A 0.37 m2 quadrat was used at each of the three PAR sensor locations totaling 16 quadrat sample locations per construction method for a total of 48 quadrats within the array. In addition, there were 12 external control quadrat plots, for a total of 60 quadrat plots across the entire project. All 60 quadrats were flagged for repeated measurements in the same locations throughout the season.
Wild blueberry health was evaluated within each quadrat by ranking overall blueberry cover using the Daubenmire Cover Scale of 0-6, where 0 = not present, 1 = ≤1-5% coverage, 2 = 6-25% coverage, 3 = 26-50% coverage, 4 = 51-75% coverage, 5 = 76-95% coverage and 6 = 96-100% coverage (Daubenmire, 1959). Weed presence was evaluated using the Daubenmire rank, totaling the number of weeds present, and listing the top three weed species present. Disease presence was evaluated by counting the number of blueberry stems showing signs of disease, listing the top three diseases present, and ranking the severity of the disease observed. Numbered stem tags were placed on three stems within each quadrat and these three stems were visited repeatedly to count the number of buds and fruit that developed. These blueberry coverage, bud/fruit count, weed presence, and disease presence measurements were all taken three times in 2022, on May 17, June 14, and July 20.
Wild blueberry plant health was further evaluated by gathering SPAD and TDR data. SPAD (Soil Plant Analysis Development) is a measure of how much chlorophyll is present in the leaves of the plant and was measured using a handheld chlorophyll meter (SPAD 502; Minolta Corp., Osaka, Japan). The higher the value calculated by the meter, the healthier the plant. SPAD values were taken in pairs on the same stem, reading the value on a lower and upper leaf. These pairs were taken on 4 randomly selected stems within each quadrat. TDR (Time Domain Reflectometry) is a measure of soil moisture content and temperature and was measured using a FieldScout TDR 150 Soil Moisture Meter (Spectrum Technologies, Inc., Aurora, IL, USA) to measure soil conditions to a depth of 12 cm. TDR samples were taken twice in each quadrat. SPAD samples were gathered on June 14 and July 20, 2022. TDR samples were gathered on May 17 and July 20, 2022.
Fruit was harvested July 20, 2022 by hand-raking within each quadrat and measuring the weight of the harvested fruit. The fruit samples were then combined by treatment type (sun, full shade, partial shade) and 100 random berries were selected, combined and weighed to calculate the “100 berry weight”; this information can give a sense of whether fruits were large or small in size. After calculating the 100 berry weight, a sample of fruit was removed from each combined treatment sample and macerated before being measured for Brix, a measure of sugar content.
Data analysis
Computations were carried out using JMP Version 16.0 (SAS, Cary, NC, USA) statistical software. All data collected via multiple samplings throughout the field season (soil moisture, soil temperature, SPAD, pest measures and blueberry cover) were analyzed using a repeated measures full factorial, followed by a Tukey’s Pairwise comparison. Larger data sets of environmental conditions collected on a 24hr basis, including PAR, air temperature, humidity and dewpoint were shortened to 10 AM – 2 PM (peak growing hours) and analyzed using an REML mixed model with date and treatment. PAR was converted from units of µmol·m⁻²·s⁻¹ PPFD to %PAR relative to the average PAR received by the control outside of the array (1380 µmol·m⁻²·s⁻¹ PPFD). Single date measures (blueberry phenology, yield and Brix) were analyzed using a one-way ANOVA and a Tukey’s Pairwise comparison (following any necessary transformations). Multivariate and bivariate regressions were run to assess the degree of relation between the dependent variable yield and independent variables: air temperature, relative humidity, PAR, soil moisture, soil temperature and SPAD. Linear regression plots are presented below for variables with significant linear relationships following the bivariate regression analysis.
Due to the nature of count data collected in the field (which often has a high number of zeros, creating a skewed distribution) much of our data failed the assumptions of normality and equal variance often required to run parametric statistical tests. Data that did not meet the statistical assumption of normal distribution included: soil moisture, soil temperature, relative humidity, pest data, Brix, blueberry phenology and cover. These data were transformed using a square root transformation. The transformed data improved visually in their distribution but continued to statistically fail for normality. Statistical tests were carried out despite non-normality after establishing there were no serious problems with the data. When data met statistical assumptions (including air temperature, dewpoint, and yield), data were not transformed prior to statistical testing. Regressions were performed on untransformed data.
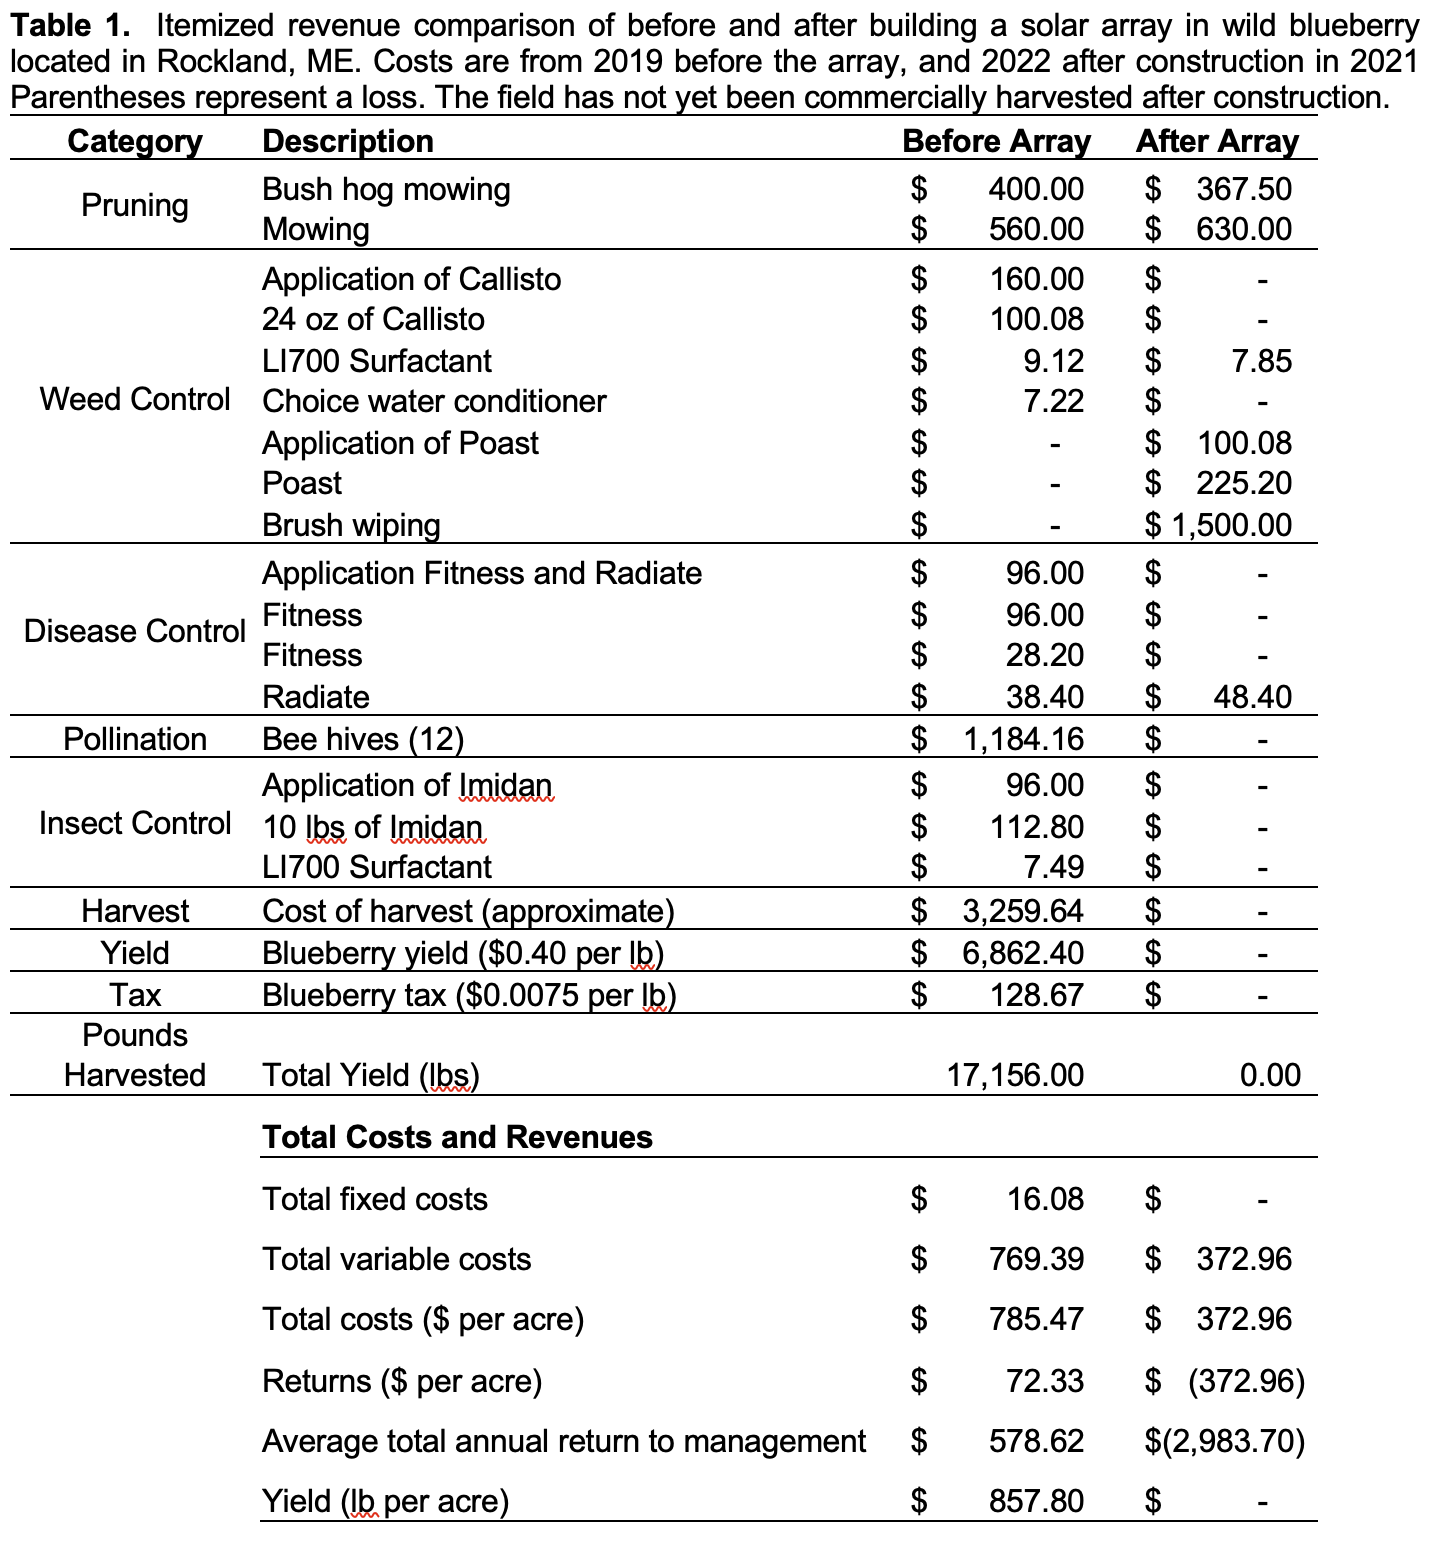
Cost Comparison
The Rockport array was installed in 2021, making the 2022 crop year in this field still a recovery season but the farmer decided not to harvest this field because of the difficulty in getting underneath panels with a hand crew or walk-behind harvester. The revenue made from the solar panels was never disclosed to us, unfortunately. A cost comparison before and after solar was begun given the limited data available thus far. A one-on-one interview with the farmer who manages the Rockport solar-blueberry site was completed by going through costs with the farmer. We used a calculator made in Microsoft Excel to determine annual return, revenue per acre, and total cost per acre. See factsheet for dollar amounts.
2024 Shade Experiment
Site and Experimental Design
The location of the study was in the Downeast Region of Maine in the town of Jonesboro at the Blueberry Hill Research Farm (44°38'41.5"N, 67°38'52.8"W). The soil type is a Colton gravelly sandy loam with 0 to 3% slopes (USDA, NRCS, 2019). The study was conducted from May 2nd to August 8th, 2024, during the wild blueberry crop cycle. A HOBO MX2301A weather station (Onset, Bourne, Massachusetts, USA) was installed to measure air temperature and relative humidity for the duration of the study.
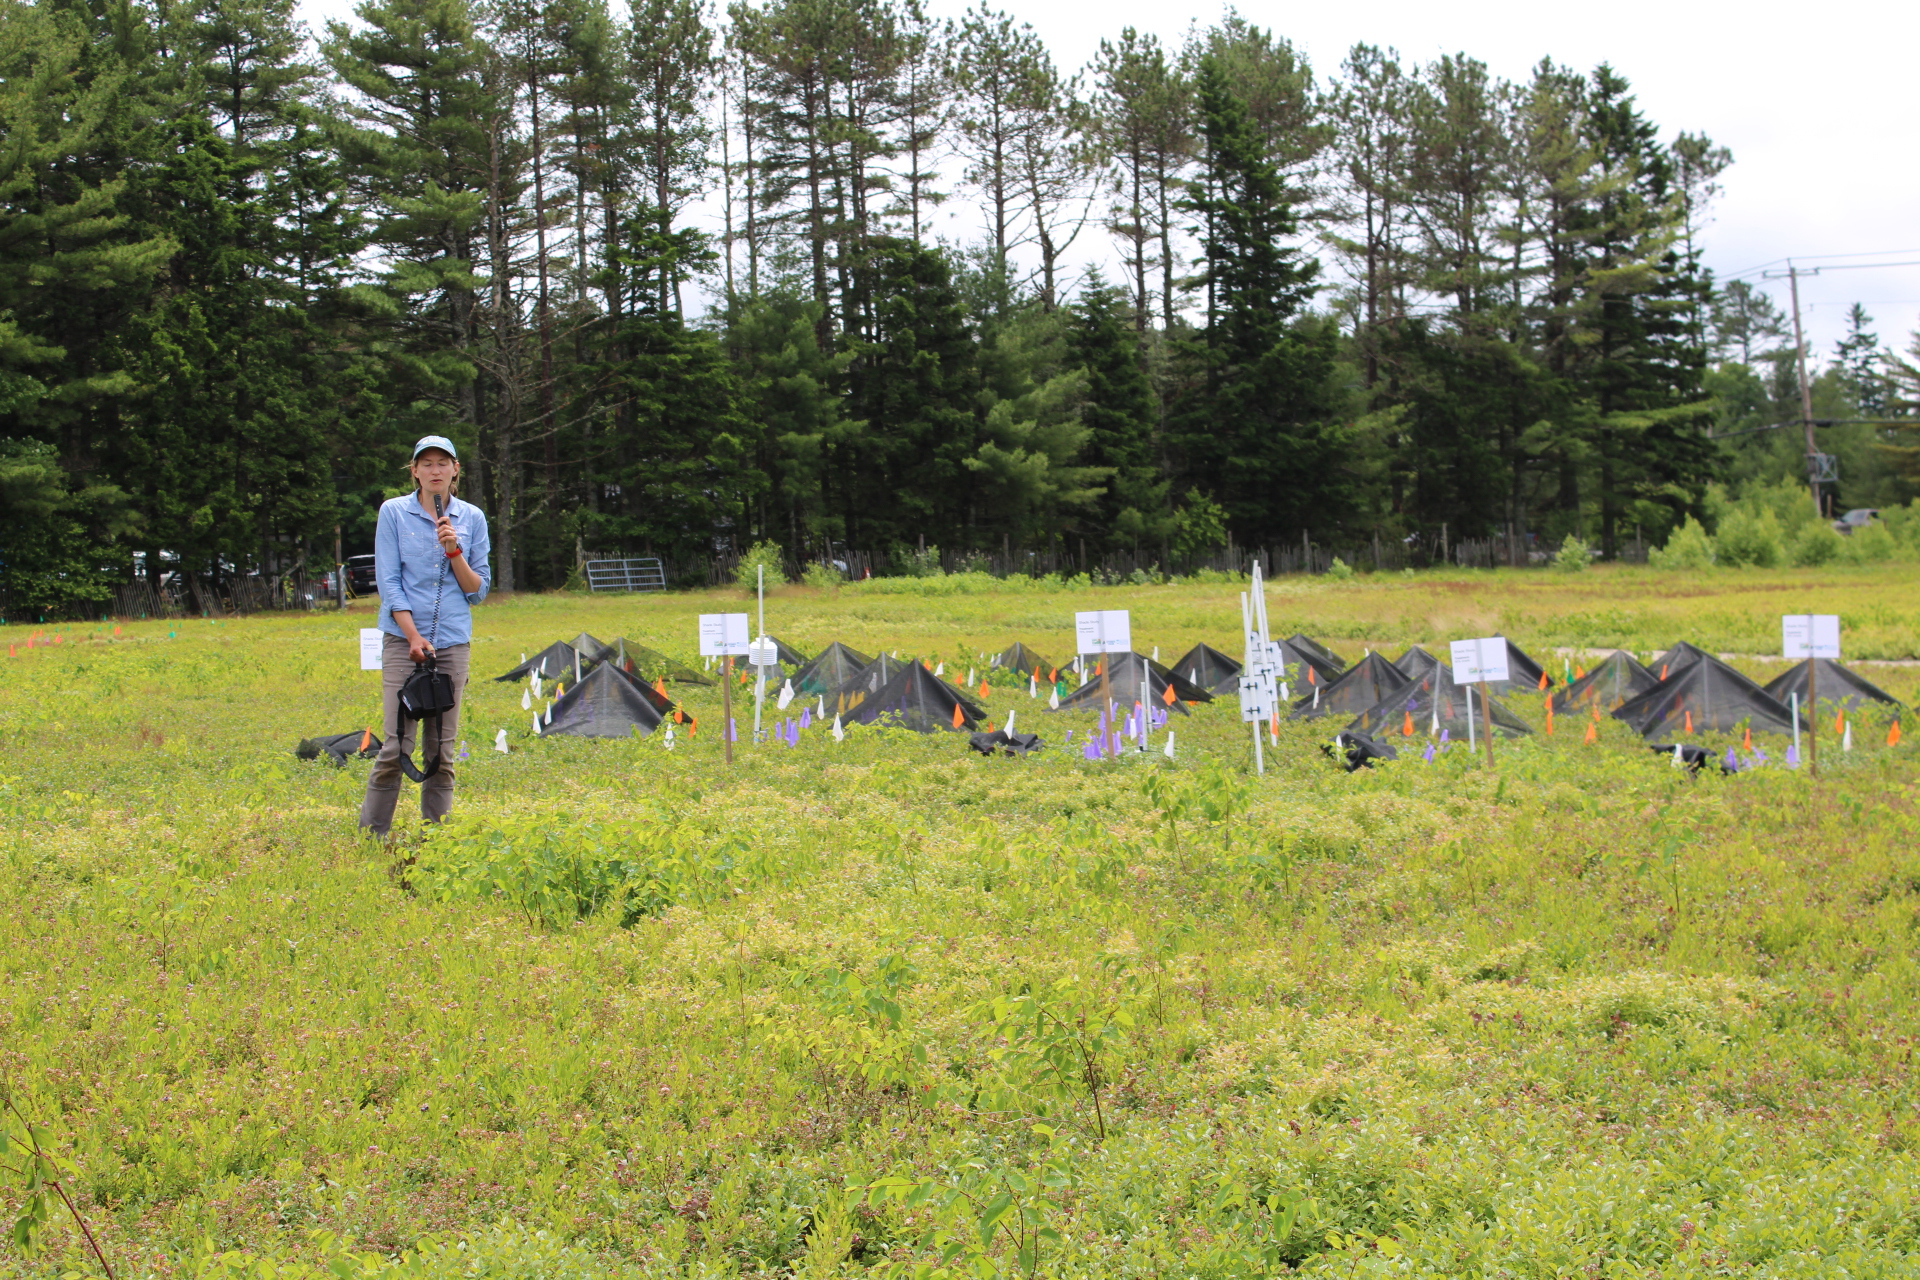
Design of the experiment was a random complete block design with six replications and six treatments. Treatments consisted of an unshaded control and 30%, 40%, 50%, 60%, and 70% shade coverage over plants. Black shade cloth (FarmTek, Dyersville, Iowa, USA) was cut and placed over a 1 in (2.54 cm) PVC pipe that was pounded into the ground to a height of 4 ft (1.22 m). The corners and sides of the cloth were tied down with shade clips (FarmTek, Dyersville, Iowa, USA) and paracord which was secured to the ground with tent stakes. On each PVC pipe, Photosynthetically Active Radiation (PAR) sensors (METER Group, Pullman, Washington, USA) were mounted and plugged into a ZL6 Advanced Cloud Data Logger (METER Group, Pullman, Washington, USA). Sensors measured photosynthetic photon flux density (µmol m-2·s-1) to determine how much sunlight was reaching the plants underneath the shade cloth compared to the unshaded control. These sensors were only installed in four replications due to budget constraints. Around the tents were 3 ft (0.91 m) buffers and underneath the tents were 3 ft x 6 ft (0.91 m x 1.83 m) plots. Within the plots, ten stems were marked with metal numbered tags.
Data Collection
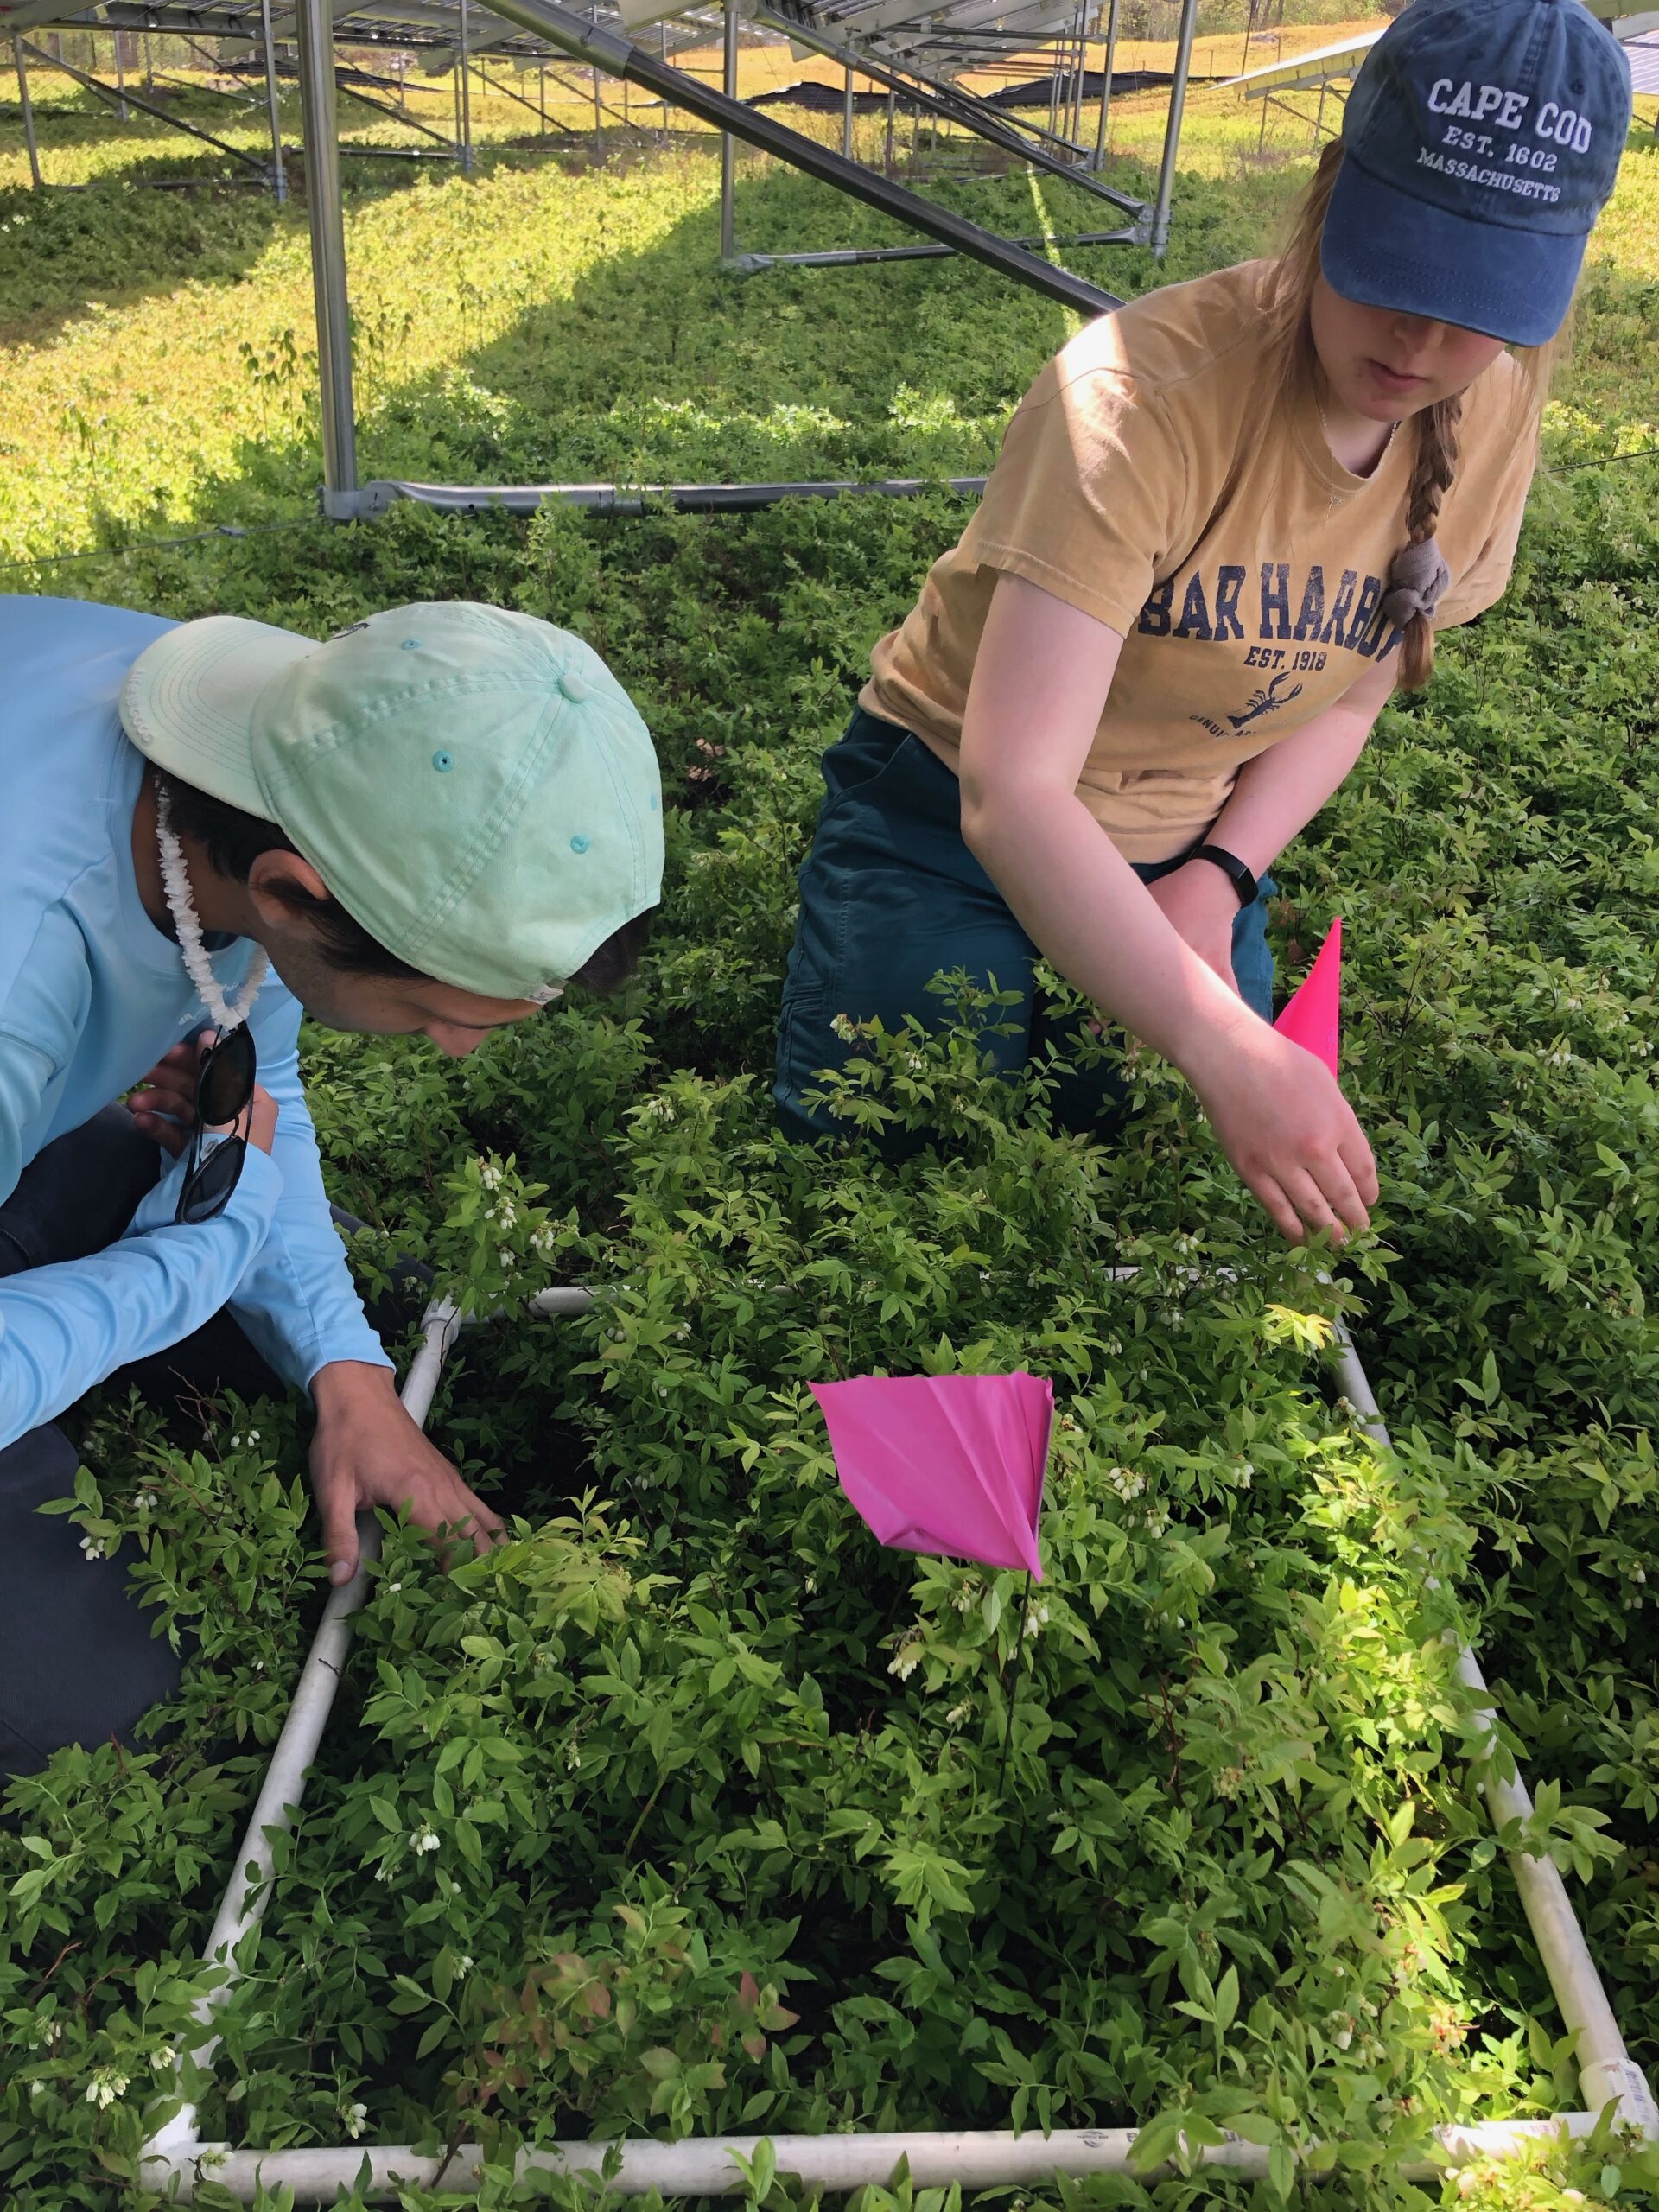
On the ten marked stems, height was measured at the beginning and end of the study. Two leaves from the middle of the stems were measured for length and width on July 3rd. Chlorophyll content was measured using a Soil Plant Analysis Development (SPAD) 502 Plus Chlorophyll Meter (Konica Minolta Optics, Inc., Osaka, Japan) on the marked stems on July 3rd. Phenology of the stems were documented at the peak green fruit stage for number of pin heads, green fruit, color change, and blue fruit on July 3rd. Then stem density was collected by counting all the stems in a 1.64 ft x 1.64 ft (0.5 m x 0.5 m) quadrat in the plot at the end of the study on August 12th.
Pest evaluations were conducted for weeds, insects, and diseases under the tents on June 5th. Weeds were identified by species then counted until all weeds were identified and documented. The weed species found on site were Rumex acetosella (red sorrel) and Apocynum androsaemifolium (dogbane). Insect pests were documented by the presence of insect damage to stems and leaves until all types of damage were identified. The insects identified were Altica sylvia (flea beetle), Dasineura oxycoccana (tip midge), and Franklinella vaccimii and/or Catinathrips kainos (thrips). Disease presence was defined the same as insect damage. Infected stems were counted by identifying infected leaves and/or fruit. The types of disease identified were leaf spot species, Monilinia vaccinii (mummy berry), and Botrytis cinerea (botrytis), and Exobasidium vaccinii (red leaf). Deer damage was also documented in the plots from the previous season when the plants were in the prune cycle.
The fruit was then harvested on August 8th at the peak blue fruit stage. The harvesting was done with a hand rake in a 5.38 ft2, 2.32 ft x 2.32 ft (0.5 m2, 0.71 m x 0.71 m) area per plot and weighed for fresh weight. A sample of 100 berries was randomly collected from each plot for a 100 fruit count weight. The fruit was then transferred to a lab and Brix (sugar content) was measured for each plot.
Data Analysis
After data input, it was organized and cleaned for outliers or missing data points in Microsoft® Excel®(Microsoft Corporation, Redmond, Washington, USA). Then data were uploaded to JMP® (JMP®, Version Pro 17.0.0. SAS Institute Inc., Cary, NC, 1989-2024), a statistical software, for analysis. An Analysis of Variance (ANOVA) model was used for testing treatment effects with a cut off value of (α ≤ 0.05). Model residuals were visually checked for homoscedasticity using studentized residual plots and normality was checked using a Shapiro-Wilks test and observing QQ-plots. If the model satisfied assumptions for an ANOVA, significant results were further explored using means comparison tests of a Tukey’s Honest Significant Difference (HSD) test, Dunnett’s test, or a Student’s t-test if there were only two comparisons (α ≤ 0.05). If a model failed normality or homoscedasticity, then a transformation was used. In the PAR data, a log(x + 1) was used and a cube root transformation was used in the phenology model. Back-transformed means are not presented in figures to show standard error of the mean but connecting letter reports reflect results from the transformed model. If a transformation improved homoscedasticity and QQ-plots, but failed to satisfy a Shapiro-Wilks test, the parametric test was still used. It has been found that F-tests still provide accurate results without significantly affecting Type I error under non-normal residuals with homoscedastic variance (Blanca et al., 2018).
2022 and 2023 Rockport Solar Array Study
Environmental Conditions (Soil, Air, Sunlight)
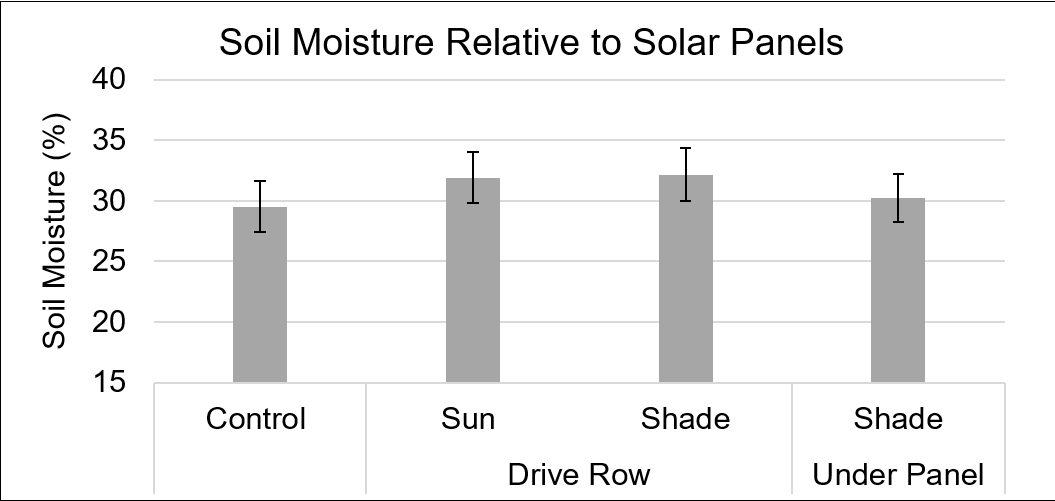
While not significant, there were trends in soil moisture where the control experienced the lowest average soil moisture (29.5%), the shade under panel was slightly greater (30.3%), and greater still in the sun drive row (31.9%) and shade drive row (32.2%) (Figure 1). This may be due to the location of the drive row (being between the panels) where regular precipitation and panel run off is concentrated but the panels still shade and trap moisture from the sun.
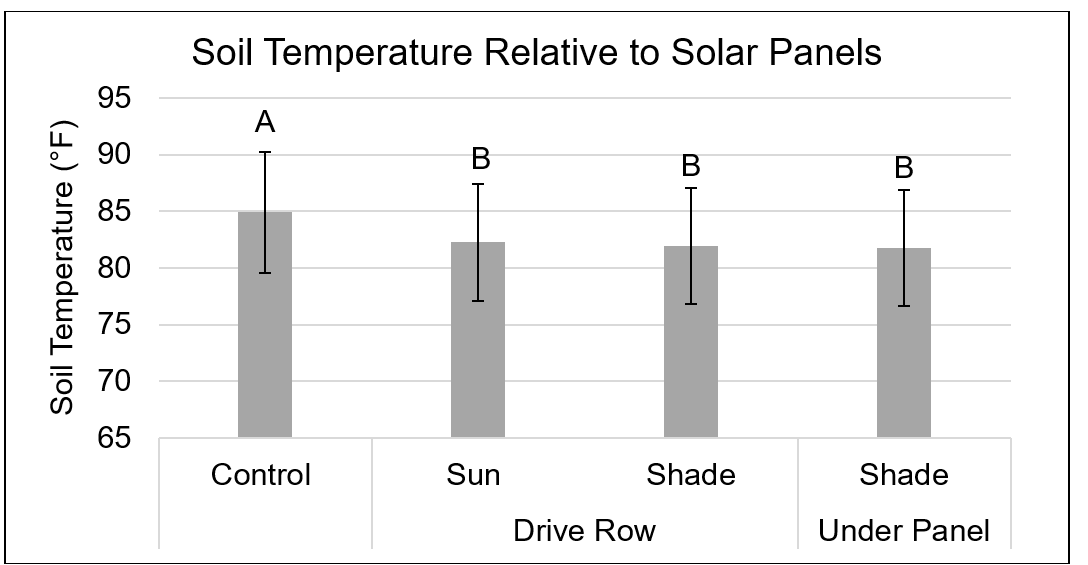
The shade under panel experienced the lowest average soil temperature (81.7°F), close to the temperature of the shade drive row (81.9°F) (Figure 2). Soil temperatures in the sun drive row were 82.3°F and significantly higher at 84.9°F in the control. The average control temperatures were significantly warmer when compared to the treatments, which makes sense as the ground in the control experiences full sun.
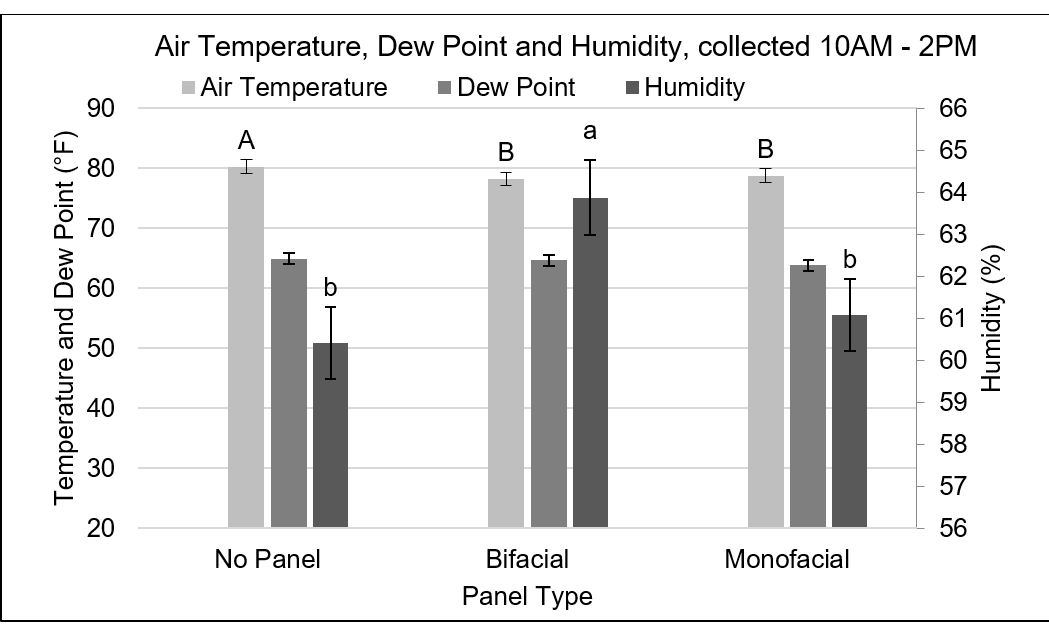
Air temperature, dew point, and humidity were measured from 10 AM – 2 PM daily (most direct sun exposure) for the control and both panel types: monofacial and bifacial (Figure 3). Air temperatures were significantly higher outside of the panels (80.3°F), and lower underneath the bifacial panels (78.3°F) and monofacial panels (78.8°F). Dew point exhibited no significant treatment differences, with average dewpoint values of 64.9°F, 64.7°F, 63.8°F, in the control, bifacial and monofacial treatments, respectively. The bifacial panels experienced significantly greater average humidity (63.9%) than the average humidity observed under the control (60.4%) and monofacial panels (61.1%). The bifacial panels allow greater light penetration than the monofacial panels. The higher humidity under the bifacial panels suggests that the light penetration encourages evapotranspiration from the leaves and soil but also acted as a physical barrier to trap that humidity.
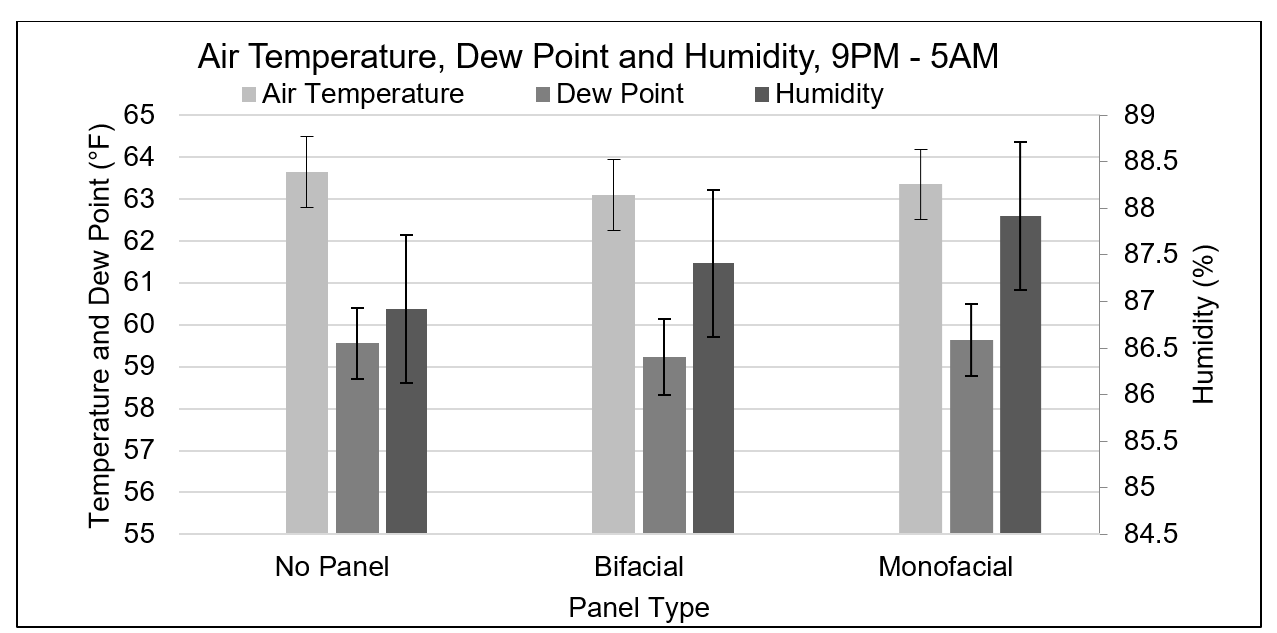
Air temperature, dew point, and humidity were measured from 9 PM – 5 AM (overnight) for the control and both panel types: monofacial and bifacial (Figure 4). Air temperatures were highest outside of the panels (63.6°F), and slightly lower underneath the bifacial panels (63.1°F) and monofacial panels (63.3°F), although not significantly different. Average dew points were relatively similar across treatments, being 59.6°F, 59.2°F, and 59.6°F in the control, bifacial and monofacial treatments, respectively. Average humidity observed in the control was 86.9%, 87.4% under the bifacial panels, and 87.9% under the monofacial panels, although not significantly different. A lack of significant treatment differences in the nighttime hours when compared to the daytime hours suggests sunlight is the driving factor in the significant differences observed in Figure 3.
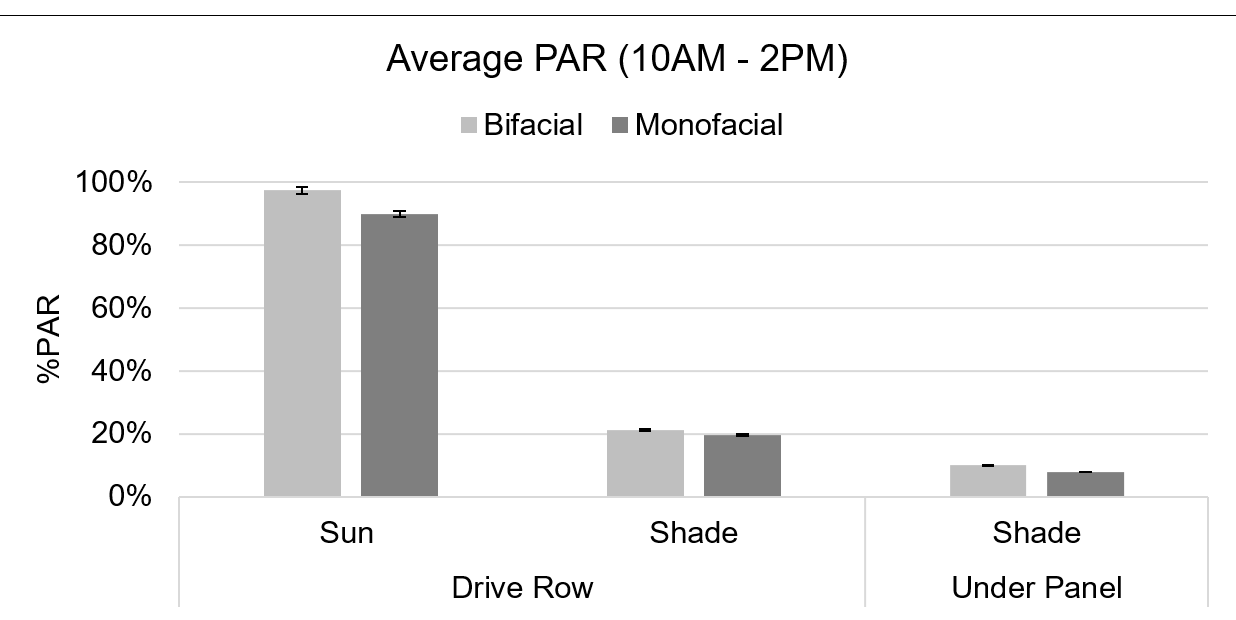
PAR received by plants in each of the treatments was dramatically different. Areas underneath bifacial panels had slightly higher PAR levels than those with monofacial panels. All units for PAR are micromoles per meter per second (µmol/m⁻²/s⁻¹ PPFD) and indicate how much usable light energy reaches an area. The base level for full sunlight was 2000 µmol/m⁻²/s⁻¹ PPFD with sensors maxing out at 2325 µmol/m⁻²/s⁻¹ PPFD. The control received an average of 1380 µmol/m⁻²/s⁻¹ PPFD from 10a-2p each day May 18 to August 31, 2022, including both sunny and cloudy days. The control PAR level was used as the upper threshold for establishing %PAR in all other treatments. Relative to the average PAR observed in the control, bifacial areas received 90%PAR, 19%PAR, and 9%PAR in the sun drive row, shade drive row, and shade under panel, locations, respectively (Figure 5). The monofacial areas received slightly less than the bifacial with average levels of 83%PAR, 18%PAR and 7%PAR in the respective sun drive row, shade drive row, and shade under panel locations.
Plant Health
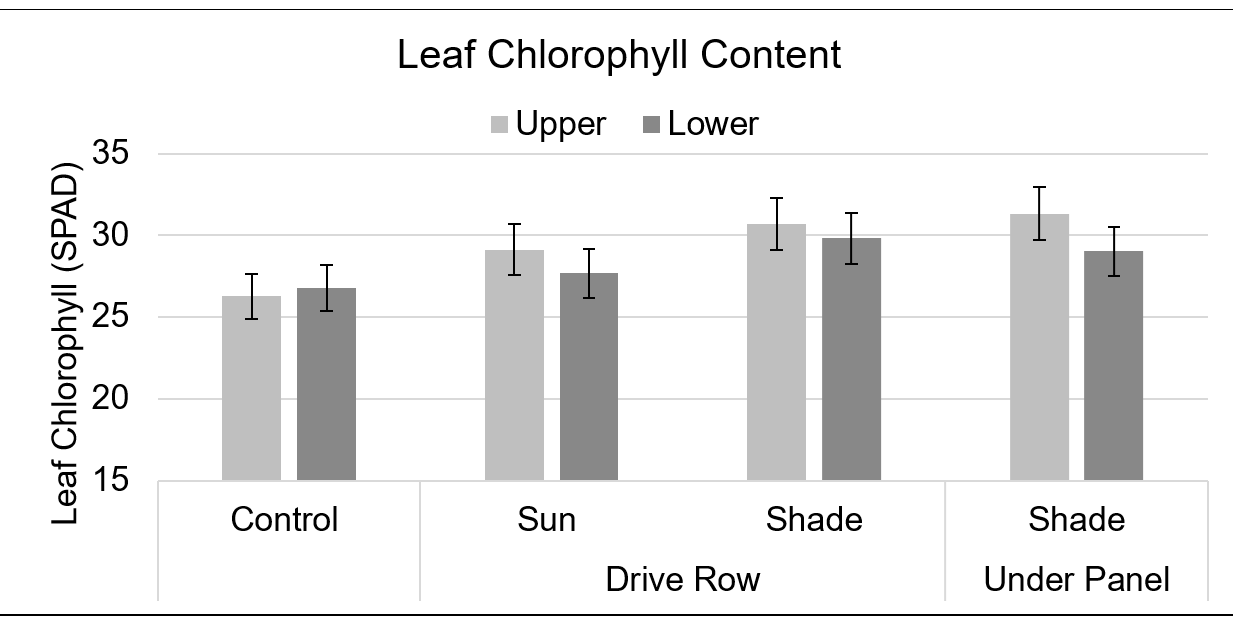
Leaf chlorophyll content in the shade drive row treatments were greatest in both the upper and lower leaves (upper 30.7 SPAD, lower 29.8 SPAD), while the lowest leaf chlorophyll content occurred in the control (upper 26.3 SPAD, lower 26.8 SPAD) (Figure 6). Although not significant, all treatments within the array exhibited greater leaf chlorophyll content in both the upper and lower leaves when compared to the control.
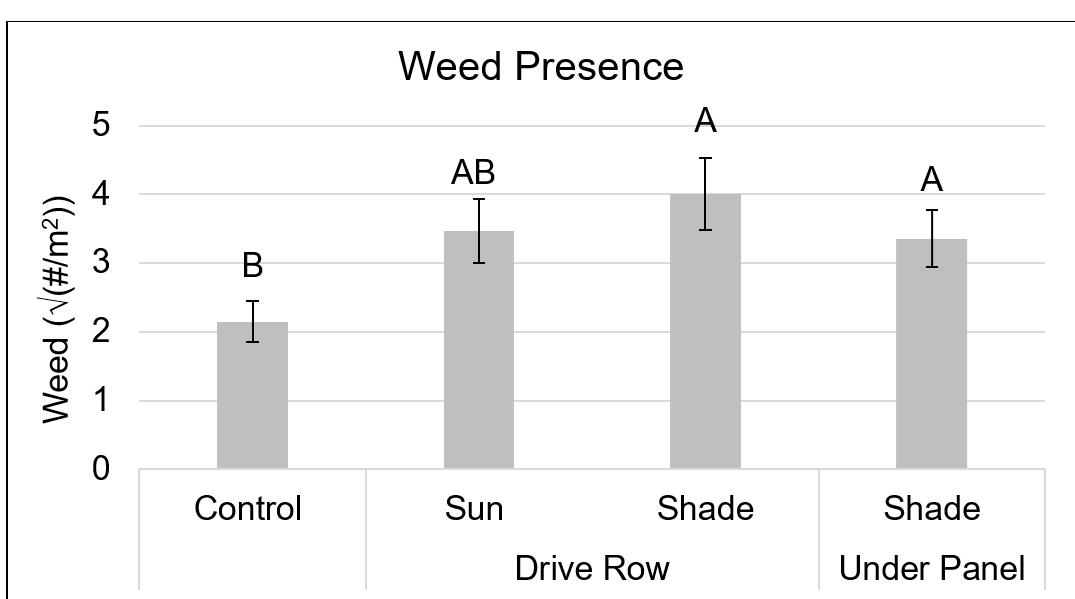
Weed presence was greater within the array relative to the control (Figure 7). The shade drive row treatment (43 weeds/m2) and the shade under panel treatment (28 weeds/m2) had significantly greater weed numbers than the control (14 weeds/m2). Although not significant, the treatments with the greatest number of blueberry stems with insect damage were the control (6.2 stems /m2), followed by the sun drive row (4.1 stems /m2), the shade drive row (2.5 stems /m2), and the shade under panel (1.9 stems /m2) (Figure 8). Disease presence also did not demonstrate significant treatment differences (Figure 9). However, the control exhibited the highest number of blueberry stems with disease (56.4 stems/m2), followed by the shade drive row (41.6 stems /m2), the sun drive row (26.7 stems /m2), and the shade under panel (23.4 stems /m2).
Phenology
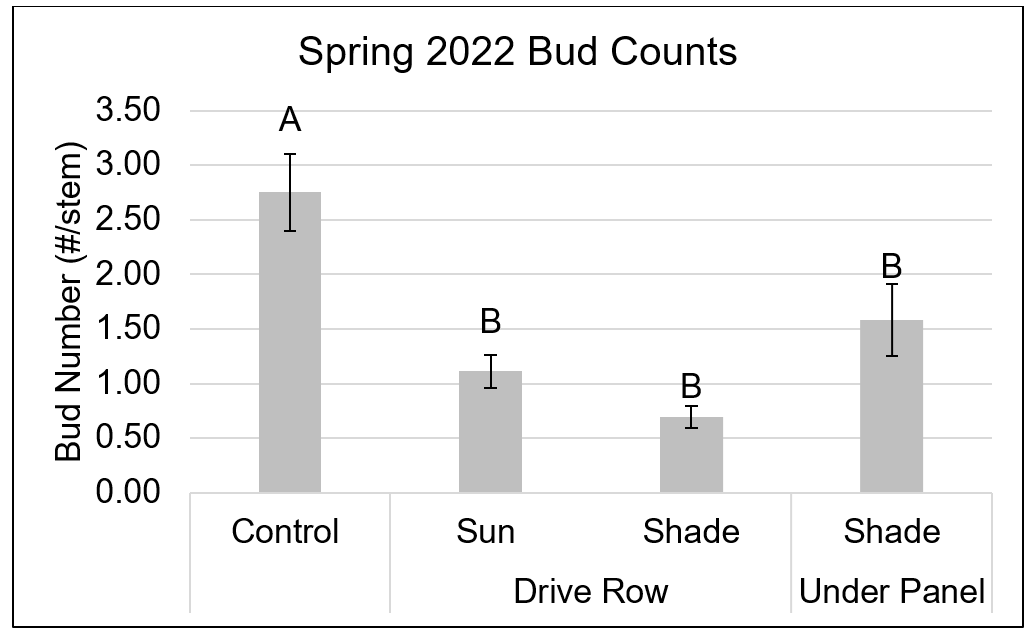
On May 17, 2022, the blueberry stems in the control exhibited significantly higher bud numbers (2.8 buds/stem) compared to all other treatments (Figure 10). The stems in the shade drive row treatment exhibited the lowest average bud numbers (0.7 buds/stem). On June 14, 2022, treatment differences in phenological development were not significant. However, it is worth noting that blueberry stems in the control exhibited the highest number of pin heads (2.6 pin heads/stem) and green fruit (4.0 green fruit/stem). Similar to bud number, the lowest counts of pin heads (0.9 pin heads/stem), and green fruits (1.4 green fruit/stem).
At harvest on July 20, 2022, the greatest number of blue fruits occurred in the control (76%) and the sun drive row (82%) treatments. In contrast, the shade drive row and shade under panel were primarily dominated by the green fruit stage, with green fruit comprising 49% and 85% of the total fruit, respectively. These differences in fruit ripeness ratios by treatment suggest that the shaded treatments were behind in phenological development relative to the treatments receiving more sun. Additionally, the control may have been developmentally ahead of the treatments within the array, with 6% of the fruit counted as overripe (unmarketable) fruit.
Fruit Yield & Quality
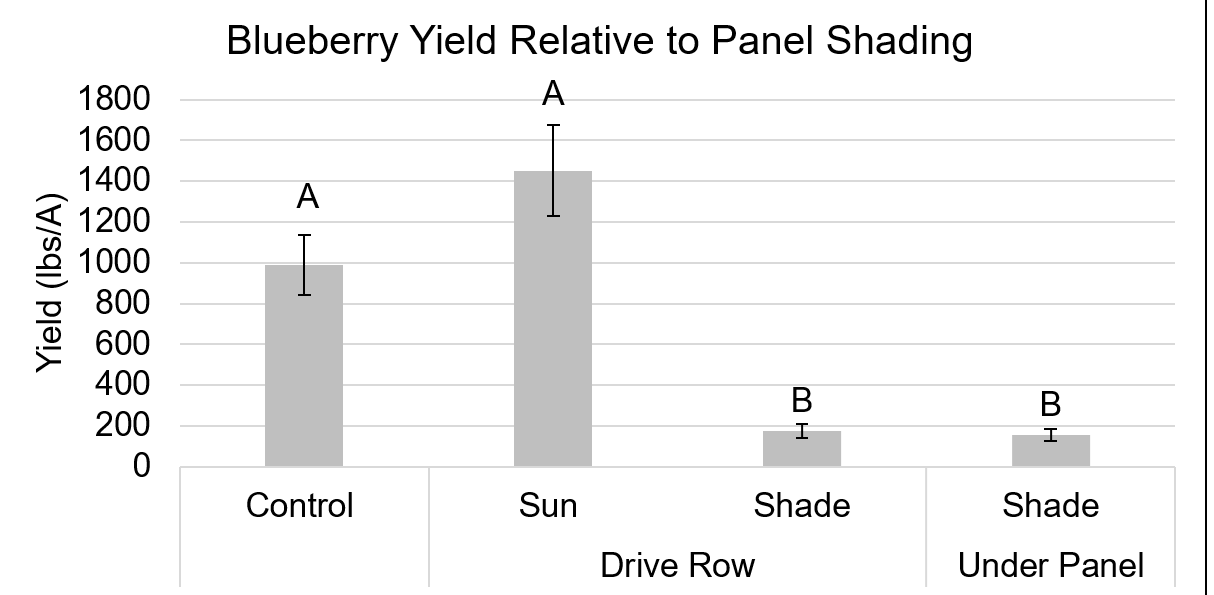
Fruit yield dramatically varied by treatment, with the greatest average yield harvested from the sun drive row treatment (1451 lbs/A), exceeding that harvested in the control (990 lbs/A) by 461 lbs/A (Figure 11). The yields of shade drive row (176 lbs/A), and the shade under panel (156 lbs/A) were significantly lower than that of the control and sun drive row treatments. The shade drive row and shade under panel yields were 87% and 89% less than the higher yielding treatment (sun driver row), respectively. While the higher percentage of green fruit in the shaded treatments suggests these treatments were developmentally behind, the low blueberry yield suggests lack of productivity in general.
When comparing blueberry yield by panel construction, the greatest yields were harvested in the standard-construction monofacial treatment (1112 lbs/A), exceeding that harvested in the control (990 lbs/A), the careful-construction bifacial treatment (686 lbs/A), and the mindful-construction bifacial treatment (528 lbs/A). Treatment differences were not significant. Higher yields were hypothesized to occur under the bifacial panels due to the greater potential for light infiltration, however, the standard construction that occurred under the monofacial panels had a higher level of disturbance which the blueberry may have responded well to.
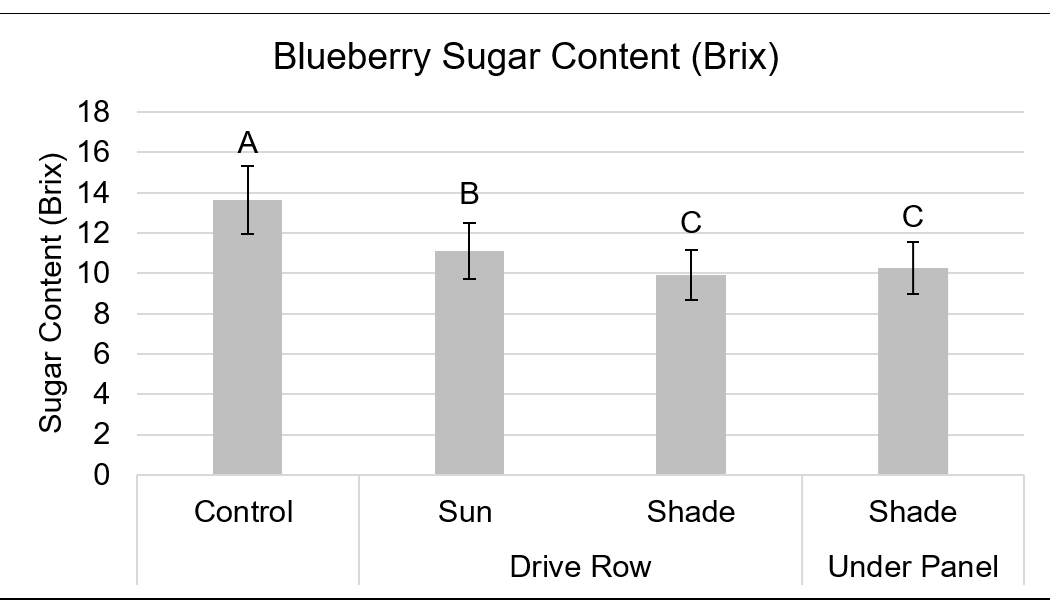
The highest berry sugar content, measured in Brix, was measured in the control (13.6 Brix), compared to the sun drive row (11.1 Brix), shade under panel (10.3 Brix), and shade drive row (9.9 Brix) (Figure 12). This corresponds to the ratios of phenological development, where a higher blue fruit ratio would inherently have higher berry sugar content.
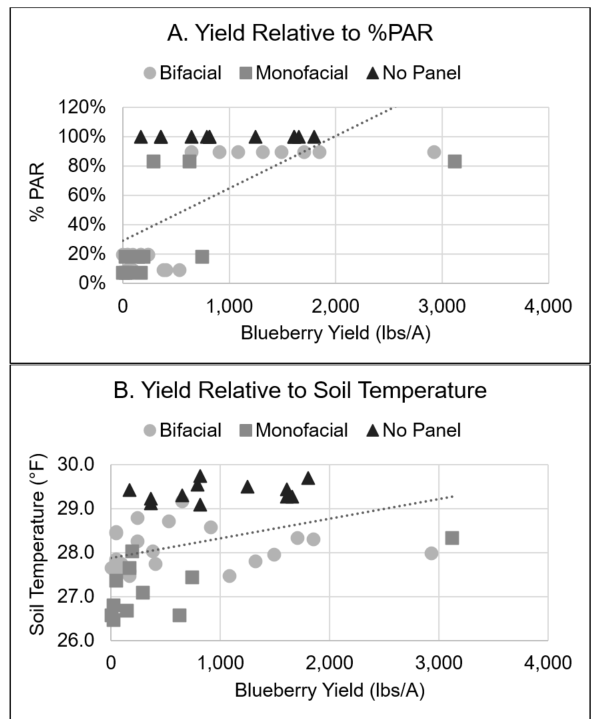
A multivariate analysis evaluating the influence of independent variables (air temperature, relative humidity, PAR, soil moisture, soil temperature and SPAD) on the dependent variable of yield, exhibited a significant relationship for the model (p < 0.0001) with an R2 of 0.56 (1.0 would be a perfect 1:1 relationship). Within the model, PAR had the greatest influence on yield (p < 0.0001; t = 5.89). A series of bivariate regressions provided a more in-depth view of each independent variable relative to yield (tested on an individual basis; Table 2). Here, PAR exhibited the most significant relationship (p < 0.0001; R2 = 0.44), followed by soil temperature (p < 0.0104; R2 = 0.14) and leaf chlorophyll content (SPAD; p < 0.0298; R2= 0.10).
The linear regressions show the degree and the direction of the independent variables which had a significant relationship in the bivariate regressions (Figure 13). These variables included PAR, soil temperature and SPAD relative to yield (across all treatments).
Economic Analysis
The Rockport dual-use wild blueberry site is a leased field managed by an IQF processor grower. We interviewed the farm manager about their crop management costs before and after this particular solar array was installed in 2021. The costs from the 2019 crop year in table 1 below are from the same area that solar now stands. The solar array was built in 2021 (crop year) and was held over for a crop year again in 2022 to get all sections of the field into the same cycle. The grower did not harvest when the solar array was built in 2021 due to construction. In 2022, the grower estimated the cost of harvest was not worth the return from the low yield while the field was still recovering. Weed management was done using herbicide wiping and spot mowing, along with some disease control to prepare the crop for 2024. There were no fertilizer applications, insect management, pollinating costs, or harvest costs in 2023 (Table 1).
DISCUSSION
This particular solar array in Rockport, ME was designed for energy output with farming as a secondary priority. Because of this, the rows between panels and height of panels were only slightly extended from standard array spacing. Our biggest take-home message for landowners considering a solar array is to determine whether the project is primarily for energy production or crop production.
Environmental Conditions (Soil, Air, Sunlight)
This array contains both monofacial and bifacial panels. Higher humidity levels under the bifacial panels during the time of maximum direct sun exposure could be an indication that more moisture from active plant respiration is trapped underneath the panels and this extra moisture is then heated further by the sunlight. This slight greenhouse effect was more pronounced in the 10 AM – 2 PM (maximum direct sun exposure) window under the bifacial panels and was more pronounced under the monofacial panels during the 9 PM – 5 AM (overnight) window. This suggests that there is more of a greenhouse effect on plants under monofacial compared to bifacial panels.
Research on highbush blueberries has identified the minimum threshold for good fruit yield from the plants as being 60% of full sunlight (2,000 PPFD) (Kim et al., 2011), or approximately 1,200 µmol/m⁻²/s⁻¹ PPFD. These highbush blueberries grew under a range of sunlight conditions and there were significant differences in physical plant structure depending on the amount of sunlight received. Shaded plants produced fewer but longer shoots, more and larger leaves, thinner leaves with fewer stomata (which lowers the rate of photosynthesis), leaves with more chlorophyll, fewer flowers and thus fewer fruits. Some shading of the plant can prove beneficial since shade during hours of direct sunlight (10 AM – 2 PM) can improve plants’ photosynthetic efficiency (Lobos et al., 2011), however, continual shade (of high shade intensity, so low sunlight intensity) may fail to produce these same benefits as we saw in Rockport this year.
The most sunlight reached the control since the only shading received there was from passing clouds. Sun drive row saw much more sunlight than the shade drive row and shade under panel rows, as expected. That the sun drive row received less sunlight than the control indicate there is still some shading from panels in sunny parts of the array. This experiment was not designed to approximate the amount of sunlight that was reaching the plants but the results show that the shading present was enough to reduce fruit yield significantly. The percent reduction from the control to shade was 91% and 93% for the bifacial and mono respectively much more than the functional 50% reduction in shade that allowed highbush blueberry to continue productivity (Lobos et al., 2011).
Plant Health
SPAD levels were highest where plants received the least amount of sunlight. Plants produce more chlorophyll in low-light conditions to maximize their potential to produce energy from the limited light. Generally, plants have higher SPAD levels on their lower leaves for this reason, but this trend was only observed in control this year. It is possible that the limited indirect light received by the plants underneath panels did not stimulate plants to produce more chlorophyll in those lower leaves. Perhaps producing more chlorophyll in low-light conditions was too costly for the plants.
Pests
There were significantly more weeds in treatments compared to the control, possibly because treatments were disturbed during construction, so weed seeds from the weed seed bank may have sprouted. Since the controls were situated outside of the area that experienced any construction and disturbance in the past few years, the wild blueberry is better-established and weeds are reduced in those control areas, possibly from chemical weed management techniques which have not yet been applied to areas cultivated within the solar array. The most weeds were measured in the shade drive row. The most insect damage was observed in the control and sun drive row, which are areas that received the most sunlight. Reasons for this need to be explored further, however some insects target healthy plants that were present in sunnier locations.
Phenology & Yield
The control produced the most buds (when measured in May), which correspondingly produced the most pin heads and green fruit a month later. The control then had high rates of blue fruit (76%) and the highest rate of overripe fruit (6%) of all treatments. However, the highest yield was harvested in the sun drive row, which contradicts the expectation that the undisturbed, unshaded control would have the highest yield. Therefore, it is possible the control did not have the highest yield because the fruit in the full sun, undisturbed conditions caused the fruit to overripen and drop from the stem before harvest.
Shade drive row produced the fewest buds in May and thus the fewest pin heads and green fruit a month later; at harvest, the fruit was nearly evenly split between green fruit and blue fruit. The shaded conditions prevented the plants from producing many buds and then delayed fruit development significantly. The final fruit yield was 9% of the fruit harvested in the drive sun row (the greatest yield).
Areas under the panels produced the second most buds and, correspondingly, the second most pinheads and green fruit a month later, but at harvest, nearly all the fruits were green fruit. Despite producing so many buds early in the season, the final fruit yield was so low that it was only 8% of the fruit harvested in the drive sun row (the greatest yield).
Wild blueberry is a plant that thrives best in full sun conditions. Introducing consistent shade over the plants impacted plant development and success in producing fruit. It was clearly observed that full and partial shade delayed plant development and reduced fruit yield to a fraction of the yield collected in full sun. Plants in the shade underneath the panels had fruit ripening profiles inverse to those of the sun drive row: full shade plants were 85% green and 15% blue at harvest but shade drive row was 16% green and 82% blue fruit at harvest. Therefore, the amount of sunlight received by plants in partial shade is more likely to result in ripe fruit at harvest than in full shade conditions.
The most fruit was harvested within standard monofacial areas and the control, far exceeding the yield in the careful and mindful bifacial areas. Though the bifacial panels, by design, allow more sunlight to penetrate the panels, the bifacial panels are situated on a steeper slope than monofacial panels. The inconsistent slope of the ground beneath the panels confounds the results and makes it impossible to clearly understand why yields varied by panel type.
Fruit Quality
Brix levels were significantly higher in the control compared to treatments, likely because the control plots contained more overripe fruit. As fruit ripens, sugar content within the fruit increases, and as the control was the only treatment to observe overripe fruit, the Brix levels from the sampled fruit were higher. The other treatments had more green fruit (low Brix level) and no overripe (high Brix level) fruit. As most wild blueberry growers harvest entire fields simultaneously, rather than harvesting one plant at a time during peak ripeness, the variability in fruit ripeness and corresponding Brix levels is important for growers regardless of the form in which berries are sold.
2024 Shade Experiment
PAR Results
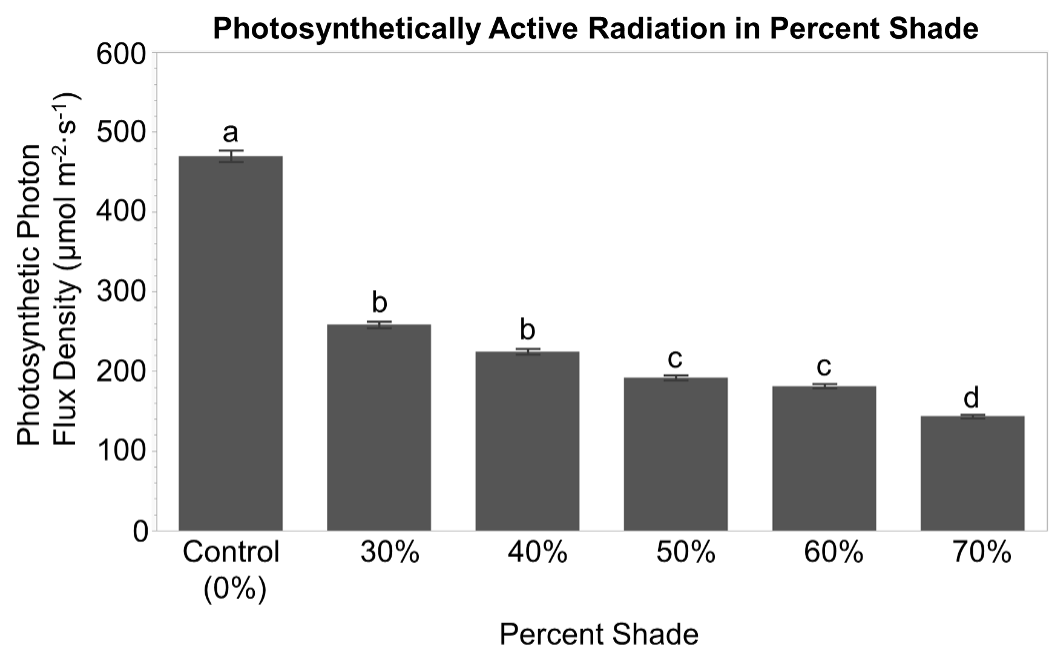
As expected, the no shade control had the greatest photosynthetic activity compared to the other treatments, comparisons are shown in (Figure 1). There were no significant differences detected between the 30 and 40% shade cloth, as well as the 50 and 60% shade cloth (Figure 14).
Plant Canopy
There were no significant stem density differences detected between treatments (data not shown). The overall mean of all treatments was (mean 58.932 ± 1.451 SE stems ft-2). Stem height was significantly greater at the blue fruit stage (mean 7.325 ± 0.089 SE inches) when compared to the T2 bud stage (mean 7.043 ± 0.077 SE inches) (P = 0.010) (data not shown). However, no treatment effects were detected between treatments for stem height (data not shown). When separating the growth stages, at the T2 bud stage, the stems in 70% shade were significantly taller (mean 7.562 ± 0.221 SE inches) than the stems in the 50% shade (mean 6.740 ± 0.159 SE inches) (P = 0.029) (data not shown). During the blue fruit growth stage, stems in 70% shade were significantly taller (mean 7.834 ± 0.242 SE inches) than the stems in the 40% shade (mean 6.940 ± 0.184 SE inches) (P = 0.035) (data not shown).
Leaf length and width were measured to detect any physiological changes in the covered stems. Leaf length was significantly greater in the 50% shade treatment (mean 1.014 ± 0.023 SE inches) when compared to the no shade control (mean 0.854 ± 0.017 SE inches) (P = 0.017) (Figure 2). Leaf width was significantly wider in the 50% shade treatment (mean 0.403 ± 0.012 SE inches) when compared to the no shade control (mean 0.318 ± 0.009 SE inches) (P = 0.023) (Figure 15).
There were no significant SPAD effects detected between treatments with a grand mean of (mean 31.667 ± 0.280 SE chlorophyll content (nm)) (data not shown).
Phenology
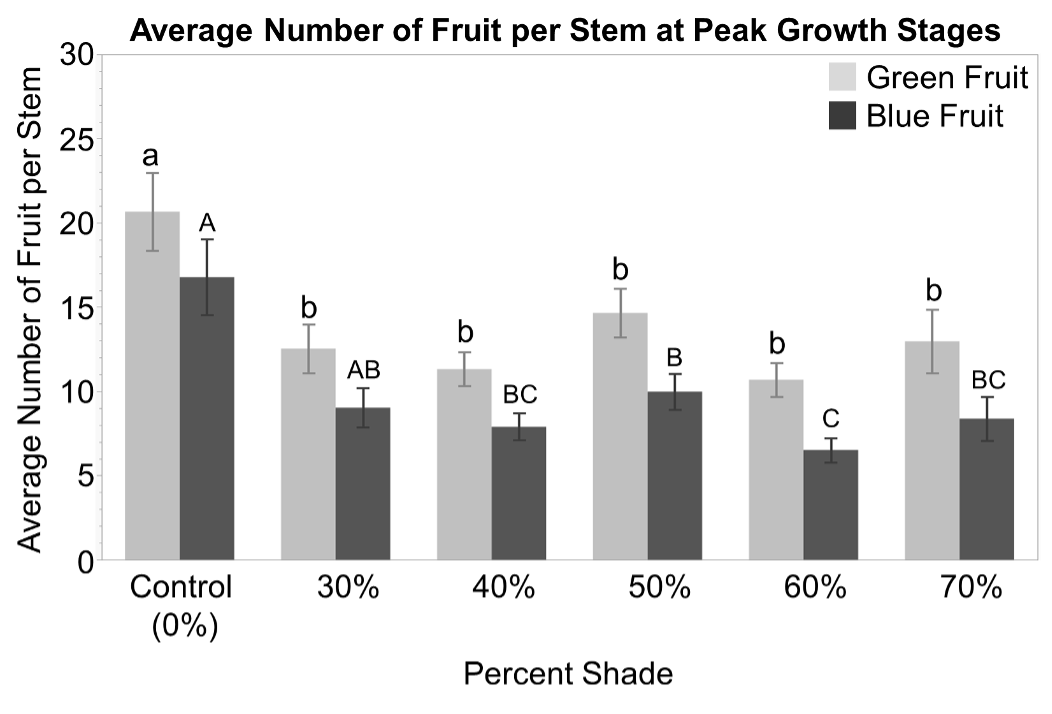
The number of fruit was documented at peak green and blue fruit stages. Stems had significantly greater green fruit per stem in the no shade control (mean 21.373 ± 2.329 SE green fruit per stem), during the green fruit stage, when compared to all the other treatments (P < 0.001) (Figure 3). During the blue fruit stage, stems had significantly more blue fruit in the control (mean 13.368 ± 1.531 SE blue fruit per stem) when compared to other treatments (Figure 16).
Harvested Yield and Berry Quality
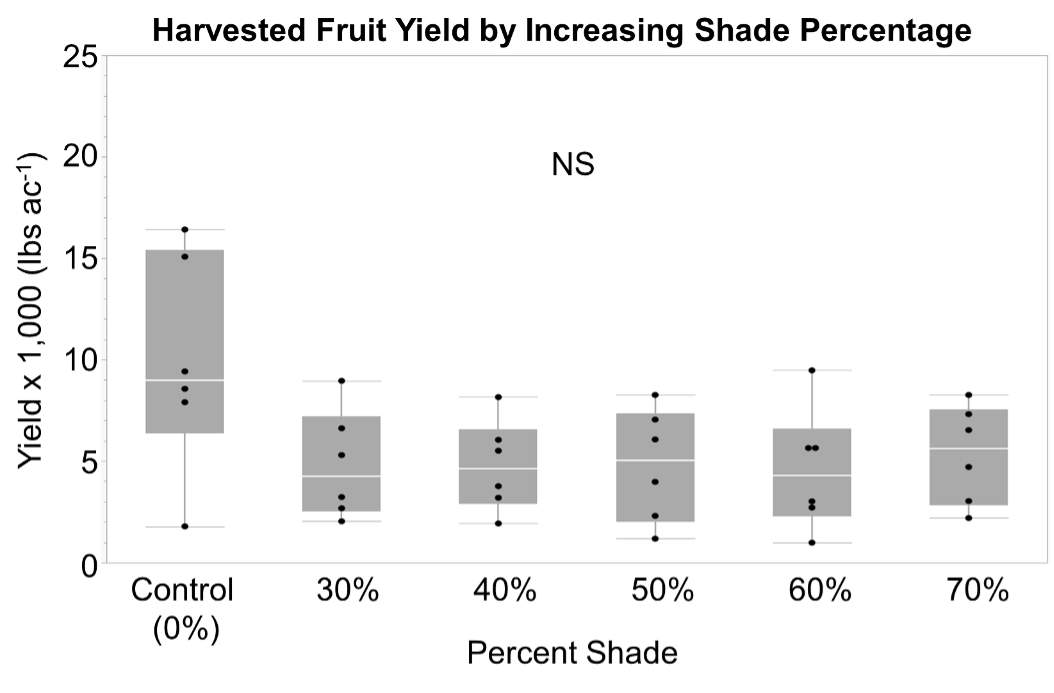
There were no significant differences detected between treatments on yield when using the ANOVA (α ≤ 0.05) (Figure 17). However, the Dunnett’s test which compared each treatment to the unshaded control showed that every treatment produced significantly less yield than the control, but there were no significant differences detected between the control and 70% shade. There were no significant fruit sweetness (brix) differences detected between treatments (data not shown).
- Wild blueberry plants recovered well from all solar installation treatments.
- When considering a solar array, decide if it the main goal is to produce food or energy.
- Wild blueberry is not currently a profitable crop to manage in a dual-use system. If you insist on managing the crop underneath, plan to manage for weeds, insects, and diseases underneath the panels. Plan for harvest changes under panels and between panel rows.
- Wild blueberries that were in full sun compared to those shaded by 30-70% shade showed a trend towards higher yield. Shaded plants had significantly larger leaf size.
- Future experiments on wild blueberry using shade cloth should account for pollinator exclusion due to shade cloth.
Education & outreach activities and participation summary
Educational activities:
Participation summary:
Agrivoltaics Knowledge Sharing Session:
On November 14, 2023 we convened a group of major players in the Northeast dual-use agriculture sphere for a knowledge sharing session. Participants included those from UMaine Extension, UMass Extension, State of Maine Department of Agriculture, Conservation, and Forestry (DACF), State of Massachusetts Department of Agricultural Resources (MDAR), Maine Governor’s Energy Office (GOE), Maine Farmland Trust, American Farmland Trust, ReVision Energy, and BlueWave Solar. A summary of relevant information that we learned can be found in the Results section of the 2023 Research report linked above. 14 people attended this hybrid vent held in Augusta, ME.
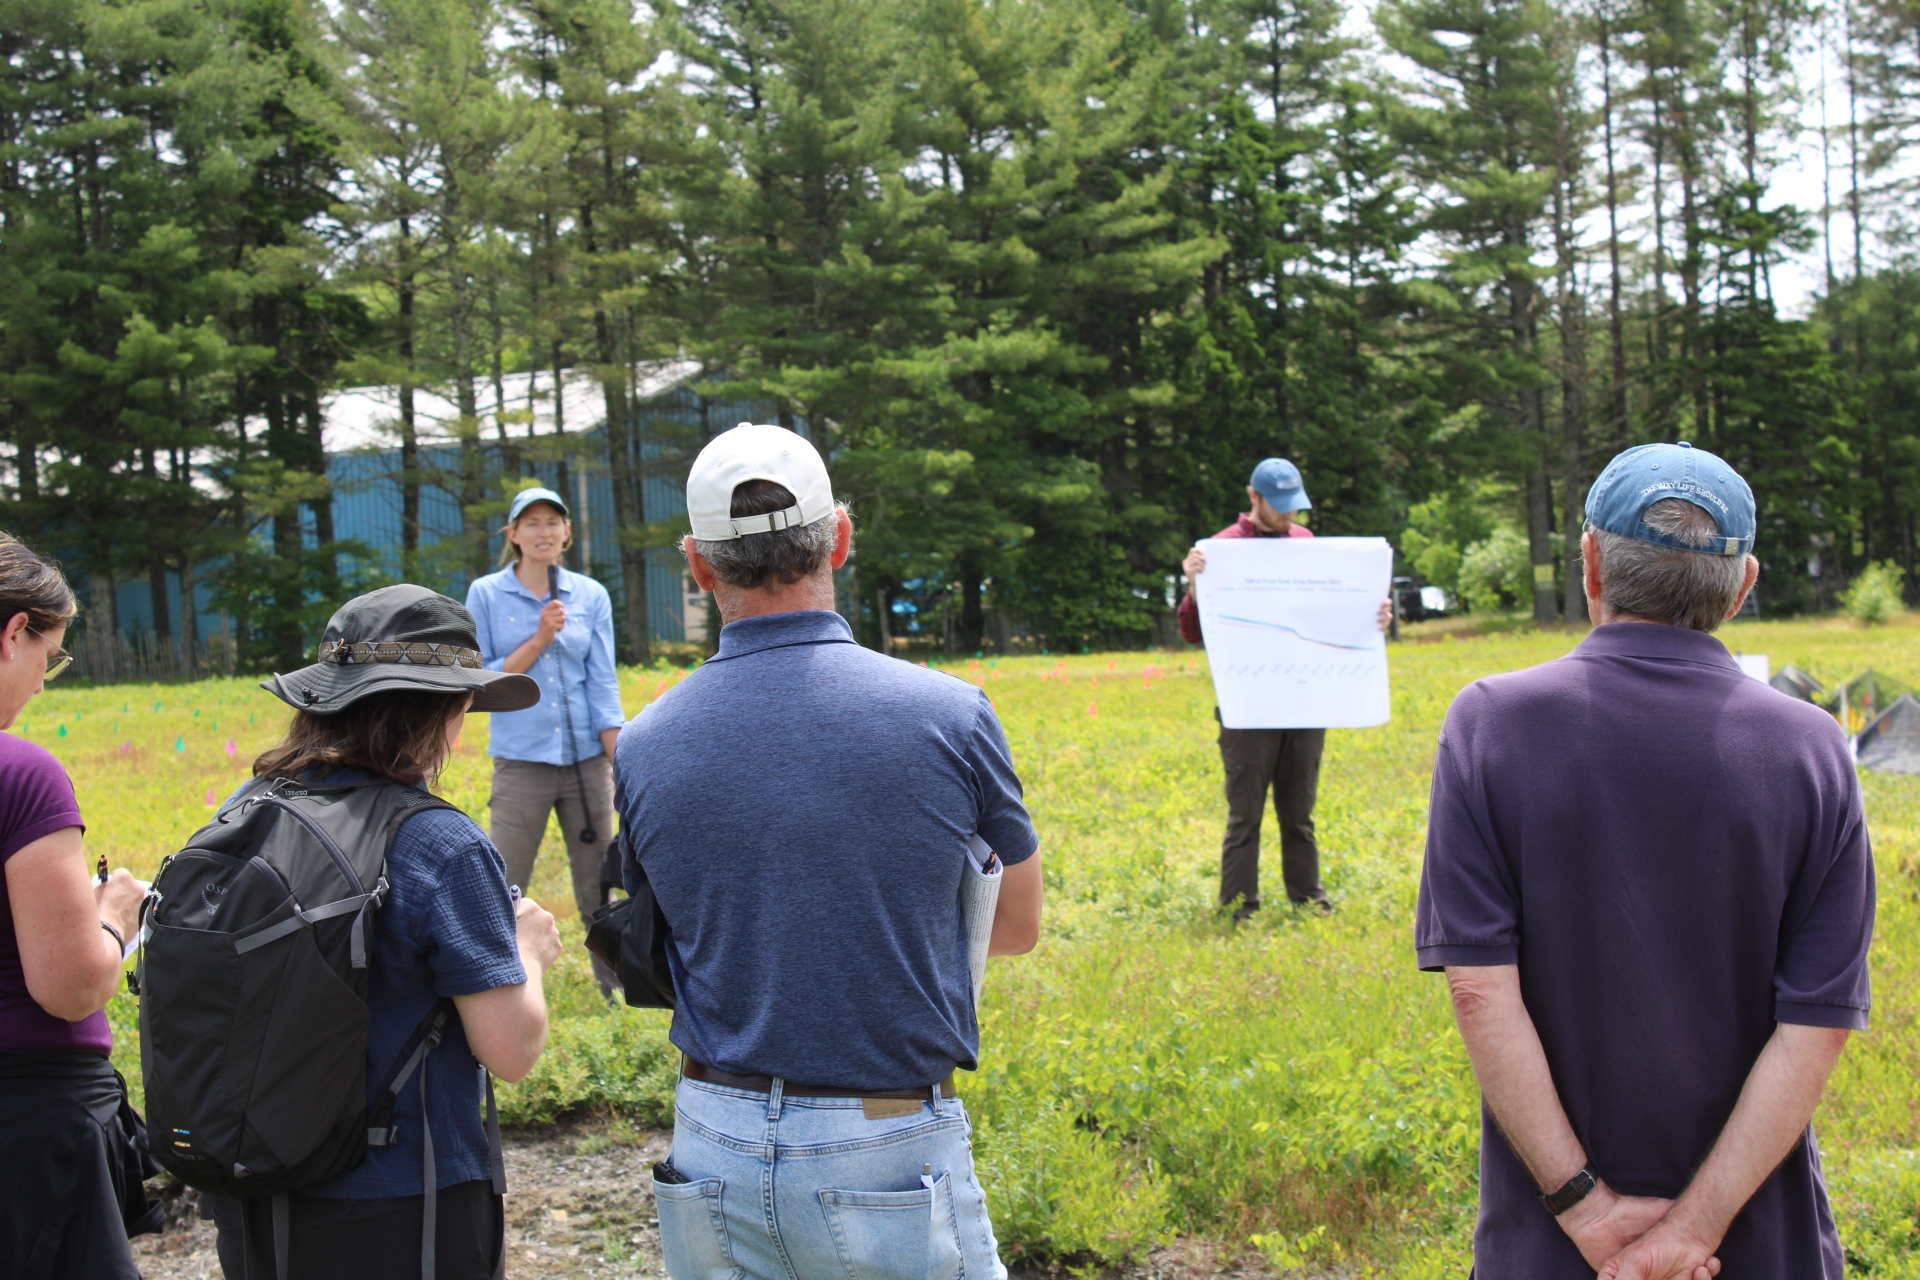
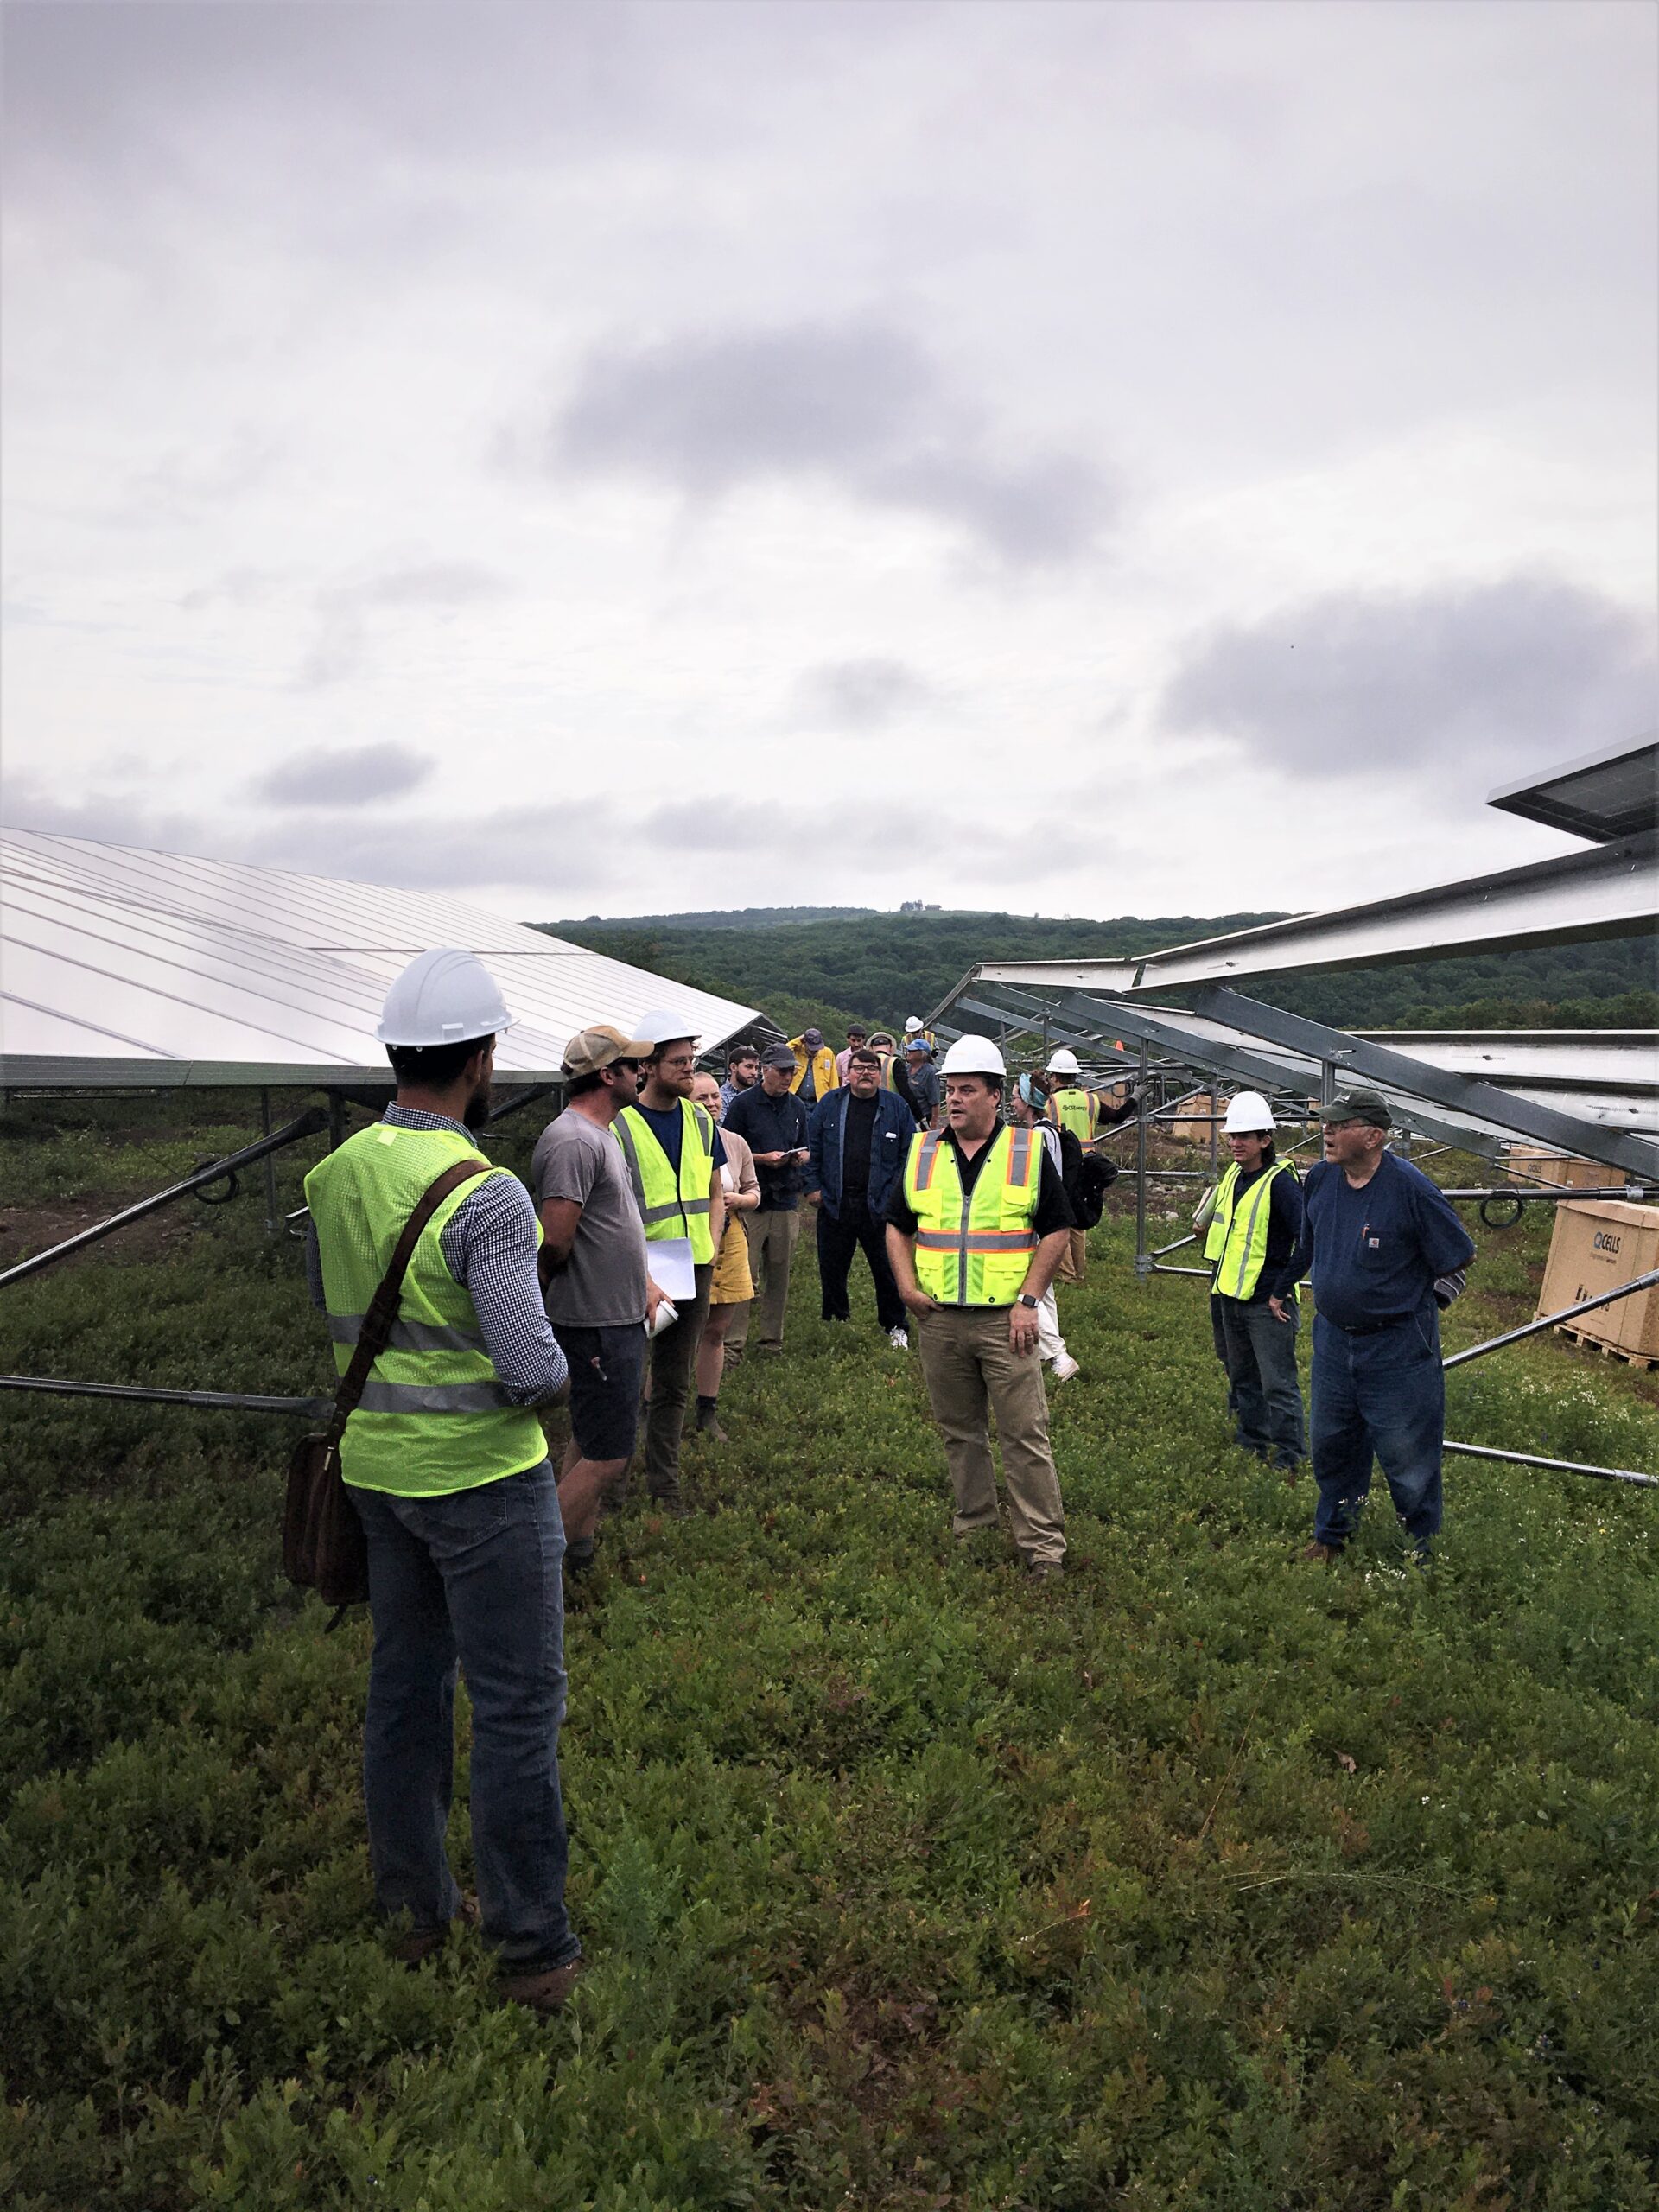
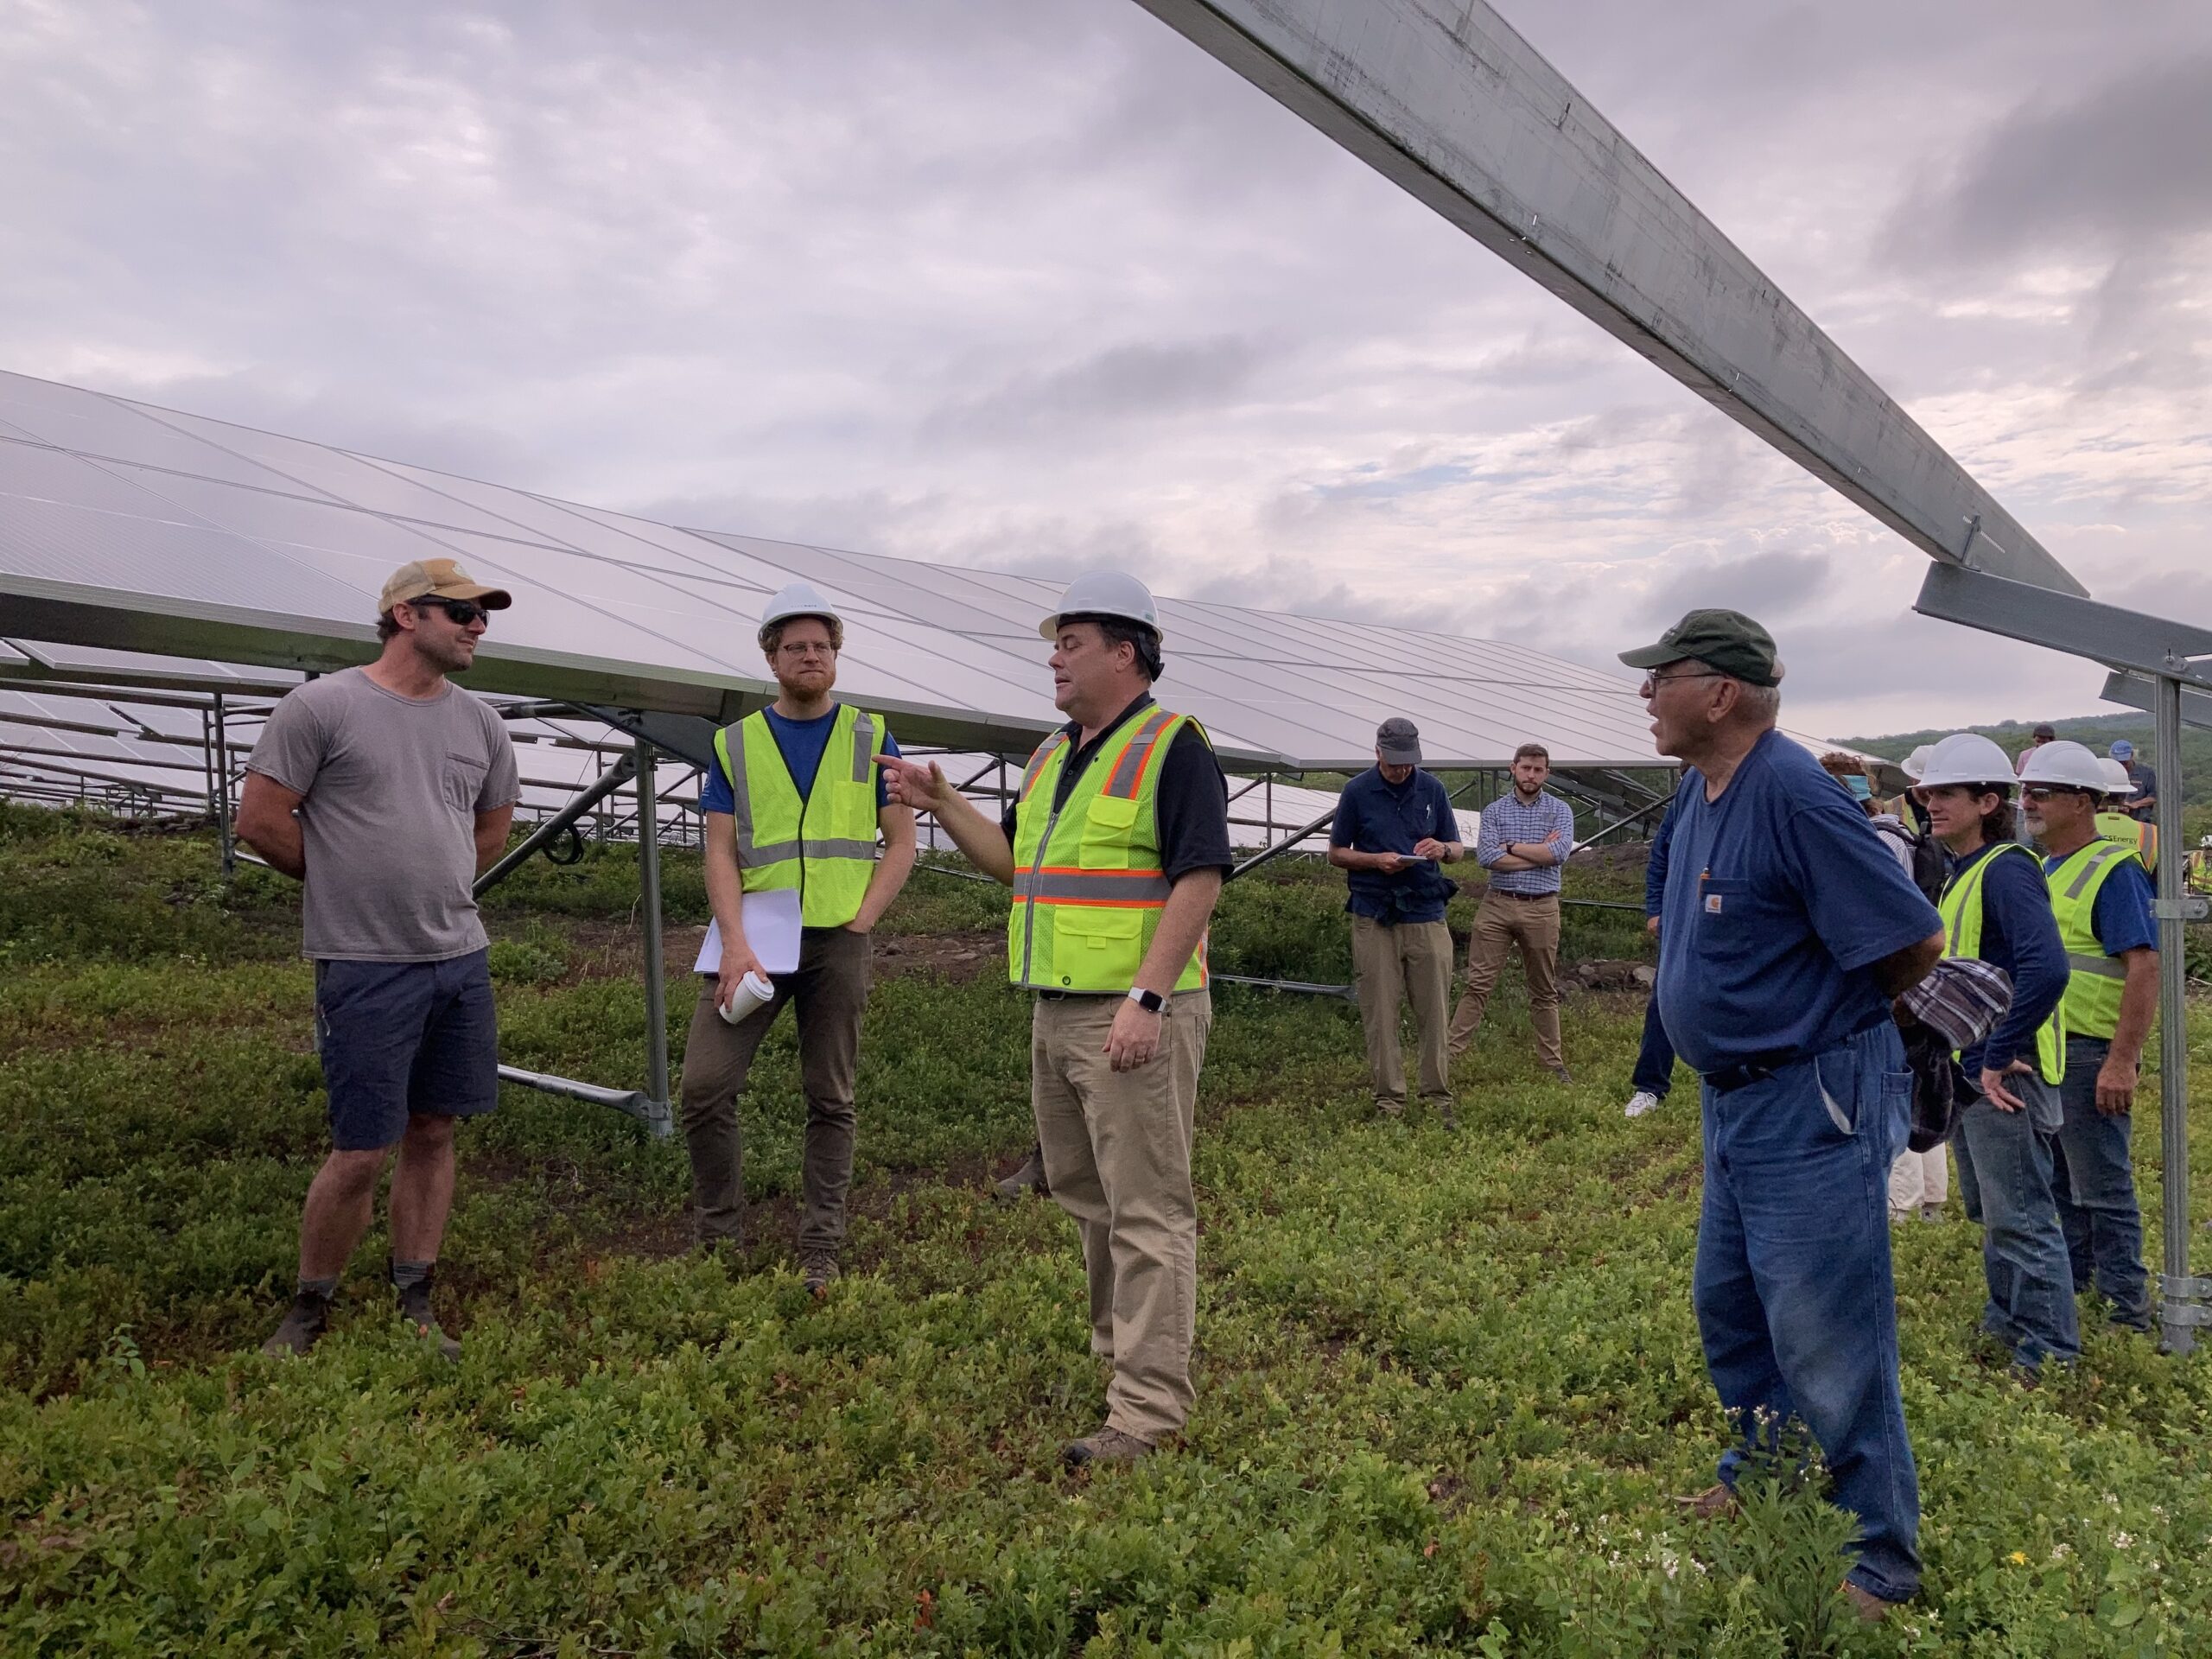
Field Days: Getting the research project off the ground in collaboration with Paul Sweetland, the host farmer, was our focus in year one. In 2022 we held In 2023, we hosted a dual-use solar field day in Rockport at the research site on June 7 which was attended by 17 farmers.
In the News: This project was highlighted in 4 written articles and 1 Scientific American podcast.
- Maine Farmer Pairs Solar Panels with Wild Blueberries. Will It Bear Fruit? in Energy News Network (9/1/2022)
- Dual-Use Solar in Maine (print only), Maine Farms a Production of Maine Farmland Trust (Fall 2022)
- This Maine Farm is Harvesting the Sun's Power While it Picks Blueberries podcast of Scientific American (2/22/2022)
- Can Agriculture and Solar Farming Coexist? (print only), Maine Organic Farmer and Gardener Magazine (Spring 2022)
- Local Solar Farm Will Produce Energy, Blueberries, in Knox County Village Soup (11/12/2021)
Webpage: The Dual-use Solar webpage was created on the UMaine Extension Website. In creating this page, we have connected with Maine Farmland Trust and American Farmland Trust about their work on dual-use solar and plan on including them more as this project progresses.
Factsheet: Considerations for Solar on Wild Blueberry Land in Maine
Grower Report: The 2023 and 2024 Wild Blueberry Dual-use Solar Grower Reports were compiled and was distributed to 130 farmers and 25 interested ag service providers over the two years. 2023 Wild Blueberry Dual-Use Solar Report and the 2024 report is attached here as a PDF because website changes are underway.
The 2022 Wild Blueberry Dual-use Solar Grower Report compiled and distributed to 70 interested farmers and 30 interested ag service providers. UMaine Dual-Use Solar Report 2022_Calderwood
Conference:
The 2023 UMaine Wild Blueberry Conference occurred on Feb 25, 2023 and to which 40 farmers and 3 ag service providers attended. An expert from BlueWave solar answered technical questions about arrays, Paul Sweatband discussed the project from his farming perspective, and Dr. Calderwood discussed research results.
Learning Outcomes
At the 2023 Wild Blueberry Conference 13 of 39 participants indicated that they gained knowledge on agrivoltaics according to the conference survey.
14 of 14 (100%) of legislative staff and ag service providers indicated gaining knowledge from the Agrivoltaics Knowledge Sharing Session in November 2023 according to direct feedback.
Farmers gained knowledge of the current lack of profitability in a dual-use solar array over wild blueberry. Therefore there won't be any adoption of this practice right now. This is due to decreased yield and increased field management costs. However, farmers and ag service providers learned a great deal about agrivoltaics in policy and research from the November 2023 Agrivoltaics Knowledge Sharing Session, highlighted in the 2023 research report. Solar companies in Maine have trouble investing in projects because of the outdated infrastructure in rural parts of the state.
From the UMaine Extension organized knowledge sharing meeting held on November 14, 2023, we learned from the States of Maine and Massachusetts. The State of Massachusetts MDAR receives applications for dual-use solar projects and approves them through a six-step process. UMass Clean Energy Extension receives dual-use project proposals and provides a Pre-Determination of the project based on their agronomic and energy expertise with suggestions for a successful project. There have been 35 dual-use solar projects on 435 acres approved by MDAR on commercial cranberry, mixed vegetable, hay, and livestock farms since 2018. In Massachusetts, developers must use a Shading Analysis Tool to ensure that the maximum reduction in sunlight due to shading from panels on any square foot of land does not exceed 50% during the growing season (Clean Energy Extension, 2022). This tool was created by the Solar Massachusetts Renewable Target (SMART) program, the Massachusetts Department of Energy and Resources (DOER) and BlueWave Solar for Massachusetts at their longitude and latitude and is therefore not entirely transferrable to Maine sites. The user can input solar panel dimensions, number of rows, the tilt of panels, region in the state, and the output generates a sun or shade map of the area and design. The University of Massachusetts Amherst uses this for research and education while solar developers use it to evaluate potential sites. A webinar on the Shading Analysis Tool can be found on the BlueWave Solar website. Challenges to the Massachusetts dual-use project approval process are that it takes longer to get a project approved, more research is needed, and it is hard to optimize both the crop and energy.
Dual-use arrays with commercial crops below are possible with solar companies that are learning how to work with farmers to address their needs with modified spacing and panels such as elevated single-axis tracking panels. Research is underway in Massachusetts in a collaboration between UMass and American Farmland Trust to explore broccoli, squash, lettuce, and hay production in a dual-use solar array with 28ft wide rows. As of 2018, the State of Massachusetts has had an incentive program for dual-use solar. Rate payers (residents receiving energy from the grid) pay $0.06 cents per kW/h to solar developers for dual-use solar projects.
The challenge with establishing dual-use projects that work in Maine is that our power grid infrastructure is outdated. Three phase power is required at the road to install a solar array. Until our grid has been updated companies like BlueWave that have worked with farmers to design innovative dual-use projects will not be able to do so. In 2022, with the passing of LD 1881, the state of Maine DACF requires a compensation fee to be paid if solar is sited on prime agricultural soils. This fee can be waived if an equivalent square foot area of land is put into conservation. The Department is currently developing definitions of “prime agricultural soils” and “dual-use solar” which aim to protect the environment and Maine’s farmland. They are hiring someone to manage a new permitting scheme. Before agreeing to any contracts with solar companies, land owners need to contact their municipal assessor to investigate what types of tax consequences will be put in place with the addition of solar if their land is considered “high value farmland” (LD 1881). The U.S. Department of Energy Technologies Office (SETO) is researching agricultural benefits and setbacks to agrivoltaics that are added to farm operations (DOE, n.d.).
Project Outcomes
We continue to have a working relationship with BlueWave Solar. On April 28, 2025 Dr. Calderwood met with BlueWave about a dual-use solar array going in over a wild blueberry field in Massachusetts. Dr. Calderwood was able to give them information about equipment, shading, pest concerns, and general information about wild blueberry production from the knowledge gained through this project. Because of the over shading at the Rockport site that we documented through this project, BlueWave has increased the space between panel rows from 8ft to 25ft which will provide much more sunlight for the blueberry crop. I would consider this a success of the project.
In any future shading studies it is important to allow more space for pollinators to enter under shade cloth. Our shade cloth was too low to the crop and reduced the number of bees that could pollinate our plots.