Progress report for LNE25-483
Project Information
The 46,370 acres of commercial wild (lowbush) blueberries in Maine grow on a two year production cycle, in acidic soil conditions and contain more plant genetic variability than the highbush blueberry production system. Fresh and frozen market destinations have different quality standards and therefore farmers use different harvest methods depending on the destination of the fruit. This project proposes to educate producers on existing nutrient knowledge within this unique production system and that wild blueberry plants themselves could be grown specifically for each market avenue. Wild blueberry stem height and fruit load are the first plant factors that could be adjusted using different rates of nitrogen and potassium when applied granularly. As the fresh packed sector of the wild blueberry industry grows, calcium may be a critical nutrient for fresh fruit quality on a crop that has not been bred for storability. This project builds upon an organic nutrient and weed management project that was funded by SARE from 2019-2022 (Project # LNE19-374), a one year calcium study funded by a Specialty Crop Block grant, and leverages a one year Wild Blueberry Commission funded project to begin this work in 2024. Since the first SARE project, there has been a push from fertilizer company representatives and some Maine wild blueberry growers to use foliar fertilizers as the main source of nitrogen, which the scientific community does not support. Farmers are now demanding a longer term, more complete study of conventional fertilizer applied at different rates to help them make scientifically informed fertilizer decisions. The two main objectives of this project are to 1) create improved nutrient management outreach materials and deliver that research-based knowledge to all wild blueberry farmers regardless of size, management practices, race, or gender, and 2) fine-tune through applied research the N, K, and Ca fertilizer necessary to produce high quality berries for fresh and frozen end markets.
Ten farms who manage a total of 20,000 acres adopt more precise granular fertilizer applications on a field by field basis, resulting in 500 lbs/acre ($285/acre) of fruit gained or $40/acre savings from fertilizer costs.
Wild blueberry fields could be grown using management practices specific to each market avenue: fresh or frozen. Harvesting method is another major factor that determines final wild blueberry yield and quality. While the Maine Technology Institute harvester efficiency project currently aims to improve harvester efficiency, our efforts to reduce yield loss during harvest must not only be mechanical but also agronomic. This begins with nutrient management to grow stems appropriate for each end use (Srivastava & Malhotra, 2017).
Wild blueberry stem height, stem density, bud number and size, and fruit load are the above ground plant factors that could be adjusted using different rates of nitrogen. Nitrogen has been found to increase stem height by 0.6 in (1.5 cm) on average when applied during the prune year along with added weed control (Penney & Mcrae, 2000). Fertilizing every prune year in Maine significantly increased stem heights when compared to unfertilized plots, but no differences were detected between fertilizer treatments when using 17-17-17, 18-46-0, and 13-26-5 (Eaton et al., 2009b). They also observed greater fruit yields with the plots that were fertilized every prune year (Eaton et al., 2009b). In 2010, LaFond conducted a study in the sandy wild blueberry soils of the Lac Saint Jean region of Quebec where rates of ammonium sulfate were applied at pre-emergence as split applications between the prune and crop years. They found maximum yields at 53 lbs N/acre and that similar yields occurred when N was applied only in prune years compared to a split application between prune and crop years. In 2016, Maqbool et al. conducted a study in Kemptown, Nova Scotia that compared rates of N, P, and K. This ammonium sulfate was applied at shoot emergence of the prune year, a little later than the 2010 study. This study found maximum yields at 31 lbs N/acre in soils with more clay than Maine and Quebec.
The majority of fertilizer applications on farms and in research studies are made at pre-emergence of the prune year (Eaton et al., 2009b; Penney & Mcrae, 2000; Saleem et al., 2014). However, some research has been conducted on when to apply a fertilizer. Percival et al. (2002) tested applying fertilizer during emergence as well as before bloom and prior to leaf drop or dormancy. They found that applying fertilizer at multiple times may be worthwhile for benefiting growth, development, and yield in the preliminary study (Percival et al., 2002). UMaine student, Abby Cadorette completed her thesis in 2024 on crop year applications of ammonium sulfate (Cadorette, 2024). She found no significant differences in the amount of N in leaves or fruit, yet there was a trend toward more N in leaves where ammonium sulfate was applied at the pinhead stage. There were no significant differences in yield. Vegetative growth was measured, indicating that mean branch length was significantly longer when N was applied at pre-bloom, but branch length above the fruit cluster was not significant. According to the research conducted to date, prune year N applications are most appropriate. The study herein explores rates of ammonium sulfate applied at pre-emergence and shoot elongation during the prune year.
Blueberries prefer nitrogen in the form of ammonium. Ammonium sulfate (21-0-0 +24% sulfur), diammonium phosphate (DAP) (18-46-0), or monoammonium phosphate (11-52-0) are fertilizers used in acidic soils (Vance et al., 2017). In the 1960s and 70s, Moody Trevett (1970) studied granular nitrogen applied as ammonium sulfate and then DAP on Maine wild blueberry, concluding that applying 200 lbs. of material (42 lbs. N/acre) in the spring of the prune year was best for the crop. This is still the basis for our bulk fertilizer applications for conventional wild blueberry growers. Today, producers take foliar samples to determine nitrogen, phosphorous, and potassium needs. The longer growing season and warmer temperatures that our native wild blueberry plants experience now requires more energy (more fertilizer) to continue to produce at consistent levels that the market demands and farmers rely on. Additionally, today’s yield expectations of this crop are higher than they were in the 1970s and 80s when the baseline N-P-K nutrient recommendations were set. This project aims to add to this research and identify the ideal amount and timing of nitrogen that needs to be applied during the prune year for high quality fresh and frozen fruit.
Calcium is a nutrient that is the building block of plant cell walls, making it a critical micronutrient. Applying calcium to plants through sprays has been observed to increase fruit quality in highbush blueberries, apples, tomatoes, and lychee, though some of the deficiencies corrected were not related to fruit firmness (Arrington & DeVetter, 2017; Agrinova et al., n.d.; Yang et al., 2019). Research by the highbush blueberry industry has studied calcium application timing and frequency (bloom through post-harvest), application method (foliar sprays on leaves and/or fruit, ground application, soaking harvested fruit), and product formulations (including high or low levels of nitrogen) (Ochmian & Kozos, 2014; Lobos et al., 2020). The varied results do not uniformly show that increased calcium rates improve fruit firmness, improve fruit quality as indicated by color or resistance to squishing, or reduce fruit drop after fruit set. Instead, the range of results suggests that local climatic conditions, specific highbush cultivar, and timing of calcium applications may be the greater influences on fruit quality (Yang et al., 2019).
In highbush blueberry, soil application of calcium increased soil pH and calcium levels in soil, yet the same calcium increases were not observed in leaves or fruit (Hanson & Berkheimer, 2004). This is because calcium moves from the roots to aboveground plant parts through the xylem, and this movement depends on transpiration (water leaving the plant through stomata). The greater the transpiration, the more calcium (and other nutrients) will move into the leaves and plants. Calcium transport into fruit is lower than in leaves (Gerbrandt et al., 2019).
Research into the effectiveness of foliar calcium sprays shows higher calcium levels in leaves and fruit compared to no treatment or ground treatment. In an experiment with the highbush blueberry cultivar “Liberty”, Lobos et al. (2020) sprayed low and high rates (0.36 lb./A and 0.71 lb./A, respectively) of calcium solutions (16% calcium) at or after fruit set (“early” treatment applied at 0, 8, and 16 days after fruit set, “late” treatment applied at 16, 24, and 32 days after fruit set), in two consecutive seasons. Results from this study showed that untreated plants produced the softest fruit, and plants treated early with both high and low rates produced the firmest fruit. Younger fruit has a thinner cuticle, which likely allows for increased calcium product absorption through stomata (Ochmian, 2012). As fruit ripens, the stomatal conductance of berries decreases rapidly (Yang et al., 2019). Given this, targeted applications of calcium-rich products earlier in the fruit’s development will be absorbed more effectively by the fruit and will therefore improve fruit firmness.
Wild blueberry plants and fruit differ substantially from their highbush counterparts. Still, general conclusions about the benefits of calcium application timing and quantity can reasonably be expected to apply to lowbush. Both frozen and fresh wild blueberry producers are interested in using calcium to improve fruit quality.
A 2022 study, also conducted at Blueberry Hill Farm, evaluated three foliar application formulations of calcium products (Biomin, Poma, and Ele-Max) on wild blueberry at the F5 and green fruit stages to improve fruit firmness and retention. The results indicated that these calcium sprays had no significant impact on plant physiology or morphology, as leaf size and chlorophyll levels remained similar to those of the control group, whereas the application of Biomin, a certified organic product, resulted in significantly firmer fruit compared to the other products. However, the late harvest date (August 10th) and the absence of irrigation in this study area may have contributed to the low yields observed. Today, various calcium products are available, and improving fresh-pack quality remains an important issue for growers.
Cooperators
- (Educator and Researcher)
- (Educator and Researcher)
Research
- How much granular N is required to grow a 6 inch tall wild blueberry stem with no branches for fresh pack wild blueberry sales?
2. How much N is required to grow an 8 inch tall wild blueberry stem with branches for frozen wild blueberry sales?
3. Can foliar calcium improve wild blueberry fruit firmness for fresh and frozen sales?
Hypotheses:
- How much granular N is required to grow a 6 inch tall wild blueberry stem with no branches for fresh pack wild blueberry sales?
2. How much N is required to grow an 8 inch tall wild blueberry stem with branches for frozen wild blueberry sales?
This study was established in 2024 and is replicated in two locations, Hope (fresh pack site) and Cherryfield (frozen site). At both locations, the experimental design was a randomized block design with 11 treatments, 6 replications, and 6 ft wide x 30 ft long plots with 3 ft buffers between plots and blocks. The Hope site was setup up on a slight hill in the Mid-Coast region of Maine (44°15'53.4"N, 69°13'47.3"W) and the second site was setup on a flat piece of land in Cherryfield in the Downeast region of Maine (44°40'13.6"N, 67°52'26.0"W). The Hope site consisted of a Peru fine sandy loam and Marlow fine sandy loam, very stony soil types and the Cherryfield site consisted of a Colton gravelly sandy loam (USDA/NRCS, 2019). Both locations had irrigation systems and were able to keep the crop watered with 1 in of water per week when precipitation was not adequate.
Treatments
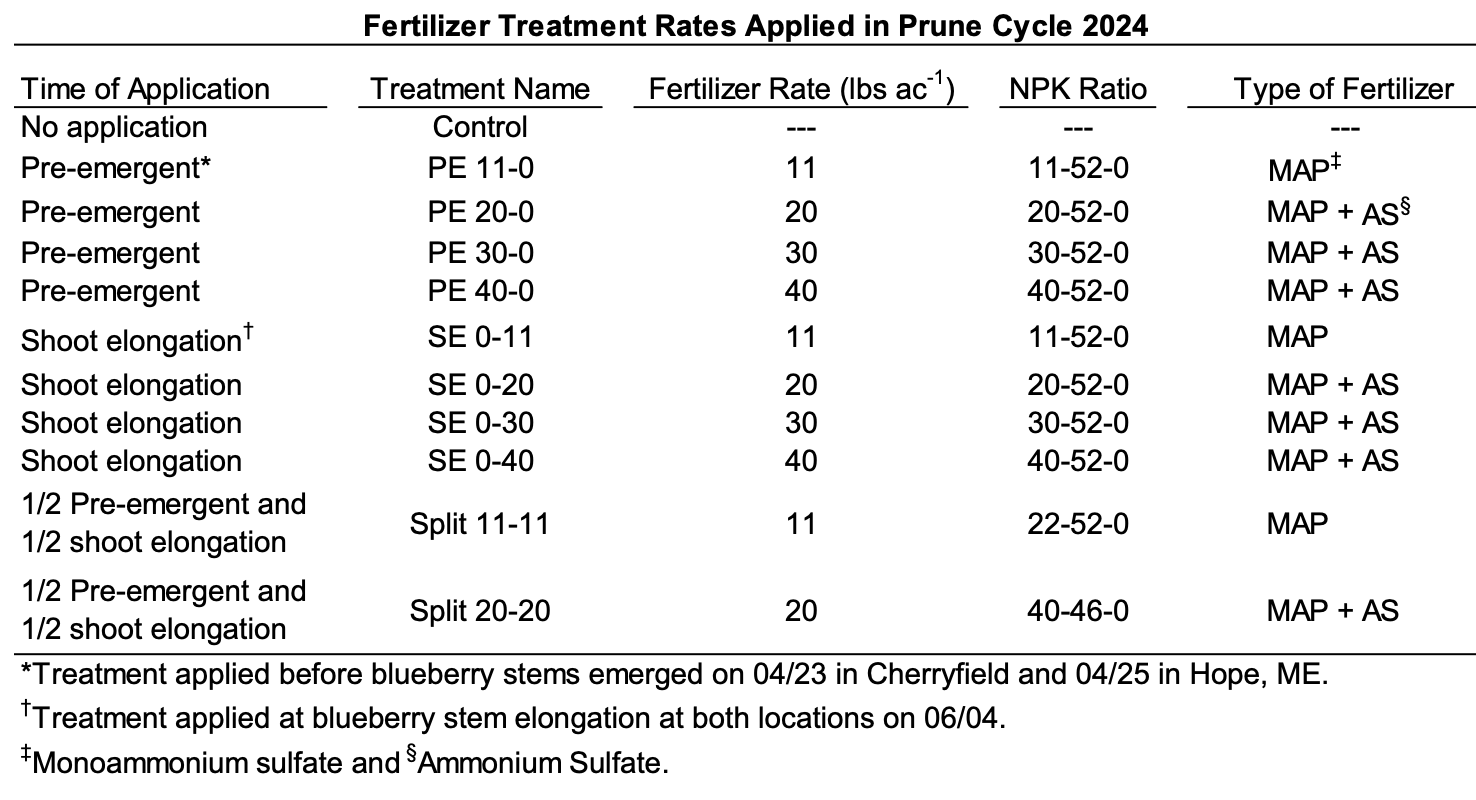
The treatments tested in the study are listed in (Table 1). We applied a baseline fertilizer of MAP (11-52-0) to all plots. We chose MAP instead of DAP because we wanted to test a low N rate as close to 10lbs acre-1 as possible. The treatments were the amount of ammonium sulfate added in addition to the MAP. All fertilizers used were sourced from (The Agromart Group, Thorndale, Ontario, Canada). The mixtures for treatments were weighed and combined in a laboratory before application. Fertilizer treatments were uniformly spread (broadcast) over the plots by hand.
Methods Including Data Collection and Analysis
For 2025 data collection, 10 stems were tagged with numbered metal tags along a transect equally spaced down the 30 ft length of each plot. Then, two 3.98 ft2 quadrats were flagged on each end of the plot. Each tagged stem was measured for height on July 15th in Hope and on July 16th in Cherryfield.
Foliar samples were collected two times in each location. In Hope, samples were taken on 6/18/25 and 07/15/25, while in Cherryfield, samples were taken on 06/17/25 and 07/18/25. Leaves were collected from the middle part of the stem to avoid collecting the oldest or newest leaves. This was done within the plot, but outside of the quadrat areas and not collected off of tagged stems. Once about 30 g of leaves were collected, they were taken to an oven to dry at 60°C until dry weights did not fluctuate. The samples were then finely ground and submitted for nutrient analysis to the UMaine Analytical Lab and Soil Testing Service. The nutrients tested were nitrogen, phosphorous, potassium, calcium, magnesium, aluminum, boron, iron, manganese, and zinc.
Pest evaluations of weeds, insects, and diseases were collected in Hope on 06/11/25 and in Cherryfield on 06/17/25. The two 3.98 ft2 (1.99 ft x 1.99 ft or 0.37 m2) quadrats per plot were evaluated by identifying every weed species within the area and counting the density. The surface area that the weeds occupied was ranked from 0 to 5 by, 0 = 0%, 1 = 1-20%, 2 = 20-40%, 3 = 40-60%, 4 = 60-80%, and 5 = 80-100%. The top weed species identified in Hope were red sorrel (Rumex acetosella), bunchberry (Cornus canadensis), grasses (Poaceae), and goldenrods (Solidago spp.). In Cherryfield, the most prevalent weeds identified were cow-wheat (Melampyrum lineare), lambkill (Kalmia angustifolia), and aronia (Aronia melanocarpa).
Insect and disease damage was limited to visible damage to leaves or stems that could be definitively identified. The number of stems within each quadrat that had insect or disease presence, or damage were counted, and severity of that damage was ranked using the previously stated ranking system. The top insects found at each location were flea beetle (Altica sylviai), thrips (Franklinella vaccimii and/or Catinathrips kainos), and tip midge (Dasineura oxycoccana). Leaf spot (multiple species) was the most observed disease symptom in both locations. Gray mold (Botrytis cinerea), red leaf disease (Exobasidium vaccinii) and mummy berry (Monilinia vaccinii-corymbosi) were present in both locations in lesser quantities. Lastly, blueberry cover was ranked based on the amount of surface area covered by stems.
Blueberries were harvested with a DH Grasshopper on 07/29/25 in Hope and 07/31/25 in Cherryfield.
Data Analysis
Data were cleaned for outliers and any missing data points using Microsoft® Excel® (Microsoft Corporation, Redmond, WA, USA) and statistical analysis was done using JMP® (JMP®, Version Student Edition 19.0.1. SAS Institute Inc., Cary, NC, 1989-2025) software. In Microsoft® Excel®, count data was cleaned for errors and uncertainty of data points were taken into account.
Poisson, poisson gamma and negative binomial distribution models were used for all discrete variable count data. Dispersion and the Chi-square to degrees of freedom ratio were checked for proper model fit. If there was a significant F-test for the fixed effect, the effect was further explained using a Student’s t, Tukey’s HSD for all-pair wise testing or a Dunnett’s test to treatments to the control.
When the response variable was a continuous variable, Analysis of Variance (ANOVA) models were used with an α ≤ 0.05. Residuals were tested for normality using a Shapiro-Wilks test while also observing QQ-Plots. Homoscedasticity was checked by examining residual by predicted plots as well as using a Levene’s test when applicable. If residuals were not normal or homoscedastic or both, then transformations were used on the response variable before examining model results. If block and/or location were included in the model, they were used as random effects. If the ANOVA p-value was significant, a Tukey’s HSD test was used to further explain treatment effects.
A multinomial linear regression was used when the response variable was categorical. Odds ratios were calculated if the Chi-squared p-value was significant. A mosaic plot was used to show the data in a probability format. These plots do not take into account the variability of the model but are useful when predicting an outcome with a specific treatment.
Farmer Input
As described, farmers are involved in both research and educational aspects of this project. After talking with Brodis Blueberries, Passamaquoddy Wild Blueberry Company, and Cherryfield Foods it was determined at studying potassium rates is not of high interest. We will reach out to the Tribe again this spring to determine what their interests are. The Advisory Committee provided the same feedback on this project.
3. Can foliar calcium improve wild blueberry fruit firmness for fresh and frozen sales?
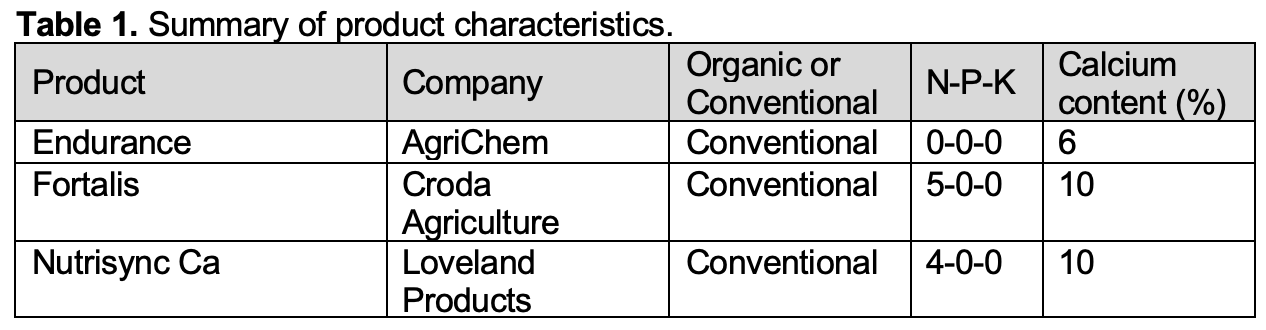
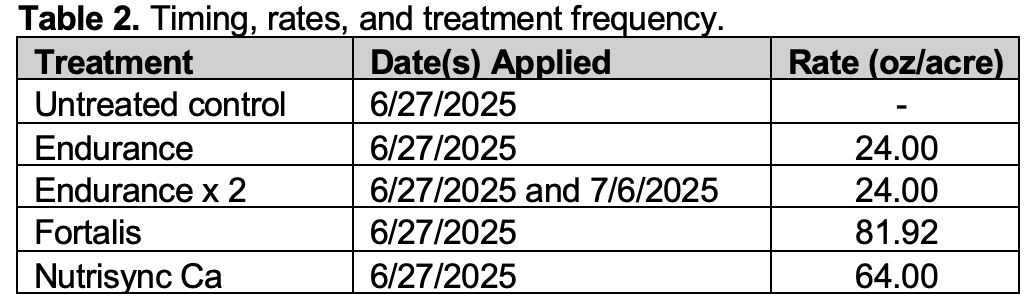
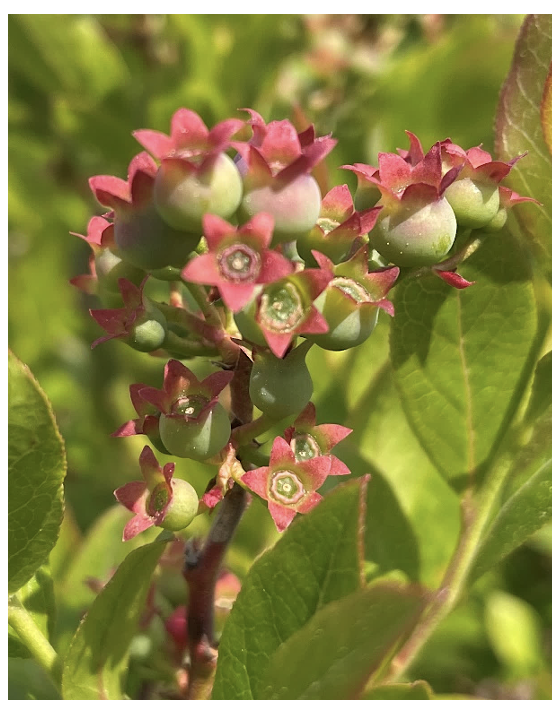
This study was established in 2025 in a lower field in the crop cycle at Blueberry Hill Farm in Jonesboro, ME. The design was a randomized complete block with five treatments (Tables 2 and 3) replicated six times with 30 x 10 foot plots for a total of 30 plots. The study space was sprayed for mummy berry and irrigated throughout the growing season to ensure delivery of 1 inch of water per week to the crop. Calcium products were applied at the green fruit stage, as shown in Image 1 on June 27th, and the second application of Endurance was applied 9 days later, on July 6th, when the fruit was slightly more mature. All products were applied with LI-700 (Loveland Products) at a rate of 2 pints per 100 gallons of spray mixture. Treatment rates were calculated from product label application information and from discussions with company representatives. All materials were applied in 25 gallons of water-mixture per acre with a CO2-propelled, 80-inch boom sprayer (76-inch swath) equipped with four, flat-spray, 8002VS TeeJet® nozzles operating at 30 psi and at a slow walking speed. Walking speed for each application was regulated using a metronome. The materials and rates are in Table 2, and the timing in Table 3.
Data Collection
Plant Phenology
Three 0.37m2 quadrats were established within each plot, and within each quadrat, 4 stems were tagged for fruit counts for a total of 12 stems per plot. The number of pin heads, green fruit, color change fruit, and blue fruit was collected on July 1st, 2025. The number of branches was also collected on this date. The number of blue fruit per stem was counted again on August 5 and 12, 2025, to document the treatment effect on the fruit’s ability to stay on the stem.
Fruit Firmness
From approximately 8:00-9:00 am on August 5th, 2025, 50g of fruit was hand-picked from across each plot to capture genetic and terrain variability. Fruit was collected into paper bags and transported in coolers maintained at 40°F. They arrived back in Orono by 12:00 on the same day and were stored in a refrigerator overnight for fruit firmness analysis on August 6th, 2025. Dr. Beth Calder of the UMaine Food Testing Services analyzed whole fruit to measure fruit firmness. For each treatment, 25 blueberries of sound quality and with good fruit turgor were randomly selected for analysis. One berry at a time was analyzed using the TA.XTPlus Texture Analyzer (Texture Technologies, Hamilton, MA) texture analyzer following a modified Giongo et al. 2022 texture method. The berries were placed on a stainless-steel base so the probe would puncture berries on their sagittal side, and a 2mm stainless steel probe (TA-52) was used to puncture the berry’s skin. The probe traveled 2.5 seconds (~3.0-3.5 mm in depth), and a trigger force of 15 g was used. The force values were reported in g as the peak force it took to puncture the berry skin.
Data Analysis
Data were cleaned for outliers and any missing data points using Microsoft® Excel® (Microsoft Corporation, Redmond, WA, USA), and statistical analysis was performed using JMP® (JMP®, Version Student Edition 18.2.2; SAS Institute Inc., Cary, NC, 1989-2025). In Microsoft® Excel®, data were cleaned of errors, and the counting uncertainty of discrete variables was considered.
Poisson and negative binomial distribution models were used for all discrete variable count data. Dispersion and the Chi-square to degrees of freedom ratio were checked for proper model fit. If there was a significant F-test for the fixed effect, the effect was further explained using Tukey’s HSD for all-pairwise testing.
When the response variable was a continuous variable, Analysis of Variance (ANOVA) models were used with an α ≤ 0.05. Residuals were tested for normality using a Shapiro-Wilks test and QQ plots. Homoscedasticity was checked by examining residual by predicted plots. If residuals were not normal or homoscedastic, or both, transformations were applied to the response variable before examining model results. Block was defined as a random variable in the models. If the ANOVA p-value was significant, a Tukey’s HSD test was used to explain treatment effects further.
Many of the fruit-loss data points were unusable, so the number of data points was adjusted to the treatment with the fewest usable data points, which was 32. Thus, all other treatments were randomly adjusted to an “N” of 32 to avoid bias in the results.
- How much granular N is required to grow a 6 inch tall wild blueberry stem with no branches for fresh pack wild blueberry sales?
2. How much N is required to grow an 8 inch tall wild blueberry stem with branches for frozen wild blueberry sales?
Primordia Within Buds
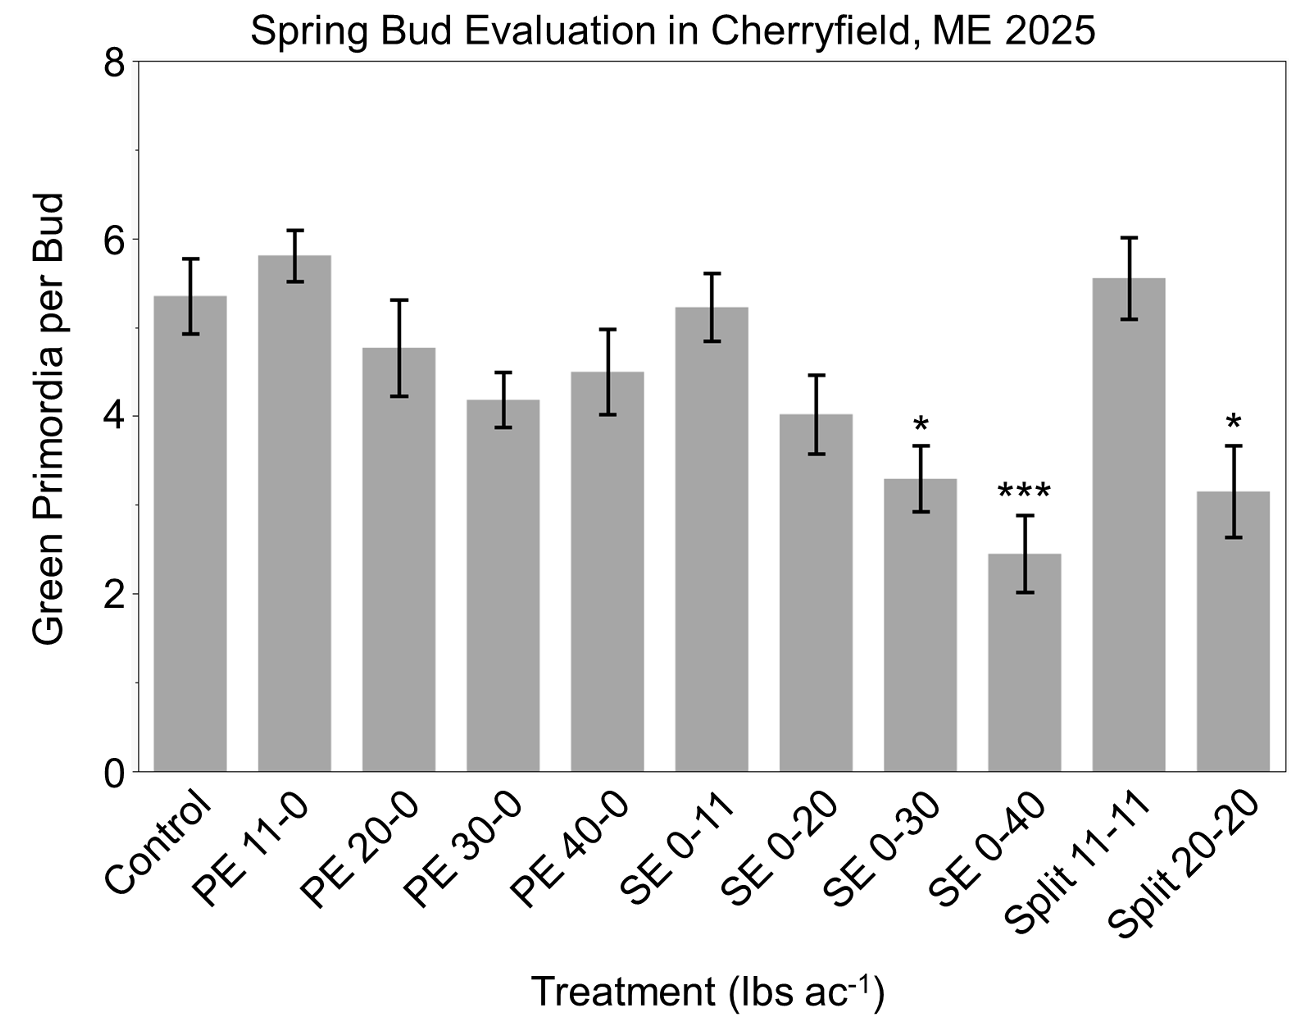
Combining the two locations for analysis, stems in the PE 30-0 and SE 0-40 had significantly more buds (5 buds each) than the control (3 buds) (P = 0.040 each). After buds were dissected to observe healthy (green) and failed (brown) primordia, results showed no significant differences between treatments for green and brown primordia with both locations combined (α ≤ 0.05 and α ≤ 0.10) (data not shown). The locations were separated for analysis. At the Cherryfield location, certain treatments were shown to have significantly fewer number of green primordia within buds compared to the control (Figure 1). Growers are interested in observing a confidence interval of 80% or 75% (α ≤ 0.20 or α ≤ 0.25, respectively), thus exploring this result shown in Figure 1 further, PE 30-0 had significantly lower green primordia than the control (P = 0.1897, for both α ≤ 0.20 or α ≤ 0.25). There were significantly fewer brown primordia within buds in the SE 0-11 treatment (2 primordia) than the control (3 primordia) (P = 0.034). The number of brown primordia result does not change using an α ≤ 0.20 or α ≤ 0.25. In Hope, there was a significant F-test for the model (P = 0.027), but further exploring the result with a Dunnett’s did not detect any differences between the treatments and the control (grand mean, 6 per bud). However, the Split 20-20 treatment had significantly lower green primordia than the control when using an α ≤ 0.20 or α ≤ 0.25 (P = 0.089, for both alpha levels). No significant differences were detected between treatments for number of brown primordia (grand mean, 2 per bud) (data not shown). There were no significant effects detected between treatments for brown primordia using a α ≤ 0.20 or α ≤ 0.25.
Phenology
Green fruit falling off of the stem and not maturing into blue fruit was defined as a loss. Both locations were analyzed together in a model; however, LSMeans plots showed an interaction of direction and locations were analyzed separately. At the Cherryfield location, there were no significant losses detected between treatments and the grand mean was 38 ± 1% (data not shown). There were significant differences detected at the Hope location (P = 0.005), however, there were no differences when treatments were compared to the control (grand mean 34 ± 1%). Comparing means between treatments showed that PE 20-0 was significantly greater (36%) than the SE- 0-11 (20%) and SE 0-20 (20%) (P = 0.024 and P = 0.025, respectively).
When investigating the average maximum amount of blue fruit per stem, there was a significant interaction between location and treatment, so locations were split for analysis (P = 0.045). In Cherryfield, there was a significant fixed effect in treatments (P = 0.046), but the Dunnett’s test did not detect any differences between the control and the treatments (Table 1). There were differences between treatments but no differences when treatments were compared to the control. Hope had similar results, significant fixed effect test (P < 0.001), but no differences between the control and treatments (Table 1).
Stem Characteristics
After building a full model including both locations analyzing stem heights, there were no significant effects detected between treatments. However, after observing the LSMeans plots for the location*treatment interaction, they showed an interaction of magnitude, thus the random effect was removed from the model. In the new model, the SE 0-40 had significantly taller stem heights (9.4 ± 0.2 in) when compared to the control (8.6 ± 0.2 in) (P = 0.041). No significant differences were detected in stem girth between treatments. However, after observing LSMeans plots, there was an interaction of magnitude, and the location*treatment random effect was removed from the model. After the removal, SE 0-30 was significantly greater in stem diameter (0.064 ± 0.003 in) than the control (0.075 ± 0.003 in) (P = 0.044) (data not shown). There were no significant differences detected between treatments for stem branching (grand mean: 8 branches per stem) (Table 1). The stems observed at the Hope location were separated into dead and alive branches, and no significant differences were detected between treatments for either case [grand mean (dead) 2 branches per stem and grand mean (alive) 9 stems per stem] (data not shown). There were no significant differences detected in the first model for the height of the tallest fruit on the stem. However, there was an interaction of magnitude in the location*treatment random effect, so it was dropped from the model to determine if there was a significant main effect. The height of the tallest fruit on the stem was significantly taller in the SE 0-40 (8.4 ± 0.2 in) when compared to the control (7.6 ± 0.2 in) (P = 0.001). Lastly, the model for the lowest fruit height on the stem had the same interaction of magnitude as the previous two above, and the term was dropped. There was a significant main effect (P = 0.044), but there were no significant differences detected between treatments when compared to the control (grand mean 6.6 ± 0.1 in) (data not shown).
Yield
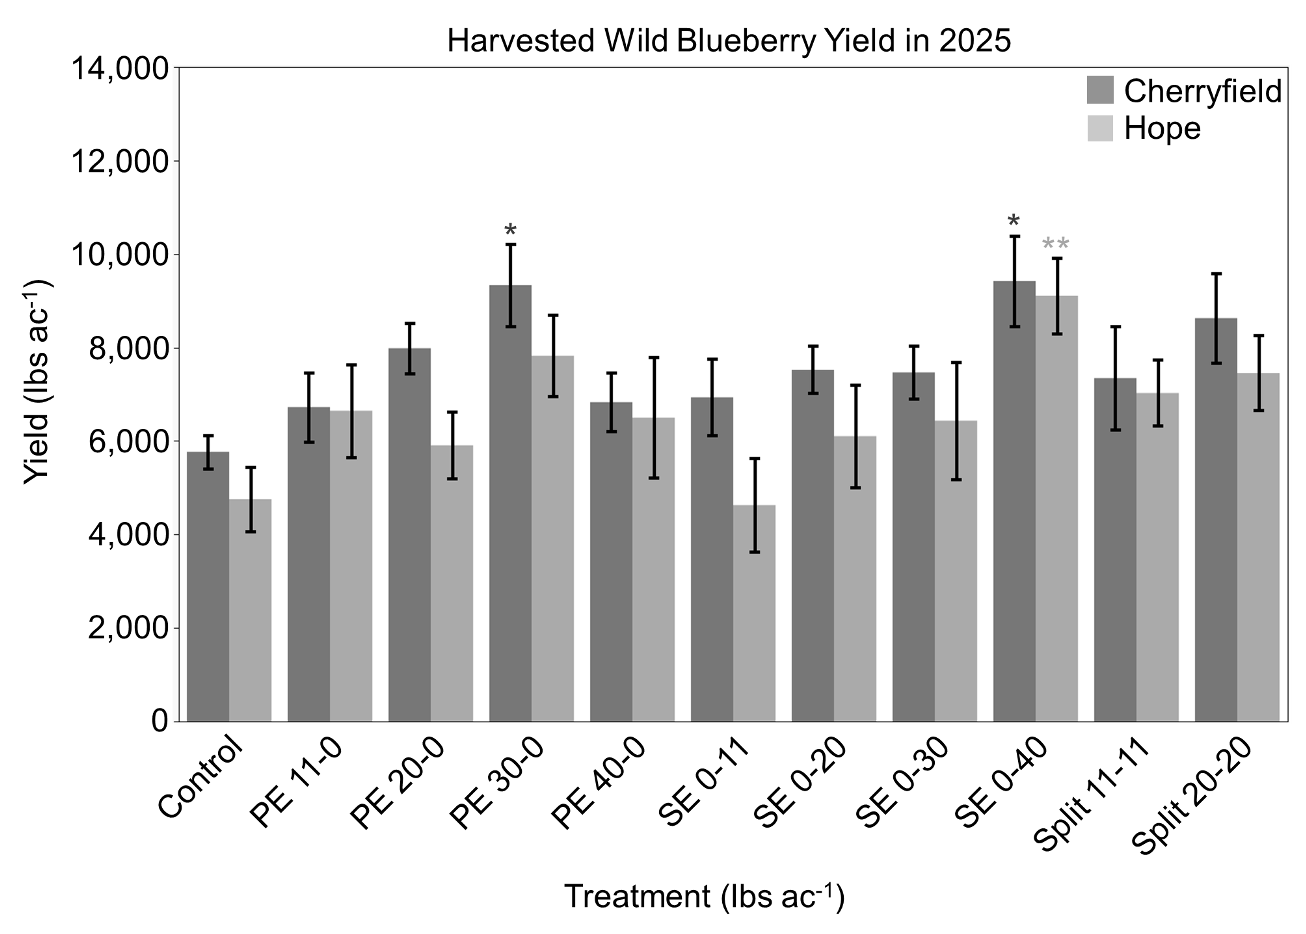
Combining both locations in one model, there was a significant interaction of direction between location*treatment, thus the two locations were analyzed separately. In Cherryfield, PE- 30-0 and SE 0-40 were significantly greater than the control (P = 0.018 and P = 0.017, respectively) (Figure 2). However, in addition, treatments PE 20-0 and Split 20-20 were significantly greater in yield when compared to the control (38% and 46% increase, respectively) (P = 0.191 and P =0.085, respectively, using α ≤ 0.20 or α ≤ 0.25 for both). At the Hope location, the SE 0-40 treatment yield was significantly greater than the control (P = 0.005) (Figure 2). However, in addition, treatments PE 30-0 and Split 20-20 were significantly greater in yield when compared to the control (65% and 57% increase, respectively) (P = 0.083 and P = 0.162, respectively, using α ≤ 0.20 or α ≤ 0.25 for both). Fruit splits between treatments were not significantly different with both locations combined (Figure 3). There were no significant differences detected between treatments for the number of leaves left in harvest totes (Figure 4).
Brix
Cherryfield berries had significantly greater brix degrees than the Hope location, so the two locations were split for analysis (P < 0.001). At the Cherryfield and Hope sites, many treatments were found to be significantly lower than the control (data not shown).
Soil and Foliar Analysis
In Hope, the average soil was pH 4.6 and organic matter was 11.6, while in Cherryfield, the average soil pH was 4.3 and organic matter was 14.1. Most foliar nutrients were found to not be significantly different between treatments, including nitrogen, phosphorous, potassium, magnesium calcium, aluminum, boron, iron, manganese, and zinc. However, copper was significantly different compared to the control at the Hope location (data not shown).
Pest Scouting
Insects
There were no significant differences detected between the treatments and the control for number of stems damaged by insects found in the field (grand mean 2 stems ft-2) (data not shown). Blueberry maggot and spotted wing drosophila were not sampled. The most prominent insect pests were flea beetle (Altica sylvia) and thrips (Frankliniella vaccinii and/or Catinathrips kainos spp.) found in both locations and tip midge was found only in Hope (data not shown).
Disease
In both locations, there were significant differences in types of diseases present in fields (data not shown).
Weeds
There were no significant differences between treatments for the number of weeds (grand mean 1 per ft2) (data not shown). There were significant differences between weed types in Cherryfield, however, significance was not detected in Hope (data not shown). In Cherryfield, lambkill (Kalmia angustifolia) and aronia (Aronia melanocarpa) were the most prevalent weeds, while in Hope red sorrel (Rumex acetosella) and bunchberry (Cornus canadensis) were most prevalent. Both fields had what we consider to be good weed control.
3. Can foliar calcium improve wild blueberry fruit firmness for fresh and frozen sales?
Fruit Firmness
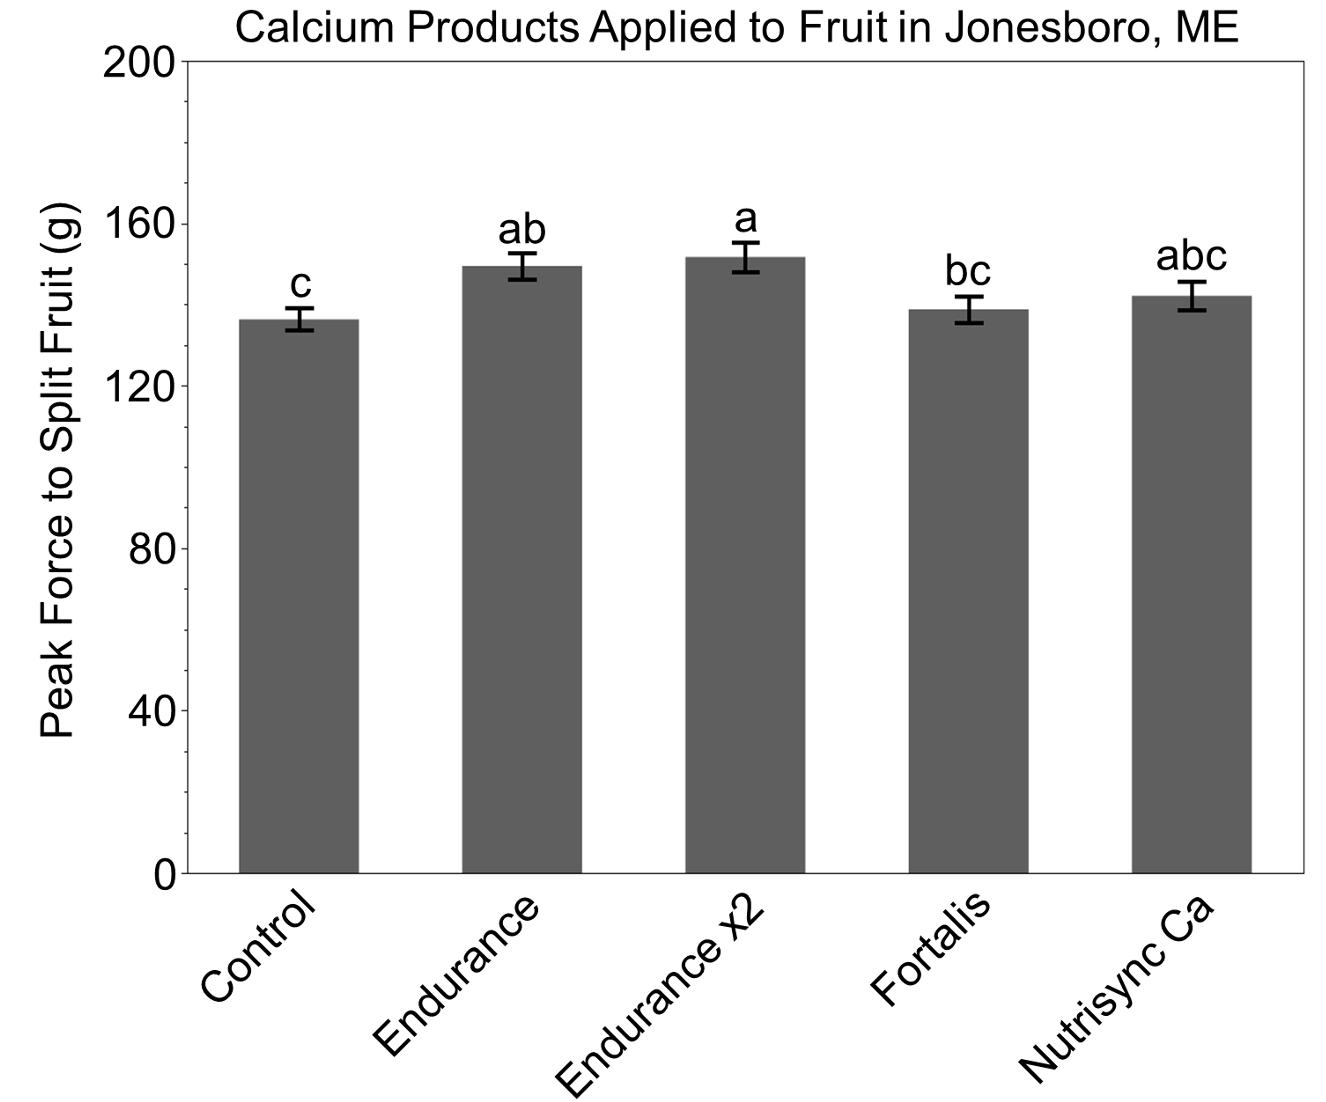
The peak force required for the machine to split the skin of each berry was significant among treatments and is shown in Figure 3 (P = 0.001).
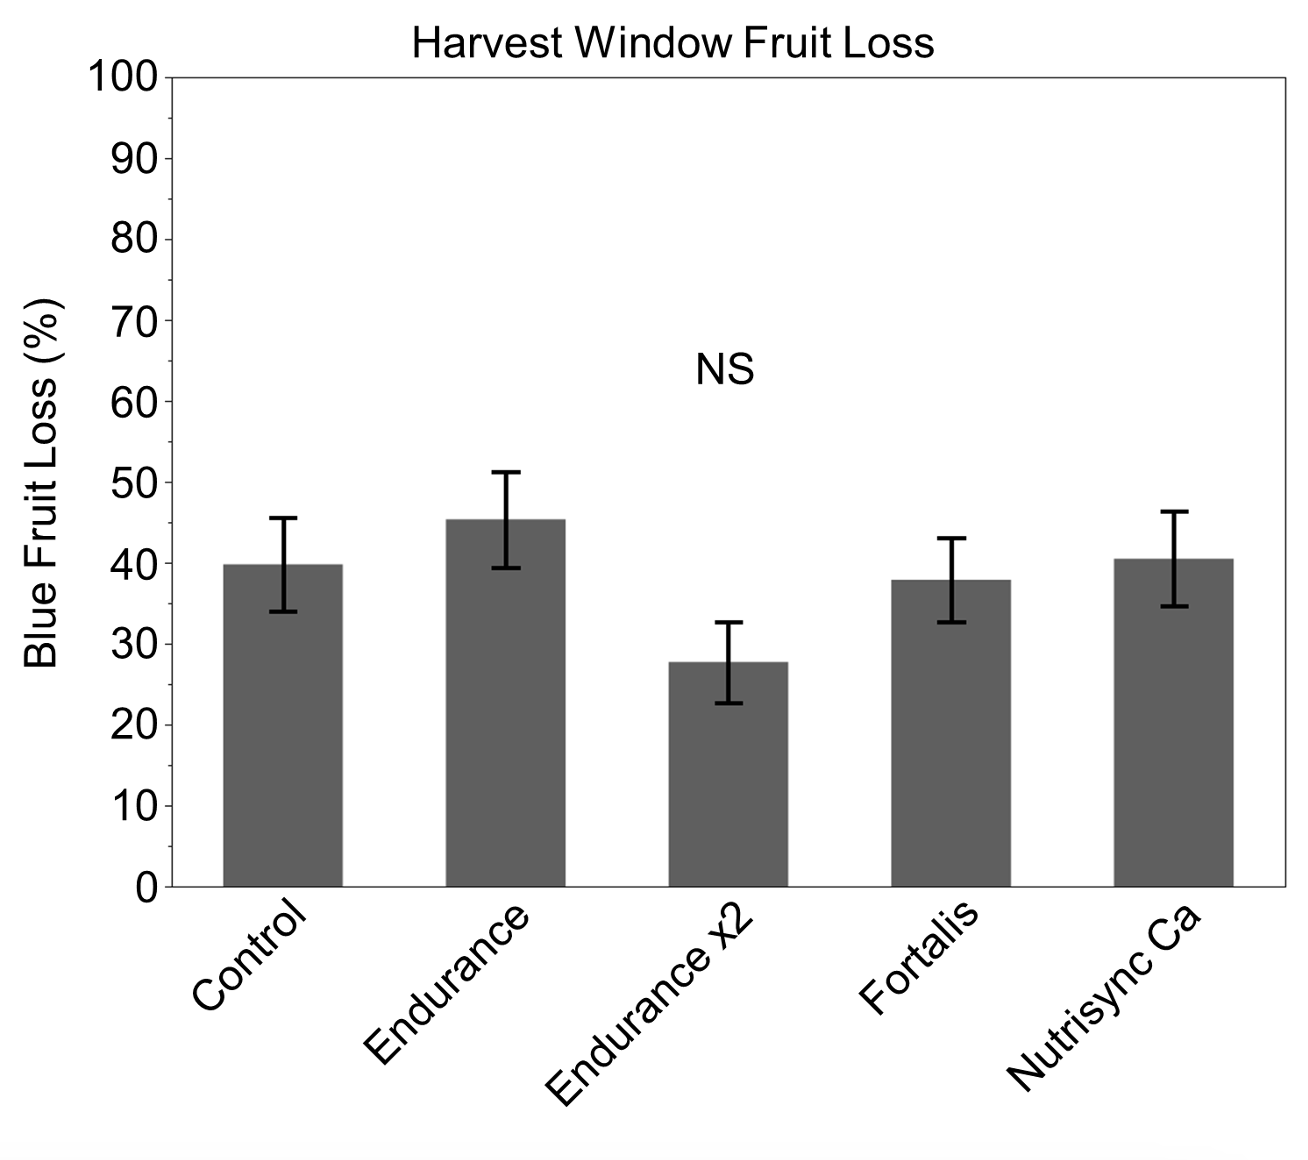
Fruit Loss
In this report, we consider two types of fruit loss: a) “Green to Blue Fruit Loss” which was the number of fruit that dropped from green to blue fruit, and b) “Harvest Window Fruit Loss” which was the number of blue fruit that dropped from our counts on August 5th to August 12th. The number of green fruit before calcium applications was significantly different between treatments. The control had significantly fewer green fruit (9 ± 1 fruit per stem) than Endurance (14 ± 2 fruit per stem), Fortalis (13 ± 2 fruit per stem), and Nutrisync Ca (13 ± 2 fruit per stem) (P < 0.001, P< 0.001, P = 0.001, respectively). Later in the season, the control still had significantly fewer blue fruit than Endurance (9 ± 1 fruit per stem), Fortalis (8 ± 1 fruit per stem), and Nutrisync Ca (8 ± 1 fruit per stem) (P < 0.001, P = 0.004, P < 0.001, respectively).
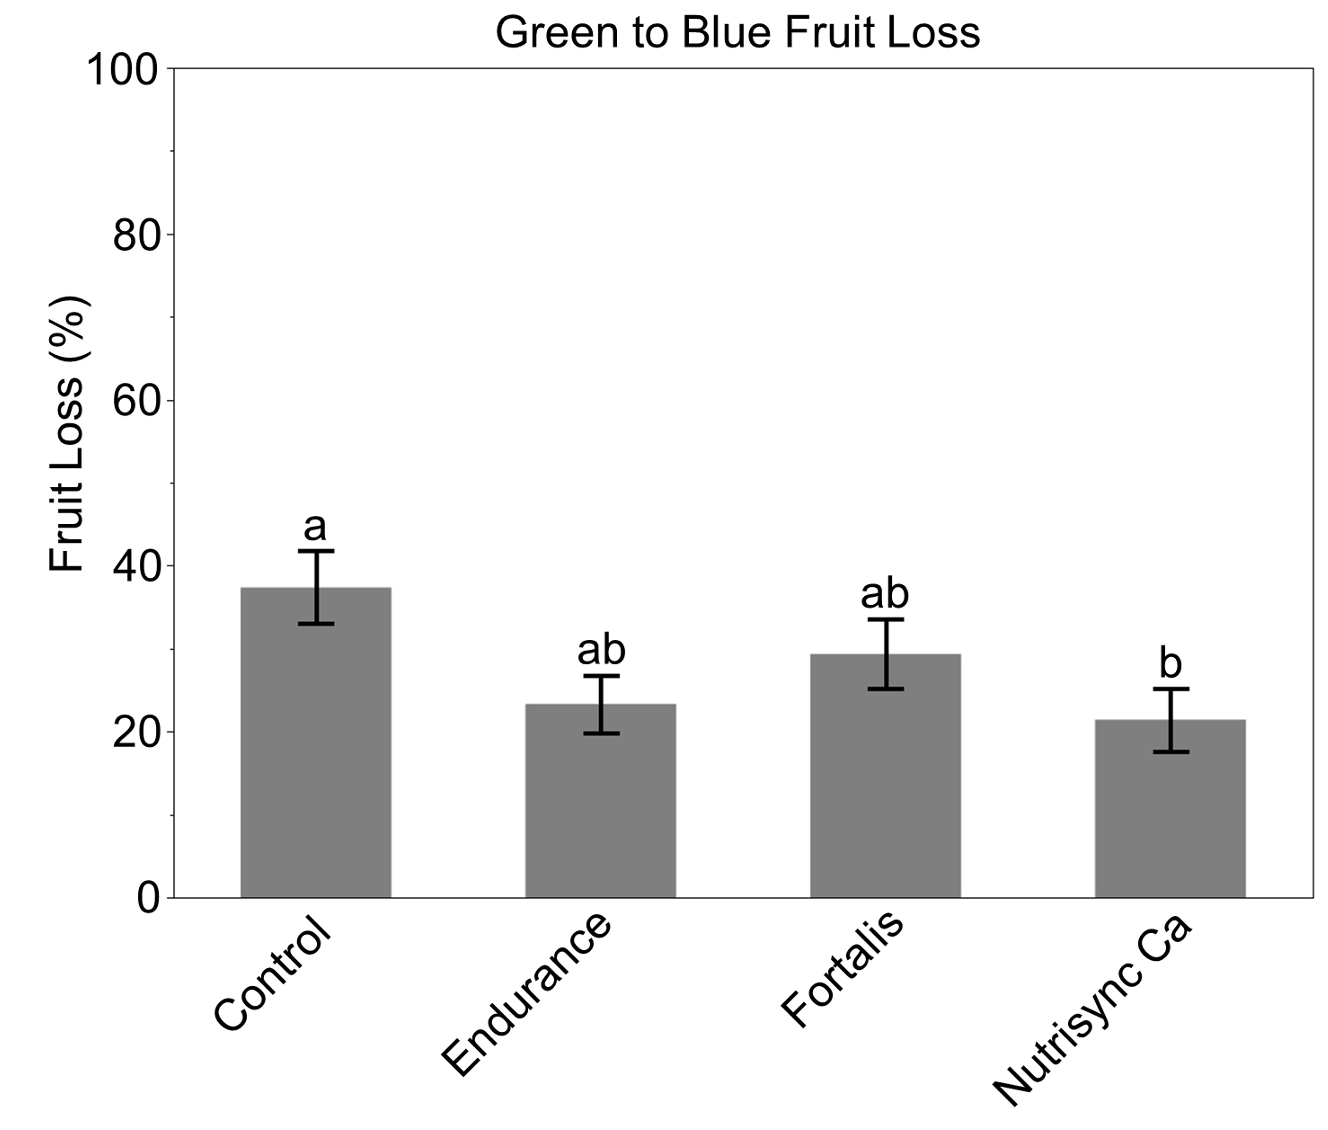
For Green to Blue Fruit Loss, Nutrisync Ca had significantly lower fruit loss than the control (P = 0.046) (Figure 4). During the harvest window, there were no significant differences detected between treatments (Figure 5). However, the average fruit loss per stem was 38 ± 2% from the beginning of the harvest window until harvesting was done (within seven days).
Stem Branching
There were no significant branching effects detected between treatments (grand mean: 8 ± 0 branches) (data not shown).
Nitrogen Study
In conclusion, we can see from this two year study on N rates that there are trade-offs for higher yield once more than 20 lbs. N/acre is applied. At the 30 and 40 lbs of N per acre rates we saw a reduction in bud winter hardiness and an increase in fruit splits at harvest. For many years, experts have said that N is limited in acidic wild blueberry fields. However, plants clearly do respond to ammonium sulfate and yield can be increased. In this study, they responded when N was applied at pre-emergence but more reliably when applied at shoot elongation. Now, one question is when and under what conditions do mycorrhizae assist the most in N uptake. In the original frame for this study, we suggested that different N rates could be applied for fields destined for fresh pack and frozen sales. With the data to date, we are 75-80% confident that fresh pack fields that receive 20 lbs N/acre will see a yield increase without an increase in splits or reduced winter hardiness. We are 95.5% confident that frozen fields that receive 30 or 40 lbs. N/acre will see larger yield increases but will also have reduced bud winter hardiness and increased number of splits at harvest even when using a DH harvester.
RECOMMENDATIONS
- Apply ammonium sulfate to fields that only require N at 30 or 40 lbs of N per acre in the prune year at either pre-emergence or shoot elongation for highest yields.
- If an increase in split berries and reduced rates of winter hardiness concern you, 20 lbs of N/acre appears to be the sweet spot to feed your plants for increased yield while reducing the risk of crop loss over the winter and during harvest.
Calcium Study
Fruit Firmness
Endurance showed significantly firmer fruit compared to other products and the control when applied once and twice at the green fruit stage. When Endurance was applied twice, the fruit was firmer than when it was applied once. Endurance is the only foliar calcium product with calcium as the only active ingredient, with no nitrogen included in the formulation.
Fruit Loss
Green to Blue Fruit Loss was significantly lower on plants that received NutrisyncCa in one application at green fruit. Although not significant, there was a trend toward less green to blue fruit loss in all foliar calcium treatments compared to the control. During harvest, from August 5th to 12th, environmental conditions shifted from dry to extremely dry. Fruit across the Downeast region began dropping off plants due to flash drought between these two dates. At this location, we did not observe any significant fruit loss during the blue fruit harvest window.
Recomendations
- Endurance foliar calcium can be applied to increase fruit firmness. Apply at green fruit one or two times at a rate of 24 oz/acre.
- Nutrisync foliar calcium can be applied one time to reduce fruit loss from green to blue fruit at a rate of 64 oz/acre.
Education
Engagement
The educational and research aspects of this project will be fully incorporated into the Extension Wild Blueberry Program that reaches producers through a newsletter, field days, annual conference, factsheets, webpages, and videos. There are 400 wild blueberry farmers, 100 land owners, and 200 agricultural service providers on our emailed and mailed Newsletter list. On average, 400 participants attend Dr. Calderwood’s in-person wild blueberry events every year. Approximately 15% of attendees are agricultural service providers. The annual UMaine Wild Blueberry Conference occurs in February each year and attracts approximately 100 attendees. Factsheets are available in print and online. On average, five field days occur between March and June during the growing season. The UMaine Extension Communications and Marketing Team will provide in-kind support by distributing press-releases, posting events and material links on Facebook, and facilitating event promotion and registration. For this project we will begin posting on Instagram to reach a broader audience @umainewildblueberry and make an effort to make educational videos in the field on nutrient management.
First Tier Participants: Ron Howard, Courtney Hammond, JD Newell, Spencer Fisher, and Brogan Tooley are the farmers directly involved with the on-farm research trials, providing educational resource feedback. This group will be in close contact with the project team at least every two weeks during the growing season. When support is needed, the project team will talk through questions on the phone or in-person, and direct producers to outreach materials when applicable.
Second Tier Participants: There are approximately 300 farmers who interact with the UMaine Wild Blueberry Education Program on a regular basis. They attend at least one event each year and will therefore receive the information presented through this project. Participants will be encouraged to reach out directly to the project team with any questions and the project team will make fertilizer calculations, talk through questions on the phone, via email, or in-person, and direct producers to outreach materials.
Learning
Existing scientifically-based knowledge will be communicated through talks, field meetings, factsheets, videos, and UMaine Soil Testing Lab result forms. The Extension Wild Blueberry website currently includes outdated nutrient management information to be updated in 2026. Educational material will repopulate this webpage with factsheets, videos, and sample soil and foliar result forms. At field meetings and the Conference described above, producers will listen to educational material presented and actively participate in discussions and example fertilizer calculation exercises. The interactive activities typically spur more engagement and topics to discuss further. The specific topics that will be covered in educational material include:
- (2025-2027) The importance of soil and foliar testing in managing wild blueberries to sustain the farm budget, maintain consistency, and improve crop quality on a field by field basis.
- Farmers will gain more in-depth knowledge of the different types of nutrient testing and be able to use this increased amount of data from their fields to improve crop quality and maintain consistent yields, both of which will benefit their budget and therefore lead to adoption.
- (2026/2027) Collaboration with the UMaine Soil Testing Service on the Understanding Recommendations page under Commercial Crops we will add a Wild Blueberry section that includes detailed rate calculations, what they are based on and sample soil and foliar results.
- Farmers will gain an understanding of how recommendations are calculated, assumptions made, and feel confident in their own recommendation thereby improving the accuracy of fertilizer applied.
- (2025-2027) Explanations of weed management as it relates to nutrient management, when it makes sense to use granular vs. foliar fertilizers, the role of organic matter in the nitrogen cycle, how to apply fertilizer. This material will also include links to the new UMaine Soil Testing Service Understanding Recommendation for Commercial Wild Blueberry.
- Farmers will understand how nutrient management fits into wild blueberry farming.
In 2025, we held the UMaine Wild Blueberry Field Day at Blueberry Hill Farm in Jonesboro which had 98 attendees. Drs. Calderwood and King held a session on nitrogen fertility which described this project and walked through foliar testing and a N and P budget worksheet. Later in the day Dr. Calderwood presented on weed management in the field and connected fertility decisions to weed management.


Evaluation
We will conduct pre-and-post surveys using paper copies at in-person events and online surveys using Qualtrics software in the first and last years of this project. We will also use google analytics, YouTube and social media follower counts, and event registration numbers to measure participation.
Data collected through the Verification Tool will include fertilizer application rates and times, perceptions of berry quality, yield data, weed management practices, and fertilizer costs per acre. In addition to this baseline level of information we will ask producers if they apply fertilizer on a field by field or whole farm basis. Using the difference between the two surveys with the same questions about the same fields we will be able to document adoption of knowledge gained through fruit gained to fresh and frozen end uses (see Draft Verification Tool).
Milestones
Engagement
Milestone #1: Three farmers will give input and feedback on research experimental designs and two new research trials will be established.
Farmers: 3
Completion Date: May 2024
Evaluation: Word of mouth from farmers
Status: Complete. Three farms gave input and feedback on experimental designs.
Milestone #2: Pre project survey is distributed and farmers complete it.
Farmers: 50
Ag Service Providers: N/A
Completion Date: February 2026
Evaluation: Verification Tool
Status: Will be complete at this February 7th UMaine Wild Blueberry Conference. We are updating the Verification Tool submitted.
Milestone #3: Farmers and ag service providers access the updated nutrient management web pages.
Farmers: 200
Ag Service Providers: 20
Completion Date: September 2027
Evaluation: Google analytics
Milestone #4: Farmers and ag service providers attend at least 8 on-farm field days and 3 annual conferences.
Farmers: 300 unique attendees
Ag Service Providers: 15 unique attendees
Completion Date: September 2028
Evaluation: Registration numbers
Learning
Milestone #5: Farmers and ag service providers document knowledge gained on foliar sampling and nutrient test results as a way to improve crop consistency, yield and quality.
Farmers: 50
Ag Service Providers: 10
Completion Date: September 2028
Evaluation: Verification Tool and event surveys
Milestone #6: Farmers document adopting leaf tissue testing (foliar analysis) for field by field nutrient management planning.
Farmers: 10
Ag Service Providers: N/A
Completion Date: September 2028
Evaluation: Verification Tool and event surveys
Milestone #7: Farmers and ag service providers document knowledge gained on weed, irrigation, and organic matter management as interconnected aspects of nutrient management.
Farmers: 50
Ag Service Providers: 10
Completion Date: September 2028
Evaluation: Verification Tool and event surveys
Milestone #8: Farmers document adopting a new weed, irrigation, or organic matter management practice.
Farmers: 10
Ag Service Providers: N/A
Completion Date: September 2028
Evaluation: Verification Tool and event surveys
Evaluation
Milestone #9: Post project survey is distributed and farmers complete it.
Farmers: 50
Ag Service Providers: N/A
Completion Date: September 2028
Evaluation: Verification Tool
Milestone #10: Farmers document an increase in fruit gained from fertilizing more precisely according to their crop and end market needs.
Farmers: 10
Ag Service Providers: N/A
Completion Date: September 2028
Evaluation: Verification Tool
Milestone activities and participation summary
Educational activities:
Participation summary:
Learning Outcomes
Performance Target Outcomes
Target #1
10
adopt more precise granular fertilizer applications
on a field by field basis
20,000 acres
500 lbs/acre ($285/acre)
of fruit gained or $40/acre savings from fertilizer costs
8
Indicated at 2025 field day that they would take foliar tests, consider applying ammonium sulfate at 40 lbs/acre and/or complete the N/P budgeting worksheet
approximately 8,000 acres so far
Measurable benefits not observed yet.