Final report for LS16-269
Project Information
Organic/sustainable vegetable farmers use a wide variety of nitrogen (N) fertilizers ranging from commercial products (made from animal and seed meals) to manures and composts. These organic N sources must undergo mineralization and nitrification through microbial processes to become plant available inorganic N, a process that will vary based on the fertilizer and local weather conditions. Thus, a tool that can estimate mineralized N will help organic farmers address better N management, aid in synchronizing plant available N release with plant uptake, reduce farmer costs and environmental degradation, and lead to increased sustainability in these systems. This project took a systems approach to determine N mineralization under laboratory and field conditions to create a web-based N calculator. A long-term incubation (100 days) determined net N mineralized from 49 different commercial fertilizers, poultry litters, and composts. Net N mineralized ranged from 21 to 87%, 8 to 37%, and 1 to 4% of the total N applied for the commercial fertilizers, poultry litters, and those composts that mineralized, respectively. A second long-term incubation study determined the effect of soil texture in four different soils common to the Southeast on N mineralization from organic materials. While high clay content decreased N mineralization from feather meal, such effect was not observed with a pelleted fertilizer product. Low pH decreased mineralization rates for both products. Field studies were conducted both at the University of Georgia Research Farm and at four participating farms to determine N mineralization from nine different fertilizers. These results culminated into a web-based nitrogen calculator which can help farmers predict and estimate N mineralization based on material selection, application rates, and environmental factors to meet plant demand. Results from this project were shared through presentations and publications to farmers, Extension, and the scientific community.
Overall objective: To determine N release from a wide range of organic materials and create an on-line tool to accurately model plant available nitrogen from the application of organic materials based on the material and local weather conditions. Educational goals include increasing awareness and knowledge about N availability from organic materials and fertilizers for small to mid-scale sustainable vegetable farmers, Extension agents, and the public. This work will address the need for more precise management of these materials, decreasing costs and labor for farmers while also decreasing the potential for environmental degradation due to the introduction of excess N into the surrounding ecosystems.
Specific objectives:
Objective 1. a) Determine potentially mineralizable N and rates of N mineralization for 49 organic materials (manures, composts, other organic fertilizers), and b) determine the effect of soil texture on N mineralization rates of organic materials.
Objective 2. Calibrate NIRS/VNIRS to estimate mineralizable N and rates of N mineralization for 49 organic materials.
Objective 3. Develop a web-based PAN calculator that allows producers to calculate PAN over the growing season as a function of local weather and soil conditions.
Objective 4. Collect PAN data from plots at the UGA farm and at cooperating farms, and use the data to calibrate and validate the PAN calculator.
Objective 5. Disseminate the N mineralization data, availability of the NIRS/VNIRS analysis for organic materials, and web-based PAN calculator to the public, farmers, and extension agents.
Cooperators
Research
1. a) Nitrogen mineralization from 49 different organic materials: laboratory
To determine the mineralizable N from different organic materials, materials were incubated with soil under “ideal” conditions and inorganic N released was measured over 100 days. Organic materials (24 commercial fertilizers, 15 poultry litters, and 11 composts) were collected to represent commonly used materials by Southeastern vegetable growers. Commercial fertilizers were purchased online and through fertilizers distributors, and poultry litters and composts were collected from local farmers and through samples submitted to the University of Georgia Agricultural and Environmental Services Lab. Organic fertilizers were analyzed for total elements, initial inorganic N, and initial water content. Soil was collected from the University of Georgia Horticulture Organic Farm, air-dried, passed through a 2-mm sieve and brought up to 50% maximum water holding capacity (15% gravimetric water content) prior to fertilizer application. To maintain similar values of plant available N across treatments, organic materials were applied to the soil to supply a rate of 150 mg N kg-1 of plant available N based on the assumption that 50%, 45%, and 10% of the total N would become available from the commercial fertilizers, poultry litters, and composts, respectively. Organic materials were well mixed with the soil, placed in an incubator at 30oC, and inorganic N concentrations (ammonium and nitrate) were determined on days 1, 3, 7, 14, 35, 56, 78, and 99. Nitrogen mineralization was fit to a one-pool first order kinetic model to determine the pool of mineralizable N and the rate of mineralization. Organic material characteristics were regressed against the pool of mineralizable N and the rate of mineralization to determine any significant relationships.
b) Effect of soil texture on N mineralization and ammonia from applied organic fertilizer
Previous studies have indicated that soil texture (sand, silt, and clay) may affect N mineralization from the soil organic matter and from organic materials applied to the soil. Four soils were collected from across the state of Georgia with varying sand, silt, and clay (Table 1) and were incubated under “ideal” conditions for 100 days to measure N mineralization from applied organic materials. The four soils, two-Cecil, Greenville, and Tifton series were collected, air-dried, and passed through a 2-mm sieve. Prior to use, soils were brought to 50% maximum water holding capacity. Two different fertilizers, feather meal and a pelleted fertilizer mix, were applied to supply a rate of 150 mg N kg-1 of plant available N based on the assumption that 50% of the total would become plant available. An aerobic incubation was performed as described above to determine mineralizable N and the rate of mineralization over 100 days.
Table 1. Initial soil characteristics of soils used in texture study.
| Soil | Sand | Clay | Total N | Total C | 50% WHC | Initial Inorganic N | pH | pH Buffering Capacity |
| % | % | g kg-1 soil | g kg-1 soil | g kg-1 soil | mg kg-1 soil | mmol H+ kg-1 pH-1 | ||
| Cecil 1 | 86 | 6.5 | 1.3 | 19.7 | 150 | 71 | 5.8 | 15.3 |
| Cecil 2 | 81 | 8.1 | 1.4 | 15.8 | 230 | 66.4 | 5.4 | 13.9 |
| Greenville | 70 | 19.8 | 0.8 | 11.1 | 190 | 21 | 6.3 | 18.3 |
| Tifton | 93 | 3.2 | 0.2 | 5.9 | 100 | 15 | 6.1 | 6.2 |
2. Calibrate NIRS to estimate mineralizable N and rates of N mineralization for 49 organic materials
Long incubations to determine N mineralization pools and kinetics are time consuming and are not practical when farmers need information for the oncoming season. Therefore, materials and their respective mineralization pools and kinetics determined in objective 1a were scanned and calibrated against near infrared spectroscopy (NIRS). NIRS was performed using a FOSS NIRS System 6500 using WINSI WINSCAN Version 1.5 software on organic materials (dried and ground) from 400 to 2500 nm. The software identified outliers during the calibration/validation procedure by rejecting samples based on their spectral differences (H statistic greater than 3.5) and by the T statistic (greater than 2.5). The quality of calibration was assessed using the standard error for calibration (SEC) and the coefficient of calibration (RSQ). Due to the small sample size used for NIRS analysis, the data were not split into independent calibration and validation sets. Therefore, cross-validation was performed using the WINSI software during the calibration procedure. Validation consisted of leave-one-out cross-validation in which every fifth sample was removed to use for validation during calibration. The cross-validation set began with the first sample as a starting point, the subsequent set beginning with the second sample, and this cross-validation procedure was repeated so that every sample was used for both calibration and cross validation. The cross-validation subgroup contained 80% of the samples and the validation group consisted of the other 20% of the samples. Validation was assessed using the standard error of cross-validation (SECV), and the 1-validation ratio (VR). Statistical analysis was performed once on a data set with all product types (fertilizers, poultry litters, and composts) and again on the fertilizers only to determine if product type grouping may impact the ability of NIRS to predict characteristics of organic materials.
3. Development of a web-based plant available nitrogen (PAN) calculator
To model the plant available nitrogen release from organic materials and fertilizers, we used the model structure from an existing cover crop N availability calculator that our research group had previously developed (aesl.ces.uga.edu/mineralization). First–order rates of N mineralization were determined from our laboratory studies in objectives 1 and 2. Ammonia volatilization was excluded from our model due to no volatilization measured in the lab and the overwhelming tendency of our farmers to incorporate these materials into the soil. Mineralization from the organic materials was modeled as a function of characteristics of the materials (entered as input) and the 5-year historical, local environmental conditions (obtained from the Georgia Automated Environmental Monitoring Network). Soil water content and temperature modifications factors were gathered from the existing model and the literature. Denitrification was not modeled because losses are usually low, and nitrate leaching was not be included as it is heavily dependent on irrigation practices (but may be an area of interest for future model development). Field data collected through the research farm and with participating farmers was used for model calibration. Cooperating farmers provided played a large role in the creation of the PAN calculator/model through their input on calculator/model interface and ease of use. The calculator was implemented and made available at the website of the Agricultural and Environmental Services Laboratories of the University of Georgia, and an Extension Bulletin and user guide will be made available.
4. Nitrogen mineralization from organic materials under field conditions: research farm and participating farms
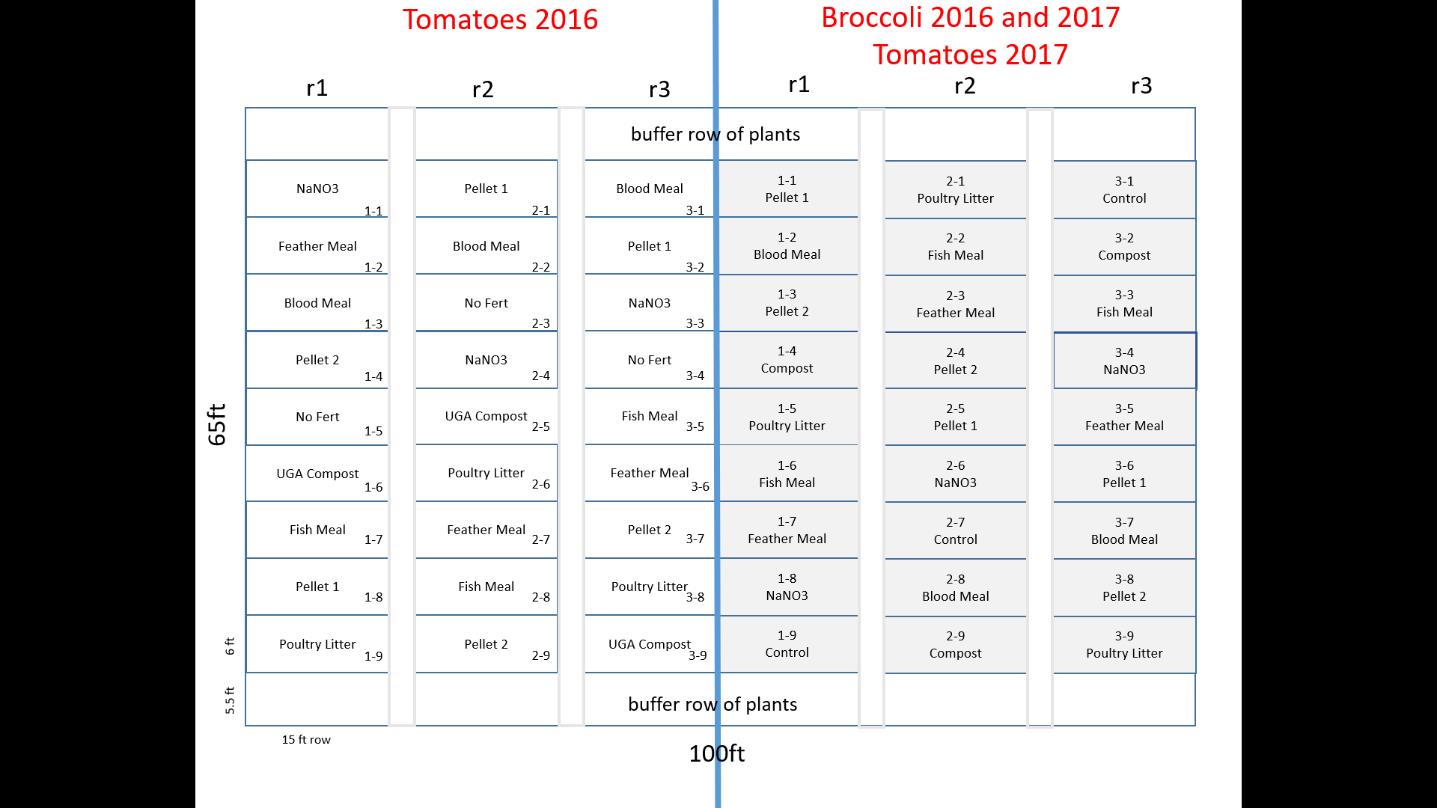
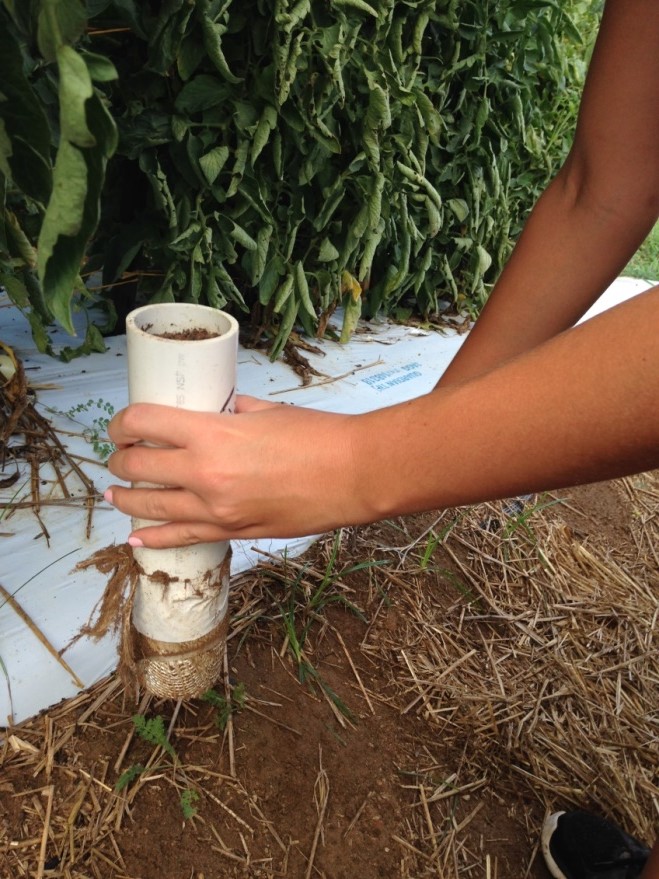
On-farm N mineralization was measured using in-situ soil cores for field trials conducted from the summer of 2016 to the summer of 2018. Briefly, in-situ cores consisted of PVC cores (20 cm long by 5 cm cm diameter) packed with soil and fertilizer treatments to mimic field bulk density and applications. At the bottom 2.5 cm of each core, 15 g of cation/anion exchange resin was mixed with soil to capture ammonium and nitrate release during mineralization. Cores were buried in a row next to the crops and were removed at five different time intervals to determine plant available N released over the growing season. After removal, the entire core (including resin) was extracted with 1M KCl for ammonium and nitrate determination. Research field trials were conducted at the University of Georgia Durham Horticulture Farm organic plots and were replicated for two years and two different crops (tomatoes and broccoli). These studies were set up in a randomized complete block design with 9 fertilizers treatments: no fertilizer, Chilean nitrate, feather meal, blood meal, fish meal, poultry litter, compost, and two different pelleted poultry products. Due to the high N and high organic matter determined in the research plots, fertilizers were applied at rate to supply 78 kg N/ha (70 lb N/acre) for tomatoes and 112 kg N/ha (100 lb N/acre) for broccoli. Farmer field trials were conducted in a similar manner, except farms chose fertilizers and application rates. Each farmer field trial consisted of two treatments: farmer-selected fertilizer and the no-fertilizer control. Small-scale vegetable farmers participating in this grant were either certified organic or certified naturally grown and were located across the Georgia Piedmont region. One farm participated for four seasons and the remaining three participated for a summer and winter season. A total of five seasons were measured for broccoli and tomato crops. For all studies, in-situ soil cores were removed every 2-3 weeks until the end of harvest, with plant health (height, flowering, etc.) and yield measured to determine the effect of fertilizers on growth. For tomatoes, yield was measured on five plants per treatment plot (three replications) with “marketable” fruit based off of USDA Grade A standards. For broccoli, total harvest, total number of heads, and individual head weight were determined for each treatment plot (three replications) for the interior 10 plants. No grading was necessary for broccoli harvest. Excess harvest was donated to local food bank. On-site weather stations measured field rain, relative humidity, temperature, soil water content, and soil temperature. Net N mineralized from the applied organic materials was calculated by subtracting N mineralized measured in the no-fertilizer (control treatment).
Figure 1: Research design at UGA research plots.
Picture 1. Soil cores used in the field trials.
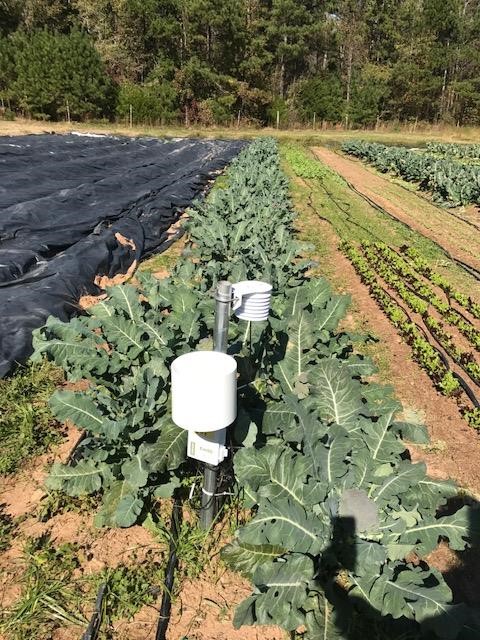
Picture 2. Set up of weather station and trials at participating farmer field for broccoli season.
5. Information dissemination, education, and outreach
Outreach was performed through farmer, public, Extension and student interactions. Data collected from these experiments were shared through presentations and posters at farmer conferences, scientific conferences, college classes, and at UGA Extension ANR updates. Additionally, an on-farm tour was conducted during two UGA Twilight farm tours. Data were prepared for print through peer reviewed journal articles, newsletters, and Extension bulletins.
1. a) Nitrogen mineralization from 49 different organic materials: laboratory
Nitrogen mineralization was measured from commercial fertilizers, poultry litters, and composts with a wide range of initial characteristics. Little information is currently available on many of these products making it difficult for organic/sustainable farmers to make appropriate application rates. Net nitrogen mineralized and plant available N (which included the initial inorganic N in the material) were determined.
Net N mineralized ranged from 21 to 87%, 8 to 37%, and 1 to 4% of the total nitrogen applied for the fertilizers, poultry litters, and composts that mineralized, respectively. Alfalfa meal was the only commercial fertilizer that exhibited immobilization in this study, but immobilization of N was observed for five of the 11 composts. For the composts that showed N mineralization, the rate of release was slow and the majority of the plant available N came from the initial inorganic N of the material. Nitrogen in blood meal and feather meal became rapidly available (plant available N over 80% of applied N) whereas products containing pasteurized poultry litter had a more moderate release (plant available N averaged 45% of the applied nitrogen). Bone meal (which is typically applied to meet phosphorus needs) and mustard meal had the lowest mineralization, where only 25% of applied N became plant available in the 100-day study (Fig. 2).
First-order kinetics was fit to model net N mineralized from commercial fertilizers and poultry:
Cumulative Net N Minealized (g kg-1 dry material)= N0*(1-e-kt)
Where N0 is the pool of mineralizable nitrogen, k is the rate of mineralization (1/d), and t is the time in days. The rate of mineralization (k) for fertilizers ranged from 0.02 to 0.37 day-1 and N0 ranged from 9.6 to 109.7 g N kg-1 material. For poultry litters, the rate of mineralization (k) ranged from 0.005 to 0.19 day-1 and N0 varied from 8.1 to 44.4 g kg-1 material.
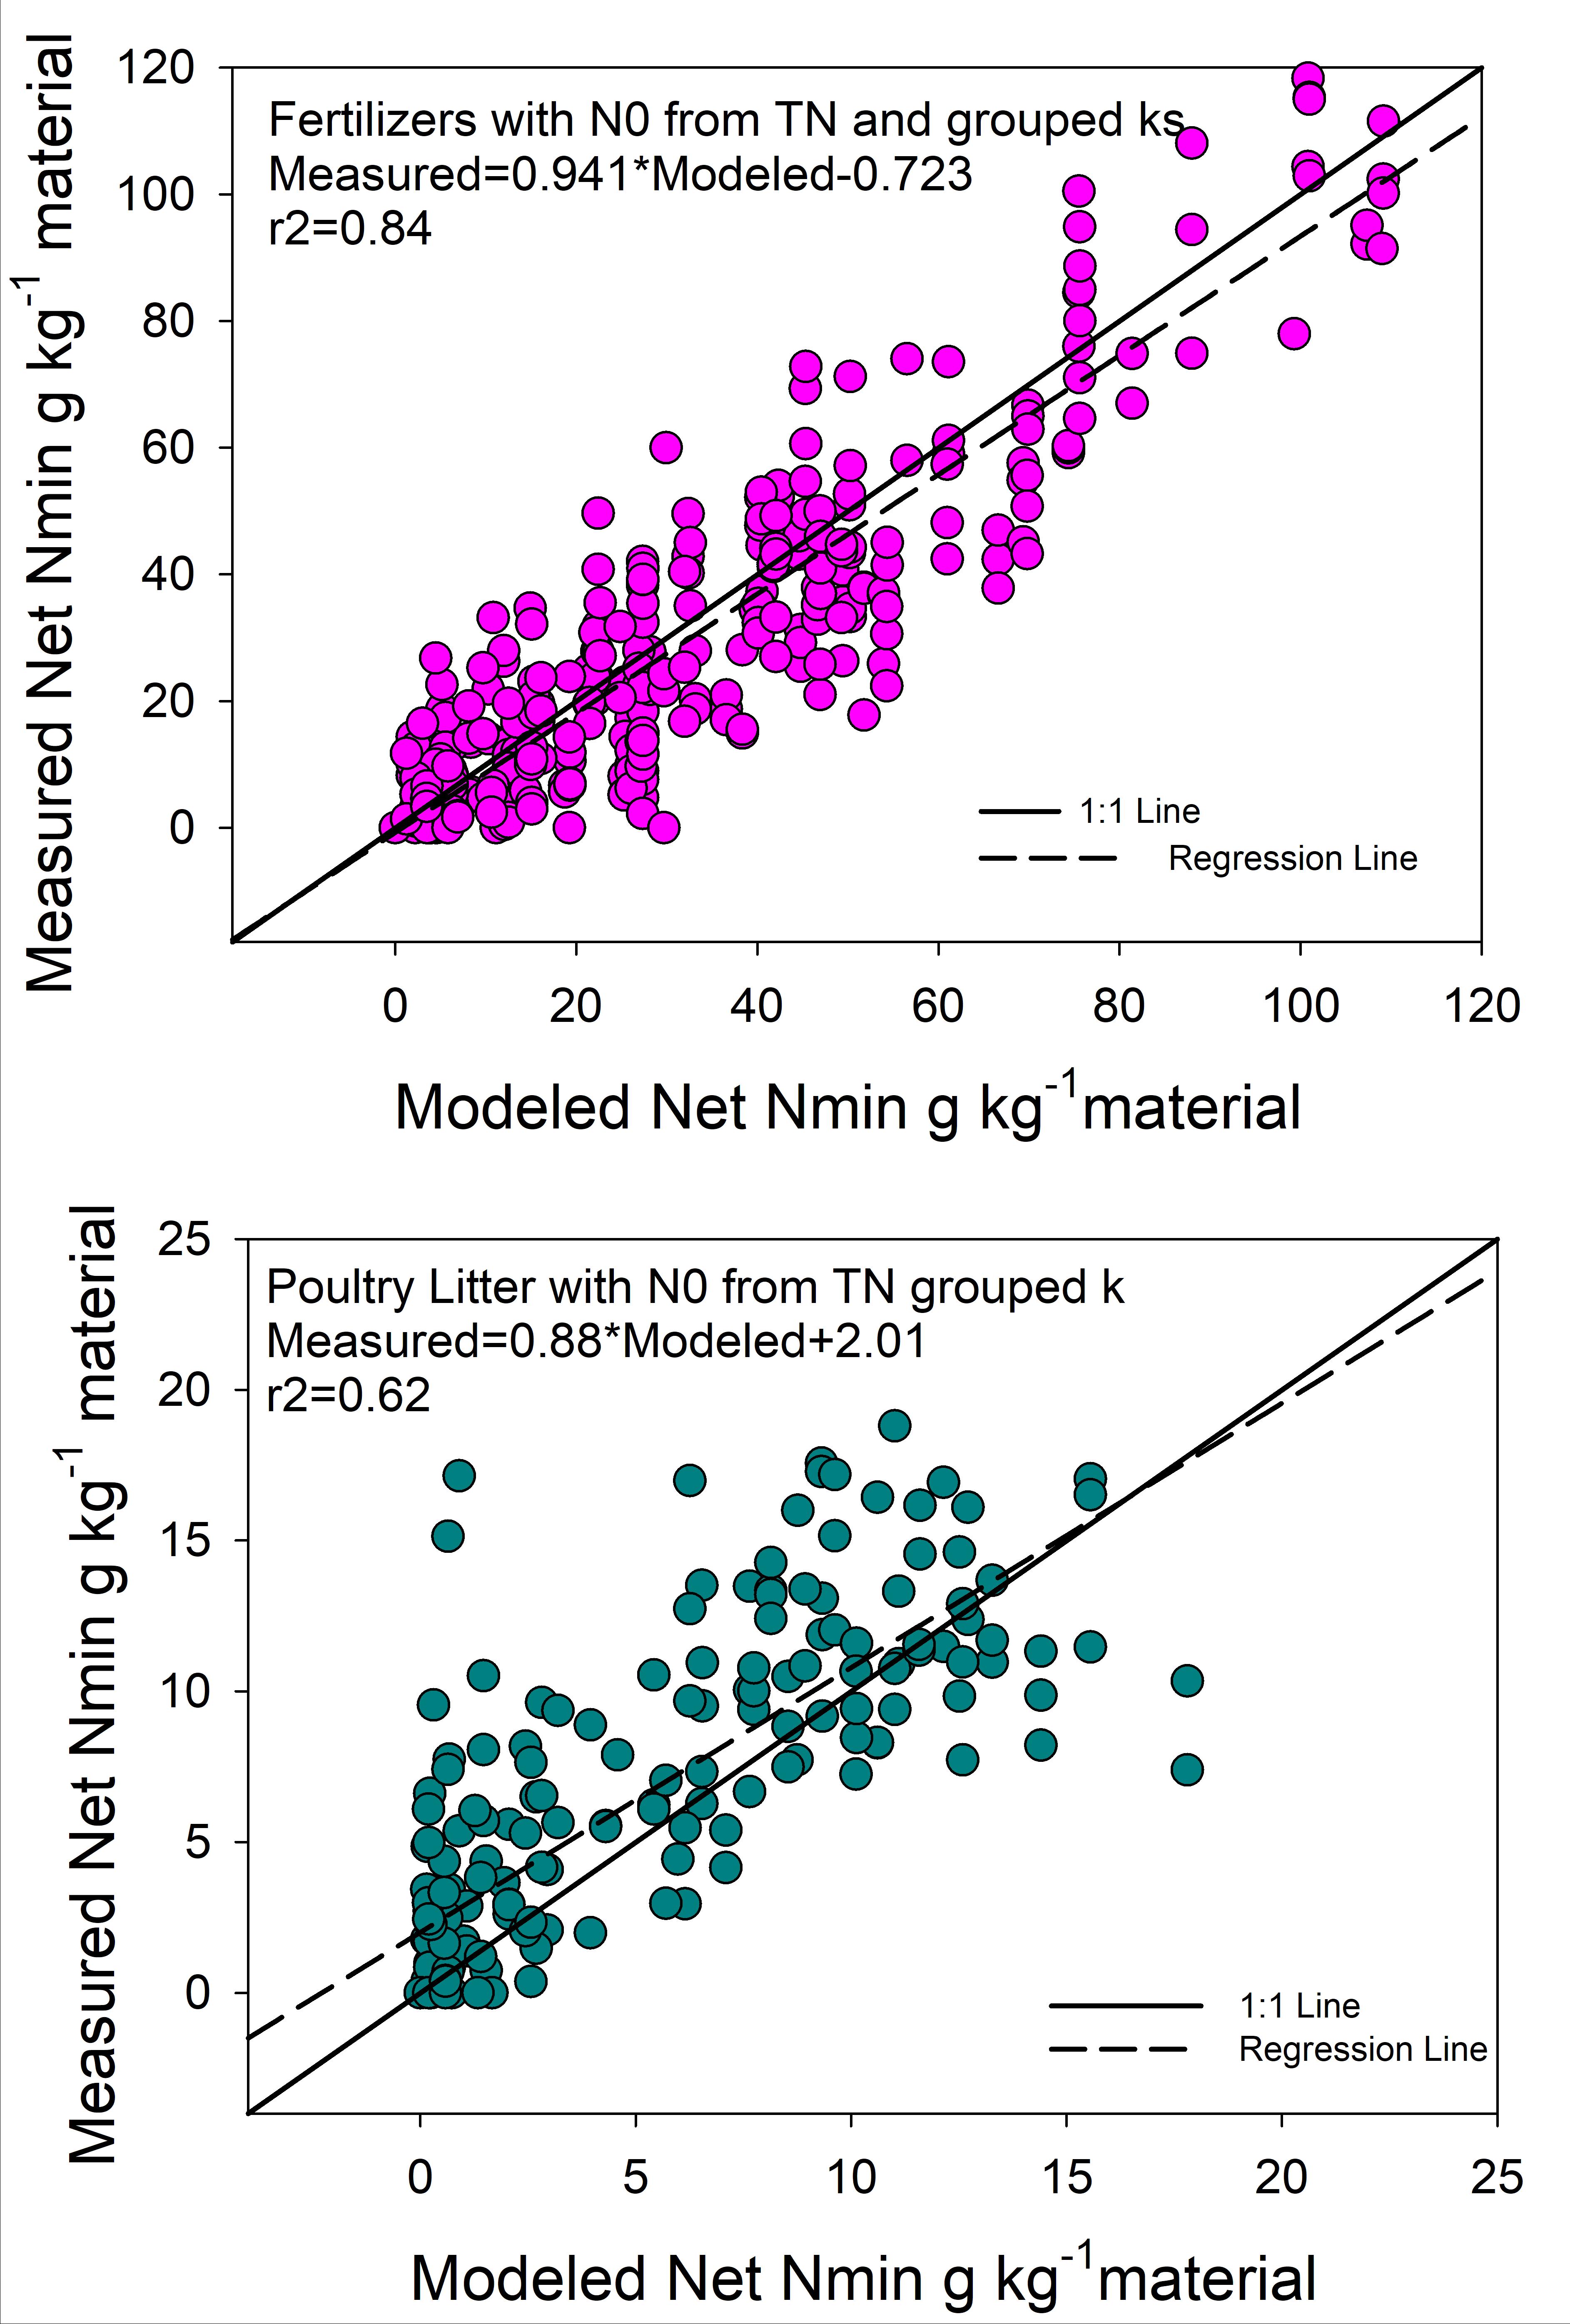
As long-term laboratory experiments can be time consuming to be applicable to farmer use, the pool and rate of N mineralization from these materials needs to be quickly measured or predicted. Therefore, the initial characteristics of the materials were correlated against the pool of mineralizable N and the rate of mineralization (k). The pool of mineralizable nitrogen (N0 g kg-1 material) correlated to both total N (g kg-1) and organic N (g kg-1;r2=0.91), but no characteristics predicted the rate constant, k. To quickly predict the rate of N mineralization (k), poultry litters and fertilizers were grouped by product type and the percent of N mineralized. The fertilizers were split into two groups, those that mineralized greater than 70% of the applied N (n=7) and those mineralized less than 70% (n=9), with respective determinations of k of equal to 0.117 day-1 and 0.0873 day-1. All ks for poultry litter were set at 0.0119 day-1. Using the N0 predicted from total N and using grouped ks, net mineralization was predicted and compared to measured values (Fig. 3).
Figure 2. Plant available nitrogen (initial inorganic nitrogen plus mineralized nitrogen) observed from select fertilizers over 99 day laboratory experiment.
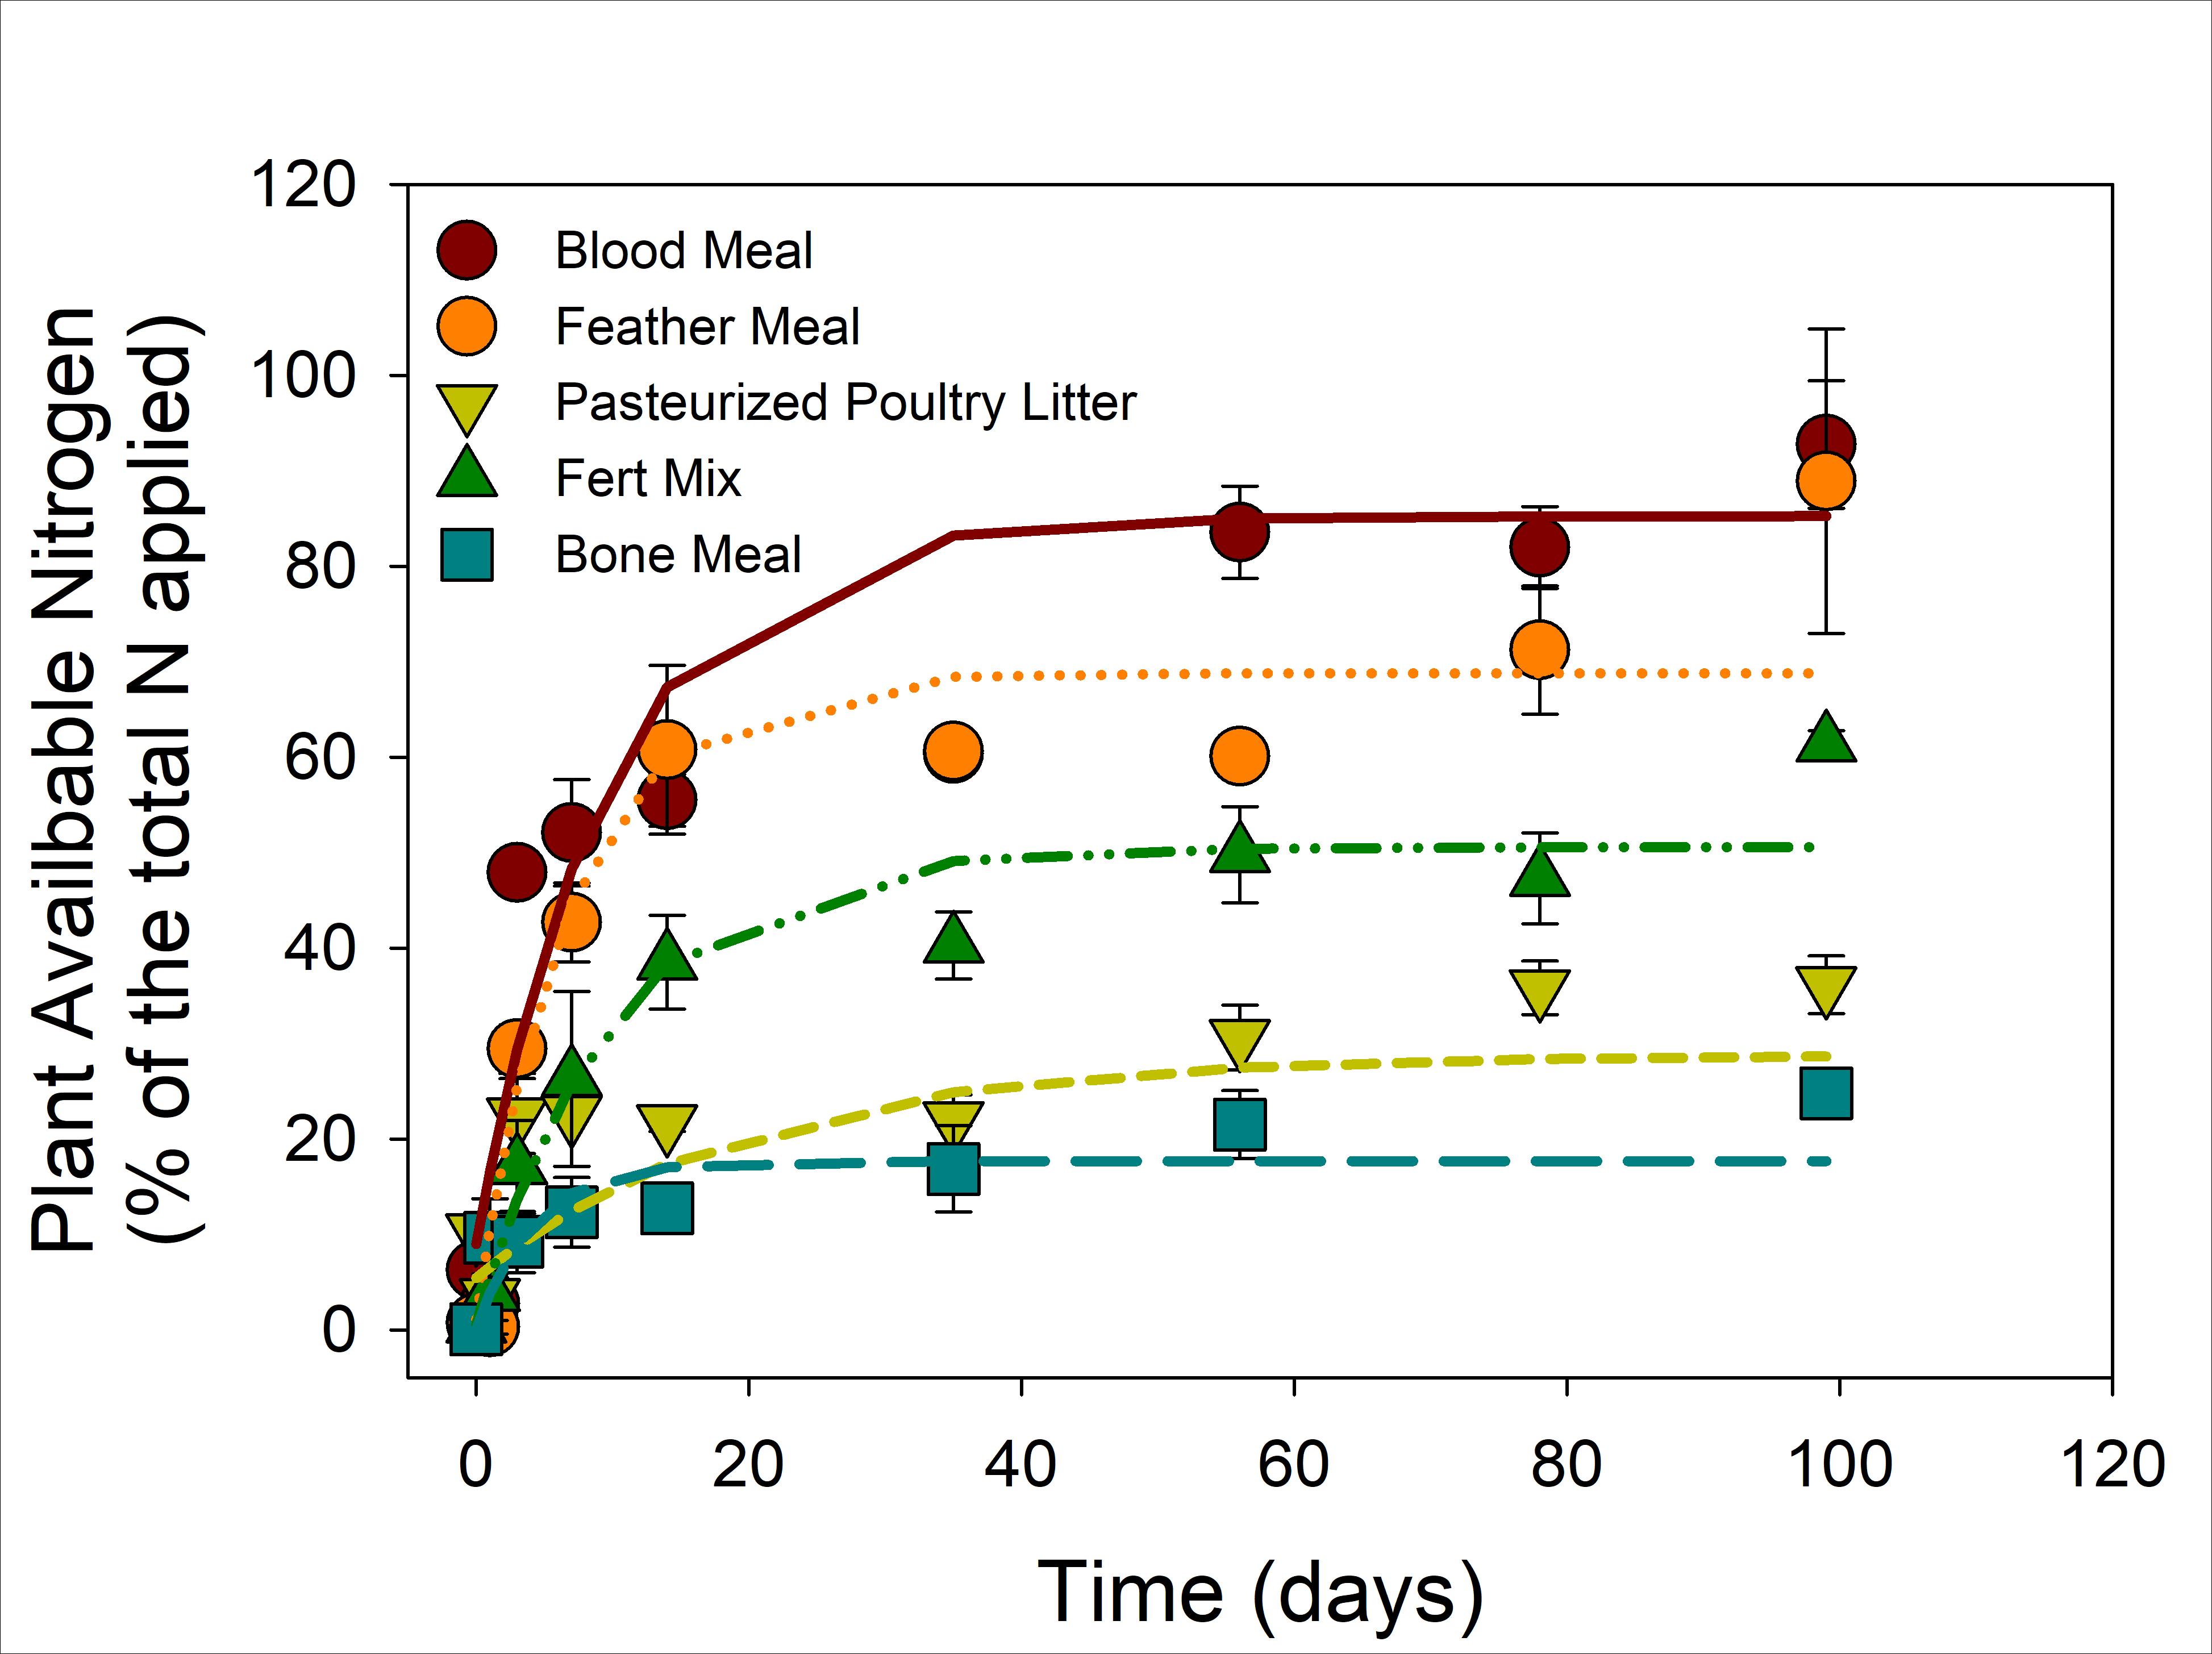
Figure 3. The relationship between the net mineralization measured during 100 d laboratory experiment and the net mineralization predicted (modeled) using the initial total nitrogen of the material to predict the pool of mineralizable nitrogen (N0) and grouped rates of mineralization (k).
b) Effect of soil texture on nitrogen mineralization and ammonia volatilization from applied organic fertilizer
A wide range of N mineralization from the native soil organic matter was observed with the four soils (9.1 to 76.0 mg N kg-1 in 100 d) with significant differences determined between the means (Table 2). All soils showed a linear pattern of N mineralization with the lowest N mineralization observed for the Tifton soil which was low in initial organic matter and high in sand content. Mineralization from soils collected from organically managed plots, Cecil 1 and Cecil2, showed the highest mineralization and highest total carbon (Table 1, 3). This carbon and total N accumulation could be due to the clay content of the soils, but also reflects management and the building of soil organic matter through the use of cover crops, organic fertilizers and composts. These high rates seen in organically managed soils, suggest that more research is needed to better determine N application rates in sustainably managed soils.
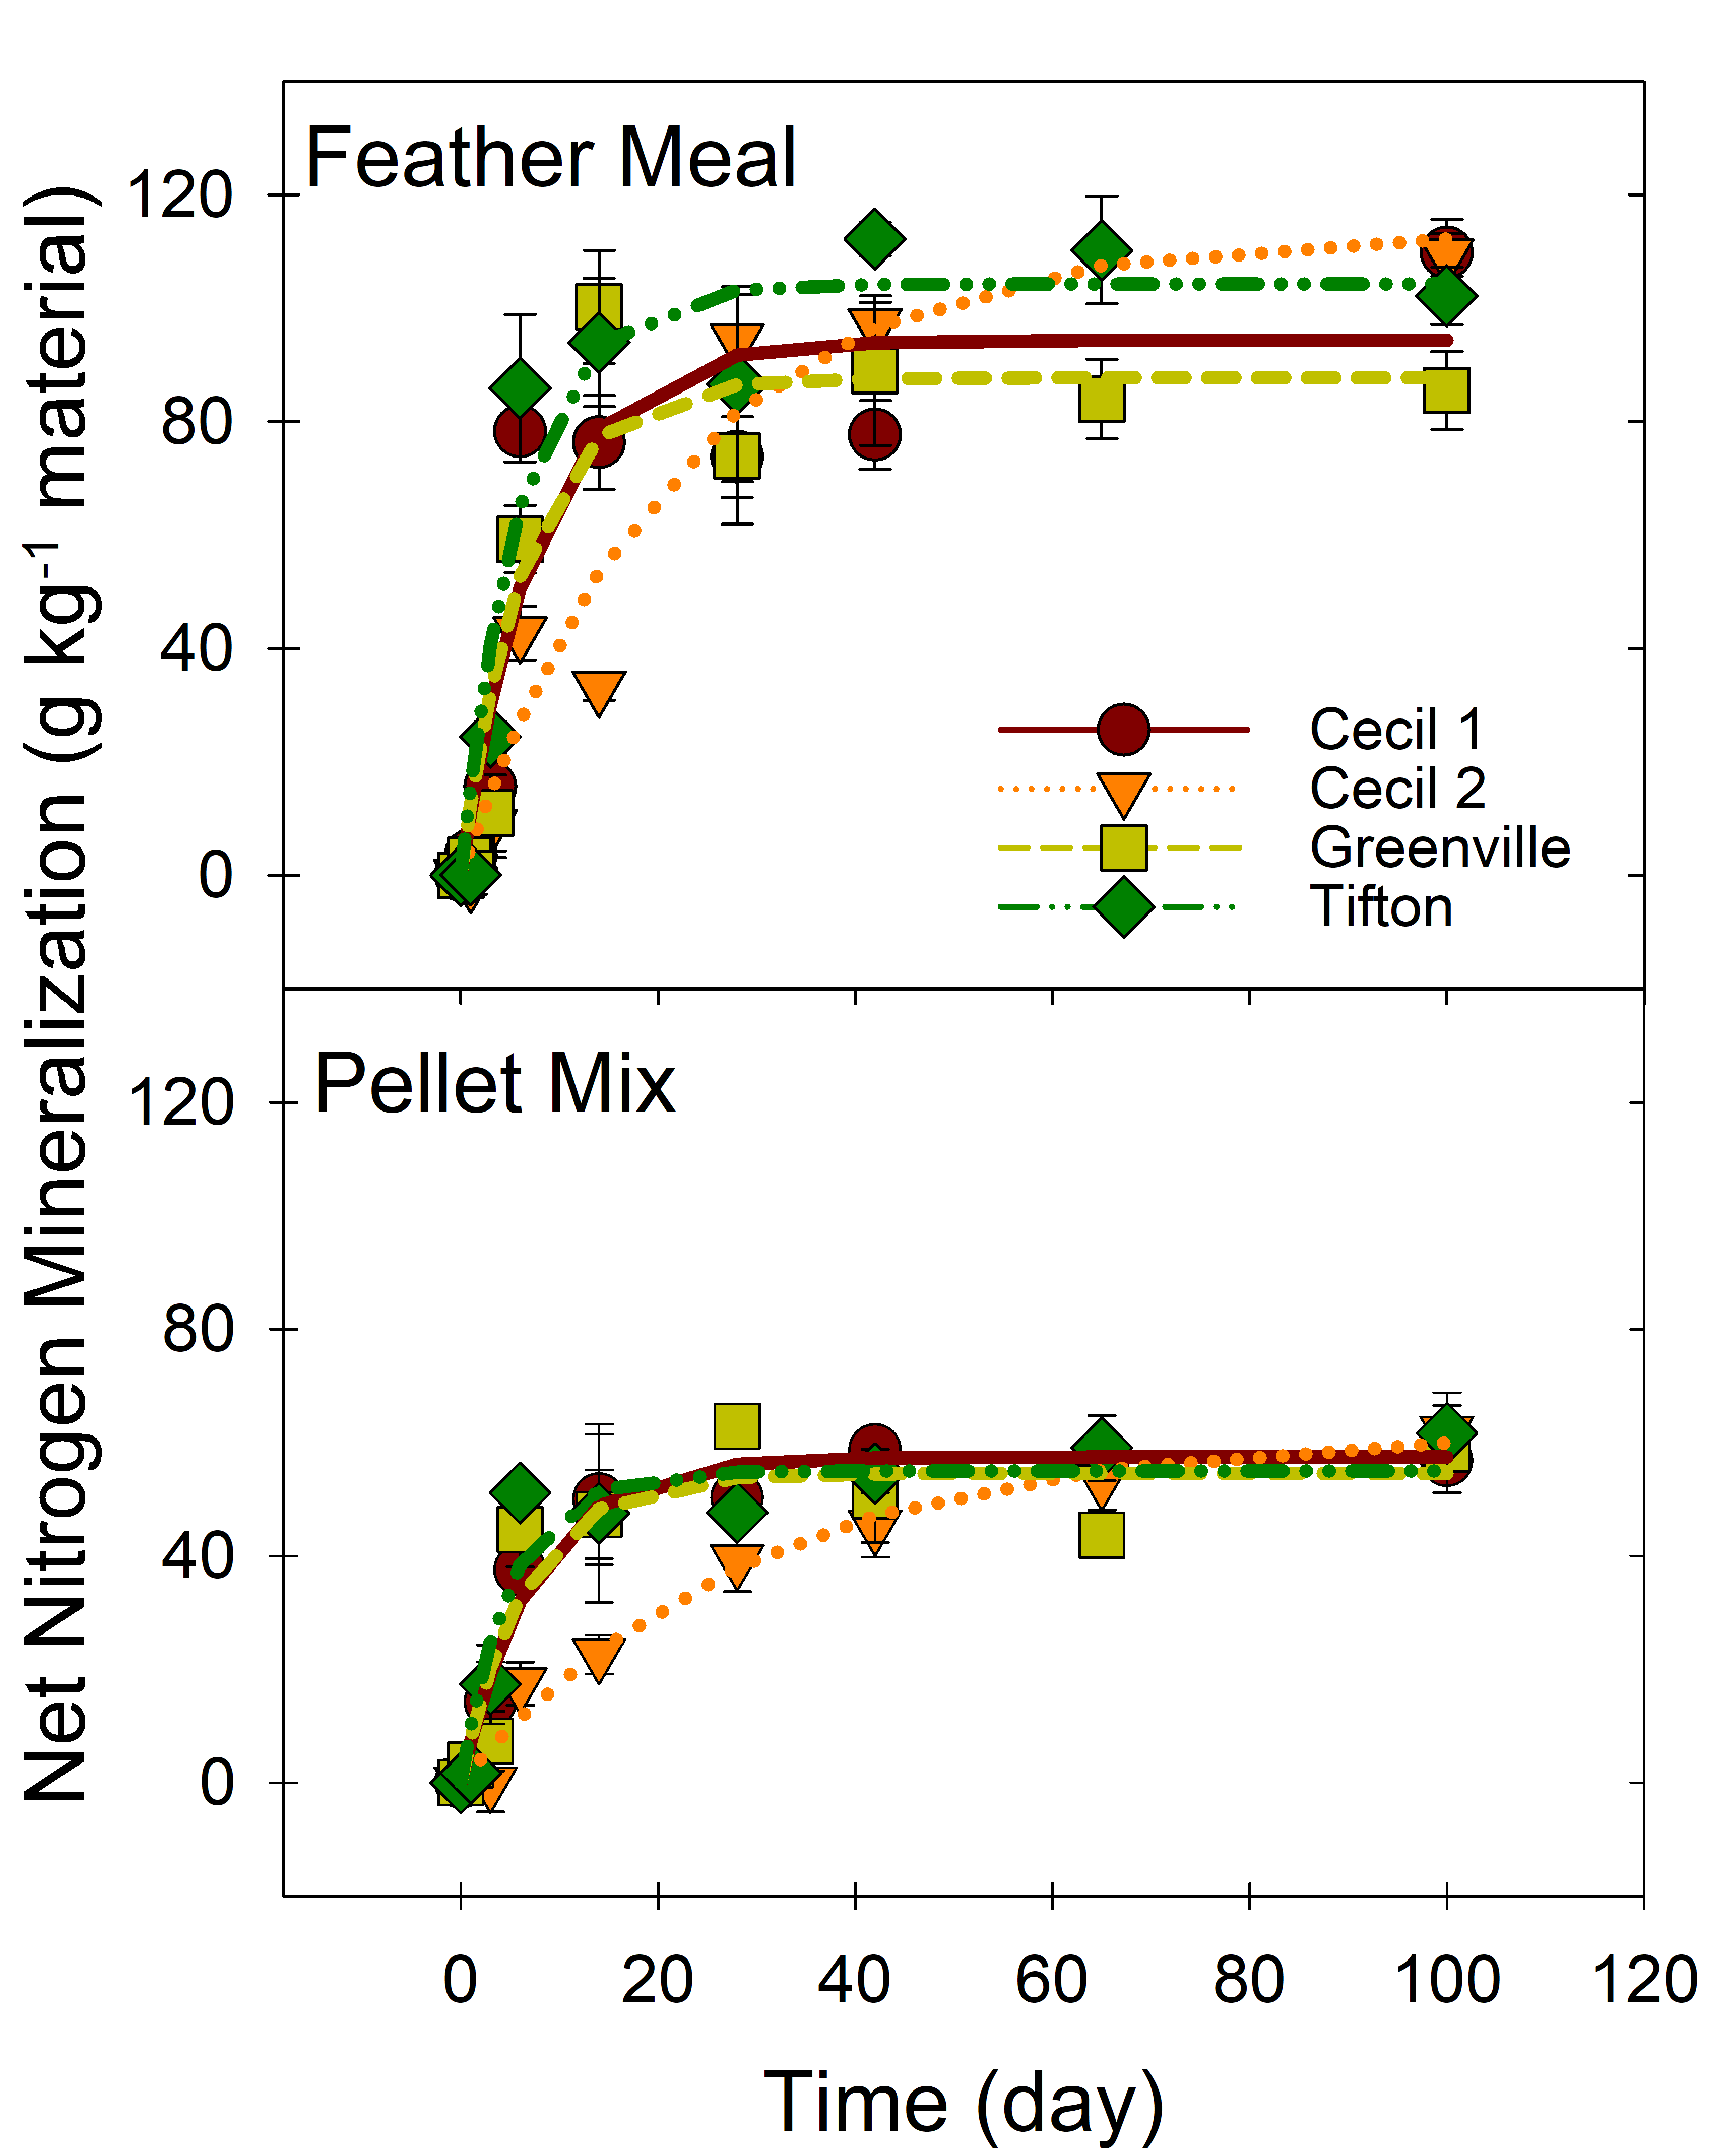
Feather meal and the pelleted fertilizer mix rapidly mineralized after application (Fig. 4). For feather meal, there were no significant differences in the total amount of N mineralized (70% of the applied N) in Cecil 1, Cecil 2, and Tifton soils, but the Greenville soil with the highest clay content (20%) mineralized only 56% of the applied N (Table 2, Figure 4). For the pellet mix, there were no significant differences between soils in the amount of net N mineralized. The Cecil 2 soil lagged in N mineralization for both fertilizers, likely due to its low initial pH (Figure 4.). A single-pool, first-order kinetics model fit for each fertilizer to the cumulative N mineralized in each soil showed no differences between Cecil 1, Greenville and Tifton soils, but identified a lower rate constant of mineralization in Cecil 2 soil.
Table 3. Net N mineralized in control soils and soils amended with feather meal or pellet mix over 100 days. Net N mineralized was calculated by subtracting the initial inorganic N in the control soil, and for the fertilizers the initial inorganic N in the fertilizer, initial inorganic N of the soil, and the net N mineralized measured from the control soil.
|
Soil |
No Fertilizer (Control) |
Feather Meal |
Pellet Mix |
|
|
mg kg-1 dry soil |
g kg-1 dry material (% TN applied) |
|
|
Cecil 1 |
54.2 ± 1 a |
109.8 ± 6 (71) a |
56.7 ± 3 (53) a |
|
Cecil 2 |
76.0 ± 6 b |
109.5 ± 4 (71) a |
57.9 ± 9 (54) a |
|
Greenville |
37.2 ± 3 c |
85.5 ± 7 (56) b |
58.8 ± 8 (55) a |
|
Tifton |
9.1 ± 0.5 d |
102.2 ± 5 (67) a |
61.6 ± 2 (58) a |
*different letters represent means are significantly different according to Fisher’s LSD at p<0.05
Figure. 4. Net N mineralized measured from the feather meal and pelleted poultry litter applied to four different soils.
3. Development of a web-based plant available nitrogen (PAN) calculator
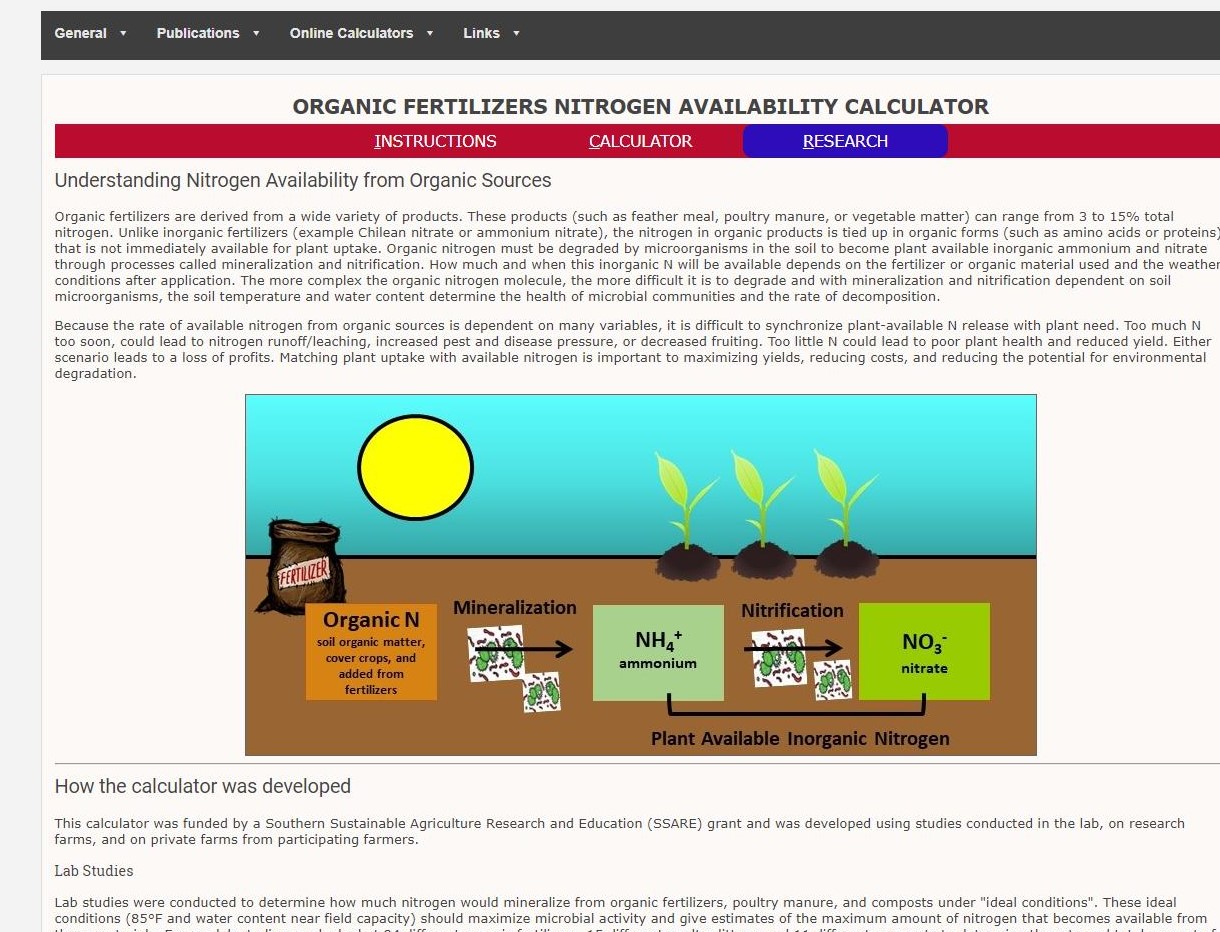
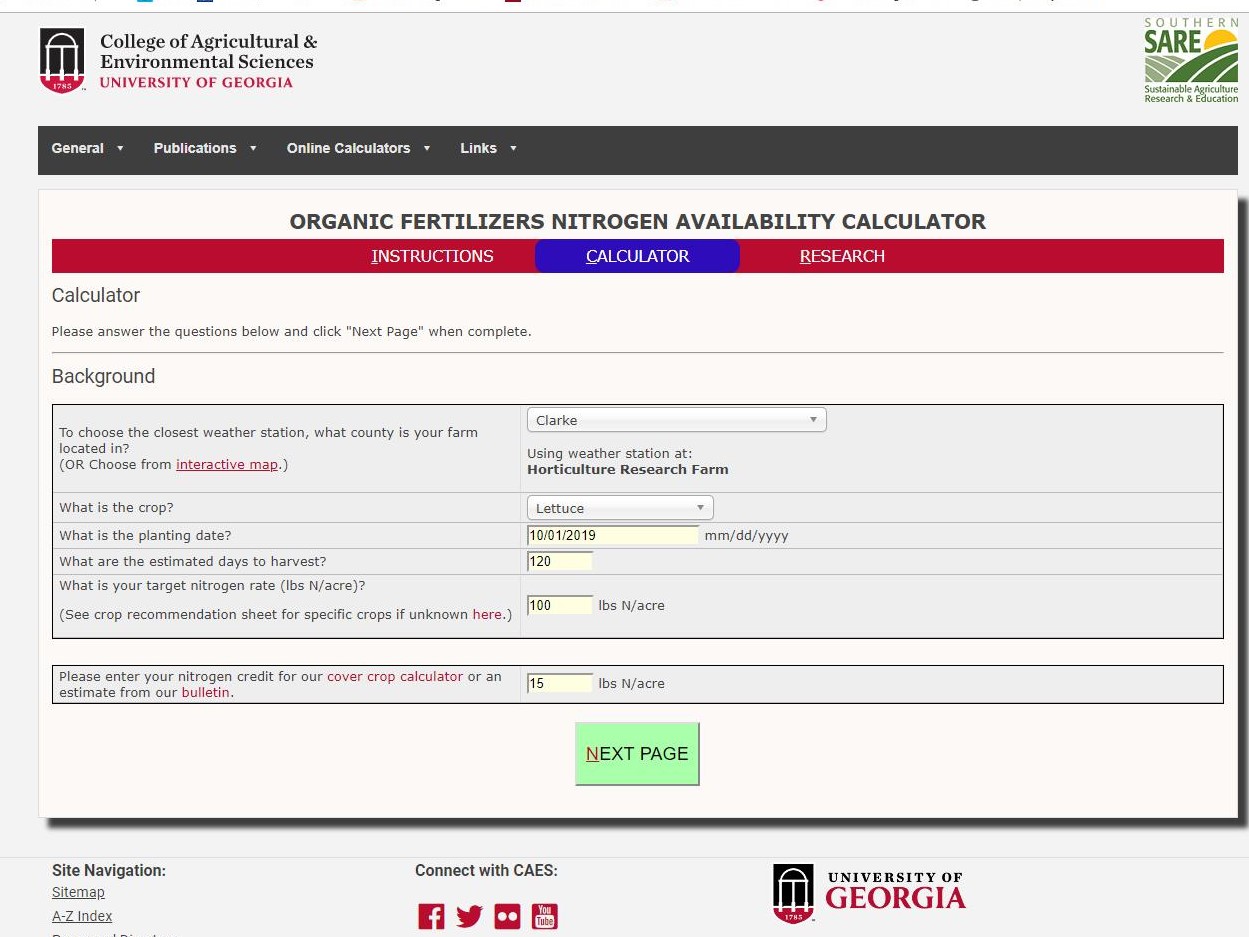
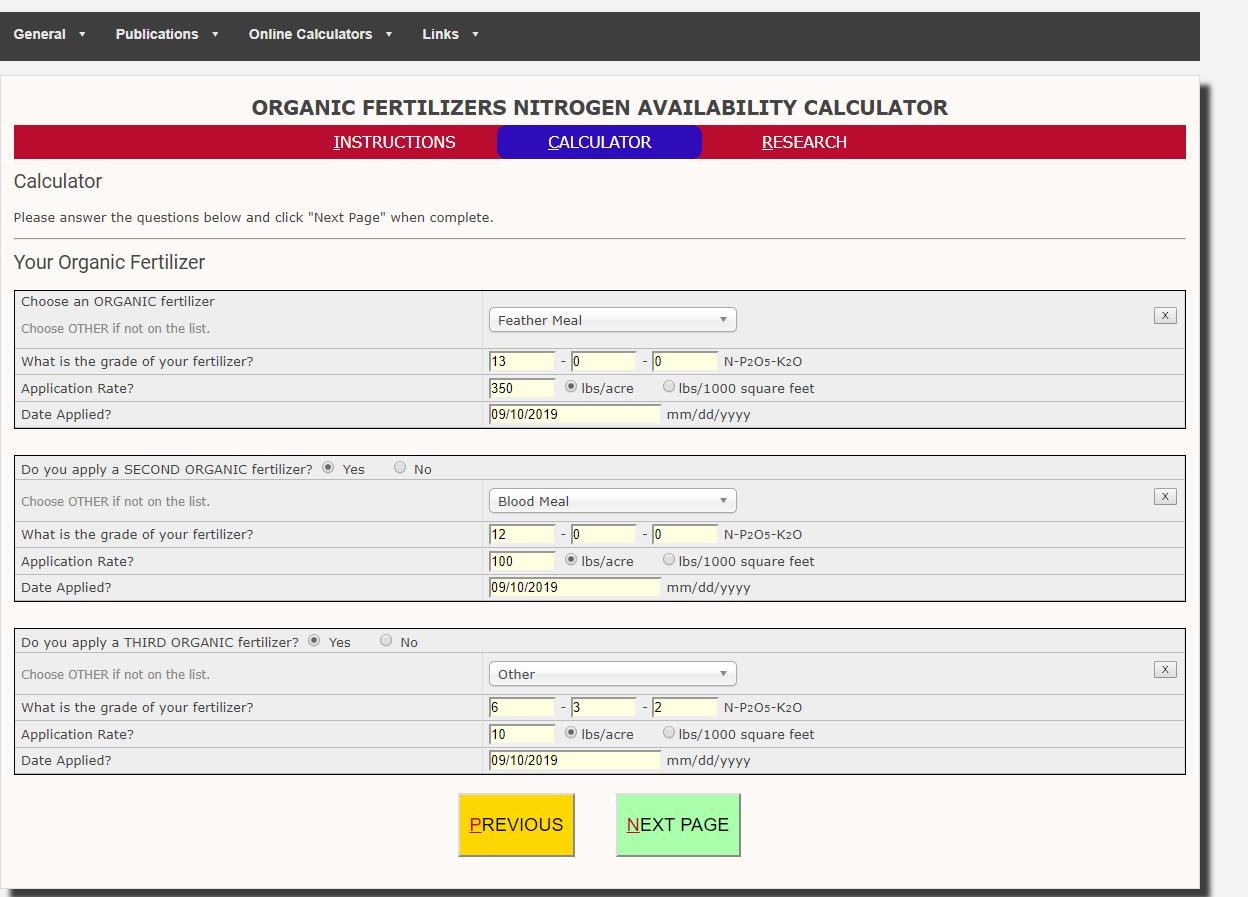
The web-based calculator, the “Organic Fertilizers Nitrogen Availability Calculator”, is housed through the University of Georgia Agriculture and Environmental Services Laboratory website and available at: http://aesl.ces.uga.edu/calculators/nitrogen/. The website is divided into three sections: Instructions, Calculator, and Research. The “Instructions” tab welcomes users to the calculator, explains what to expect, and provides general instructions (Pic.3). The “Research” tab explains how the calculator was developed but also provides background information to understand N mineralization from organic fertilizers, as well as useful publications and resources to understand soil fertility. The “Calculator” is where users input data and walk through to the PAN results (Pic.4-6). The website design and inputs/outputs of the calculator were tailored based on farmer input.
The Calculator was created using the existing structure of our Cover Crop Nitrogen Availability Calculator (http://aesl.ces.uga.edu/mineralization/) for temperature and water content modifications to mineralization. For the organic fertilizers and poultry litters, the rate of mineralization (ks) and pools of mineralizable nitrogen (N0) were determined as described in Objective 1. The pool of mineralizable nitrogen (N0) is predicted by the initial total nitrogen of the material. The rate of mineralization (k) is 0.0119 d-1 for poultry litters, 0.0873d-1 for materials with less than 70% of total nitrogen mineralized (such as pelleted poultry litters), and 0.117d-1 for materials with greater than 70% of total nitrogen mineralized (such as blood, feather, and fish meal) as determined in the laboratory experiment. The Calculator uses 5-year historical averages of soil water content and temperature from a weather station (of the Georgia Automated Environmental Monitoring Network) near the producer’s. The calculator allows for multiple organic fertilizers, poultry litter applications and inorganic fertilizer applications (Fig 5). While only N mineralization is estimated, total N, P , and K applied is given in the output.
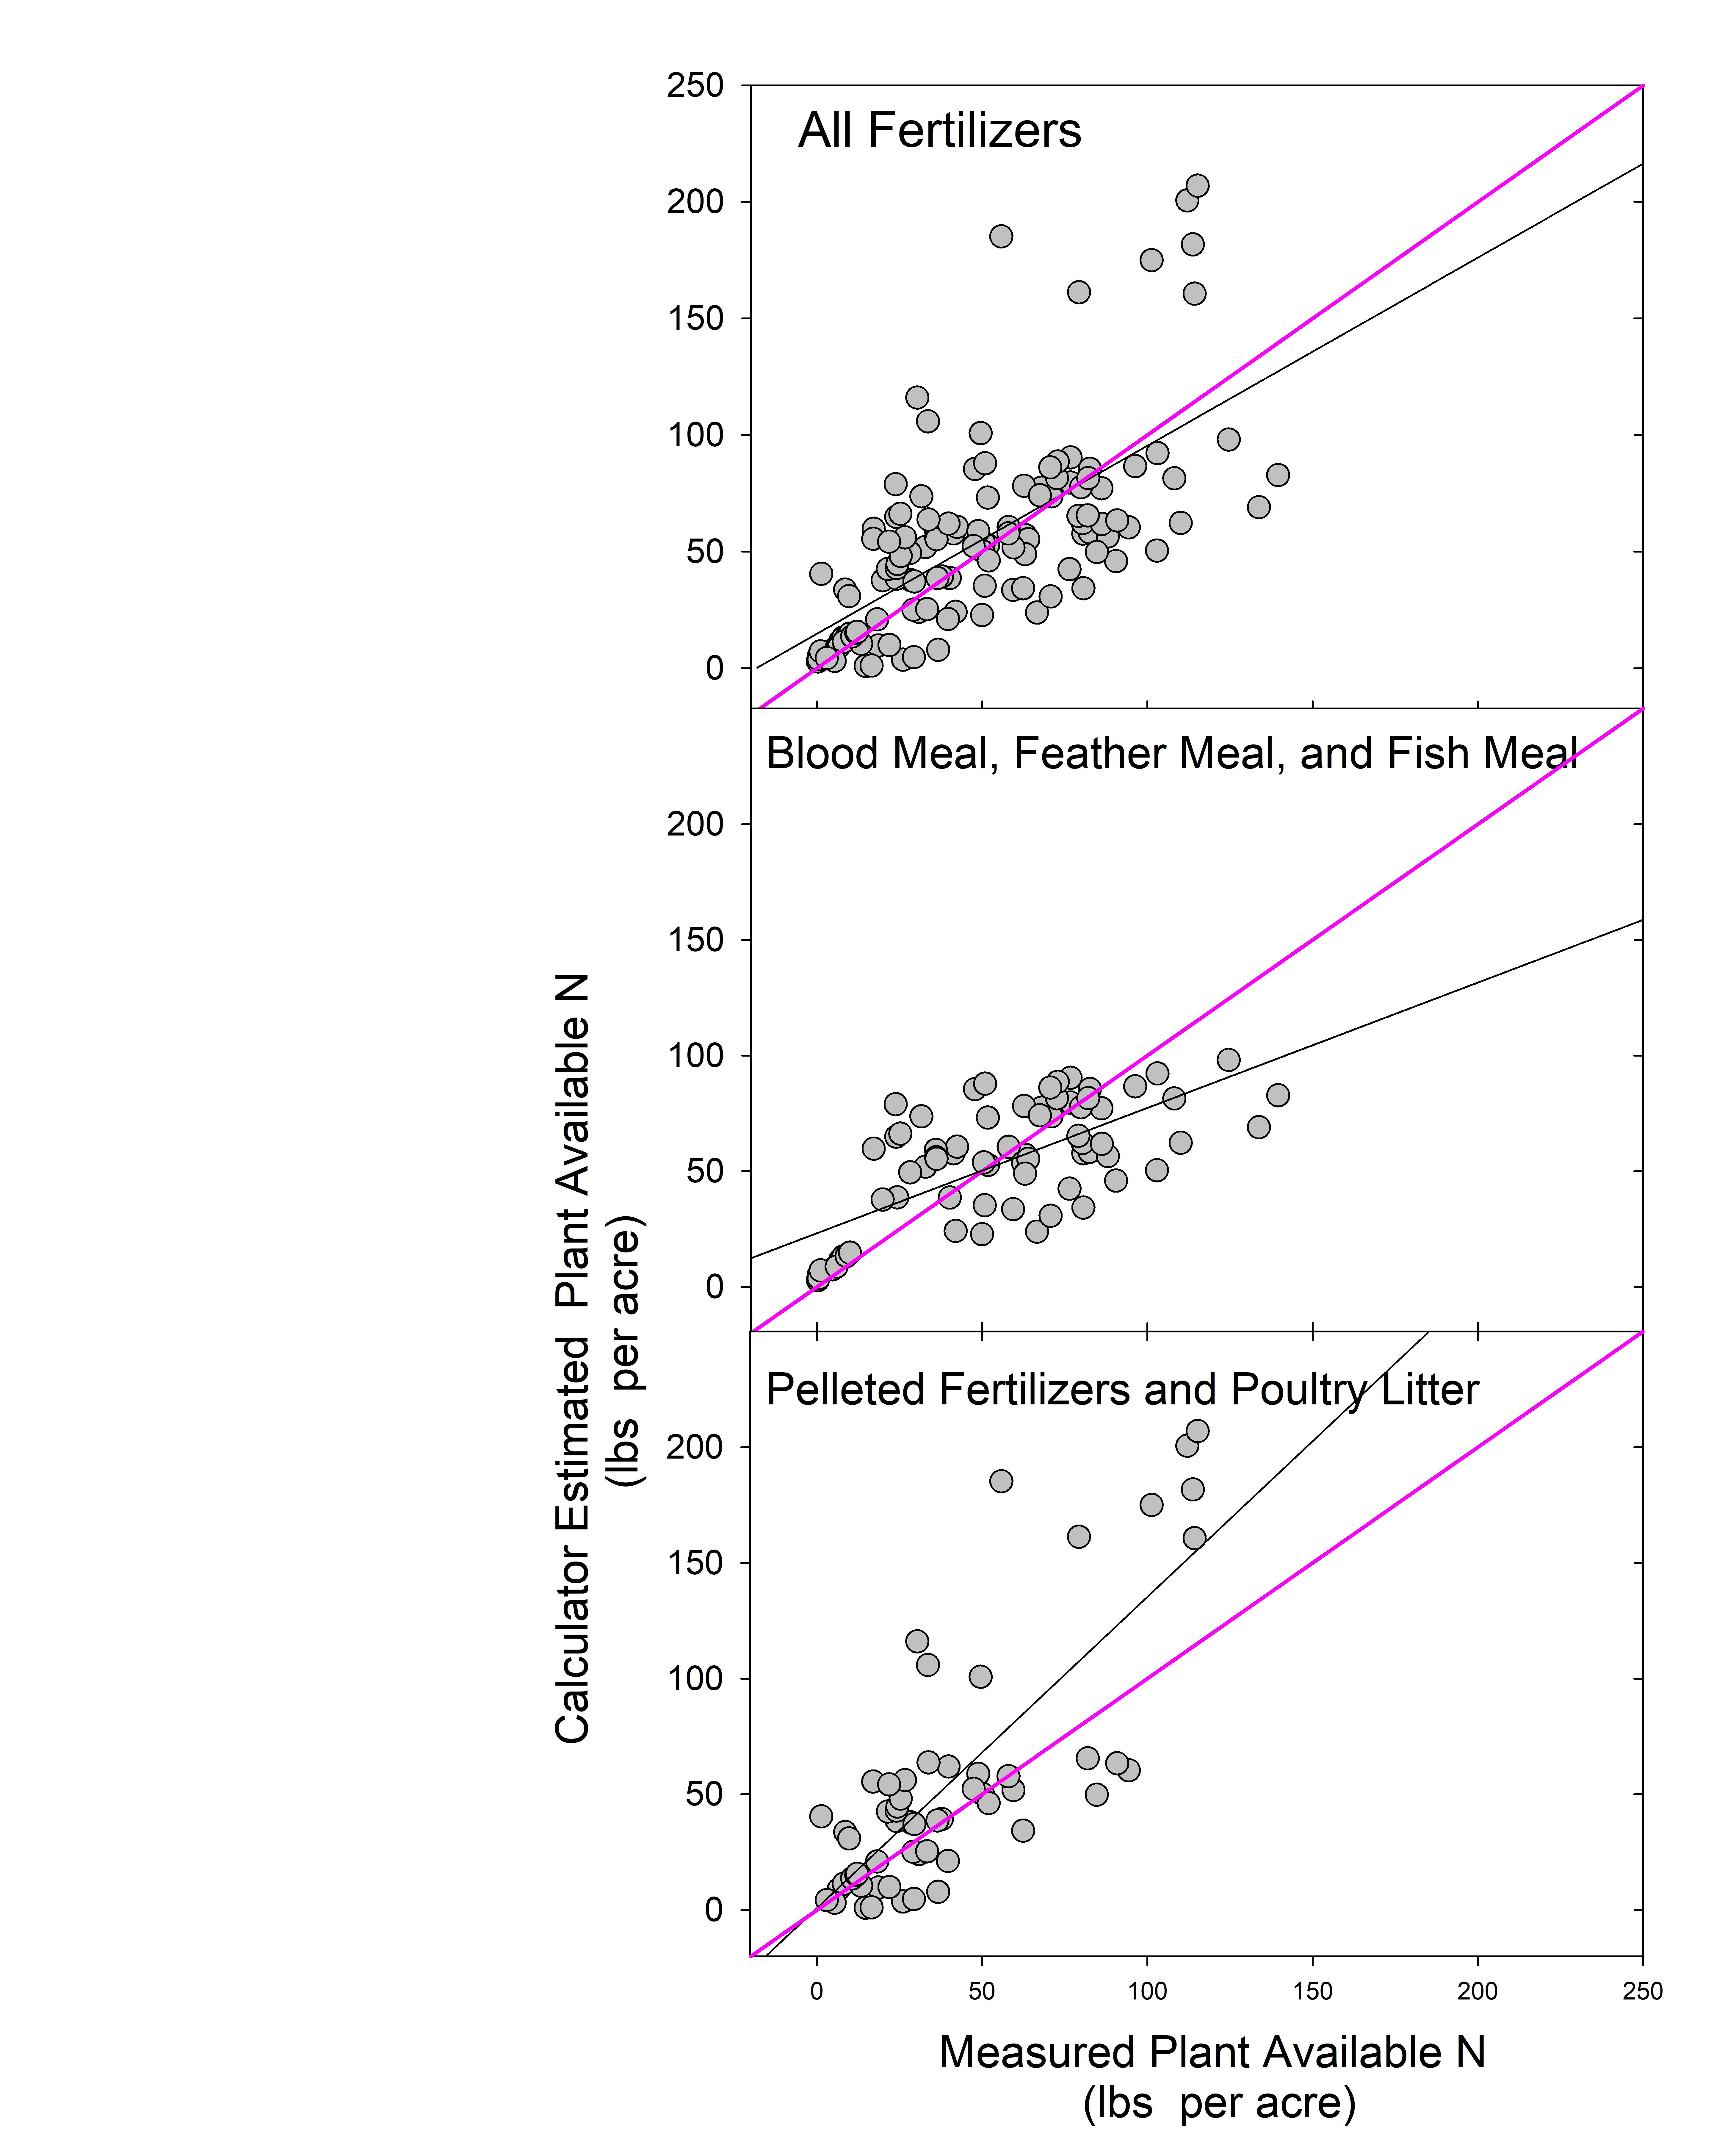
Data collected at the UGA Durham Horticulture Farm and at participating farms from 2016-2018 (Objective 40) were used to test the accuracy of the Calculator. Low recovery of Chilean Nitrate (53% or less of the total N applied) in the tomato 2017 season led to the removal of the study from calculator validation. Overall, the calculator led to good estimations of plant available N from the fertilizers (Fig. 5, 6), and showed the general trend in N release. The calculator tended to under predict N for the fertilizers with the most rapid release (blood, feather, and fish meal) and over predict N for the pelleted fertilizer products. This may reflect difficulties in having grouped mineralization constants, or the differences that temperature and water content may play in mineralization. Also, physical differences (finely ground versus pelleted materials) may impact availability to microorganisms and N mineralization. The calculator provides estimations for multiple product applications (Fig.5), which can aid farmers who fertilize using combinations. This may be especially important for farmers fertilizing to meet phosphorus and potassium demands as well. The calculator needs further validation but provides a valuable tool for farmers to understand N mineralization and provides a much better estimation of nitrogen availability than currently available.
Picture 3. Research tab of the web-based calculator.
Picture 4. Calculator tab and first page of input for the web-based calculator.
Picture 5. Calculator input for fertilizers, allowing the selection of multiple fertilizers.
Picture 6. Output from the calculator, with plant date, target nitrogen rate, and the predict nitrogen mineralization from the selected material and rate.
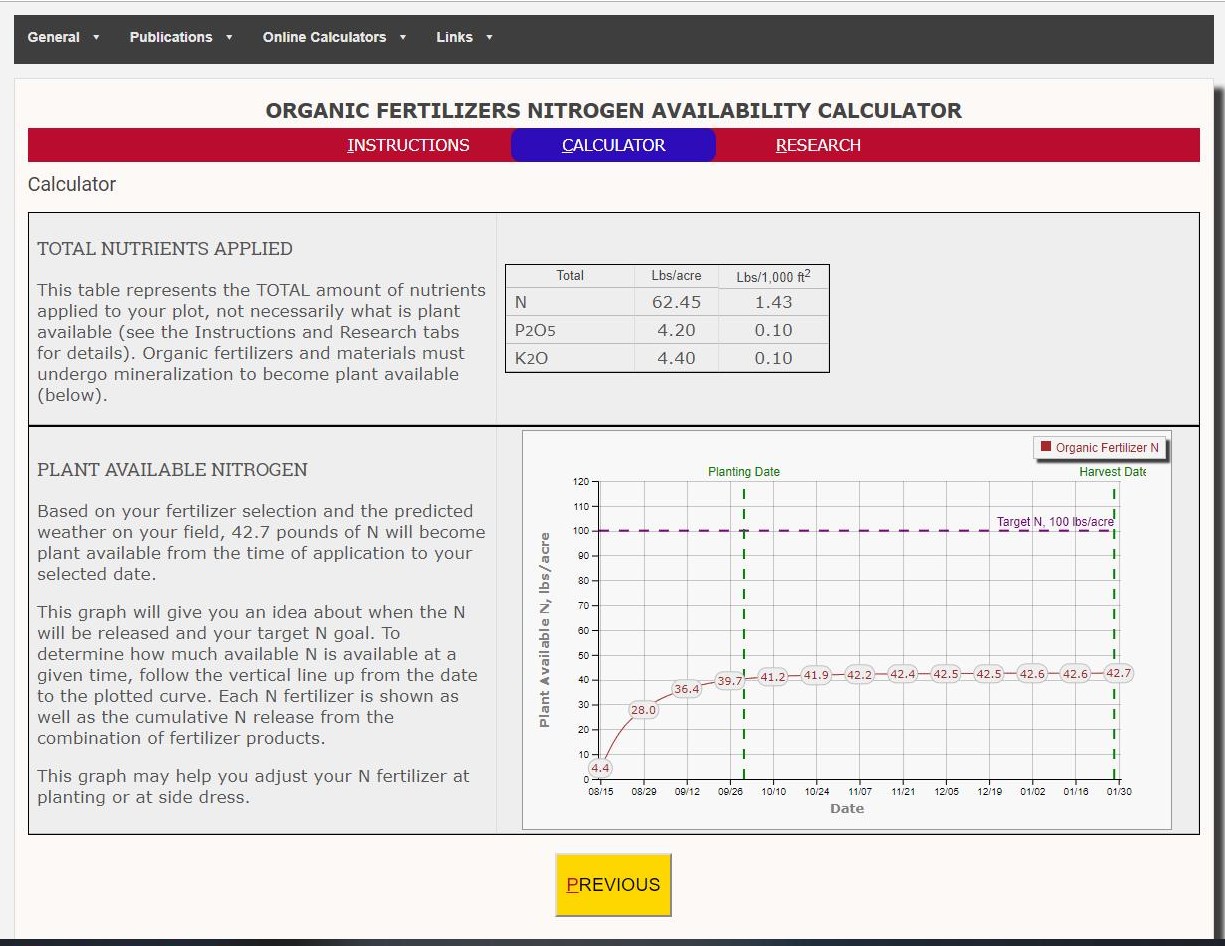
Figure 5. Measured versus calculator values of plant available nitrogen under field conditions for the blood meal applied at the UGA Research Farm (115 lbs per acre total nitrogen applied) and the Emory at Oxford Farm (80 lbs per acre from feather meal and 30 lbs per acre from bone meal) for the broccoli 2017 season.
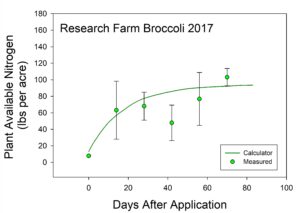
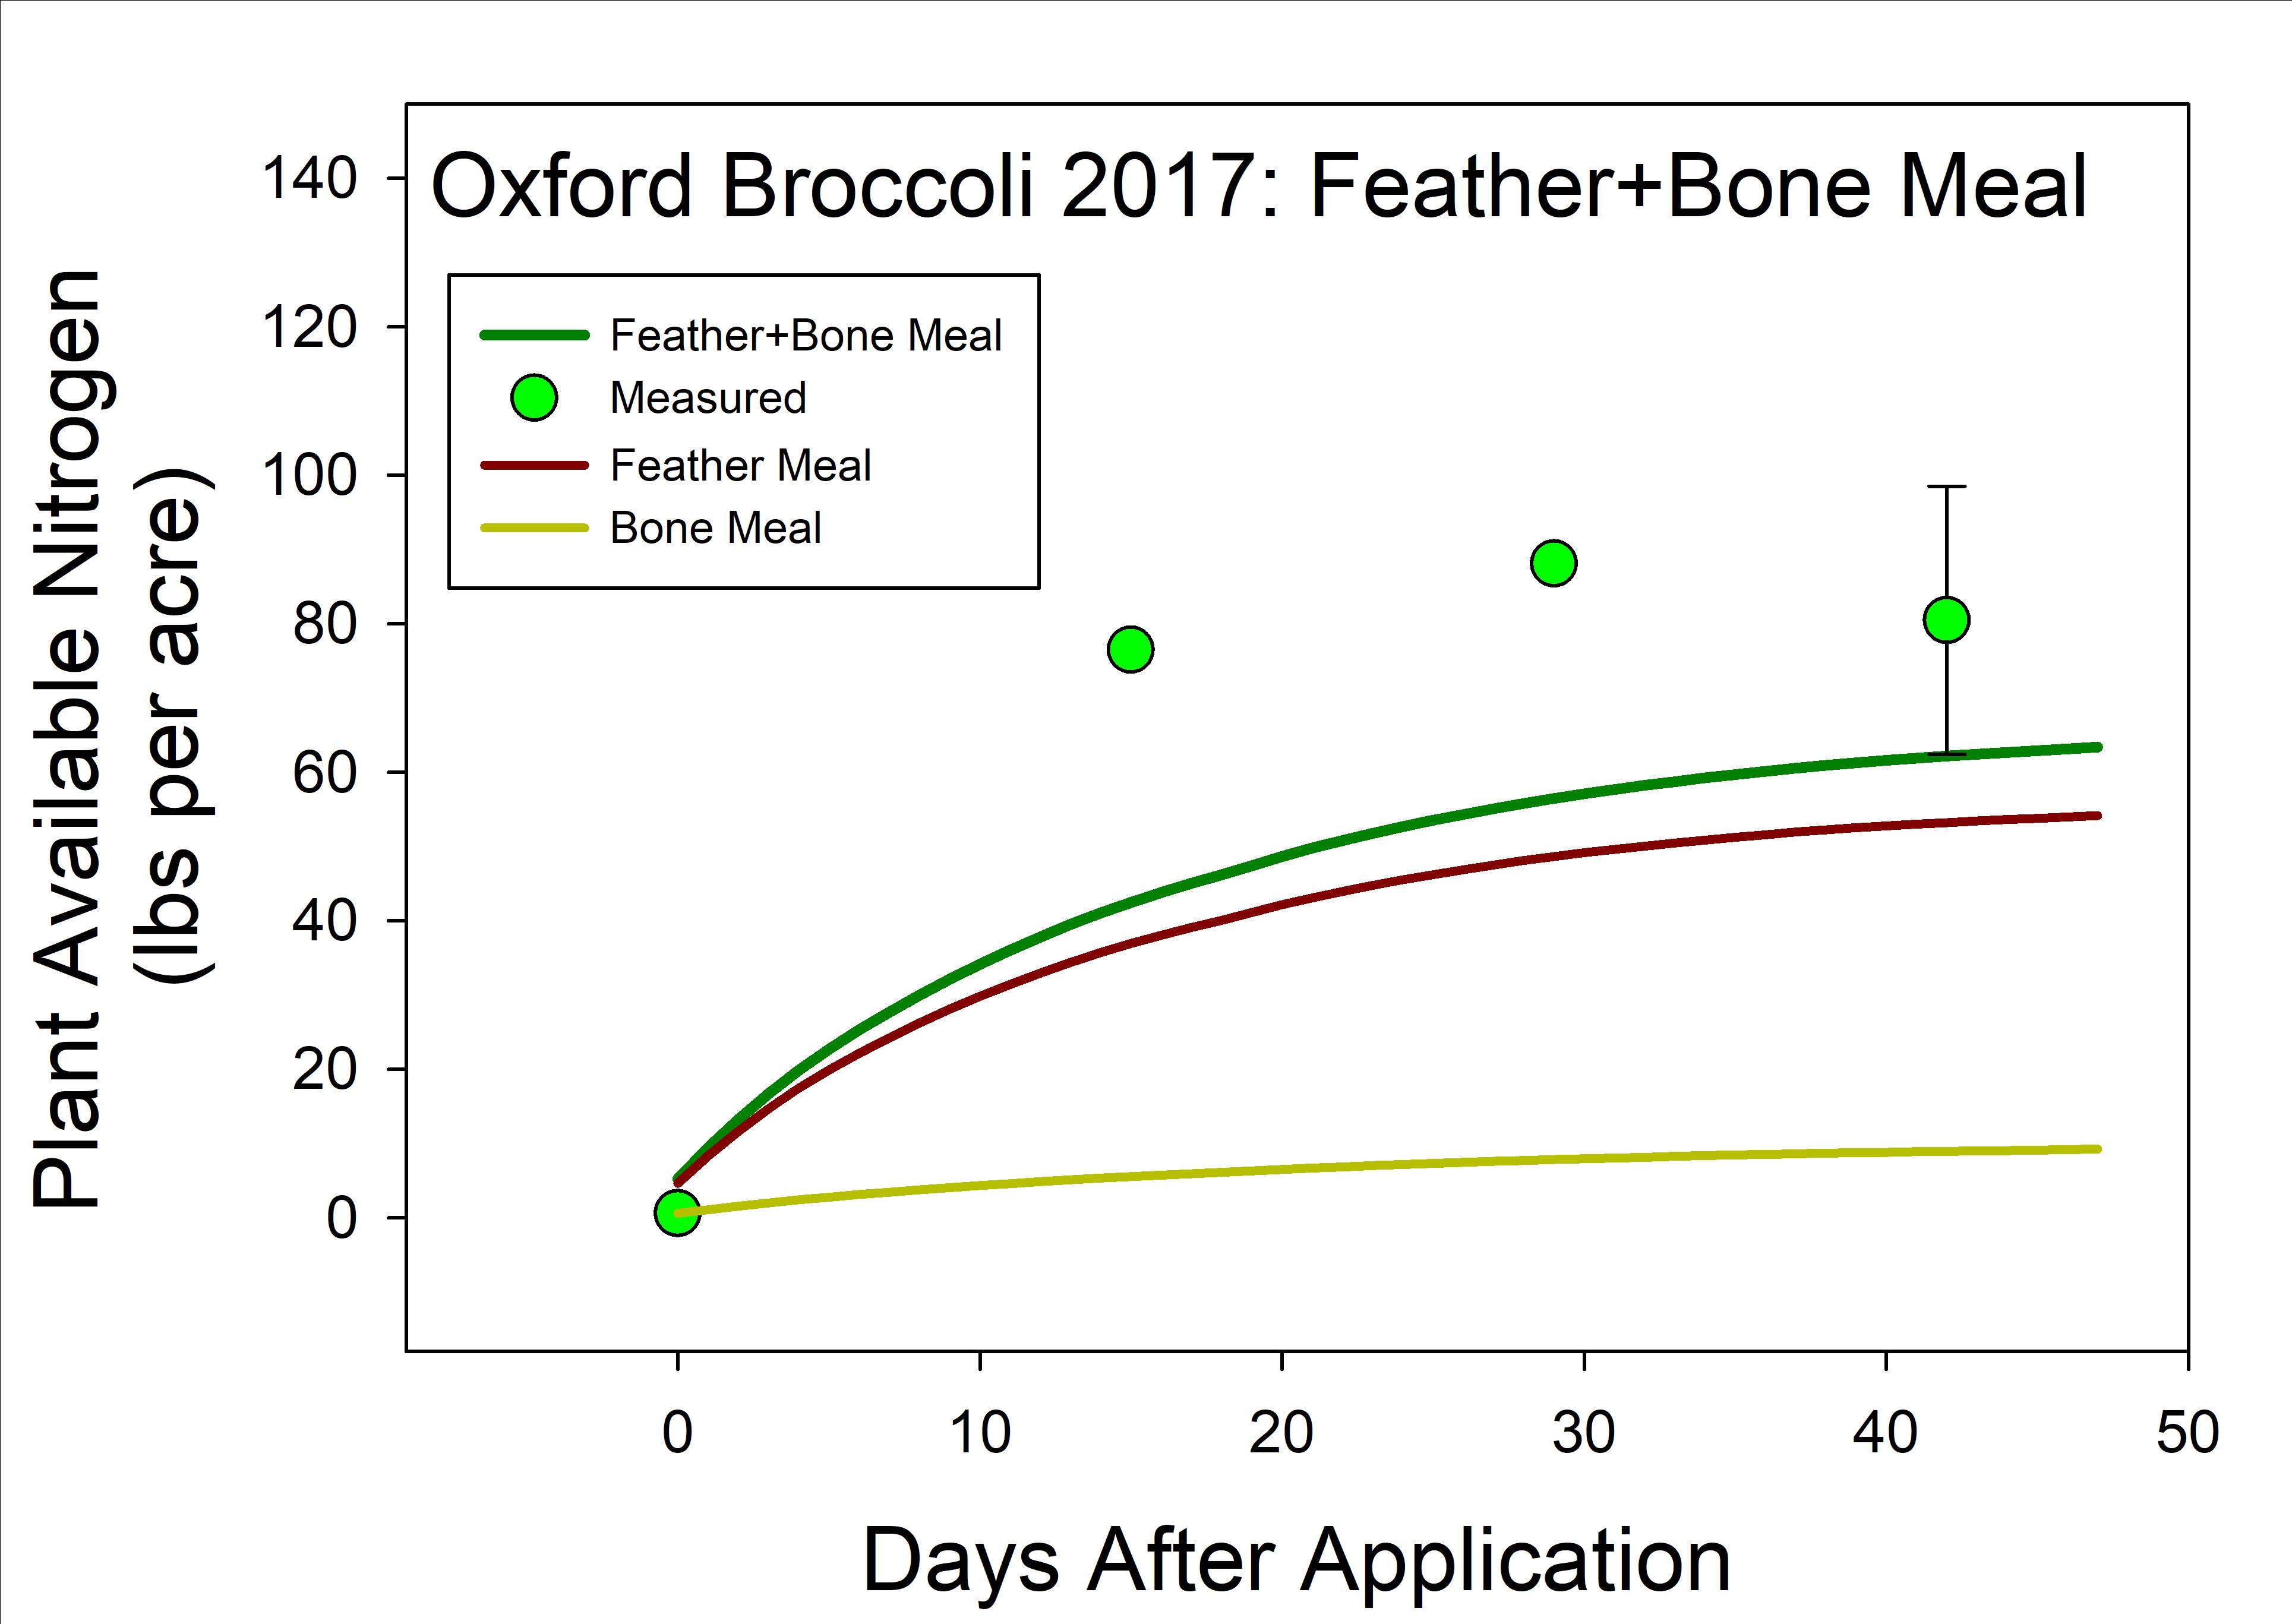
Figure 6. Measured versus calculator values of plant available nitrogen under field conditions for all fertilizers, the blood, feather and fish meal, and the pelleted fertilizer products and poultry litter for all field studies conducted during the project (2016-2018).
4. Nitrogen mineralization from organic materials under field conditions: research farm and participating farms
Research Farm: University of Georgia Durham Horticulture Farm 2016-2017
The weather data collected for each season (example Pic. 2) included soil and air temperature, rainfall, relative humidity, and soil water content. Due to the use of irrigation, soil cores had to be hand watered to maintain similar soil water content as the soil outside the cores. Soil temperature remained around 30oC (86oF) for both tomato seasons while both broccoli seasons saw a steady decline in soil temperature to 10oC (50oF) to the end of the season. Lower than average rainfall and drought conditions occurred in 2016 with only 26 cm of rain measured during the tomato study period and 9 cm of rain measured during the broccoli study period. In 2017, 57 cm of rain were measured during the tomato study and 30 cm in the broccoli study.
During the first tomato season (2016), very high N mineralization was measured from the control plots with almost 120 mg N kg soil-1 in the 12-week study (Fig.7). Prior to this experiment, the land was heavily cropped in legumes with the addition of feather meal fertilizers. For future seasons, a sudan grass cover crop was grown and removed, and the remaining three season were carried out on the same plots (broccoli 2016, tomatoes 2017, and broccoli 2017; Fig. 1) to reduce inorganic N derived from the soil organic matter. The plant available N from soil organic matter mineralization in this study highlights the ability of cover crops to supply N and recycle large amounts of N for crop use. However, it also highlights how quickly those reserves can be depleted with harvest and crop removal.
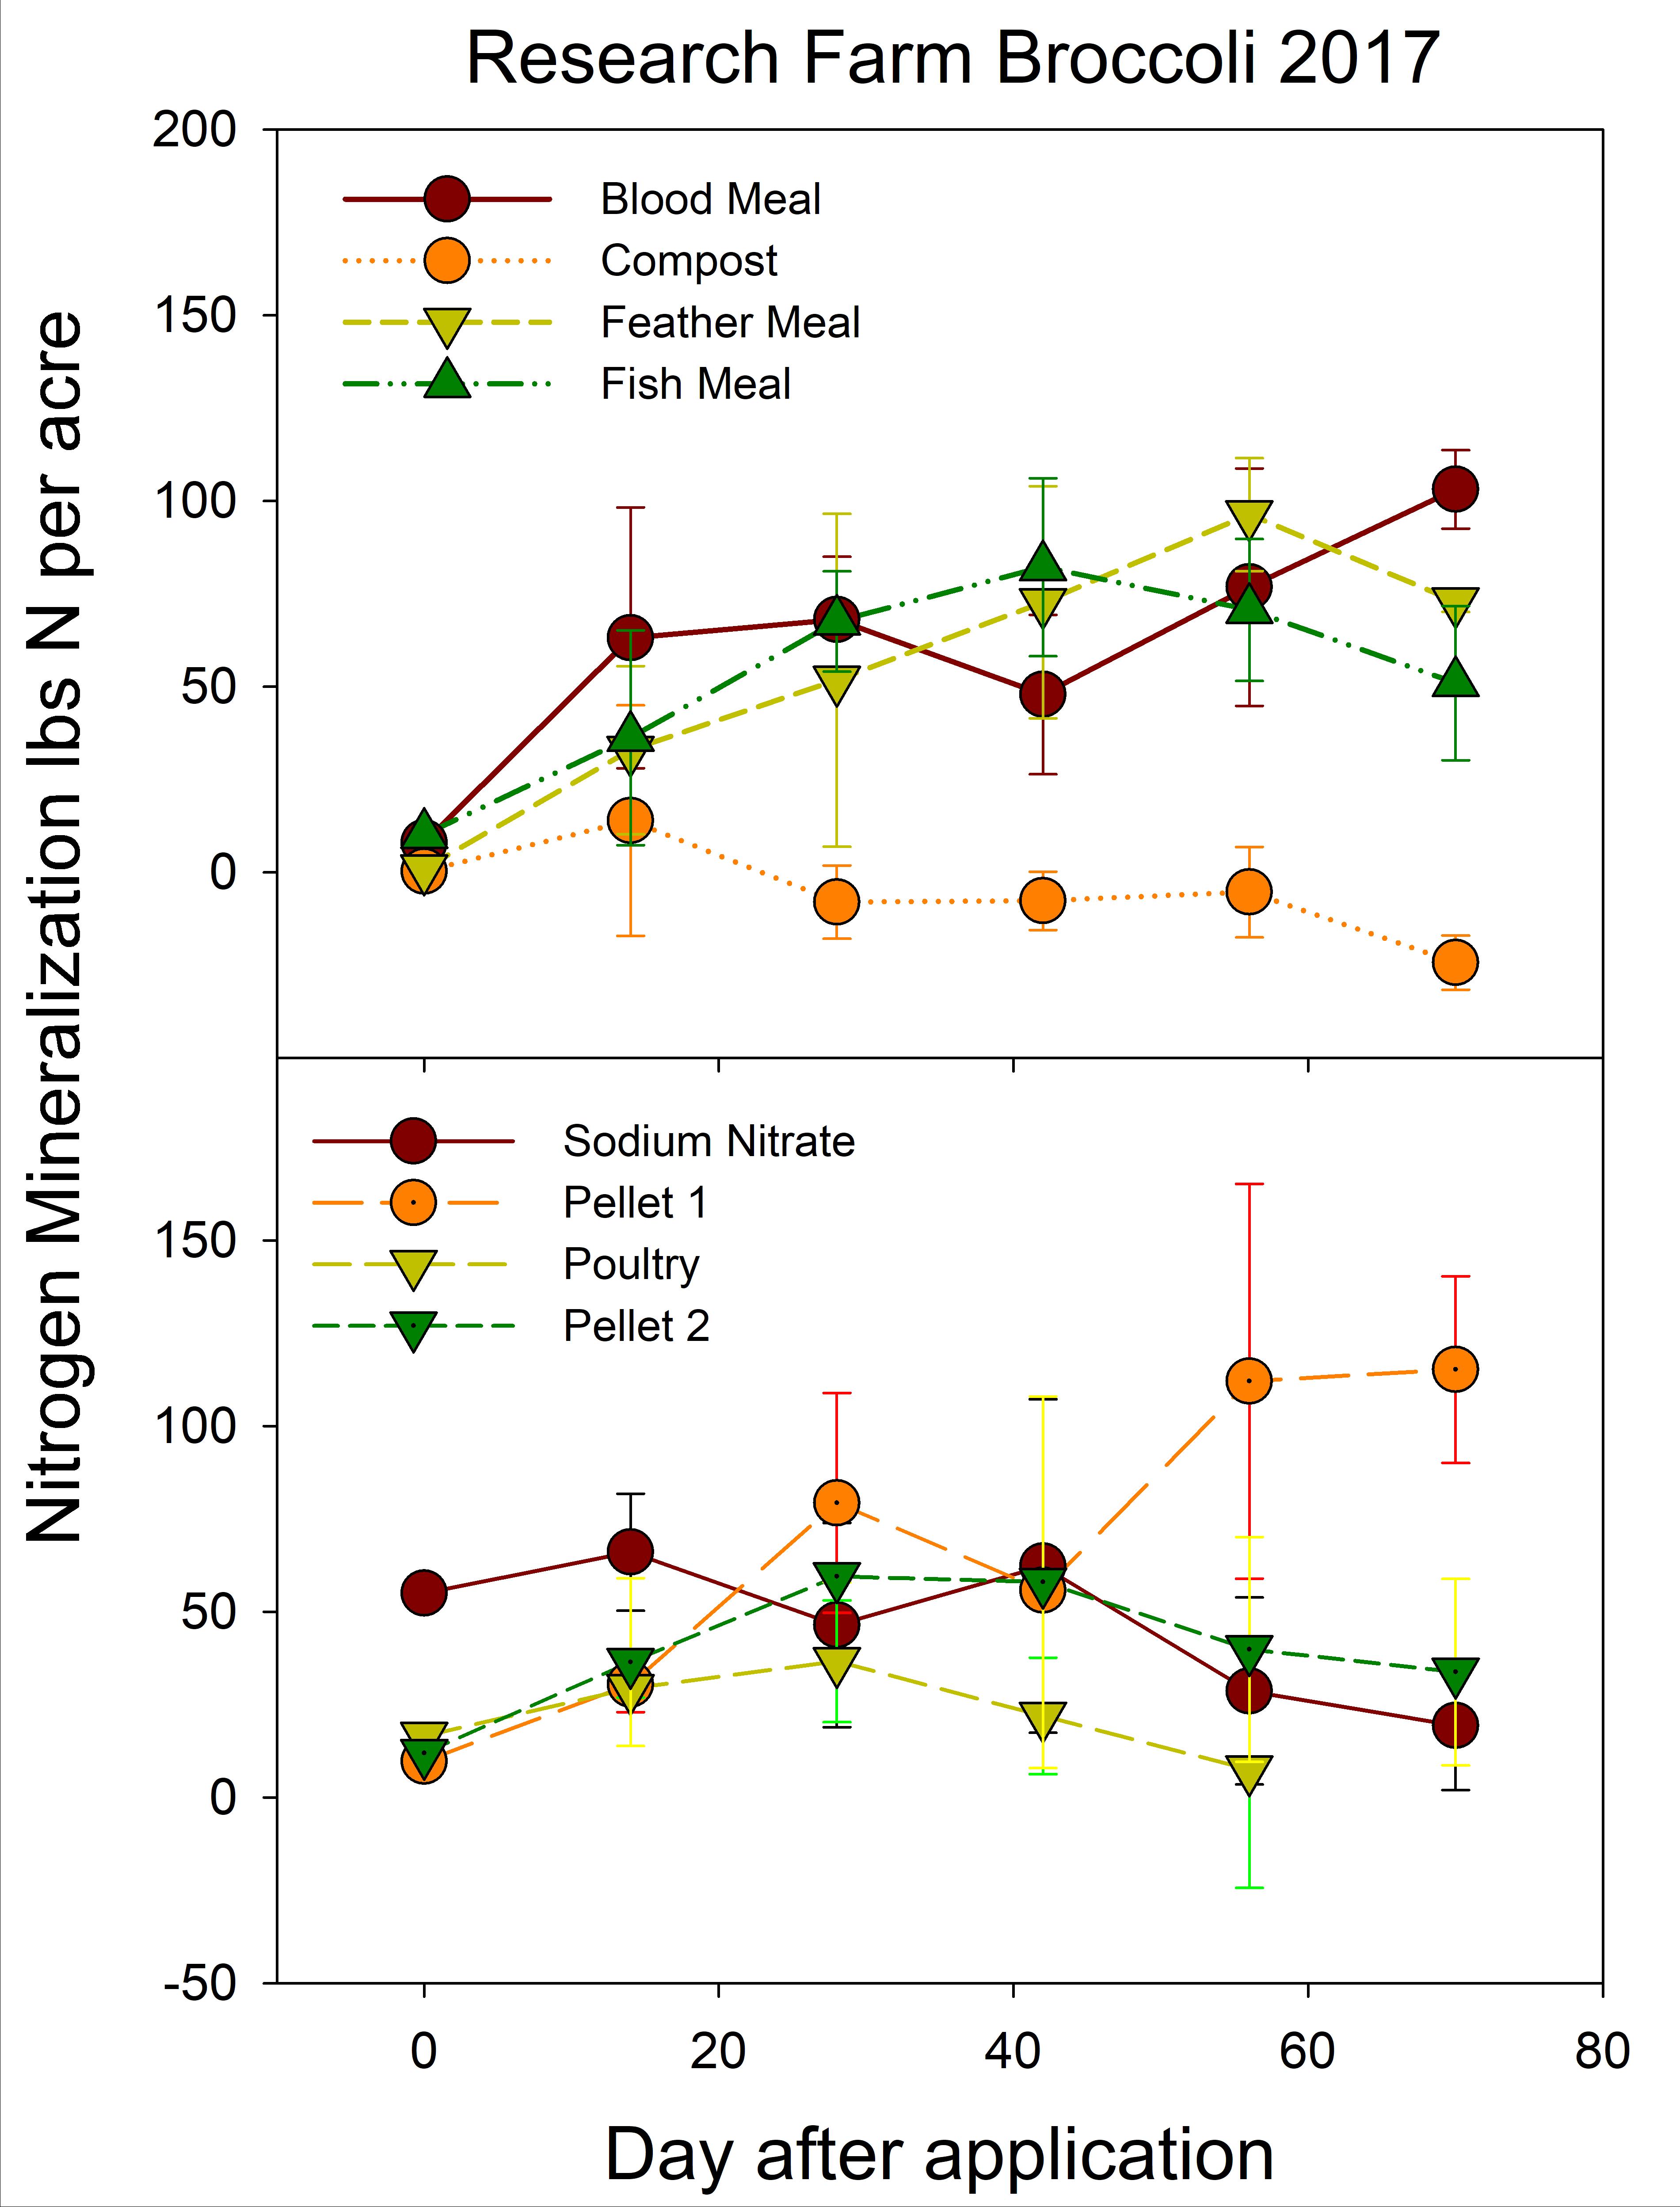
Similar to the laboratory experiment, plant available N (PAN) from the organic fertilizers was calculated by subtracting the initial inorganic nitrogen of the soil and the N mineralized measured in the control plots, so that PAN represents the initial inorganic N of the material and any inorganic N released through mineralization. For the organic materials that mineralized, PAN ranged from 14 to 93% of the total nitrogen applied approximately 6 weeks after application (Table 5). As seen with the lab experiment, blood, feather and fish meals had rapid release of inorganic N within 2 to 4 weeks after application. Low recoveries of these materials were observed, but this was most likely due to natural variability. Losses from the cores were unlikely due to the resin, so replication variability was more likely due to differences in core water content or disturbance (fire ants tended to be attracted to the cores). Immobilization was observed for the poultry litter, pellet fertilizers and the composts depending on the study (Fig.8; Table 5). Low or unusual values were determined in the 2017 tomato season which is reflected in the unusually low recovery of the Chilean Nitrate (53% of applied nitrogen) As expected, less N mineralization was measured for the fertilizers under field conditions than under laboratory conditions (Table 5) due to variations in temperature and water content.
Table 5a. Available N (Net N mineralization + initial N in the fertilizer) of fertilizers applied to the research plots at the UGA Durham Horticulture Farm for the 2016 and 2017 tomato seasons (approx. 6 weeks after planting). Standard deviation in parenthesis.
|
Crop |
Year |
Fertilizer |
Day after App |
PAN lb N acre-1 |
PAN % Total N applied |
|
Toms |
2016 |
NaNO3 |
42 |
97 (62) |
143 |
|
Toms |
2016 |
Blood |
42 |
50 (16) |
66 |
|
Toms |
2016 |
Feather Meal |
42 |
41 (16) |
49 |
|
Toms |
2016 |
Fish Meal |
42 |
62 (0) |
84 |
|
Toms |
2017 |
NaNO3 |
49 |
41 (15) |
53 |
|
Toms |
2017 |
Blood |
49 |
79 (21) |
93 |
|
Toms |
2017 |
Feather Meal |
49 |
24(7) |
27 |
|
Toms |
2017 |
Fish Meal |
49 |
42 (16) |
51 |
|
Toms |
2017 |
Pellet 1 (3-2-2) |
49 |
67 (21) |
72 |
|
Toms |
2017 |
Poultry Litter |
49 |
12 (11) |
15 |
|
Toms |
2017 |
Pellet 2 (5-4-3) |
49 |
11 (9) |
14 |
Table 5b. Available N (Net N mineralized + initial N in the material) of fertilizers applied to the research plots at the UGA Durham Horticulture Farm for the 2016 and 2017 broccoli seasons (approx. 6 weeks after planting). Standard deviation in parenthesis.
|
Crop |
Year |
Fertilizer |
Day after App |
PAN lb acre-1 |
PAN % TN applied |
|
Broc |
2016 |
NaNO3 |
41 |
44 (17) |
85 |
|
Broc |
2016 |
Blood Meal |
41 |
86 (16) |
75 |
|
Broc |
2016 |
Feather Meal |
41 |
71 (29) |
60 |
|
Broc |
2016 |
Fish Meal |
41 |
32(18) |
29 |
|
Broc |
2016 |
Pellet 2 (5-4-3) |
41 |
48 (13) |
45 |
|
Broc |
2017 |
NaNO3 |
42 |
62 44) |
109 |
|
Broc |
2017 |
Blood Meal |
42 |
48 (22) |
37 |
|
Broc |
2017 |
Feather Meal |
42 |
72 (31) |
55 |
|
Broc |
2017 |
Pellet 2 (5-4-3) |
42 |
60 (2) |
49 |
|
Broc |
2017 |
Fish Meal |
42 |
82 (24) |
66 |
|
Broc |
2017 |
Pellet 1 Plus (7-2-2)* |
42 |
56 (3) |
38 |
|
Broc |
2017 |
Poultry Litter |
42 |
22 (16) |
19 |
*Over application due to change in product
Figure 7 . Nitrogen mineralized in control plots for all seasons at the UGA Durham Horticulture Farm.
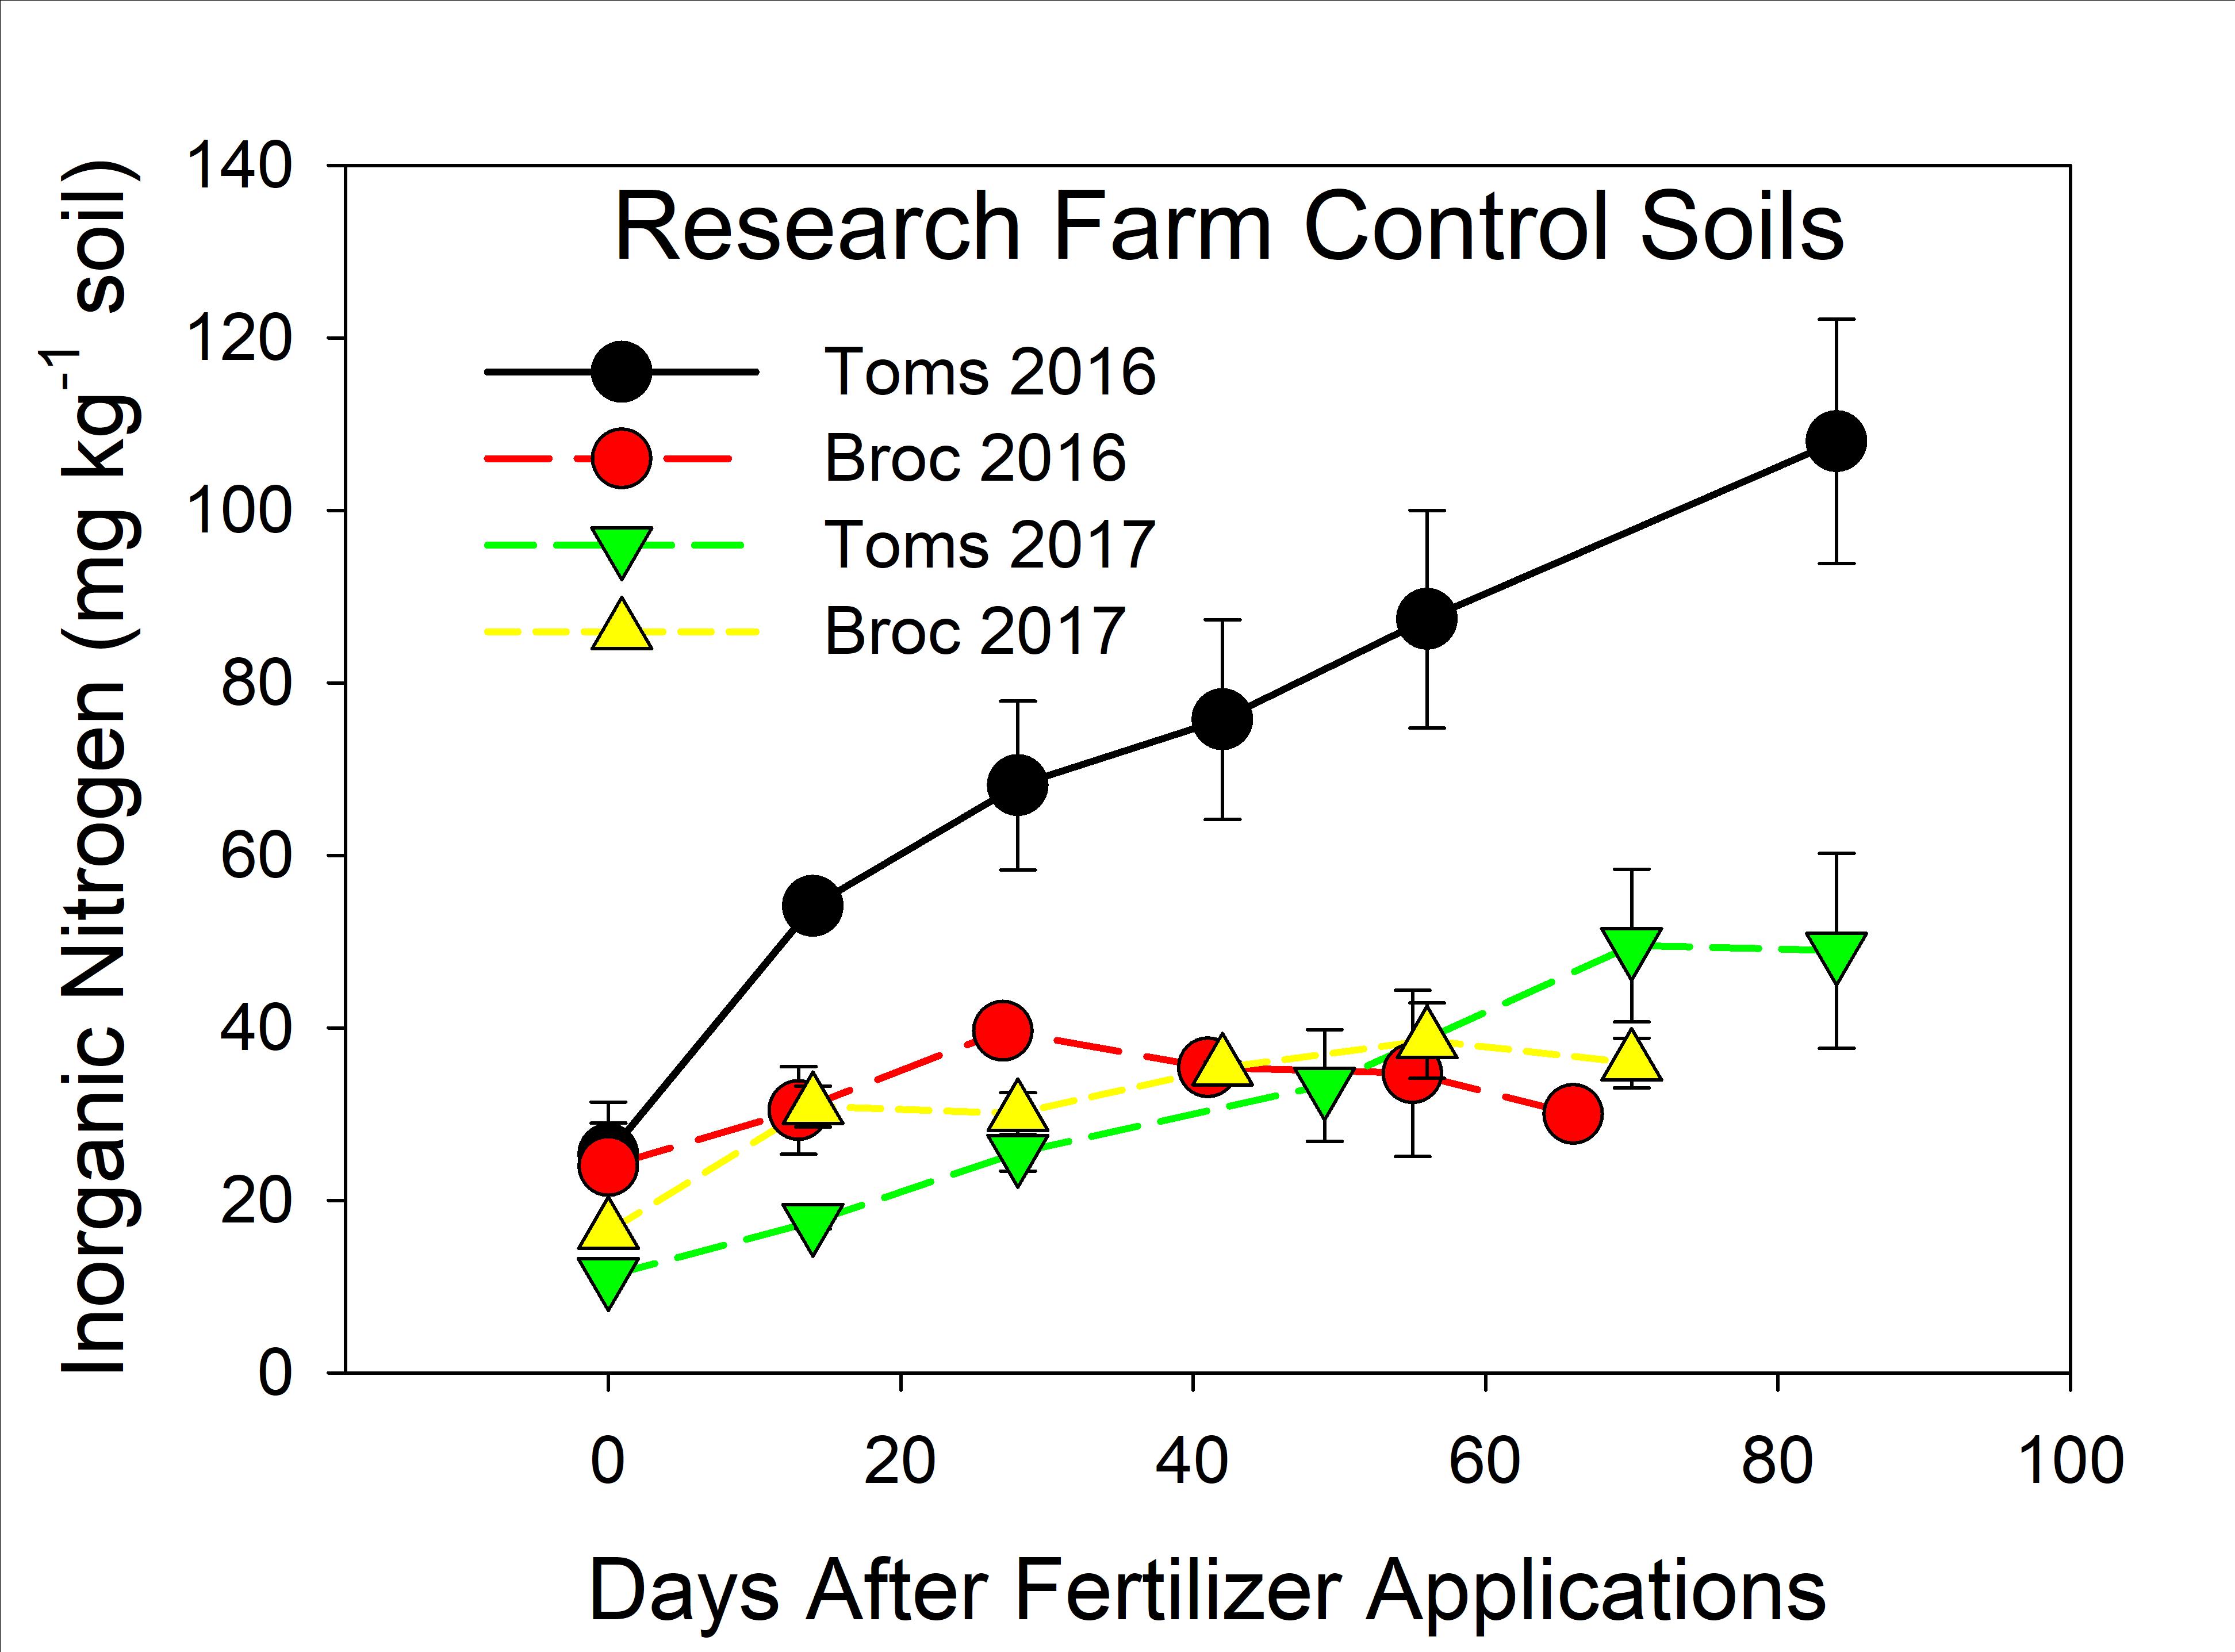
Figure 8. Plant available N (lb/acre) from the fertilizers applied in the 2017 broccoli study at the UGA Durham Horticulture Farm.
Research at Participating Farms 2016-2018
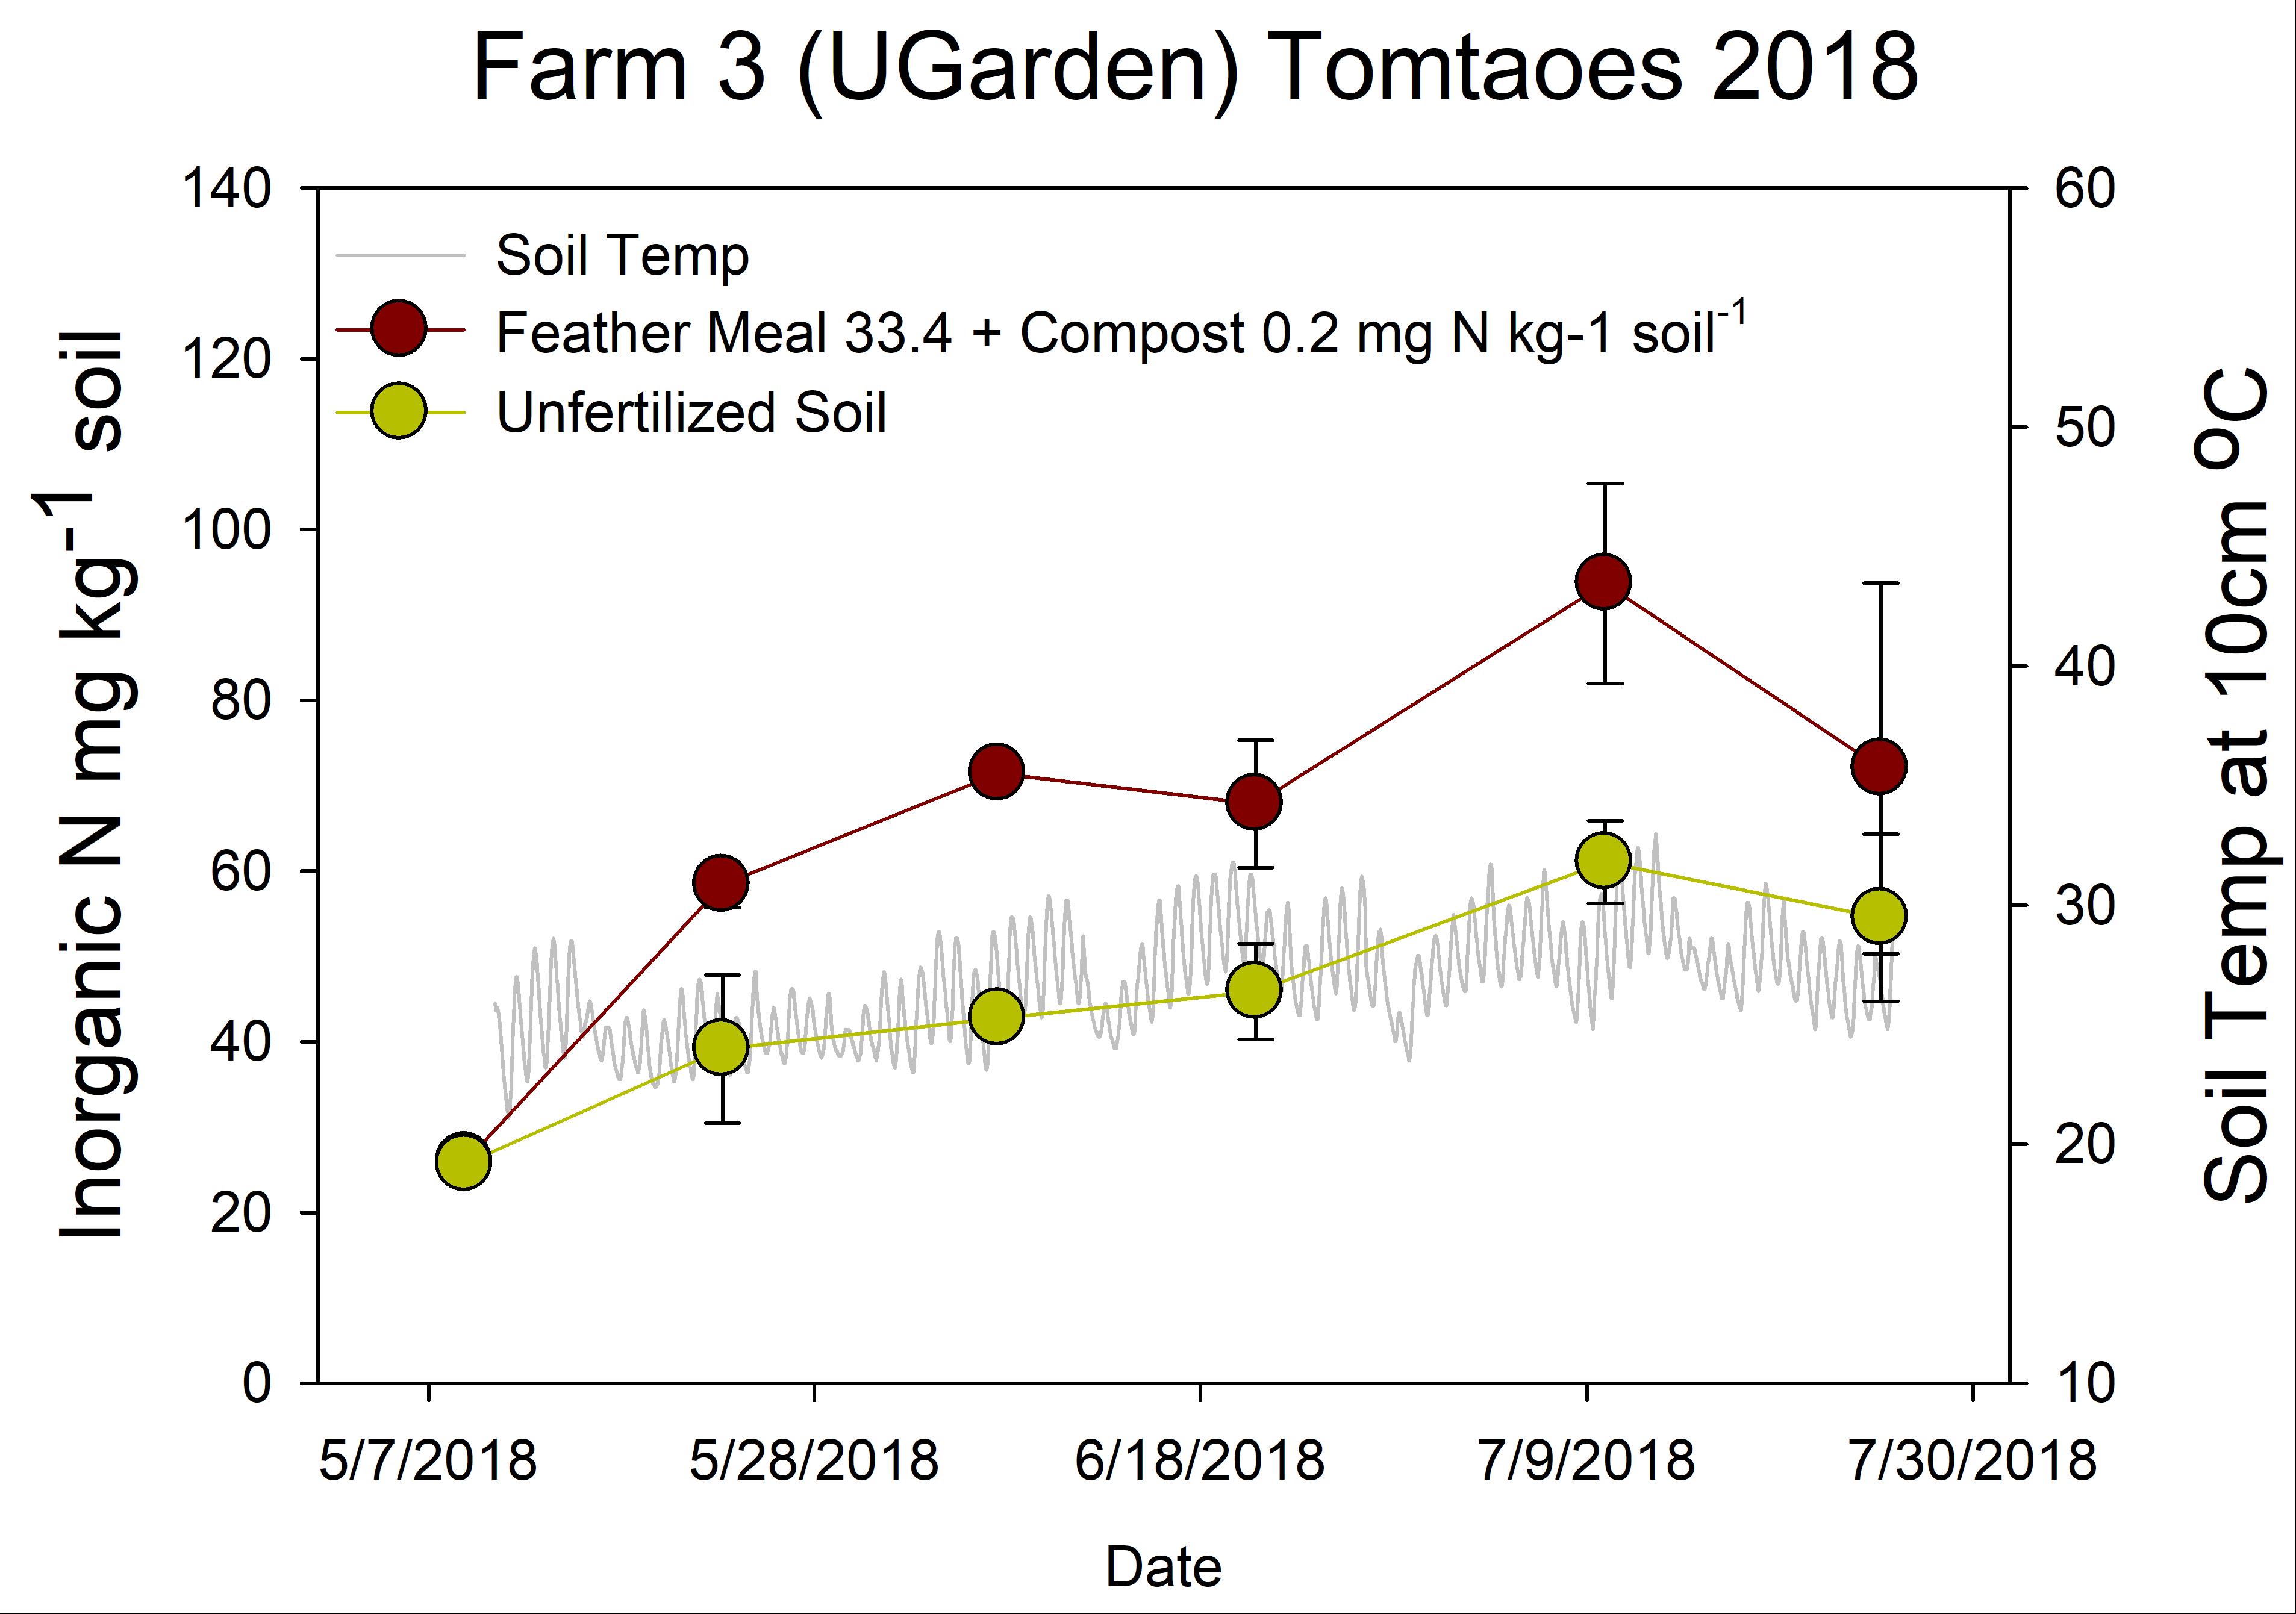
Participating farmers used pelleted poultry litter fertilizers and feather meal for their N needs (these fertilizer preferences were corroborated through informal surveys with other farmers in the region) but varied in their application rates (Table 9). Unlike the study at the UGA Durham Horticulture Farm, the application of feather meal to farm fields during summer trials led to a recovery greater than 100% of the N applied. This high recovery of inorganic N could be due to the “priming effect”. The addition of fertilizer N may stimulate the microbial community to mineralize additional soil organic matter, leading to a high recovery of N. We believe that in these systems, rich in soil organic matter and having received recent fertilizer and cover crop additions, the addition of fertilizer may have led to such an effect as seen in Table 9. This highlights the complexity of the nutrient cycling in these systems. Less variance was observed in the farmer fields, and recovery values were similar or higher to those observed in the lab, although the rate of release was somewhat slower (Fig. 15) likely due to weather conditions. On average, 100% of the N applied was recovered from the feather meal and 48% of the pelleted poultry litter fertilizer. The combination of fertilizers seen in Farms 1 and 4, led to a combination of rates observed in the laboratory studies. .
Table 9. Fertilizer selected by participating farmers, application rates, and amounts of net N mineralized in a 10-week tomato crop and in six weeks after application to broccoli crops. Standard deviation represented in parenthesis.
|
Farm |
Crop |
Year |
N rate lb N acre-1 |
Fertilizer |
N mineralized lb Nacre-1 |
N recovered % of N applied |
|
1 |
Tomato |
2016 |
48 |
Feather Meal |
80.6 (16) |
160 |
|
1 |
Tomato |
2017 |
11+29 |
Feather Meal+ Pellet PL (5-4-3) |
29.2 (0) |
73 |
|
2 |
Tomato |
2018 |
303 |
Pellet PL (5-4-3) |
107.5 (8) |
36 |
|
3 |
Tomato |
2018 |
87 |
Feather Meal |
98.2 (16) |
112 |
|
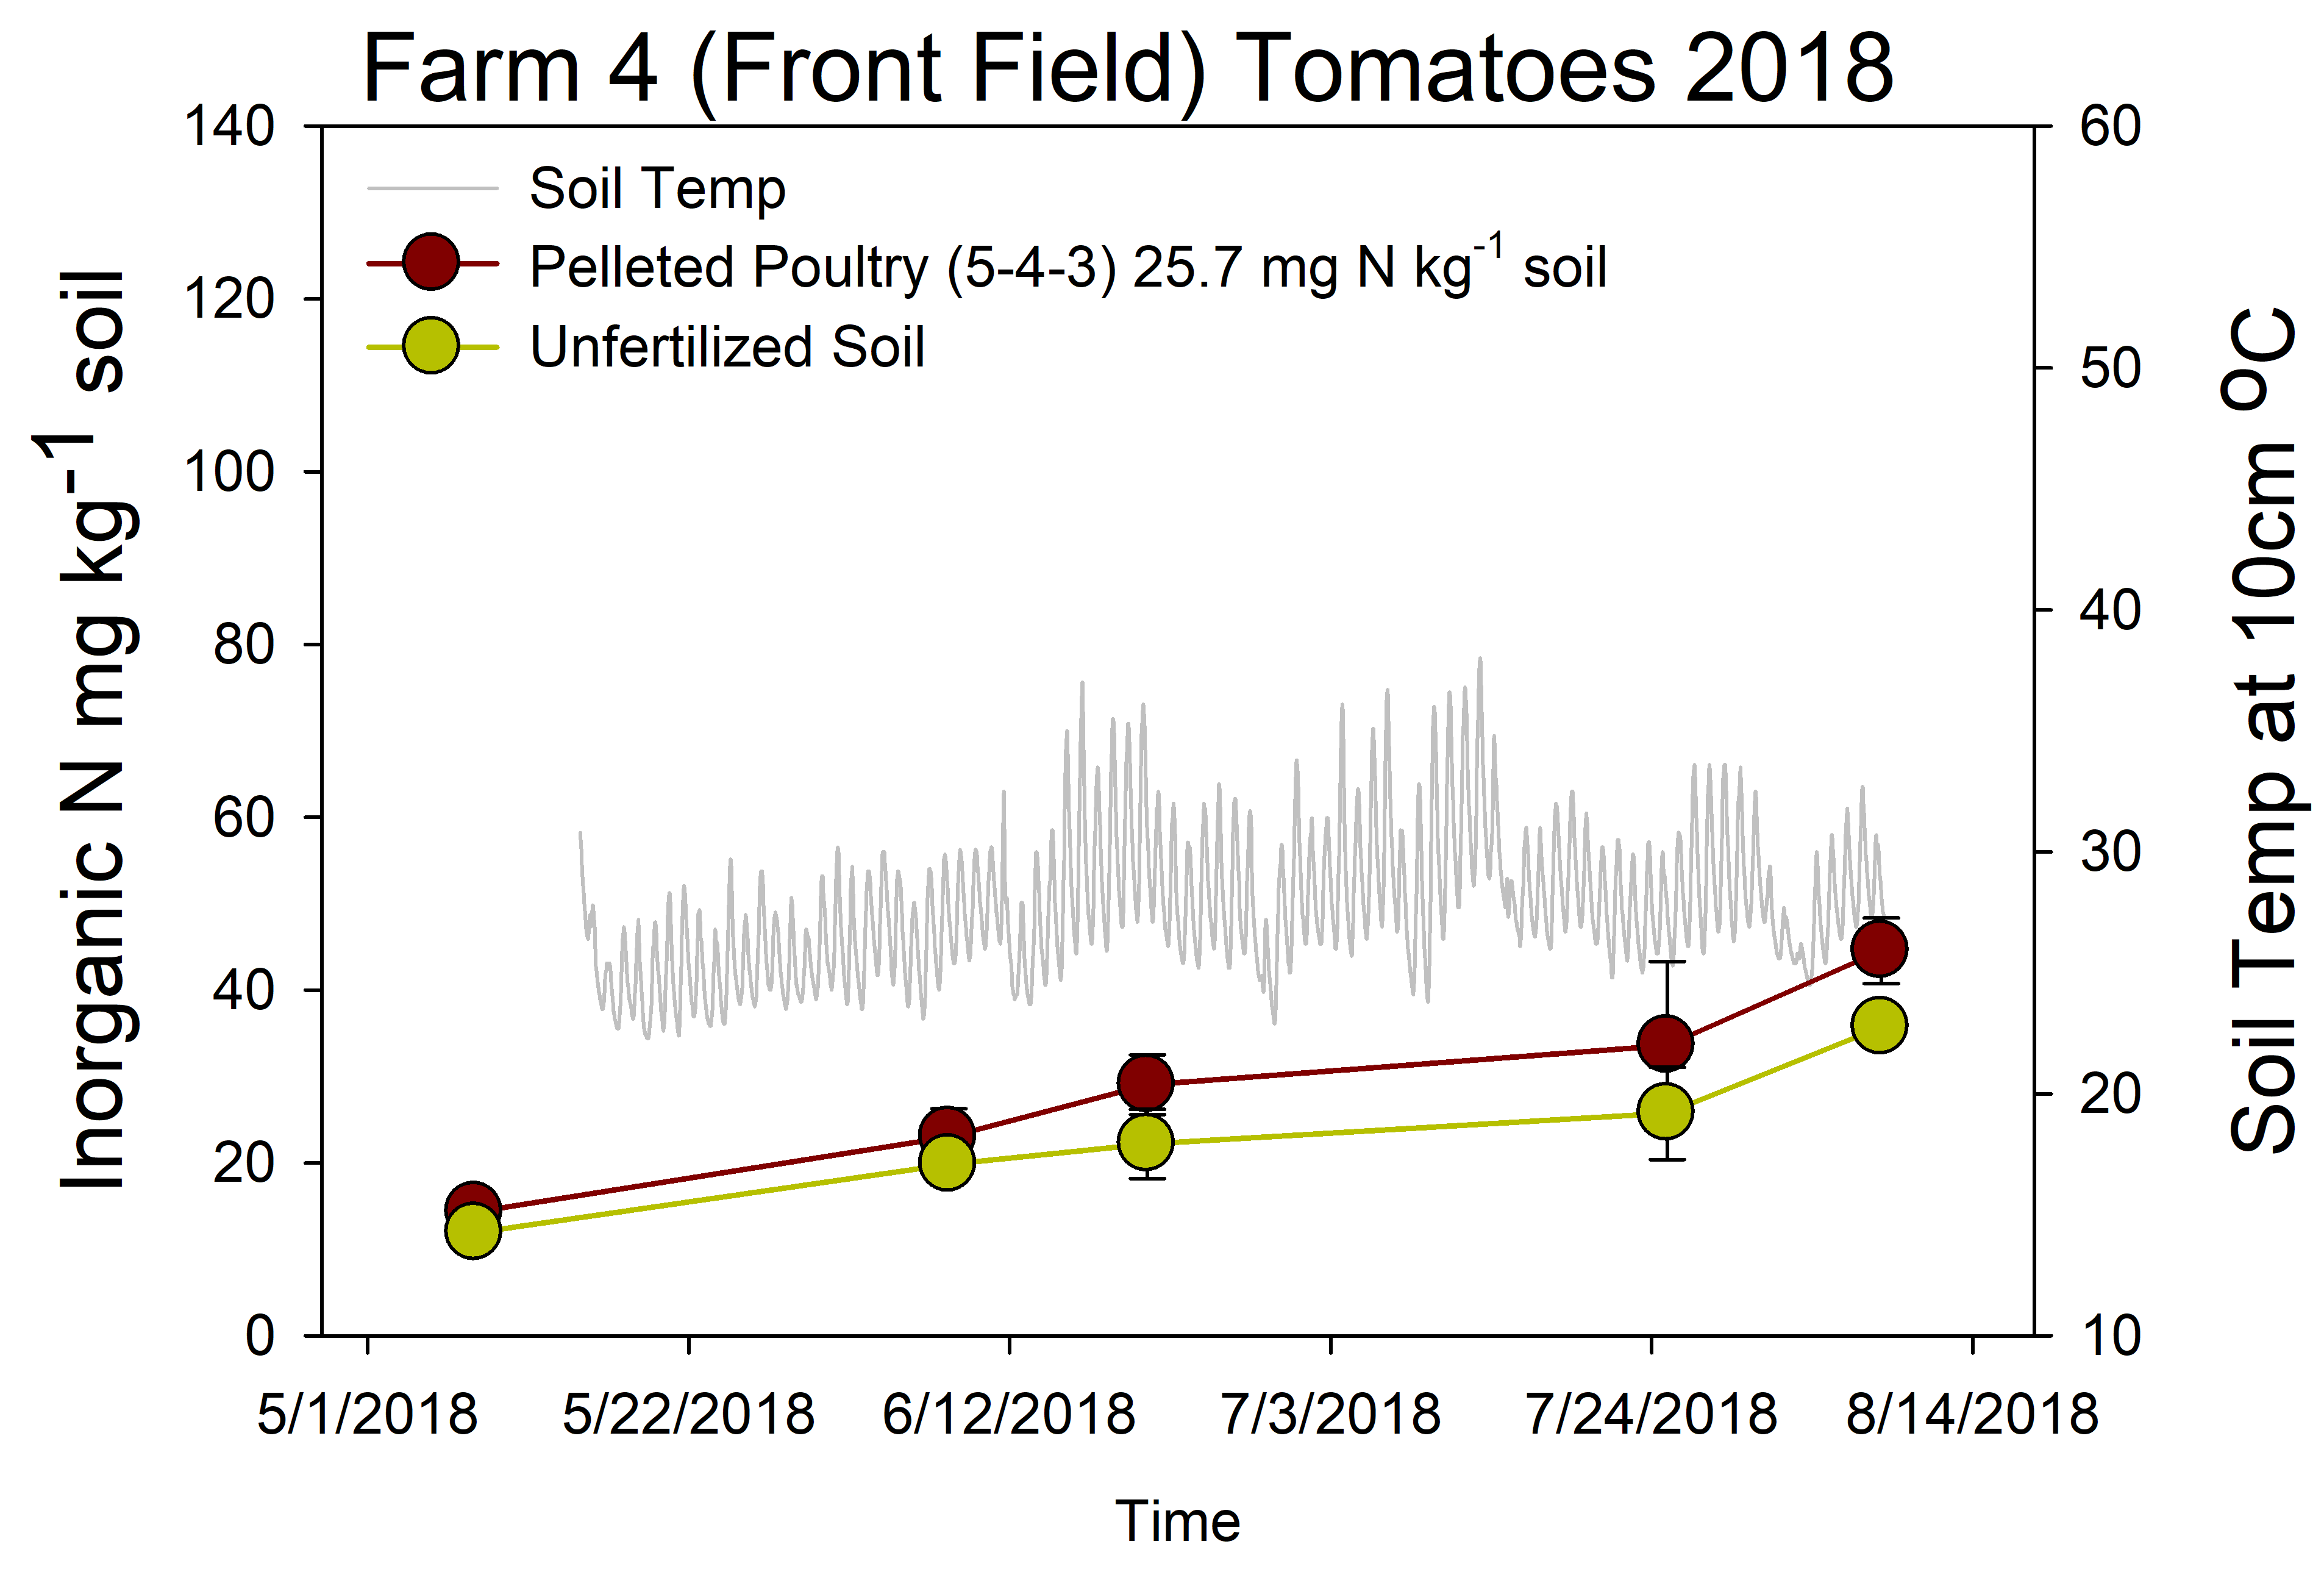
4 |
Tomato |
2018 |
70 |
Pellet PL (5-4-3) |
34.2 (20) |
48 |
|
1 |
Broccoli |
2016 |
120 |
Pellet PL (5-4-3) |
94.1 (1.3) |
79 |
|
1 |
Broccoli |
2017 |
80+29 |
Feather + Bone Meal |
80.5 (18) |
74 |
|
2 |
Broccoli |
2017 |
87 |
Pellet PL (5-4-3) |
24.9 (2) |
29 |
|
3 |
Broccoli |
2017 |
164 |
Feather Meal |
124.7 (25) |
76 |
|
4 |
Broccoli |
2017 |
30+375 |
Feather Meal+ Compost |
51.3 (5) |
13 |
Fig. 9. Inorganic N measured on-farm with participating farms for the 2018 tomato season.

Plant health and yield
Total and marketable yields were determined for the tomato crops at the UGA Durham Horticulture Farm for each fertilizer plot (5 plants per plot). In 2016, significantly greater marketable yield was determined for the Pellet 2 fertilizer and significantly less for the compost, blood meal and fish meal fertilizers (Table 10), even though fertilizers were applied to supply the same total N rate. These findings are of interest as they highlight negative effects on yield for both too much or too little nitrogen. It is likely that the composts led to immobilization, reducing plant available N and yield. With high mineralization measured for both the fish and blood meal, too much N may have led to increased pest pressure. In 2016, tomato fruit worms led to crop damage; worms may have favored the tomato plants higher in N as seen by the larger difference in total and marketable yield for high N fertilizers. Further research is needed to evaluate how these organic fertilizers and their timing of nutrient release may affect pest pressure. Fertilizer effects were much more muted in 2017, with no significant differences determined in the marketable yield. Pest pressure was greatly reduced that season due to better management of IPM. In the 2016 broccoli season, no significant differences were determined possibly due to drought conditions. However significant differences were determined in 2017, with the highest yields determined for the feather meal and blood meal fertilizers (Table 11). Broccoli, a heavy N feeder with a critical uptake period beginning at buttoning, may benefit from fertilizers with a rapid release of inorganic N.
Picture 7. Yield from trials conducted at the UGA Durham Horticulture Farm.
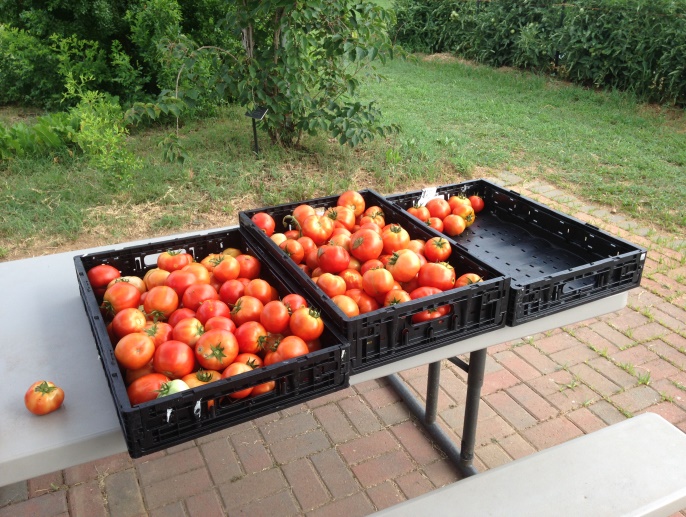
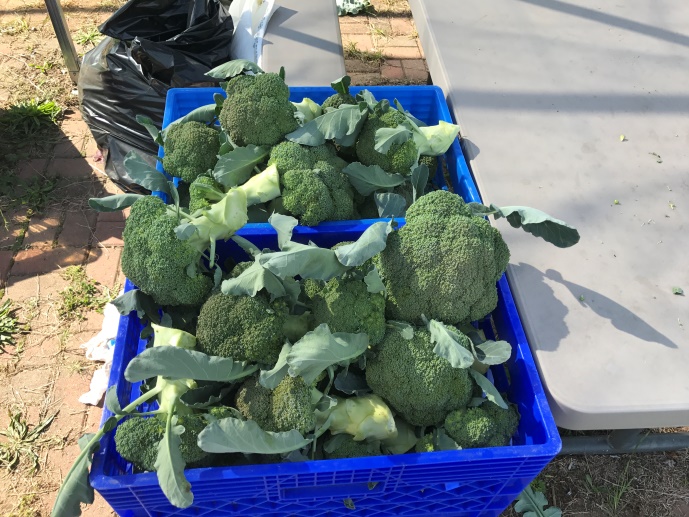
Table 10. Cumulative total and marketable yields from field trials with Defiant pHr tomatoes for different fertilizers. Organic fertilizers were applied at 70 lb N per acre, control received no fertilizers, and sodium nitrate was applied at a rate of 35 lb N per acre. Total yield was estimated by harvesting 5 plants per plot. Marketable tomatoes were determined by USDA Grade A standards.
|
Toms 2016 * |
Toms 2017 ** |
|||
|
total |
marketable |
total |
marketable |
|
|
Blood Meal |
51.9 abc† |
35.8 b |
60.1 abc |
43.6 a |
|
Compost |
42.5 c |
34.6 b |
50.1 bc |
42.2 a |
|
Feather Meal |
54.3 ab |
38.9 ab |
61.1 abc |
48.6 a |
|
Fish Meal |
50 bc |
33.9 b |
49.6 bc |
37.9 a |
|
Poultry Litter |
59.1 ab |
40.4 ab |
61 abc |
48.6 a |
|
Sodium Nitrate |
52.9 abc |
38.3 ab |
62.2 ab |
49 a |
|
Control |
54.4 ab |
38.1 ab |
47.5 c |
39.3 a |
|
Pellet 1 (3-2-2) |
55.8 ab |
40.3 ab |
64.03 a |
50.5 a |
|
Pellet 2 (5-4-3) |
63.3 a |
46.4 a |
56.5 abc |
42.1 a |
*Average from each plot (5 plants per plot) cumulative harvest 84 d after transplant
**Average from each plot (5 plants per plot) cumulative harvest 88 d after transplant
†Different letters represent means are significantly different according to Fisher’s LSD at p<0.05 by column.
Table 11. Cumulative total and marketable yields from field trials with Castle Dome broccoli receiving different fertilizers. Organic fertilizers were applied at 120 lb N per acre, control received no fertilizers, and sodium nitrate was applied at a rate of 60 lb N per acre. Average yield per treatment plot were estimated by harvesting 5 plants.
|
Broc 2016* |
Broc 2017* |
|||||
|
total |
head # |
head weight |
total |
head # |
head weight |
|
|
Blood Meal |
5.5 a† |
8.3 ab |
0.66 a |
8.8 a |
9.7 a |
0.91 a |
|
Compost |
3.3 a |
5.3 c |
0.64 a |
5.8 ab |
10. a |
0.58 ab |
|
Feather Meal |
4.4 a |
7.3 abc |
0.6 a |
8.7 a |
9.7 a |
0.9 a |
|
Fish meal |
3.7 a |
5.7 bc |
0.66 a |
7.4 ab |
8.3 a |
0.87 ab |
|
Sodium Nitrate |
4.6 a |
6.3 abc |
0.72 a |
7.1 ab |
8.3 a |
0.85 ab |
|
Control |
4.9 a |
8.3ab |
0.58 a |
4.9 b |
9.7 a |
0.51 a |
|
Pellet 1 |
4.1 a |
6 bc |
0.66 a |
8.9 a‡ |
9.0 a |
0.97 a |
|
Poultry Litter |
5.2 a |
6.3 abc |
0.78 a |
7.1 ab |
9.3 a |
0.76 abc |
|
Pellet 2 |
5.6 a |
9.0 a |
0.61 a |
7.6 ab |
9.7 a |
0.79 abc |
*Average from each plot (10 plants per plot) cumulative harvest 70d after transplant
*Average from each plot (10 plants per plot) cumulative harvest 75d after transplant
†different letters represent means are significantly different according to Fisher’s LSD at p<0.05 by column.
‡ Extra Fertilizer applied broccoli 2017 due to a change in fertilizer excess N was applied at a rate of 330 lbs N per acre.
5. Information dissemination, education, and outreach
Results obtained through this grant were shared with farmers and the general public through handouts and newsletters, presentations, and on-farm tours. Additionally results were shared on the UGA Sustainable Agriculture Facebook page. Specifics are listed in the education and outreach activities listed below.
Education
The main goals of this project were the development of an interactive, online calculator to aid farmers in predicting plant available N from organic fertilizers, and to increase data and awareness about N fertility when using these materials. Educational outreach was achieved through one-on-one interaction with local farmers and our participating farmer team, presentations and posters at farmer and scientific conferences, presentations to UGA Extension, on-farm field days, and through outreach with the UGA Sustainable Agriculture newsletter and Facebook page.
Educational & Outreach Activities
Participation summary:
Online Tool
Organic Fertilizers Nitrogen Availability Calculator available at: http://aesl.ces.uga.edu/calculators/nitrogen/
Presentations and Tours
- Horticulture Twilight Farm Tour 2016; Watkinsville, GA July 14, 2016. Title: Organic Nitrogen Fertilizers. Handout, discussion, and field tour of tomatoes by Kate Cassity-Duffey. Farmers and the general public were invited to tour research plots and interact with researchers. Approx. 80 people.
- Horticulture Twilight Farm Tour 2016; Watkinsville, GA July 10, 2017. Title: Nitrogen Release from Organic Fertilizers. Handout, discussion, and field tour of tomatoes by Kate Cassity-Duffey. Farmers and the general public were invited to tour research plots and interact with researchers. Approx. 25 people (rain)
- Organic Growers School; Asheville, NC March 10, 2018. Title: Nitrogen Availability and Your Crops- What You Need To Know About This Important Nutrient. Presented by Julia Gaskin. How to understand and predict N availability from cover crops and other N sources in organic farming.
- Emory at Oxford Farm Students and volunteers; Oxford, GA Nov. 16, 2018. Title: Soil Fertility on Organic Farms. Presented by Kate Cassity-Duffey. Approximately 20 students with a wide range of majors and disciplines. Introduced soil fertility, soil fertility in organic systems, UGA outreach with soil test lab and extension, and opportunities in agriculture regardless of majors. 45 min presentation followed by questions and a student survey.
- Southeastern Fruit and Vegetable Conference Organic Production Conference 2019; Savannah, GA Jan. 11, 2019. Title: Predicting N mineralization from organic fertilizers- 45 min presentation followed by a Q and Panel. Presented by Kate Cassity-Duffey. Approximately 80 farmers, Extension, education, and industry professionals.
- Southern Sustainable Ag Working Group Conference 2019; Little Rock, AR, Jan. 26, 2019. Title: Putting the fertility pieces together: New tools for understanding cover crops and organic fertilizers-45 in presentation with questions. Presented by Kate Cassity-Duffey, Julia Gaskin, and Daniel Parsons. Farmer/researcher collaboration presentation with both perspectives. Covered N fertility from cover crops and organic fertilizers as well as calculating inputs. Approximately 45 farmers.
- Georgia Organic Conference 2019; Tifton, GA, Feb. 8, 2019. Title: Whole farm nitrogen management workshop—3 hour interactive presentation. Presented by Kate Cassity-Duffey, Julia Gaskin, and Daniel Parsons. Farmer/researcher collaboration presentation. Outline the difficulties in N management for organic farmers, N from cover crops and organic fertilizers, and using fertilizer inputs and calculations on-farm. Interactive examples using the fertilizer available and cover crop calculator. Approximately 25 farmers.
- University of Georgia Agriculture and Natural Resources Update Northwest; Griffin GA, Feb. 15, 2019. Title: Organic fertilizers and materials—45 min presentation and questions. Presented by Kate Cassity-Duffey. Outlined the most current research for N management for organic and small-scale farmers using organic materials available for Extension agents. Approximately 40 Extension agents and programmers.
- University of Georgia Organic Horticulture Students; Athens, GA, Feb. 22, 2019. Title: Organic fertilizer and materials used in organic farming: nitrogen—1.5 hr presentation. Presented by Kate Cassity-Duffey. Introduced complexities in organic farming and nutrient management and how to address plant needs. Showed current tools available for predicting N release from fertilizers and cover crops and interactive calculations for choosing fertilizer application rates.
- University of Georgia Agriculture and Natural Resources Update Northeast; Athens, GA, Feb. 28, 2019.Title: Organic fertilizers and materials—45 min presentation and questions. Presented by Kate Cassity-Duffey. Outline the most current research on N management for organic and small-scale farmers using organic materials available for Extension agents. Approximately 30 Extension agents and programmers.
Outreach prints
- University of Georgia Durham Horticulture Farm: Twilight Farm Tour 2016 and 2017 Handouts
- University of Georgia Sustainable Agriculture Spring 2018 Newsletter. Research: Organic Nitrogen Fertilizer Calculator.
- University of Georgia Sustainable Agriculture Summer 2019 Newsletter. Research: Proper selection and timing of organic fertilizer applications.
Posters
- Georgia Organics Conference Feb. 17 and 18, 2017 Atlanta, GA. Title: Nitrogen mineralization of organic fertilizers. Jana Hamilton, Kate Cassity-Duffey, and Miguel Cabrera.
- Soil Science Society of America International Annual Meetings Oct. 20, 2017 Tampa, FL. Title: Estimating mineralizable nitrogen from organic materials. Kate Cassity-Duffey, Miguel Cabrera, Dory Franklin, Julia Gaskin, David Kissel, and Uttam Saha.
- Southern Sustainable Ag Working Jan. 17 and 18, 2018 Chattanooga, TN. Title: Plant available nitrogen from organic materials. Kate Cassity-Duffey, Miguel Cabrera, Dory Franklin, Julia Gaskin, and David Kissel.
- Soil Science Society of America International Annual Meetings Jan. 7, 2019 San Diego, CA. Title: Nitrogen from organic fertilizers: effect of soil texture. Kate Cassity-Duffey, Miguel Cabrera, Dory Franklin, Julia Gaskin, and David Kissel.
Publications
- Cassity-Duffey, K., M. Cabrera, D. Franklin, J. Gaskin, D. Kissel, and U. Saha. 2019. Nitrogen mineralization from organic materials and fertilizers: predicting N release. Submitted to the Soil Science Society of America Journal. Under review Oct. 2019.
- Cassity-Duffey, K., M. Cabrera, D. Franklin, J. Gaskin, and D. Kissel. 2019. Effect of soil texture on nitrogen mineralization from organic fertilizers in four common southeastern soils.. Submitted to the Soil Science Society of America Journal. Under review Oct. 2019.
Produce Donated
Over 3000 lbs of produce from the research portion of this project were donated to local food banks.
Learning Outcomes
Informal Survey: Georgia Organics 2016 (February 2016, Atlanta, GA). This survey was conduted at the UGA Sustainable Agriculture Booth at the conference expo. We met with farmers and the public with an example of the online model and a simple, anonymous survey to determine current nitrogen fertility practices, the effectiveness of the model interface, and best approaches for outreach. Overall turnout was low (approximately 5 famers filled out the survey, but many visits from home gardeners). Overall, participants indicated that the necessary inputs and the order of the inputs and questions were easy to understand. Mixed reviews were obtained with the ease of the instructions and the aesthetics of the website. More complete instructions were added and the inputs were broken into separate sheets to attempt to make the website more appealing. Further model improvement was done on a farmer by farmer basis to get more in-depth answers and to ensure we were addressing the proper end users.
Informal Survey: Emory at Oxford Farm Students and volunteers (November 2018, Oxford, GA). This survey was conducted after the presentation to students to determine the increase in knowledge for soil sciences and interest in soil fertility and organic production. The survey addressed the students current academic major, learning outcomes from the presentation, agriculture perspectives, likelihood of using UGA, GA Extension, and AESL resources, and learning outcomes they could apply regardless of chosen profession. Overall, the students expressed a better understanding of what services extension, land grant institutions, and federal agencies can provide to farmers and the community. All of those surveyed increased their knowledge in soil fertility. Additionally, many of the students indicated an increase interest in agricultural studies, whether it be business, science or humanities related.
Workshop: Georgia Organic Conference 2019; Tifton, GA, Feb. 8, 2019. After a 1.5 hr presentation, the participants underwent a group project for fertilizer calculations and selection of organic materials based on soil type, desired rate, and previous cover crops. This worksheet, gave a variety of seasons, materials, and crops and groups presented their choices to the workshop. This provided farmers with the ability to have a hands-on introduction to the ideas presented through the presentation and showed interest from the audience on the calculator and materials generated through this grant.
Informal Survey: Participating Farmers on the calculator and overall project outcomes (August 2019). This survey was conducted with our 4 participating farmers (as well as any of their interested farm workers). Farmers were sent the calculator website to determine the effectiveness, ease of use, and likelihood of use. Additionally, farmers were asked how/if their participation in this project changed their views and practices for farm fertility management, areas they think need further work, and if they would participate with researchers again. From this survey we determined that our four participating farms really relied on only two sources for their N needs: feather meal and a pelleted poultry manure mix. This was somewhat surprising given the large variety of materials and interest in a wide range of materials, but shows the importance of these materials to small farmers in the Southeast. Three of our four farms used recommendations for the University of Georgia and perform annual soils test. Overall, the farmers found the calculator to be easy to use, logical, and the interface easy to use. They tended to agree that the interface was not aesthetically pleasing but that the instructions and research tabs were helpful.
Project Outcomes
Nitrogen is often the most limiting nutrient to crop yield in organic and sustainable systems in part due to a lack of synchronicity between mineralization and plant demand. Plant available N in these systems is complex due to the many sources that can supply inorganic N, namely soil organic matter, cover crops, and/or organic fertilizers. The rate and amount of N mineralized form these organic sources are functions of both material composition and environmental factors. This work addressed the need for research on N fertility in sustainable and organically managed systems by determining N mineralization from a wide range of organic materials and commercially available fertilizers, and by creating a web-based calculator. This tool helps farmer determine N release from organic fertilizers based on type of organic material, application rate, and environmental conditions. This capability will allow more precise N applications and better timing with plant need. This work has been shared withnfarmers, scientists and the general public to bring awareness to nutrient management in organic/sustainable systems.
Objective 1. a) Determine potentially mineralizable N and rates of N mineralization for 49 organic materials (manures, composts, other organic fertilizers), and b) determine the effect of soil texture on N mineralization rates and ammonia volatilization of organic materials.
The rate and amount of N mineralization was measured for a wide range of organic fertilizers and materials that had not previously been studied. We determined that plant available N from the fertilizers ranged from 25 to 93% of the applied total N and from 25 to 57% of the applied total N for poultry litters. Many of the composts used in this study exhibited N immobilization (5 of 11), but for those that did mineralize, an average of 7% of applied N was plant available. These findings support previous studies, indicating that compost should not be considered a N source and may lead to immobilization. When these data were presented to farmers, many were surprised by the rapid mineralization shown by feather meal and blood meal. Traditionally, this material has been characterized as a “semi-slow release” fertilizer; this work has shown that we may need to adjust terminology used in organic fertilizers. For the majority of the fertilizers and composts, much of the N mineralized during this first four weeks. For crops like tomatos and broccoli that need the majority of their N 6 weeks after planting, nitrogen available from the products may be released too soon and liable to loss through nitrate leaching. We determined a relationship between nitrogen mineralized after 100 days and the initial total nitrogen of the material. This relationship will likely help predict mineralizable N from new organic materials as they come available. We determined a minimal effect of soil texture on these products, where clay soils may lead to less overall mineralization. However, further studies are need with a range of higher clays soils. In summary, this research will allow for farmers to make better decisions based on crop, season, and amendment. Additionally, it has provided a large amount of information on products not previously studied.
Objective 2. Calibrate NIRS/VNIRS to estimate mineralizable N and rates of N mineralization for 49 organic materials.
Near infrared spectroscopy (NIRS) is a promising tool that can rapidly predict material characteristic without the need for wet chemistry. In this study, we determined that NIRS shows promise in predicting characteristics like total N, total carbon, and the mineralizable pool of N for organic materials such as organic fertilizers, poultry litters, and composts. However, results determined in this study were not robust enough to suggest immediate use of this technology. Additional work is needed in this area because NIRS can provide rapid and inexpensive analysis that will prove beneficial to the agricultural community.
Objective 3. Develop a web-based PAN calculator that allows producers to calculate PAN over the growing season as a function of local weather and soil conditions.
A web-based calculator “Organic Fertilizers Nitrogen Availability Calculator” was created using data collected in this project. The web page includes the Calculator, Instructions, and Research to help with the education and understanding of N mineralization and the importance of soil fertility .The webpage and calculator are available at: http://aesl.ces.uga.edu/calculators/nitrogen/. The calculator uses input from the farmers, planting date, application date, fertilizer grade, and application rate to estimate N mineralization and plant availability based on local weather station data. This tool allows for the visualization of the dynamics of N mineralization and N release, the combination of multiple materials, and the calculation of total nutrients applied to help farmers with their fertilizer selection. Farmers participating in this project said that the use of this calculator led to an increased understanding of N mineralization, would aid in material selection, and peaked their interest in side dressing or split applications of organic fertilizers.
Objective 4. Collect PAN data from plots at the UGA farm and at cooperating farms, and use the data to calibrate and validate the PAN calculator.
Field studies conducted in this project have demonstrated plant available N from organic materials under fluctuating environmental conditions on both a controlled research farm and at participating farms with farmer-led studies. Field studies have shown that season and material selection will affect the availability of N applied, with slower rates at low soil water contents and under cool temperatures. Differences in yield highlighted the effects of both too little and too much N in vegetable systems. Matching N rates to plant demand is important to reducing pest pressure while simultaneously maximizing plant demand. More work is needed to better understand plant uptake of nutrients in organic/sustainable systems specific to crops. This work also highlighted the differences in the soil organic matter mineralization contribution to the plant available N. Nitrogen mineralization from the soil was affected by farm and season. Soil organic matter plays a very important role in supplying plant N and should be included when making fertilizer N recommendations.
Objective 5. Disseminate the N mineralization data, availability of the NIRS/VNIRS analysis for organic materials, and web-based PAN calculator to the public, farmers, and extension.
This work has highlighted the many organic amendments available to producers and the feedback from farmers and the scientific community has been informative to this project. This work has shown farmers the complicated dynamics of organic fertility management. Feedback has highlighted the wide range of experience and knowledge for our target audience of organic vegetable farmers. For our more experience farmers, many were surprised by the rates of N release from these products. For most of these materials, the only available description is “fast, medium or slow” release. With these terms being relative and vague, our data will allow farmers to make better amendment choices and may shift farmer opinion on many of these products. For newer farmers, many are unfamiliar with the ideas of N mineralization and the complexity of nutrient dynamics. This work has exposed those ideas to these farmers and has highlighted that we need to work on education for organic fertility management and expand outreach. Sharing our information with the public has shown our research group that we needed to make the N calculator so that it would work well for seasoned and new farmers alike. Information was shared through on-farm tours, conferences, through farmer interaction, and the development of extension and scientific publications
Farmer Adoption
Interaction with the farmers throughout this grant has led to new relationships and a good pairings of researcher and farmer presentations. Based on our informal survey, participating farmers enjoyed the research and look forward to pairing on future research projects. Our four participating farmers all strongly agreed that they had a better understanding of organic fertilizers and N availability and more interest on research in nutrient availability for organic systems. The data from this experiment and the calculator better helped farmers to understand the differences in N availability and the importance of timing applications better with plant need. Additionally, all farmers strongly agreed in the need for soil testing. When asked if the farmers would use the calculator, answers were mixed. All farmers indicated the difficulty in multiple application rates due to the large variety of crops grown on organic farms. They said in may be impractical and too time consuming to do it crop by crop but that the calculator was an important tool to understand process and visualizing N release. One farmer cited that it may be something that is helpful during winter planning. Two farmers cited the need for more help with fertility and that they may still rely heavily on Extension to interpret results. On-farm experimentation from this grant helped the farmers realize they need to adjust their fertilizer recommendations and begin to think more precisely about rates and timing. All farmers that participated in this study agreed that they will be changing their N fertilizer approaches after working on this grant. Overall, this grant introduced the importance of N synchronicity to farmers we worked with and at farmer conferences. Until more research is available, this fertilizer calculator may act as more a visual tool to determine the effects of weather and materials on N availability instead of something used plot by plot.
This work determined N mineralization from organic fertilizers under lab and field conditions to create an online model for farmer use. Additionally studies should be performed for model validation and the incorporation of cover crops and soil organic matter as sources of plant available N. Further studies need to be implemented to better understand farmer adoption of this and similar tools. Small-scale farmers have a wide variety of crops with different fertilizers needs, so understanding how to tailor and make affordable soil tests and tools like this will aid in their precision application of fertilizers. This work also identified a wide range of N mineralization from the soil organic matter in lab and on-farm experiments. Organically managed soils will vary greatly depending on soil texture, years managed, and management style. Accurately predicting N mineralization from the soil will lead to much more accurate rate recommendations. Soils that have been managed extensively and are cover cropped may be able to significantly cut back N fertilizer applications while maintaining crop yield. Additionally, the high organic matter found in organically/sustainable managed soils may see an additive N effect, where fertilizer additions favors the release of available N from the soil organic matter. Further studies can determine the release and potential of other plant nutrients from these materials and the dynamics of immobilization of nutrients depending on material/soil characteristics, especially in carbon rich and heavily cover cropped systems.