Final report for LS17-279
Project Information
Cowpea, Vigna unguiculata Walp., is an important source of protein and vitamins that is widely grown in the Southern U.S primarily for fresh market consumption and freezing. Cowpea is very attractive to honey bees and other bee species and this has in part been attributed to its nectariferous nature. Bees are an important component of productivity and sustainable agroecosystem. Currently, bee populations are in decline ostensibly due to loss in habitats (which results in reduction in floral resources and nesting sites) as well as the use of pesticides especially neonicotinoids. One of the project objectives is to identify cowpea cultivars with resistance to pests and diseases, high pollinator activity and good nodulation efficiency. From our results the most common pollinators recorded on cowpeas were honey bees, carpenter and bumble bees. During the five-week sampling period, 57% of the pollinators recorded were honey bees followed by bumble bees (30%). Bee populations varied among the different cowpea varieties and over time. Dixielee, Penny Riley, Whippoorwill Steel Black, Whippoorwill and CT Pink eye Purple Hull were the most attractive cowpea varieties to pollinators. Iron and Clay, Tohono O'odham and Red Bisbee recorded the least number of pollinators. Brown marmorated stink bug (BMSB) populations were highest in Dixielee, Penny Riley, Whippoorwill Steel Black, Whippoorwill, Mayo Colima and CT Pink eye Purple Hull the same varieties attracted to pollinators. Carrapichio, California Blackeye #5, Cream 40, Iron and Caly, Lady, Purple hull Bigboy, running Conch, and Tohono O'odham recorded the least BMSB. The second objective was to determine if intercropped cowpea increased crop yield of okra, squash and watermelon. More pollinators were observed on both the cowpea and the intercropped main crops compared to the control (main crops without cowpea). Overall, intercropping cowpea resulted in increased crop yield compared to the control with no cowpea intercropped. We also observed that for this strategy to be successful, there must be synchrony in the flowering phase of both the main crop and cowpea intercrop.
The overall goal of the proposed study is to increase crop production and sustainability through intercropping cowpea cultivars that are highly attractive to pollinators while at the same time resistant to insect pests and diseases in a vegetable cropping system. These cultivars would also increase soil health by their ability to nodulate with the existing rhizobia. The project goal will be met by the following three objectives that systematically address the problem the project seeks to solve.
Objective 1. Identify cowpea cultivars with resistance to pests and diseases (including nematodes), high pollinator activity and good nodulation efficiency.
Objective 2. Evaluate the effect of two best cowpea cultivars with pest and disease resistance, high nodulation and high pollinator attractiveness (from objective #1) on overall yield of vegetable crops in two cropping systems with/without cowpea (mono and intercropping).
Objective 3. Assess system profitability from Best Production Practices (BPPs) used in objective #2 by growers through collaborative farmer-managed on-farm demonstration.
Research
Objective 1. Identify cowpea cultivars for resistance to pests and diseases and pollinator activity and nodulation efficiency. Experimental plots were established at the NC A&T research farm, Greensboro, NC and at Fort Valley State University (FVSU) research station farm. Twenty-four cowpea varieties were grown at NC A&T in summer of 2018 and twenty cowpea varieties were grown at FVSU. Each treatment was planted in 2 rows, each 5 m long with 1m inter-row spacing and replicated 4 times in a Randomized Complete Block Design (RCBD). No insecticide and fertilizer were applied.
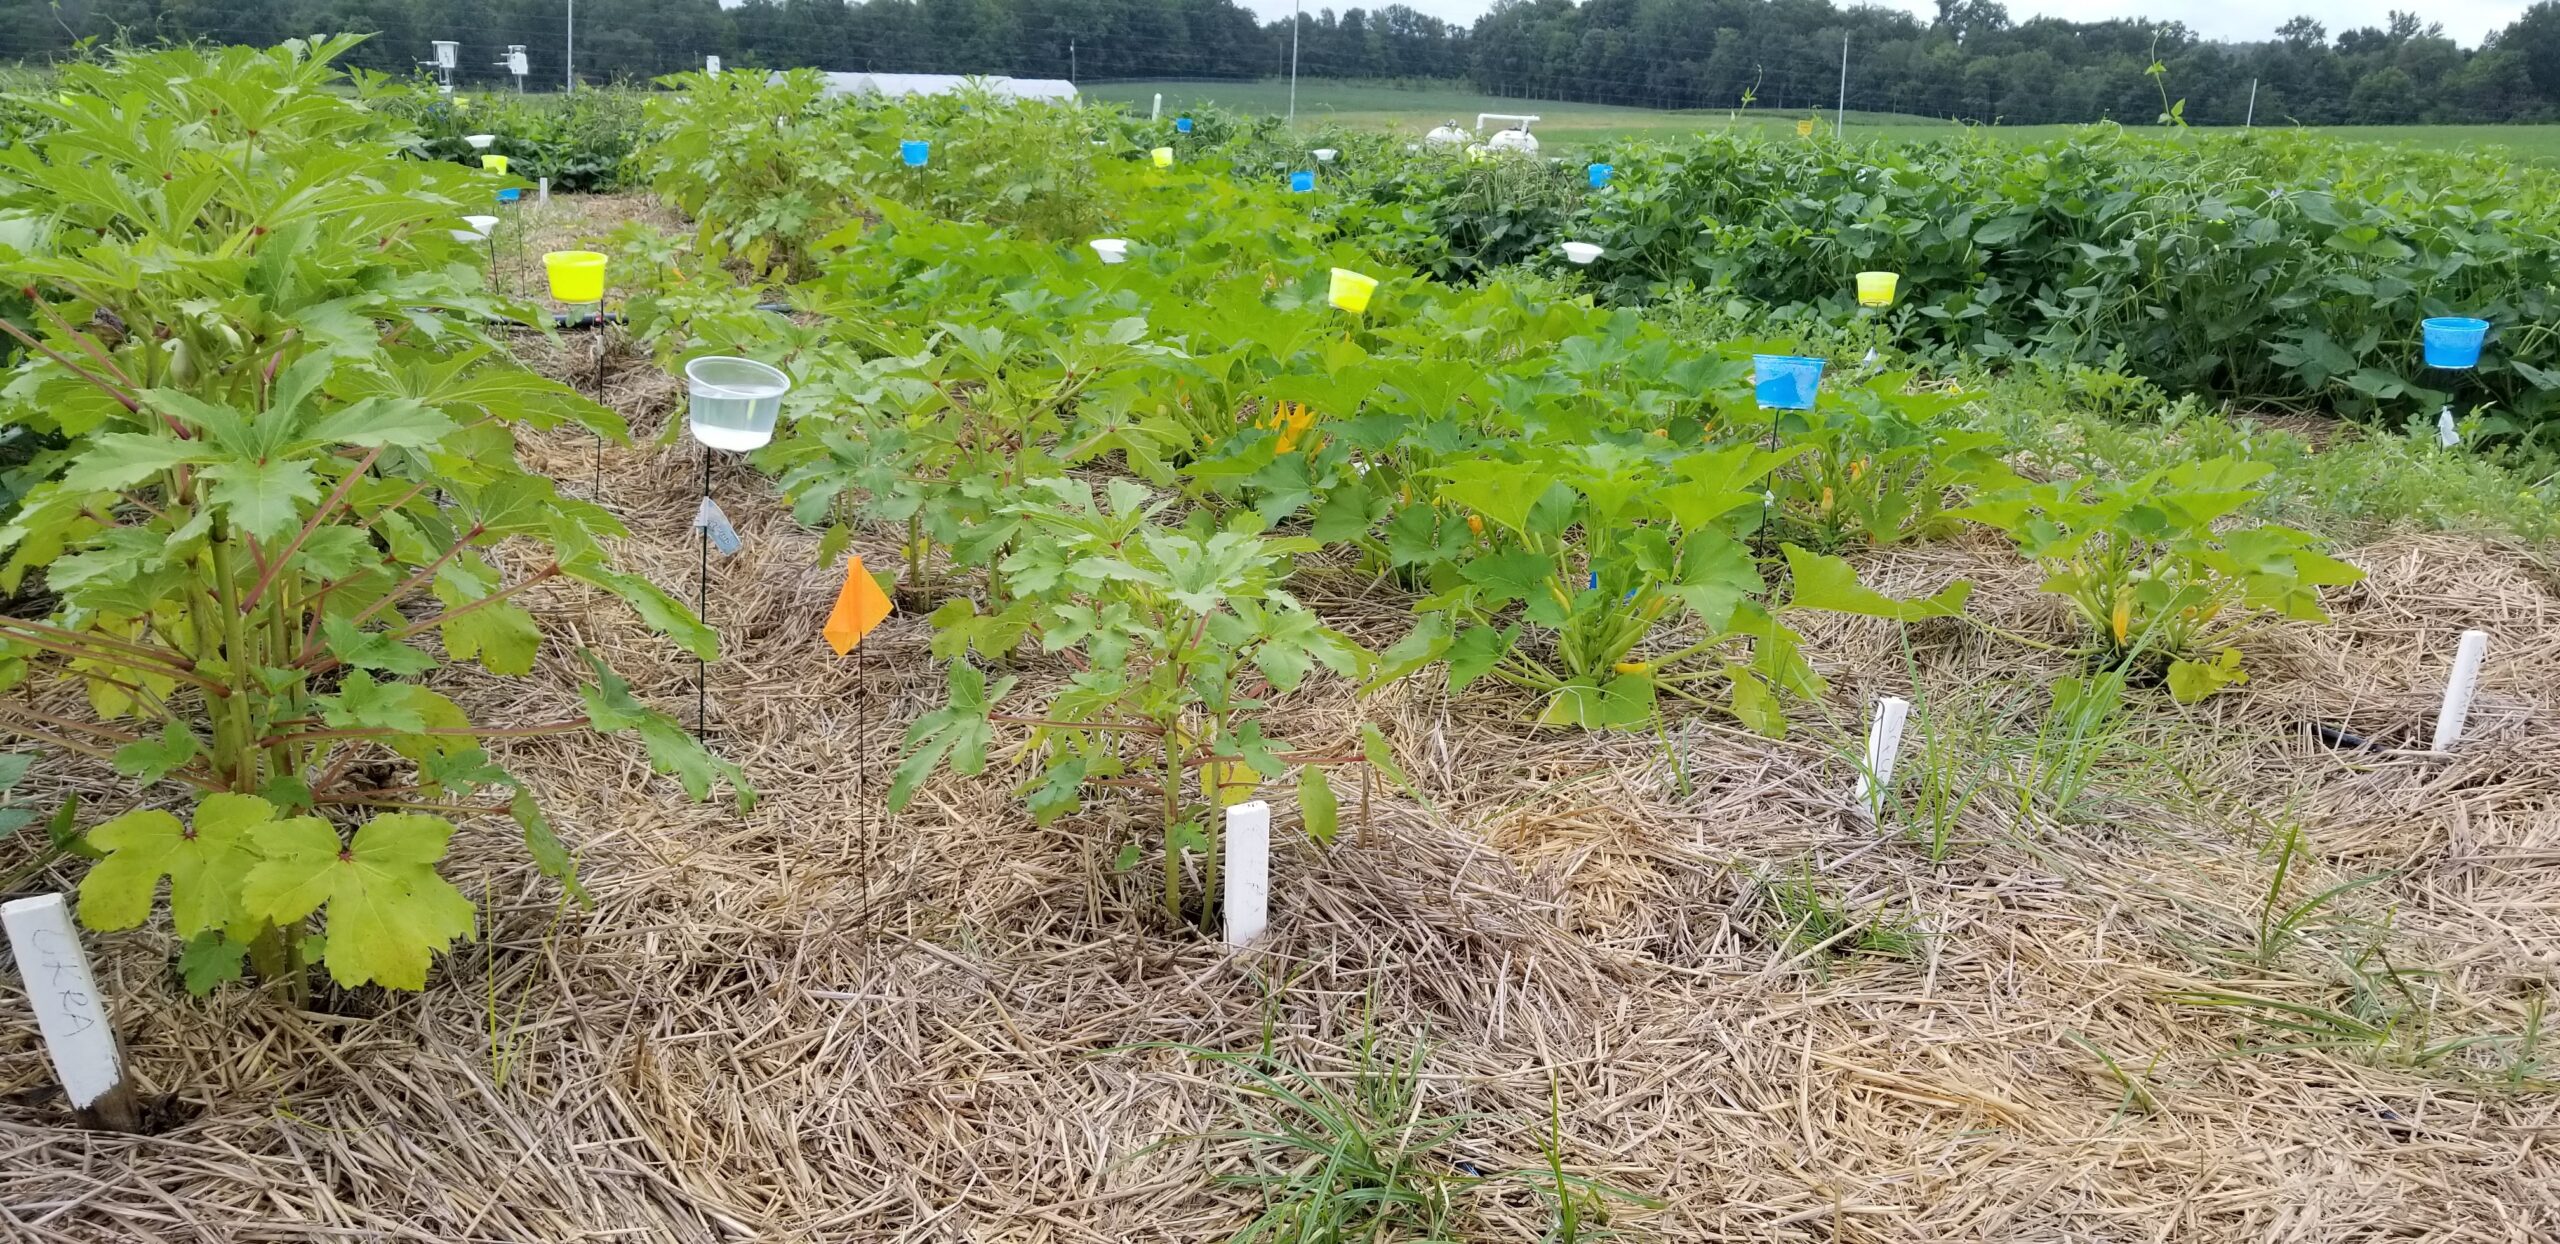
Evaluation of pollinators using pan trap: Pollinators were sampled within each treatment using pan traps. Traps were made from 16oz. polypropylene deli bowls painted with UV-bright fluorescent blue or yellow paint and unpainted 12oz. white styrofoam bowls. The bowls were individually glued onto a 36” plant prop using adhesive and one of each color bowl were placed between the 2 rows within each cowpea variety during the sampling period. Each bowl was filled with approximately 250mL of soapy water solution (2.5mL of detergent in 1-gallon water). Traps were set out early in the morning (8:00 -10:00 am) and collected after 24 hours weekly for 5 weeks. Traps were collected in the order they were placed to ensure that all traps were available to insects for the same amount of time. After 24 hours each pan trap was removed and drained and content removed and placed into vials containing 70% ethanol and stored for later identification.
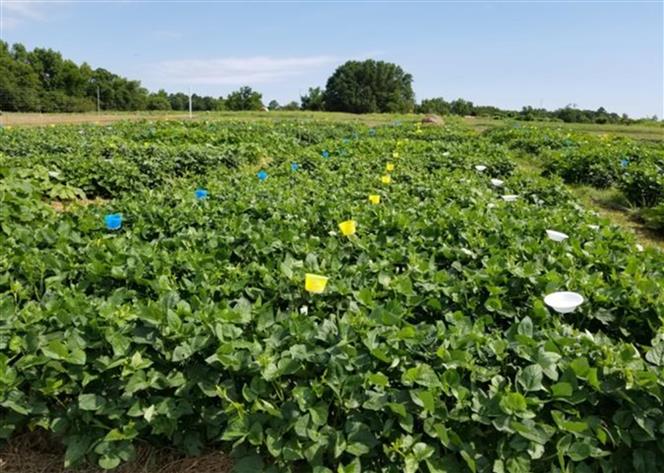 Experimental setup showing placement of blue, yellow and white pan traps
Evaluation of pollinators using sticky trap: For all treatments, sticky traps (Sticky Strips, Olson Products, Medina, OH 44358; 15-by-15-cm yellow cardboard sticky-coated on both surfaces) were impaled on plant stakes and placed between the two 5m rows. Traps were left exposed for 24 hours. Samples were collected weekly for five weeks.
Visual observation of pollinators and brown marmorated stink bug: For each cowpea variety, the two 5m rows were observed for 2 minutes each for pollinators (bees, carpenter bees, bumble bees, and lepidoptera) and brown marmorated stinkbug. Observations were conducted weekly for five weeks and data was recorded on the number of pollinators and BMSB.
Evaluation of nodulation efficiency: Two plants from each cowpea variety were dug up at flowering and placed in bags after the loose soil was carefully shaken off and labelled as needed. These were transported to the laboratory and assessed for fresh weight, nodule count and viability (by opening 5 nodules/plant).
Determination of chlorophyll content in situ: Chlorophyll readings were taken weekly using a chlorophyll meter (Konica SPAD-502Plus). For each cowpea treatment, five random plants were selected and measurements taken from one leaf (highest) of each plant. This method was chosen since height varied among the cowpea varieties. Individual SPAD readings were averaged for each treatment. Data was collected weekly for five weeks.
Evaluation of agronomic performance: At the fresh pod stage, twenty five fresh pods were harvested from each cowpea variety and weighed. The pods were opened, seeds counted and separated into damaged and undamaged seeds. The number of damaged and undamaged seeds were recorded. At the dry pod stage, twenty five dry pods were randomly selected from each cowpea variety and weighed. The pods were opened and seeds counted and separated into damaged and undamaged seeds and recorded.
Objective 2. Evaluate the effect of two best cowpea cultivars with pest and disease resistance, high nodulation and high pollinator attractiveness (from objective #1) on overall yield of vegetable crops in two cropping systems with/without cowpea (mono and intercropping).
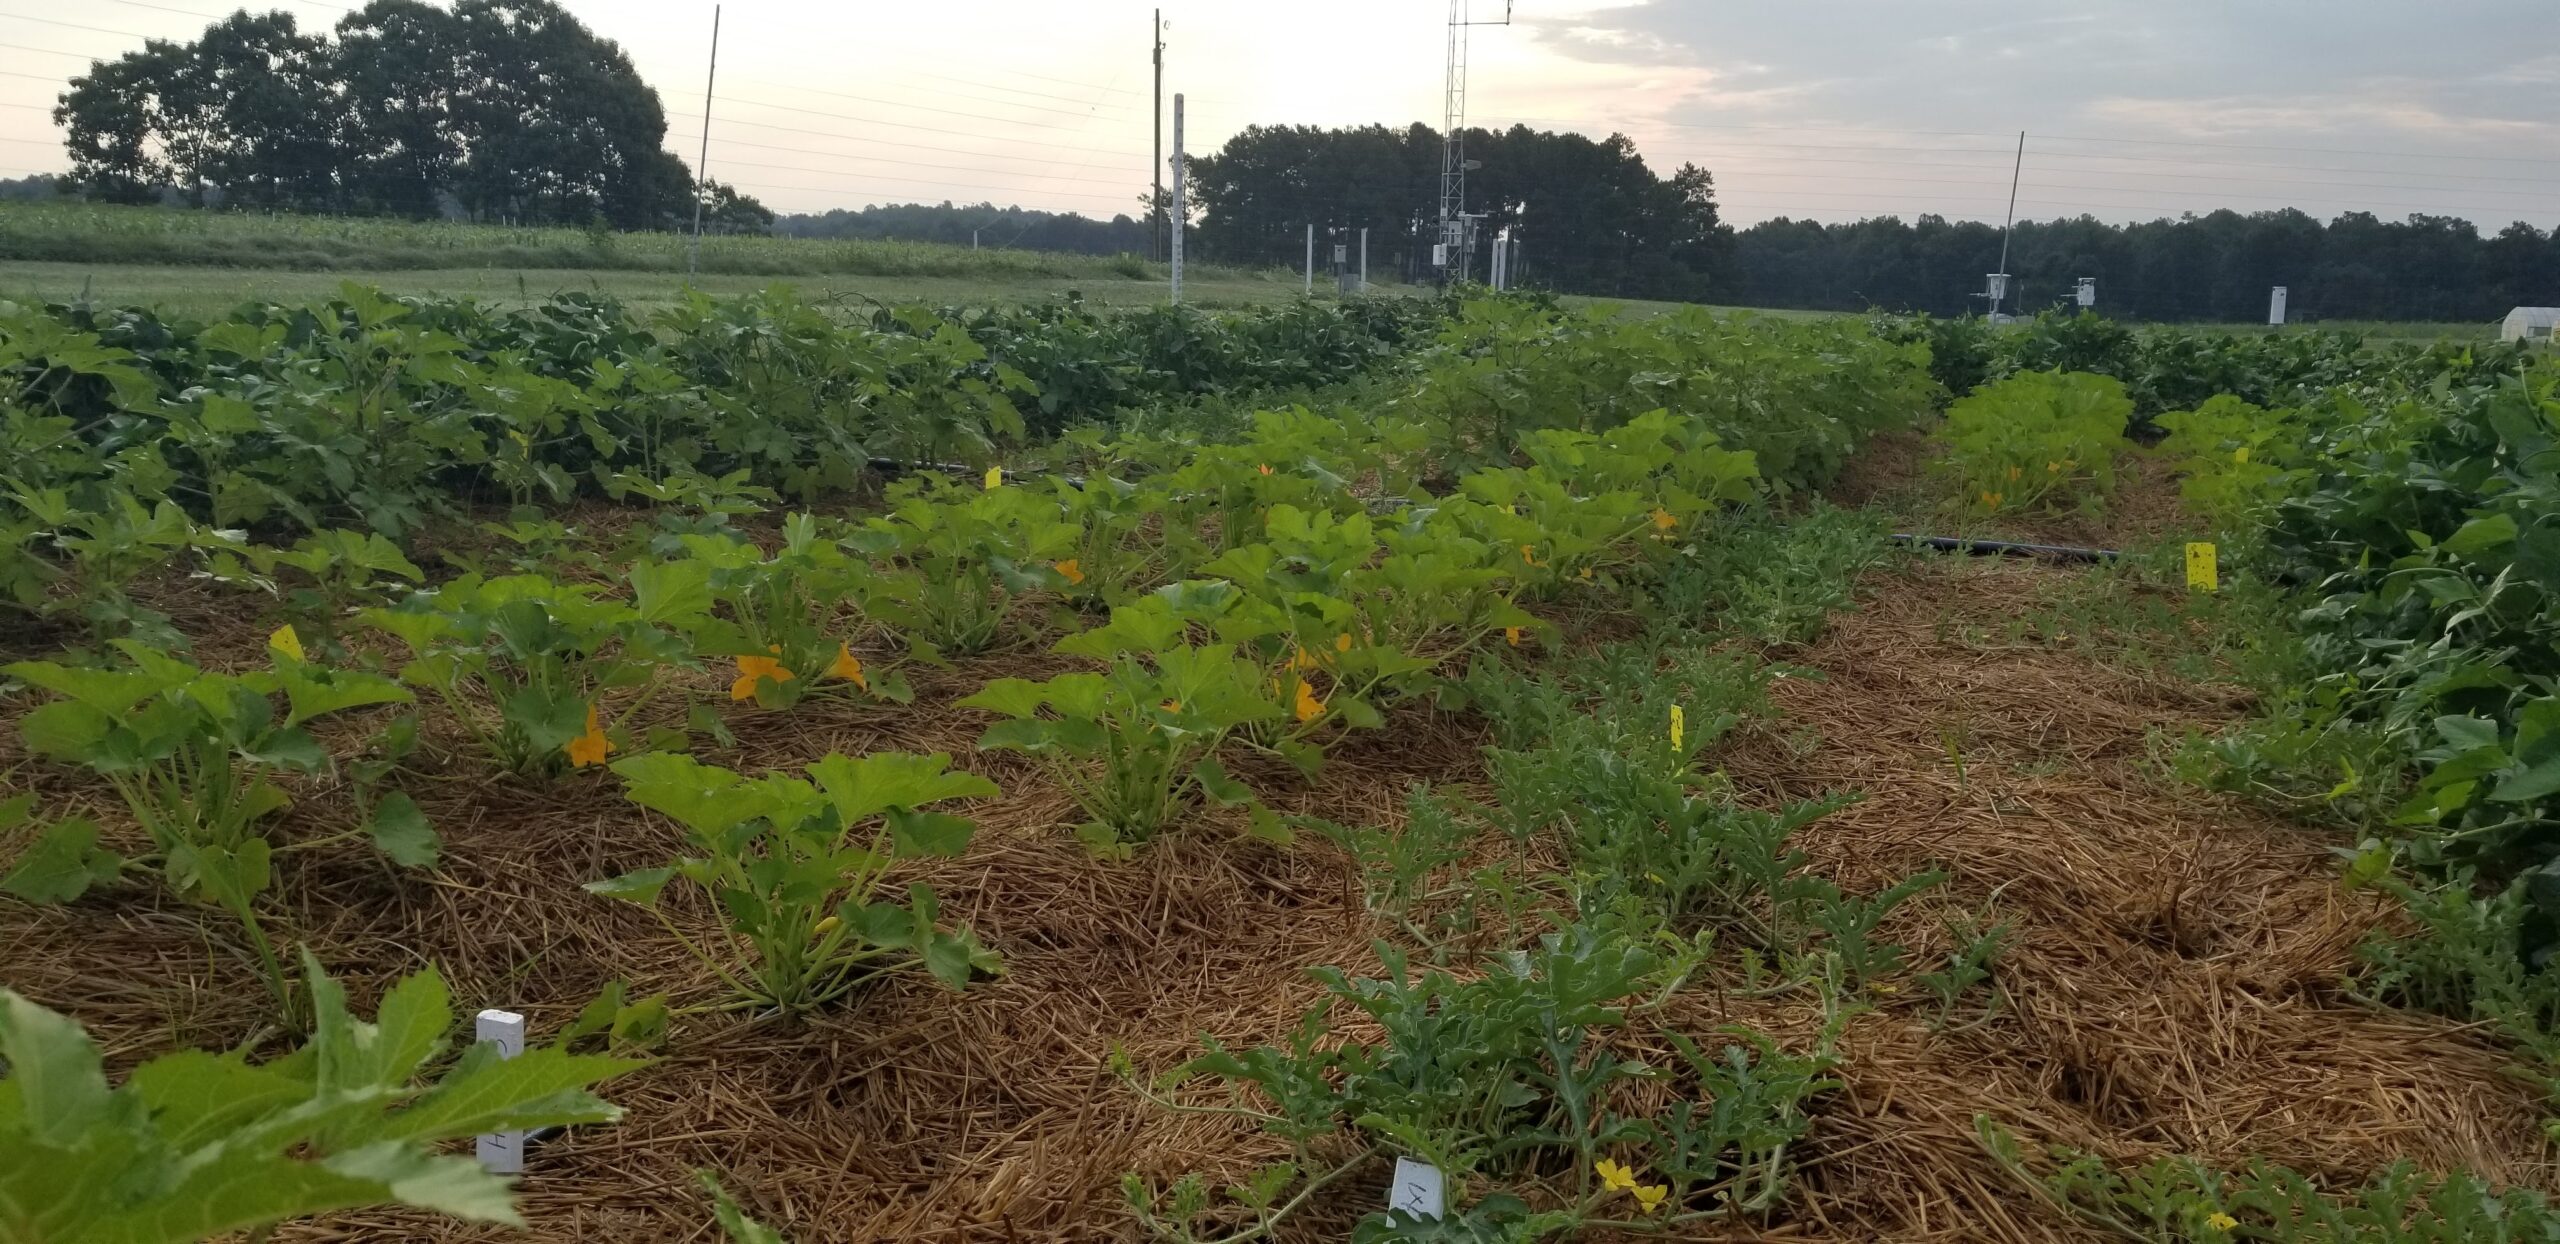
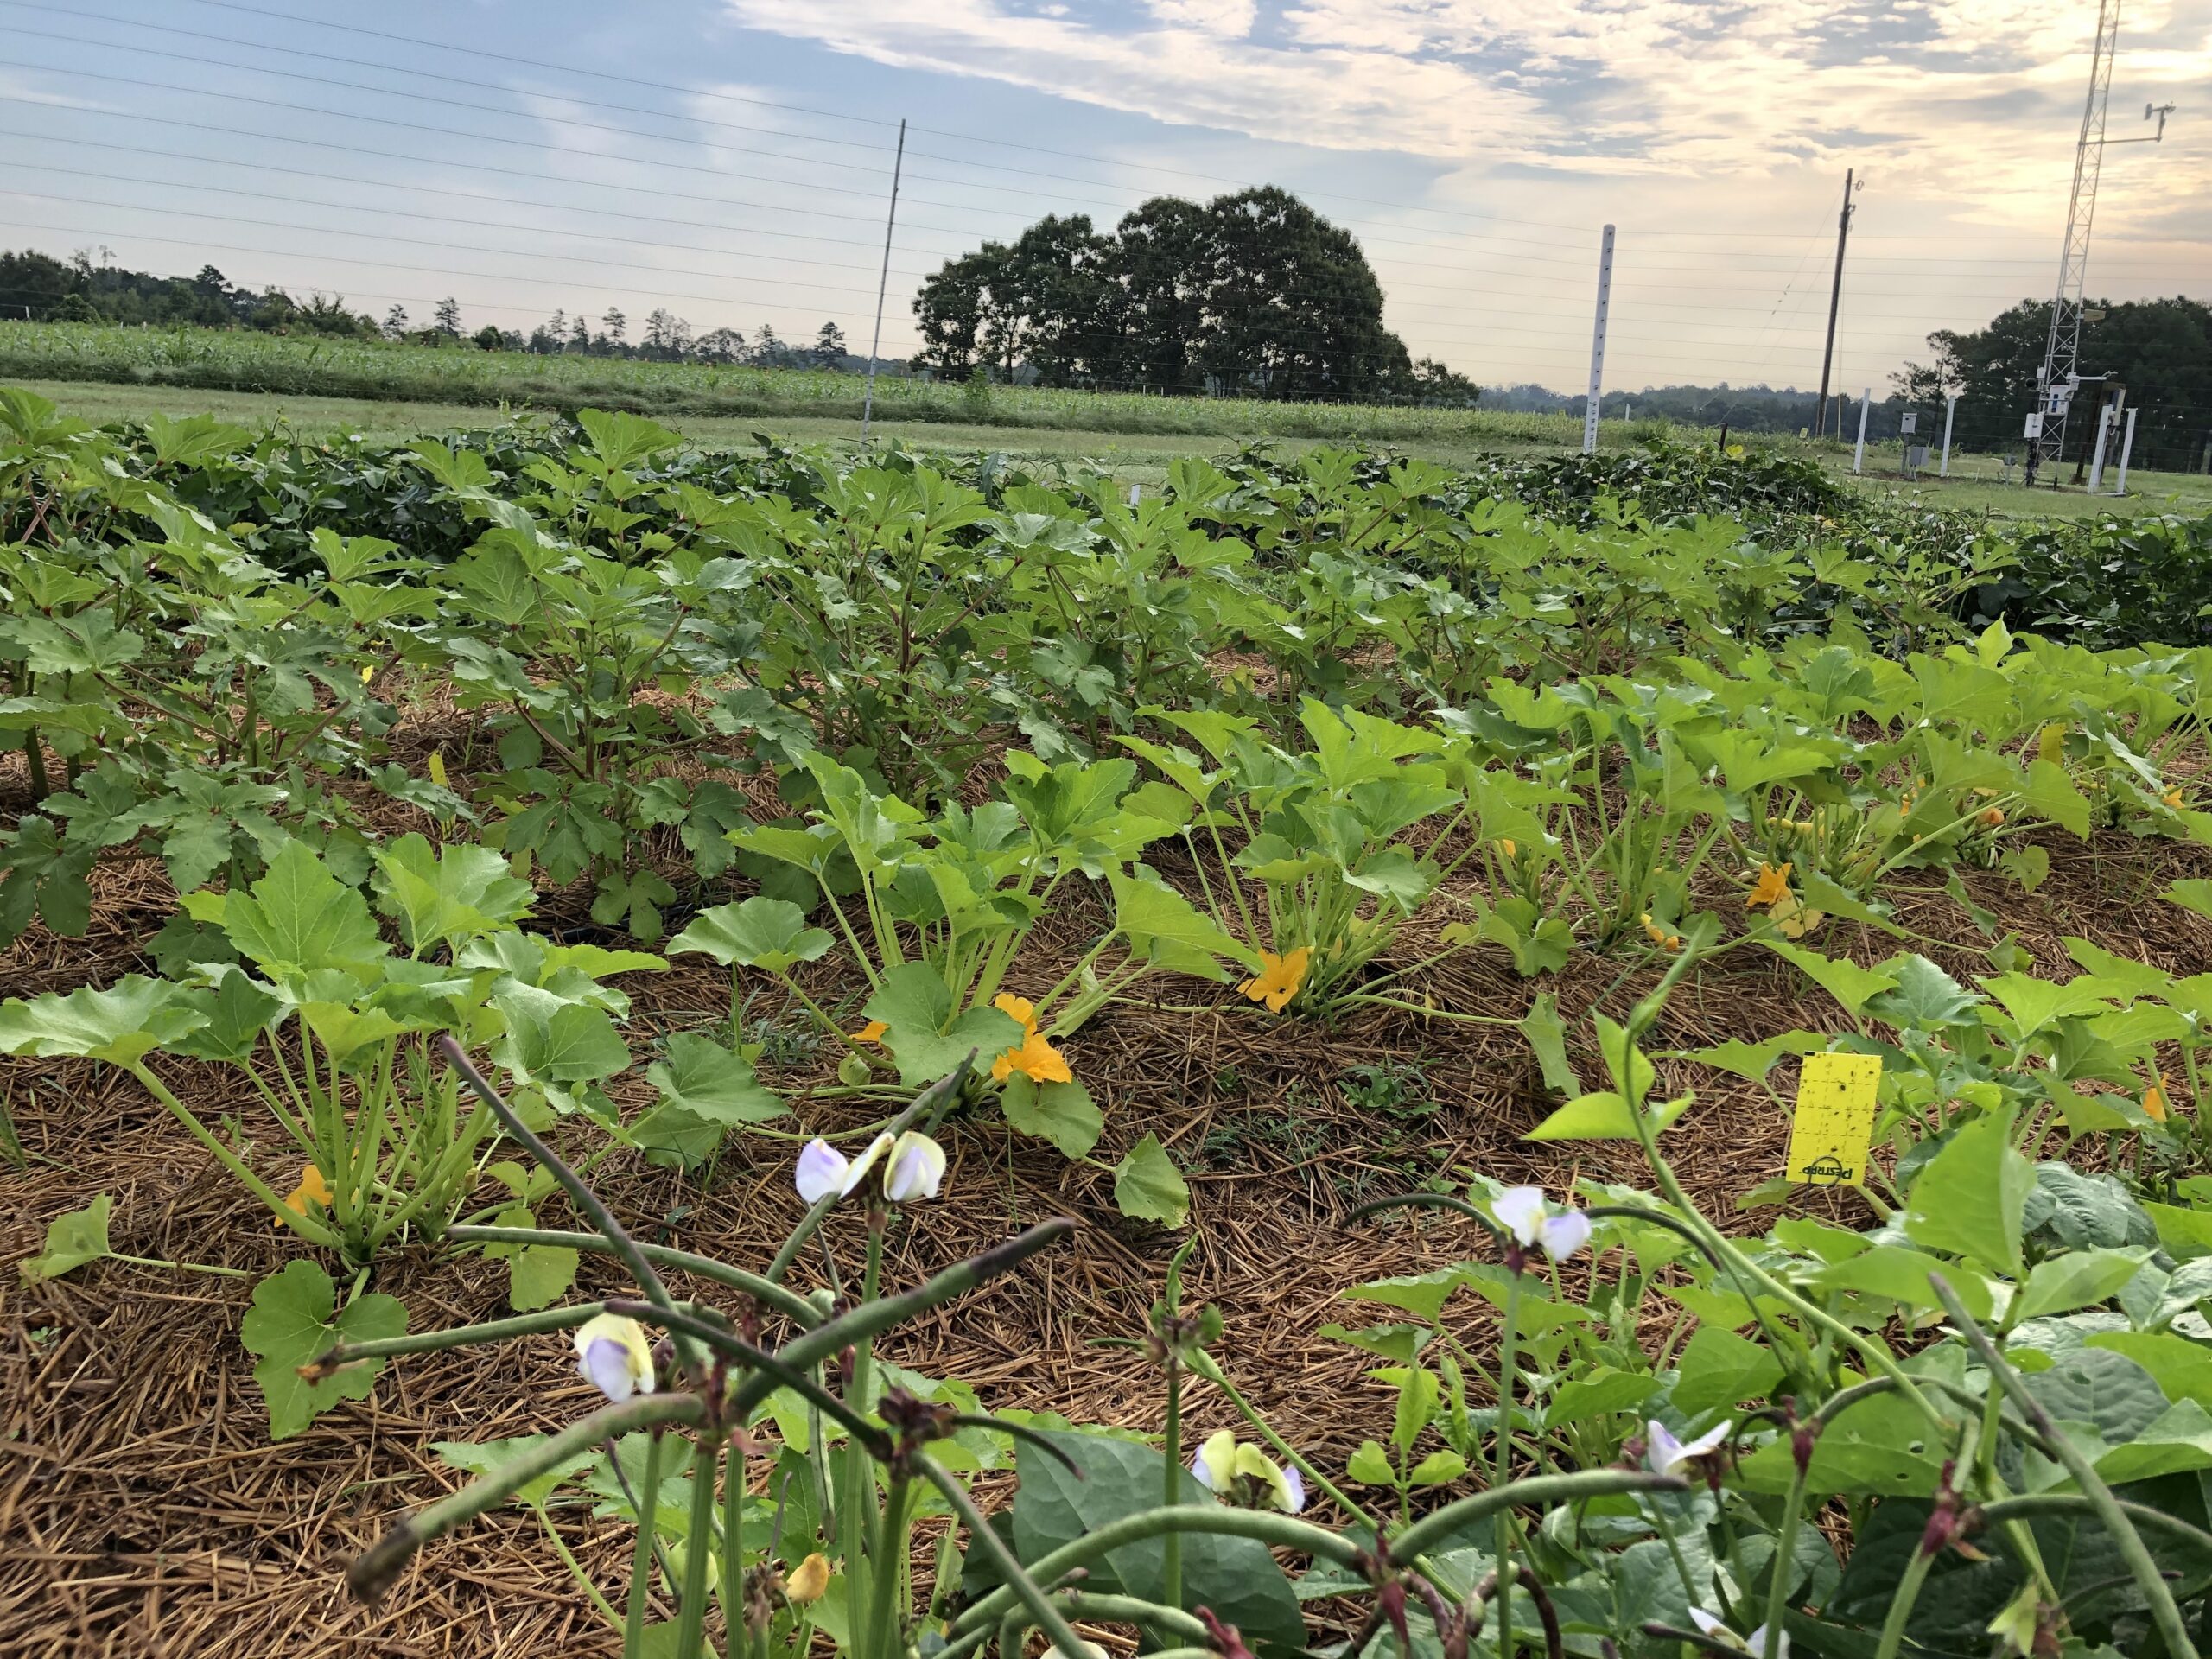
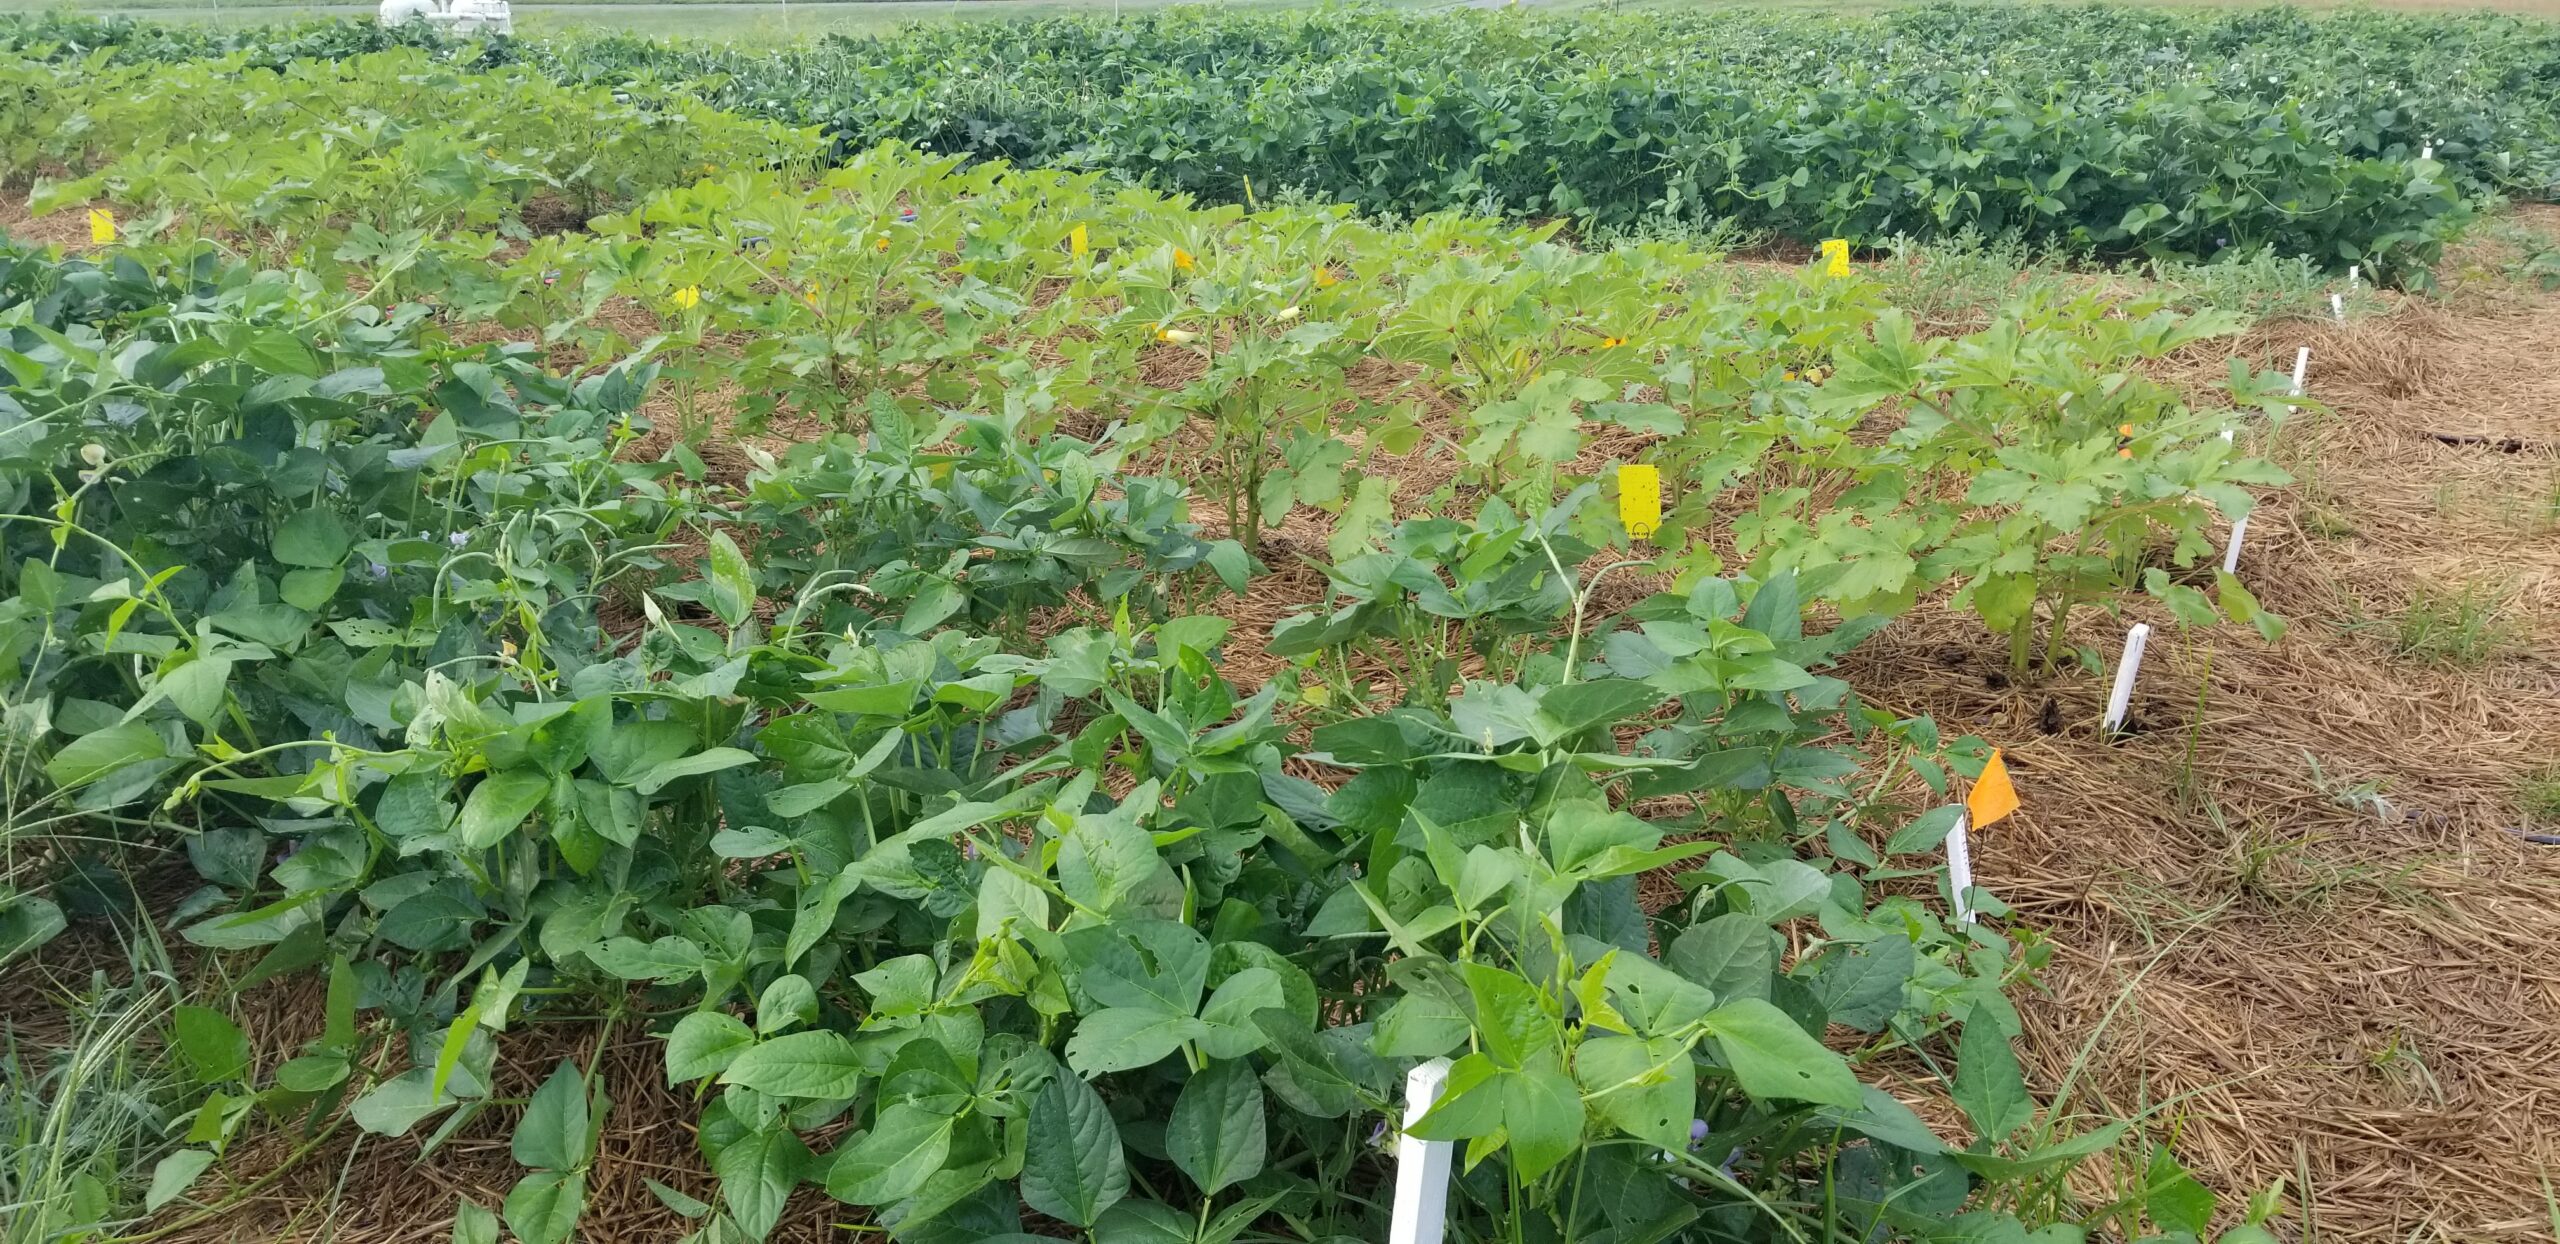
Experimental plots were established at the NCA&T Research Farm, Greensboro, NC in 2018 and 2019. Two cowpea varieties [Pinkeye Purple Hull (PPH) and Whippoorwill (WHIP)] selected from objective one based on their high attraction to pollinators were intercropped with three main crops (okra, watermelon, and squash). The experiment consisted of five treatments comprising squash, okra and water melon intercropped with cowpea planted on both borders. The treatments were: (1) Main crops + Pinkeye Purple Hull (PPH+PPH); (2) Main crops + Whippoorwill (WHIP+WHIP); (3) Main crops + Whippoorwill and Pinkeye Purple Hull (PPH+WHIP); (4) Whippoorwill (WHIP); and (5) Pinkeye Purple Hull (PPH). There were five rows of Pinkeye Purple Hull and Whippoorwill cowpea for treatment (PPH) and (WHIP) respectively, and one row of Pinkeye Purple Hull and Whippoorwill for (PPH+WHIP) treatment. Each treatment was planted on 2 rows, each 5 m long with 1m inter-row spacing and replicated four times in a Randomized Complete Block Design. The control plot (no cowpea) was planted about 10m away from the cowpea intercropped plots. The control treatment group contained one 5m row of each main crop (squash, okra and watermelon) with 1m inter-row spacing without cowpea intercropped at the borders. This was replicated three times in a Randomized Complete Block Design (RCBD). All treatments were mulched with wheat straw and irrigated as needed with drip irrigation. In 2018, we observed cowpea flowering before some of the main crops resulting in asynchrony of flowering stages between cowpea and the main crops. To avoid this happening, plants were staggered planted in 2019 such that cowpea and all the main crops flowered at the same time. The conventional recommendations of growing crops were used for each crop planted.
Evaluation of pollinators using pan trap: Pollinators were sampled within each treatment as described in objective one.
Evaluation of pollinators using sticky trap: Traps were placed between the two rows of each crop and sampling was done as in objective one.
Visual observation of pollinators and brown marmorated stink bug: For each treatment one 5m row was sampled as described in objective one.
Evaluation of agronomic performance: Crops were harvested over a five week period at maturity, weighed and data recorded. Watermelon was harvested for only a week due to excessive rainfall that led to the bursting of the fruits and subsequent wilting of the plants. Twenty-five pods of each variety of cowpea were also harvested and weighed at fresh and dry pod stage. The pods were opened, and seeds counted and separated into damaged and undamaged seeds and recorded.
Objective 1. Objective 1. Identify cowpea cultivars for resistance to pests and diseases and pollinator activity and nodulation efficiency.
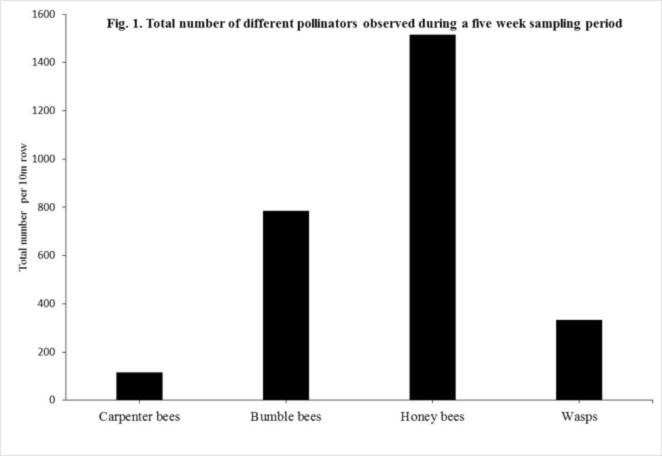
Results from NC A&T: From visual observations, honey bees, carpenter bees and bumble bees and wasps were noticeable pollinators on the research plots.
Overall, during the five weeks sampling period, more honey bees were observed followed by bumble bees (Fig. 1).
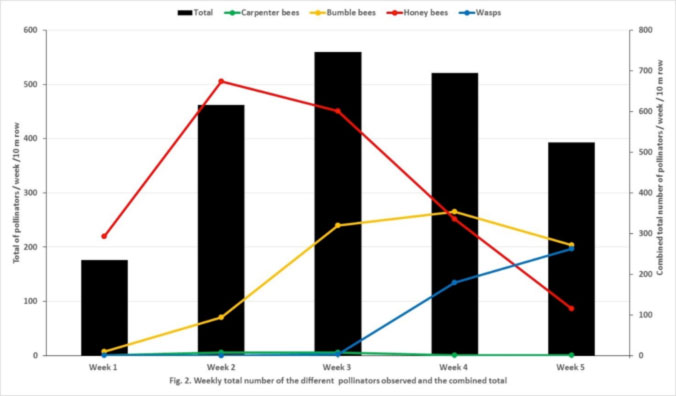
During the first three weeks of visual sampling, there was a steady increase in the total number of pollinators observed followed by a decline (Fig. 2). This increase can be attributed to the presence of more honey bees observed during this time compared to the other pollinators (Fig. 2). Later in the season, the population of honey bees declined but carpenter bee and wasp populations were on the increase (Fig. 2).
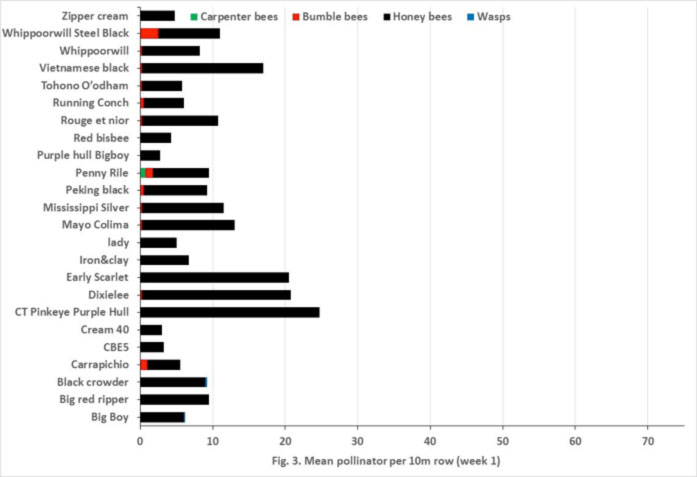
More honey bees were observed during the first week and our data during this sampling period show most of the honey bees (21, 22 and 25) were recorded on Early Scarlet, Dixielee and CT pinkeye purple Hull cowpeas respectively (Fig. 3).
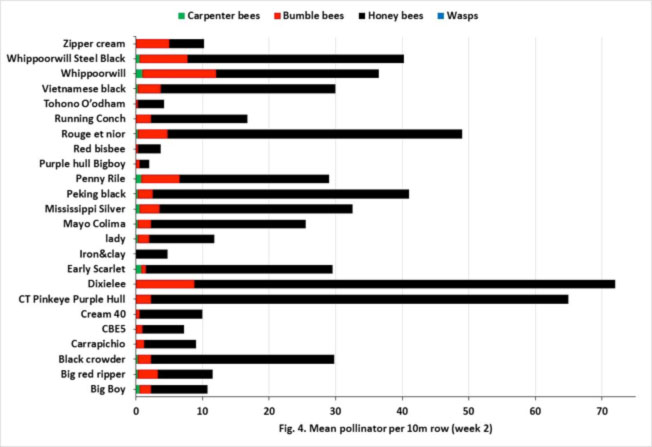
In the second week honey bees were still the major pollinator observed in the presence of some bumble bees and a few carpenter bees (Fig. 4). The distribution of honey bees varied among the twenty-four cowpea varieties with >30 honey bees observed on Mississippi Silver, whippoorwill Steel Black and whippoorwill; >40 observed on Perking black and Rouge et noir; >60 on CT Pinkeye purple Hull and Dixielee (Fig. 4).
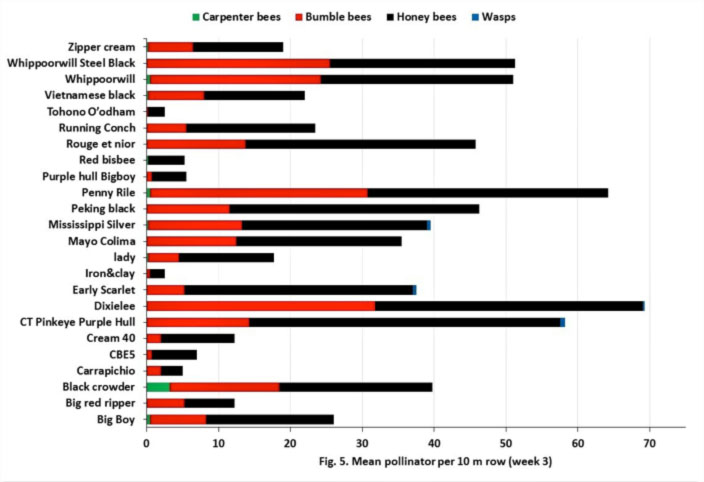
In week three more honey bees and bumble bees were observed on most of the cowpea varieties except for Red Bisbee which had no bumble bees. Most of the pollinators were observed on CT Pinkeye purple Hull, Dixielee, Penny Rile and Whippoorwill, Whippoorwill Steel Black (Fig. 5).
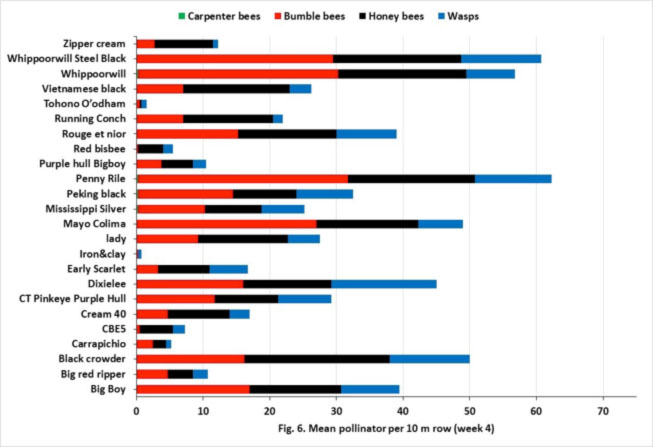
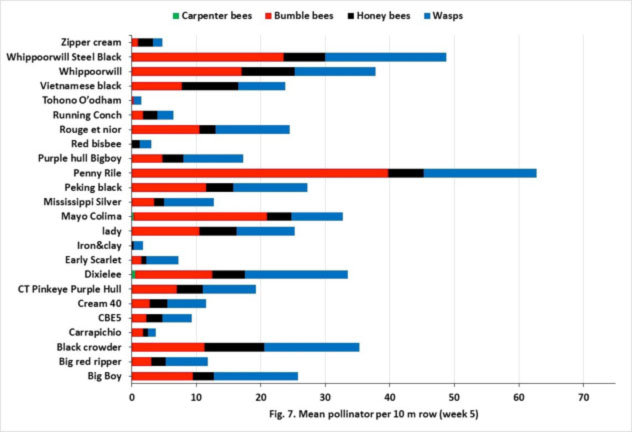
In week four and five, the population of bumble bees observed had declined and that of carpenter bees and wasps had increased with more pollinators observed on CT Pinkeye purple Hull, Penny Rile and Whippoorwill and Iron and Clay, Red Bisbee and Tohono O'odham recording the least pollinators (Figs. 6 and 7). Results from sticky cards indicate that the number of pollinators was highest during the third week of sampling, similar to results from visual observations.
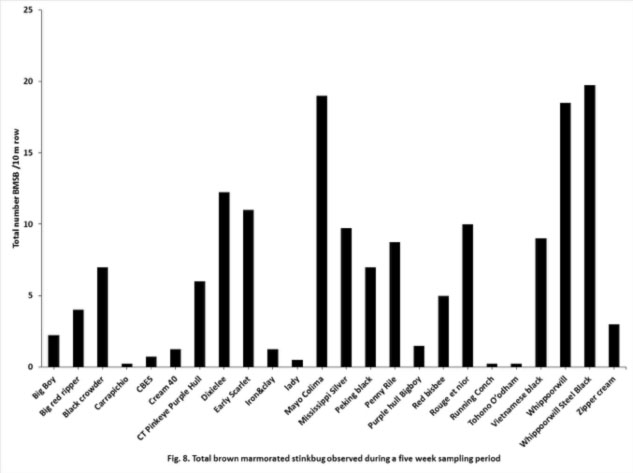
The number of brown marmorated stink bug (BMSB) observed on the twenty-four cowpea varieties was different among the varieties with the least BMSB observed on Carrapichio, California Black Eye5, Cream 40, Iron and Clay, Lady, Running Conch, Purple Hull Bigboy and Tohono O’odham (Fig. 8). More BMSB were observed on CT Pinkeye purple Hull, Whippoorwill and Dixielee (Fig. 8) the same varieties on which more pollinators were observed.
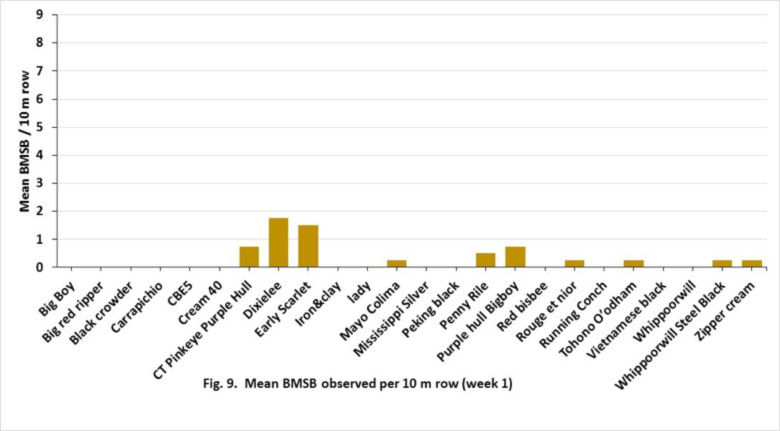
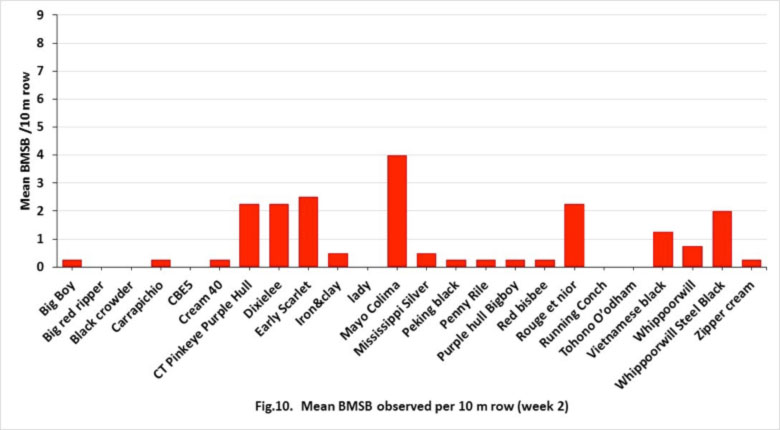
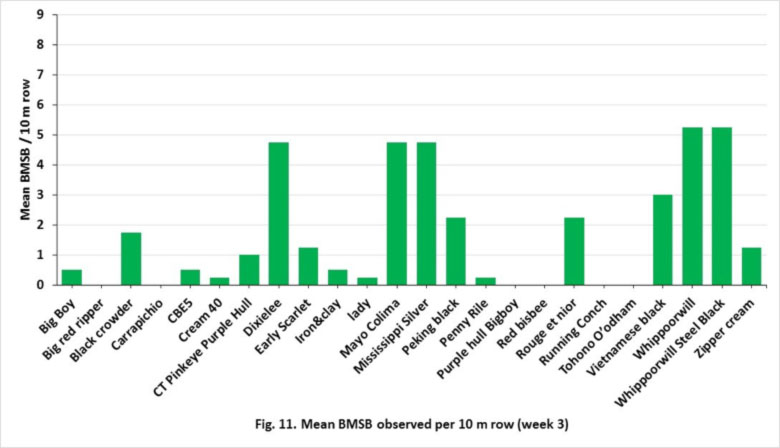
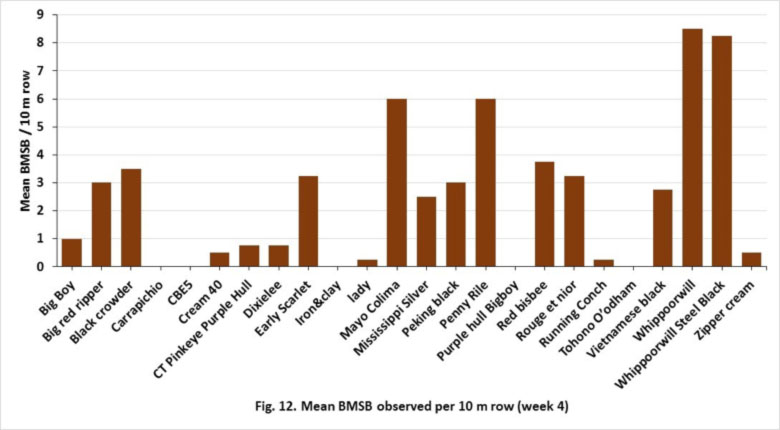
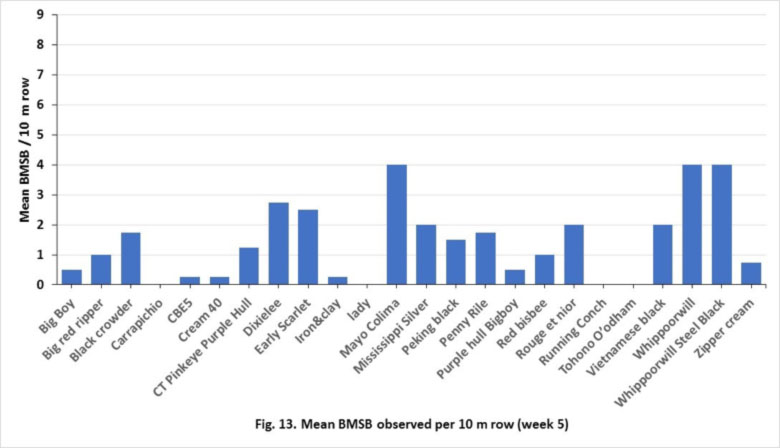
During the five weeks of visual observations, the number of brown marmorated stink bug varied over the weeks and among the varieties (Figs. 9-13).
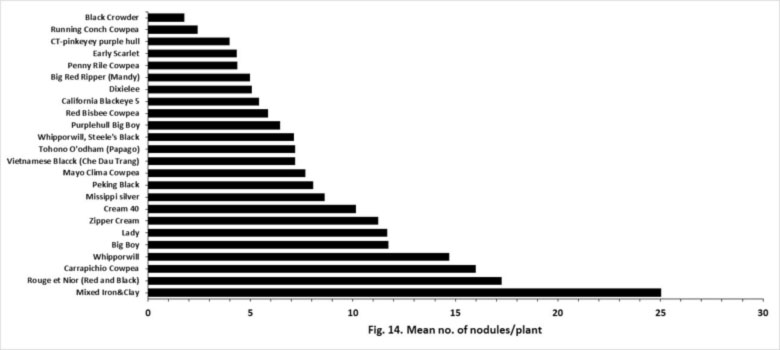
A number of cowpea cultivars were efficient at producing a large number of nodules with indigenous rhizobia (Mixed Iron and Clay, Rouge et noir, Carrapichio and Whippoorwill) and low mean number of nodule were recorded in Black Crowder, Running Conch, CT Pinkeye Purple Hull and Early Scarlet (Fig. 14).
Our results indicate that the chlorophyll content was not different among the different cowpea cultivar (Table 1). Results from yield data indicate that most of the cowpea varieties produced more pods except Iron and Clay and Tohono O’odham which were vegetative throughout the season. The least fresh pod weight was recorded for Cream 40, Lady and Penny Rile (Table 2). From the fresh seeds, Big boy had the most (51%)damaged fresh seeds and Whippoorwill had the least (27%) damaged dry seeds (Table 2).
| Table 1. Chlorophyll content (SPAD Units) of 24 cowpea varieties | ||||||
| Varieties | Mean (±SE) Chlorophyll content | |||||
| Week 1 | Week 2 | Week 3 | Week 4 | Week 5 | Mean | |
| Big Boy | 57.3 ±1.7 | 61.5±1.5 | 66.1±1.7 | 67.8±1.5 | 63.5±1.8 | 63.2±1.8 |
| Big red ripper | 53.8 ±1.7 | 58.4±2.0 | 64.4±1.6 | 58.9±1.5 | 60.3±1.6 | 59.1±1.7 |
| Black crowder | 56.3± 2.8 | 60.2±1.5 | 62.9±1.4 | 64.5±1.6 | 63.3±1.6 | 61.4±1.5 |
| Carrapichio | 54.9± 1.2 | 57.4±1.3 | 62.8±1.3 | 61.7±1.1 | 58.9±1.6 | 59.2±1.4 |
| CBE5 | 63.5± 2.5 | 64.9±1.6 | 67.8±1.6 | 63.0±1.8 | 59.7±2.0 | 63.8±1.3 |
| Cream 40 | 59.6±2.2 | 60.3±1.8 | 67.7±1.7 | 66.2±1.4 | 64.4±1.7 | 63.6±1.6 |
| CT Pinkeye Purple Hull | 65.7±1.2 | 65.1±2.1 | 68.8±1.1 | 69.5±1.6 | 67.1±1.2 | 67.2±0.9 |
| Dixielee | 59.2±1.5 | 63.3±1.3 | 64.8±1.1 | 63.0±1.3 | 59.0±1.6 | 61.9±1.2 |
| Early Scarlet | 60.8±1.9 | 63.2±1.1 | 65.4±1.2 | 64.1±1.2 | 61.9±1.7 | 63.1±0.8 |
| Iron & clay | 50.2±2.2 | 61.3±1.3 | 61.4±1.6 | 58.0±1.5 | 62.7±1.3 | 58.7±2.3 |
| lady | 56.2±3.3 | 66.8±1.1 | 65.7±1.1 | 65.4±1.0 | 64.4±1.8 | 63.7±1.9 |
| Mayo Colima | 62.6±2.4 | 61.4±1.3 | 64.5±1.2 | 65.2±1.3 | 62.9±1.7 | 63.3±0.7 |
| Mississippi Silver | 59.9±2.1 | 62.1±1.4 | 66.7±1.4 | 63.1±1.4 | 62.3±1.7 | 62.8±1.1 |
| Peking black | 56.4 ±1.5 | 60.6±1.1 | 64.0±1.6 | 65.4±1.3 | 61.3±1.2 | 61.5±1.5 |
| Penny Rile | 55.6±2.1 | 62.7±1.0 | 69.5±0.9 | 64.9±2.3 | 66.5±1.2 | 63.8±2.3 |
| Purple hull Bigboy | 60.8±1.6 | 58.7±1.4 | 66.9±1.3 | 65.5±1.0 | 66.8±1.9 | 63.7±1.7 |
| Red bisbee | 53.9±1.9 | 53.3±1.2 | 60.2±1.3 | 54.0±1.6 | 53.9±1.3 | 55.1±1.3 |
| Rouge et nior | 62.1±1.0 | 60.4±1.2 | 66.8±1.0 | 64.5±1.5 | 60.9±1.4 | 62.9±1.2 |
| Running Conch | 55.7±1.8 | 59.7±1.4 | 60.3±1.5 | 61.2±1.2 | 61.0±1.6 | 59.6±1.0 |
| Tohono O’odham | 56.0 ±1.5 | 60.3±1.0 | 58.8±1.6 | 56.0±1.6 | 56.5±1.4 | 57.5±0.9 |
| Vietnamese black | 55.6 ±1.7 | 64.3±1.3 | 63.2±2.1 | 63.9±1.3 | 63.0±1.7 | 62.0±1.6 |
| Whippoorwill | 59.6± 1.5 | 62.6±1.6 | 67.2±1.2 | 68.7±1.5 | 64.3±2.0 | 64.5±1.9 |
| Whippoorwill Steel Black | 55.4 ±1.3 | 57.6±2.2 | 62.6±1.5 | 63.7±1.3 | 65.0±2.1 | 60.9±1.6 |
| Zipper cream | 60.4 ±2.6 | 62.0±1.2 | 69.6±1.0 | 63.7±1.2 | 62.3±1.5 | 63.6±1.2 |
Table 2. Fresh and dry seed yield and percentage damage of 24 cowpea varieties
| Varieties | Fresh pod Weight (g) | Dry pod Weight (g) | % Fresh seed damaged | % Fresh seed undamaged | % Dry seed damaged | % Dry seed undamaged |
| Big Red Ripper | 261.5 | 61.3 | 26.6 | 73.4 | 58.4 | 41.6 |
| Black Crowder | 220.1 | 52.6 | 22.3 | 77.7 | 66.4 | 33.6 |
| Carrapichio | 204.5 | 58.7 | 35.1 | 64.9 | 64.2 | 35.8 |
| CBE5 | 150.2 | 44.7 | 46.8 | 53.2 | 60.7 | 39.3 |
| Cream 40 | 85.7 | 33.3 | 18.2 | 81.8 | 63.6 | 36.4 |
| CT Pinkeye Purple Hull | 184.8 | 41.8 | 19.3 | 80.7 | 66.8 | 33.2 |
| Dixielee | 181.3 | 45.6 | 27.8 | 72.2 | 57.2 | 42.8 |
| Early Scarlet | 193.4 | 32 | 23.9 | 76.1 | 49.1 | 50.9 |
| Lady | 55.7 | 31.4 | 28.7 | 71.3 | 68.5 | 31.5 |
| Iron & Clay | Vegetative | Vegetative | Vegetative | Vegetative | Vegetative | Vegetative |
| Mayo Colima | 214 | 50.4 | 28.6 | 71.4 | 50.8 | 49.2 |
| Mississippi Silver | 180.6 | 52.5 | 35.1 | 64.9 | 57.8 | 42.2 |
| Peking Black | 177.8 | 51.9 | 33.5 | 66.5 | 64.1 | 35.9 |
| Penny Rile | 94.6 | 47 | 35 | 65 | 56 | 44 |
| Purple Hull Big boy | 208.4 | 46.8 | 33.4 | 66.6 | 71.7 | 28.3 |
| Red Bisbee | 225.5 | 62.7 | 31.3 | 68.7 | 52.6 | 47.4 |
| Rouge et Noir | 292.1 | 46.1 | 29.7 | 70.3 | 64.4 | 35.6 |
| Running Conch | 154.4 | 27.3 | 11.3 | 88.7 | 60.6 | 39.4 |
| Tohono O’odham | Vegetative | Vegetative | Vegetative | Vegetative | Vegetative | Vegetative |
| Vietnamese Black | 137.6 | 54.3 | 24.4 | 75.6 | 54.6 | 45.4 |
| Whippoorwill | 207.9 | 45.8 | 35.4 | 64.6 | 41.4 | 58.6 |
| Whippoorwill Steel Black | 125.1 | 43.3 | 31.9 | 68.1 | 27.3 | 72.7 |
| Zipper Cream | 220.2 | 48 | 16.4 | 83.6 | 59.4 | 40.6 |
Results from FVSU:
From sweep net trap, wasps were more prominent on the research plots (Figure 15). Numbers of wasp were significantly higher in first week (Figure 16). In addition, more wasps were recorded on SaDandy cowpea variety in first week while in second week, higher numbers of wasp were found on Big Boy cowpea variety (Figure 17 and 18).
With respect to bees, high numbers of sweat bees were found on all cowpea varieties in the first week of trapping. Honey bees were next to sweat bees in the numbers trapped. Some bumble bees were trapped in second week (Figure 17 and 18). C.T. Dimpled Brown Crowder variety was found to be more susceptible to insect pest attack particularly leafhopper and aphid during first and second week (Figure 19).
During third and fourth week, sweet bees were found consistently attracted to C.T. Dimpled Brown Crowder, California Blackeye and Cream 40 (Figure 20 and 21). Leafhopper and aphids were consistently recorded on each variety of cowpea during third and fourth weeks of sampling (Figure 22). More pollinators were found during fifth and sixth week. In addition, bumble bees and sweet bee numbers were significantly high on sixth week (Figure 23). SaDandy variety of cowpea was found to be more attractive to wasp. Mississippi silver variety was least susceptible to attack by insect pests (Figure 24).
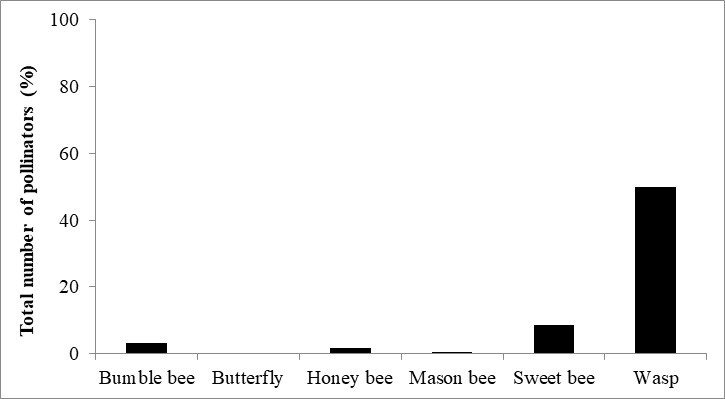
Figure 15. Total number of pollinators collected from cowpea farm in first and second week.
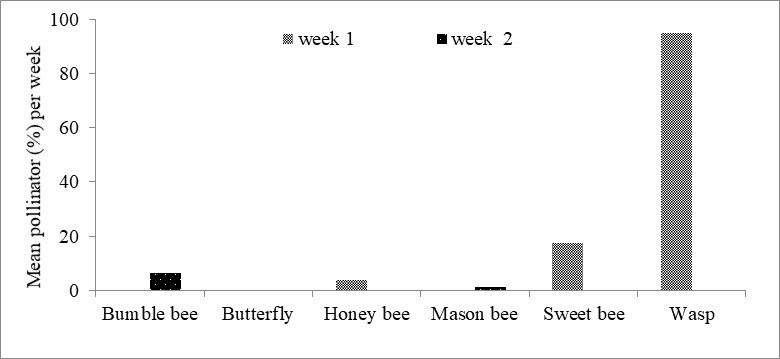
Figure 16. Mean pollinators per variety per week.
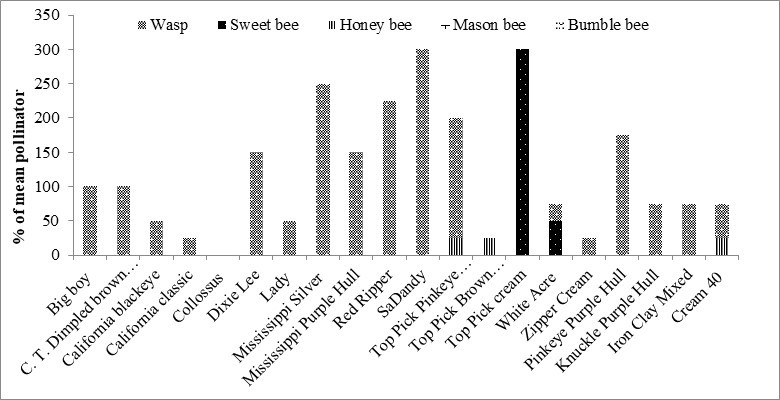
Figure 17. Mean (%) insect pollinators per cowpea variety during first week.
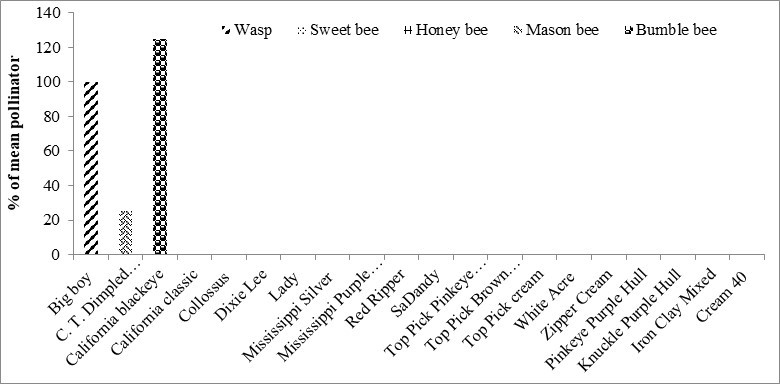
Figure 18. Mean (%) insect pollinators per cowpea variety during second week.
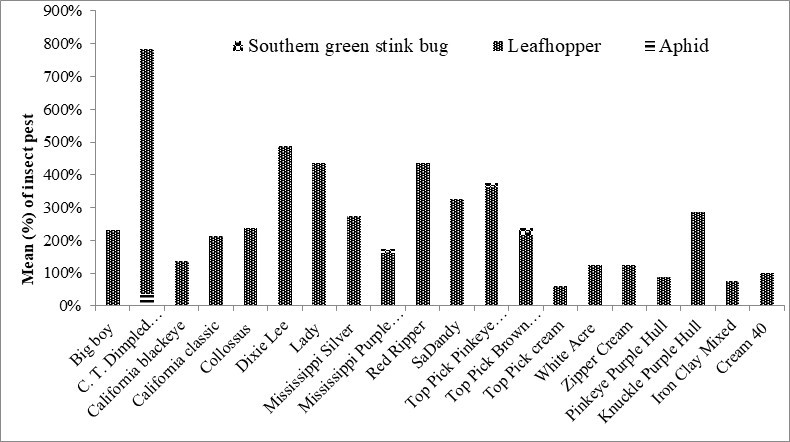
Figure 19. Percentage mean of insect pest (%) on cowpea during first two weeks.
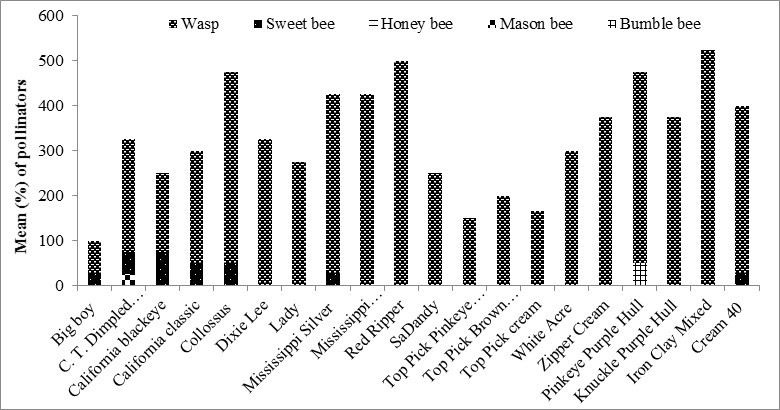
Figure 20. Average (%) of pollinator per cowpea variety in third week.
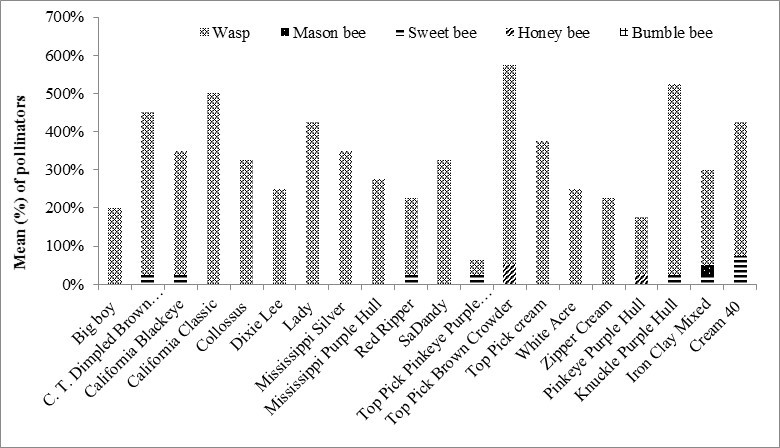
Figure 21. Average number (%) of pollinator per cowpea variety in fourth week.
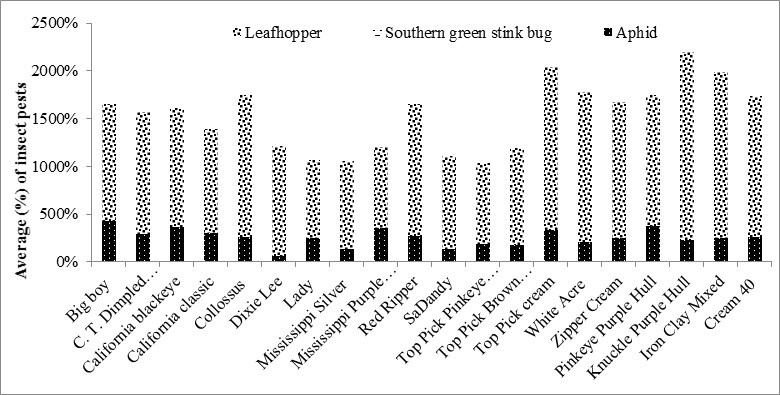
Figure 22. Percentage mean of insect pest (%) that attacked cowpea during third and four weeks.
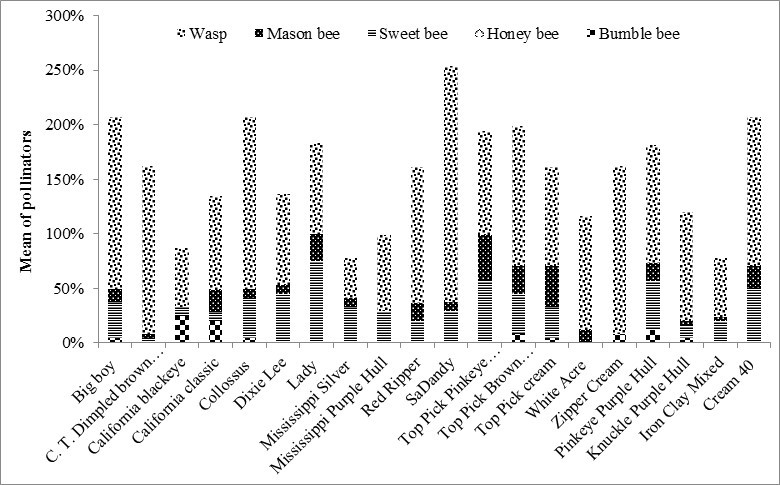
Figure 23. Mean percentage of insect pollinators on variety of cowpea during fifth and sixth weeks.
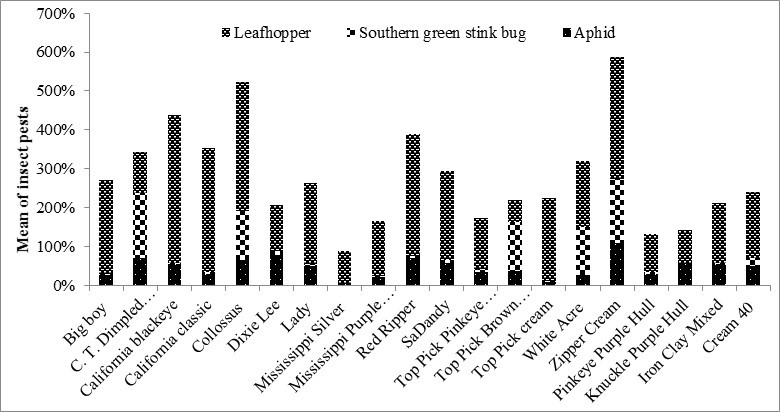
Figure 24. Percentage mean of insect pest attack on each variety of cowpea during fifth and sixth weeks.
Yield data showed that the highest dry pod weight was for Collossus variety of cowpea and the least for White Acre as well as Top Pick cream cowpea varieties (Table 3). Furthermore, Big Boy had the most (45.1 ± 9.9) damaged seeds and Red Ripper had the least (3.3 ± 0.5) damaged seeds.
Table 3. Dry seed yield and damage as well as undamaged seeds of 20 cowpea varieties
|
Mean ± S.E |
|||||
|
|
Wt. of pods (g) |
No. of damage seeds |
No. of undamaged seeds |
Wt. of damage seeds (g) |
Wt. of undamaged seeds (g) |
|
Big boy |
45.1 ± 9.9 |
184.7 ± 7.3 |
24.7 ± 8.4 |
25.2 ± 4.9 |
6.3 ± 3.1 |
|
C. T. Dimpled Brown Crowder |
41.7 ± 9.8 |
154.5 ± 15.4 |
87.7 ± 31.3 |
13.2 ± 1.2 |
16.2 ± 7.0 |
|
California Blackeye |
47.4 ± 6.4 |
132.2 ± 20.4 |
107.5 ± 25.1 |
13.1 ± 1.3 |
19.8 ± 5.1 |
|
California Classic |
43.7 ± 8.1 |
129.0 ± 27.0 |
80.0 ± 26.4 |
15.7 ± 3.8 |
17.3 ± 6.4 |
|
Collossus |
50.7 ± 6.0 |
102.7 ± 3.9 |
105.0 ± 10.3 |
14.8 ± 1.8 |
24.1 ± 4.0 |
|
Dixie Lee |
34.9 ± 6.7 |
105.7 ± 13.1 |
102.2 ± 21.4 |
11.0 ± 0.8 |
14.7 ± 5.0 |
|
Lady |
29.1 ± 5.2 |
89.0 ± 6.2 |
128.5 ± 7.6 |
6.3 ± 1.9 |
15.5 ± 3.3 |
|
Mississippi Silver |
30.0 ± 5.0 |
77.0 ± 15.2 |
149.0 ± 27.4 |
4.4 ± 0.7 |
16.8 ± 4.7 |
|
Mississippi Purple Hull |
24.9 ± 2.3 |
80.7 ± 11.3 |
131.0 ± 14.7 |
5.0 ± 1.7 |
10.8 ± 1.3 |
|
Red Ripper |
24.5 ± 5.9 |
68.0 ± 17.1 |
152.5 ± 24.1 |
3.3 ± 0.5 |
13.9 ± 4.3 |
|
SaDandy |
26.8 ± 9.5 |
87.7 ± 14.3 |
152.0 ± 22.0 |
5.1 ± 1.9 |
14.2 ± 6.3 |
|
Top Pick Pinkeye Purple Hull |
26.3 ± 2.7 |
63.0 ± 11.5 |
115.5 ± 10.7 |
6.2 ± 1.8 |
14.1 ± 1.3 |
|
Top Pick Brown Crowder |
26.0 ± 2.7 |
104.5 ± 23.6 |
99.5 ± 26.6 |
7.5 ± 1.5 |
11.9 ± 3.5 |
|
Top Pick cream |
17.5 ± 3.4 |
99.2 ± 14.5 |
68.2 ± 17.5 |
5.3 ± 1.1 |
6.6 ± 2.9 |
|
White Acre |
17.4 ± 6.9 |
126.0 ± 32.4 |
41.7 ± 17.4 |
7.5 ± 3.0 |
3.9 ± 2.5 |
|
Zipper Cream |
26.5 ± 4.0 |
90.2 ± 8.3 |
116.0 ± 19.4 |
5.5 ± 0.9 |
12.3 ± 2.5 |
|
Pinkeye Purple Hull |
27.1 ± 9.0 |
83.2 ± 14.0 |
101.0 ± 36.3 |
3.6 ± 0.2 |
13.4 ± 6.0 |
|
Knuckle Purple Hull |
30.6 ± 4.0 |
96.2 ± 6.8 |
110.0 ± 15.3 |
6.5 ± 0.8 |
13.0 ± 2.8 |
|
Iron Clay Mixed |
24.4 ± 3.0 |
77.8 ± 26.5 |
95.5 ± 21.8 |
6.5 ± 1.2 |
11.8 ± 2.0 |
|
Cream 40 |
24.3 ± 3.8 |
138.5 ± 7.5 |
60.2 ± 7.5 |
10.5 ± 1.4 |
5.8 ± 1.1 |
Objective 2. Evaluate the effect of two best cowpea cultivars with pest and disease resistance, high nodulation and high pollinator attractiveness (from objective #1) on overall yield of vegetable crops in two cropping systems with/without cowpea (mono and intercropping).
Intercropping is the growing of two or more crops in close proximity to enhance biological interaction. Intercropping cowpea with pollinator-dependent crops (squash, okra and watermelon[SOW]) resulted in increased abundance and diversity of pollinators and increased crop yield.
Visual observation and direct count of pollinators recorded in 2018 and 2019 shows that different types of pollinators were observed on each cowpea variety (planted on both sides of the main crop [SOW] and as monocrop) during entire 5-week sampling periods. This include bumble bees, carpenter bees, honeybees, and sweat bees. A prominent number of wasps, butterflies, and moths were also recorded similar to what was observed in objective one. In both years, the total number of pollinators recorded on each cowpea cultivars were higher compared to the number of BMSB (Figs. 26 and 27). In both years, the total number of pollinators recorded was different among cowpea cultivars with PPH and PPH+PPH recording the highest. On the contrary, in both years all the cowpea varieties recorded low numbers of BMSB compared to pollinators. Overall, there were fewer BMSB observed in 2019 compared to 2018 (Figs. 26 and 27).
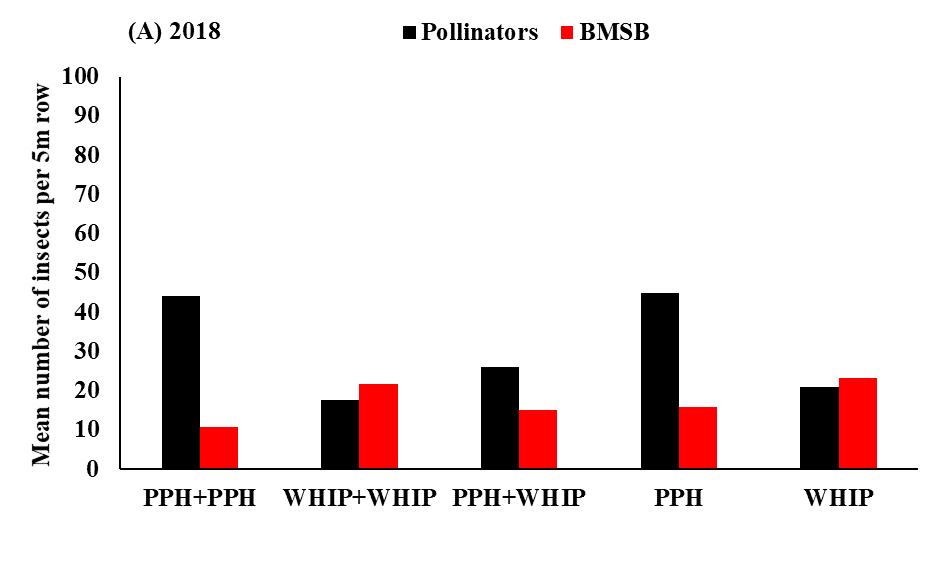
Fig. 26. Mean number of pollinators and BMSB observed and recorded on each cowpea variety in 2018
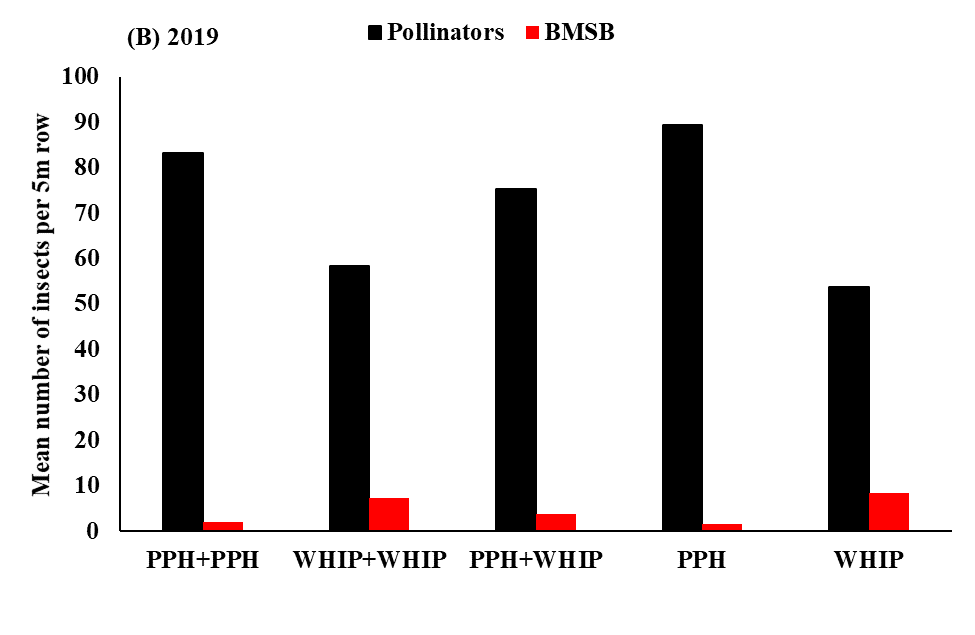
Fig. 27. Mean number of pollinators and BMSB observed and recorded on each cowpea variety in 2019
In 2018 and in 2019, the number of pollinators observed and recorded on all three main crops combined (squash, watermelon, and okra [SOW]) was different from the number that was recorded on the control (SOW without cowpea) (Figs. 28 and 29).
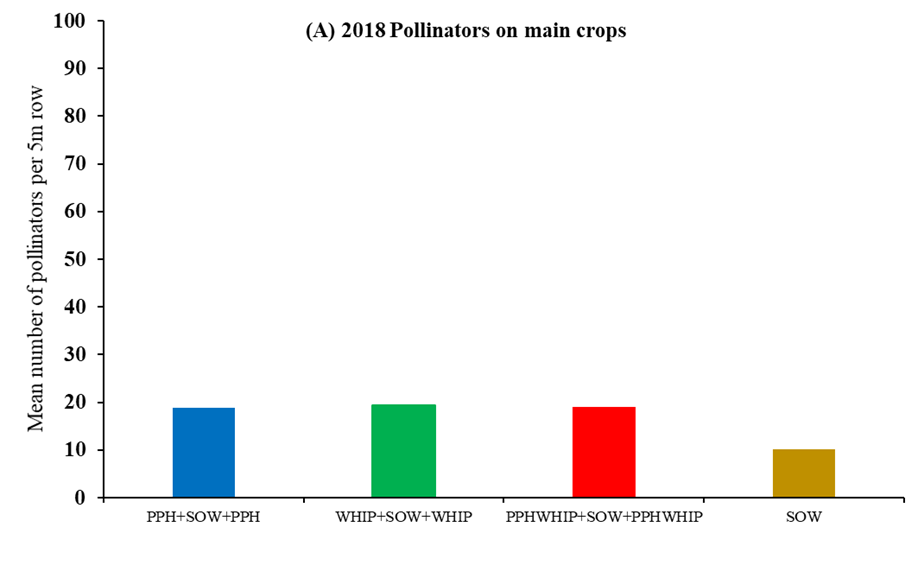
Fig. 28. Mean number of pollinators observed and recorded on all three main crops (combined SOW) intercropped with cowpeas and control (SOW) without cowpea in 2018
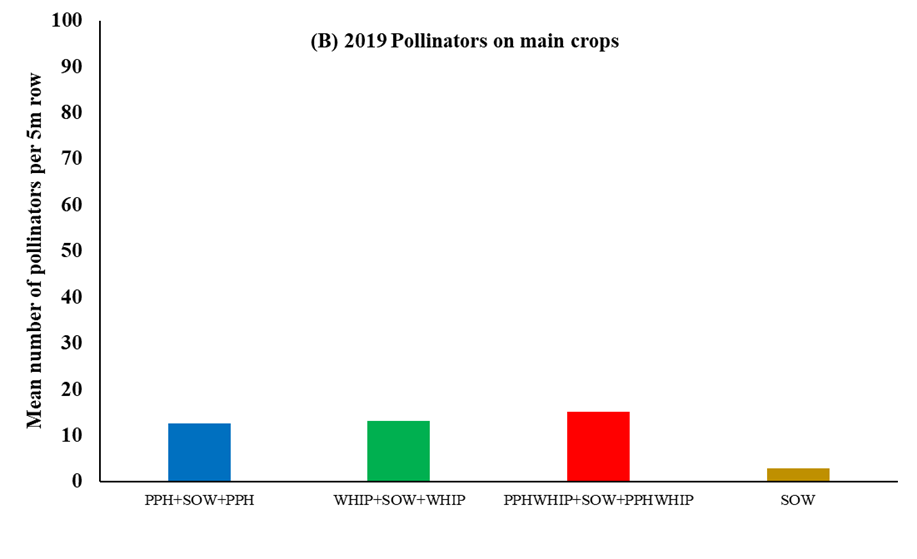
Fig. 29. Mean number of pollinators observed and recorded on all three main crops (combined SOW) intercropped with cowpeas and control (SOW) without cowpea in 2019
Results from sticky trap shows that in 2018 and 2019 the number of pollinators recorded was different among the various cowpea varieties (Figs. 30 and 32). In 2019, PPH attracted more pollinators than WHIP as shown in the numbers of pollinators recorded in PPH, PPH+PPH, and PPH+WHIP compared with the numbers on WHIP and WHIP+WHIP (Fig. 32). In both years, the number of pollinators observed on all the three main crops combined (SOW) was higher compared to the control (SOW without cowpea) [SOW] (Figs. 31 and 33). About >50% more pollinators were recorded on the main crops intercropped with cowpea than on main crops without cowpeas.
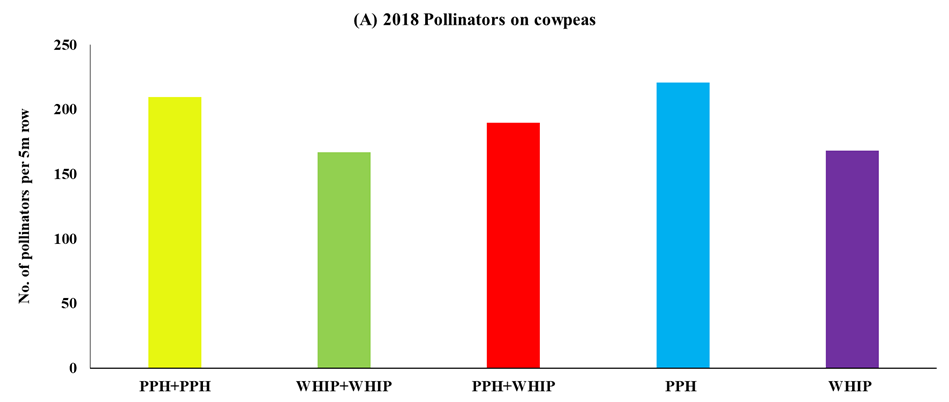
Fig. 30. Mean number of pollinators recorded on sticky trap on each cowpea variety in 2018
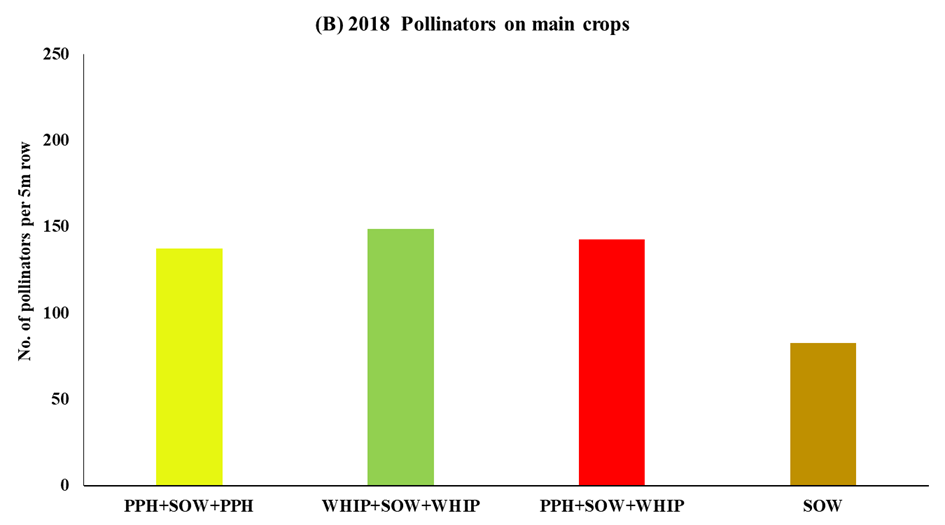
Fig. 31. Mean number of pollinators on sticky trap on all three main crops (combined SOW) intercropped with cowpeas and control (SOW) without cowpea in 2018.
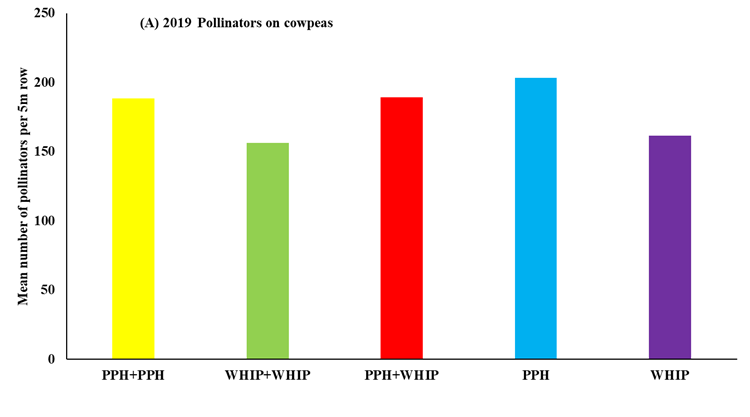
Fig. 32. Mean number of pollinators recorded on sticky trap on each cowpea variety in 2019
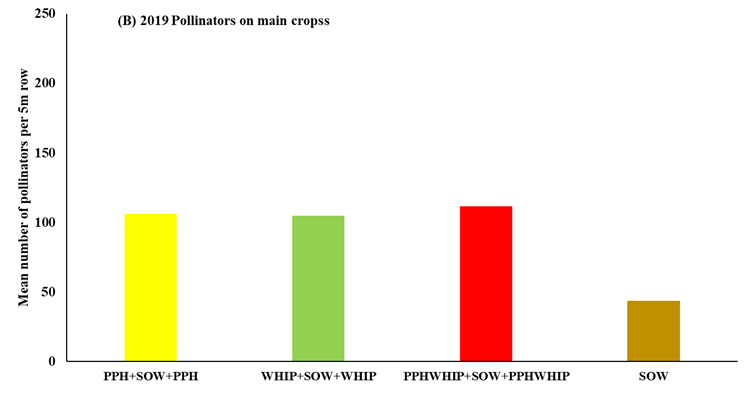
Fig. 33. Mean number of pollinators on sticky trap on all three main crops (combined SOW) intercropped with cowpeas and control (SOW) without cowpea in 2019
In both 2018 and 2019, the white traps caught the highest number of pollinators on both cowpea (Figs. 34 and 36) and main crops (Figs. 35 and 37). In 2018 the white trap on cowpea recorded the highest number of pollinators on WHIP+WHIP (Fig. 34). While in 2019 the number of pollinators captured in the white traps on cowpea were similar for all the treatments (Fig. 36). Overall, in both years the number of pollinators on cowpea was higher than was recorded on the main crops with more pollinators recorded on the intercropped plots compared to the control.
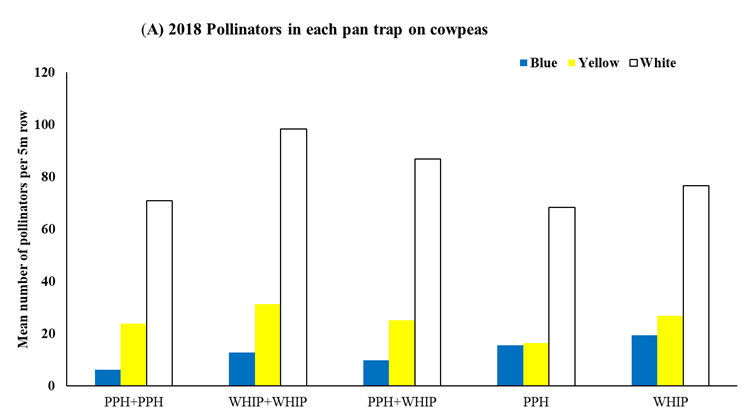
Fig. 34. Mean number of pollinators recorded in pan traps on each cowpea variety in 2018.
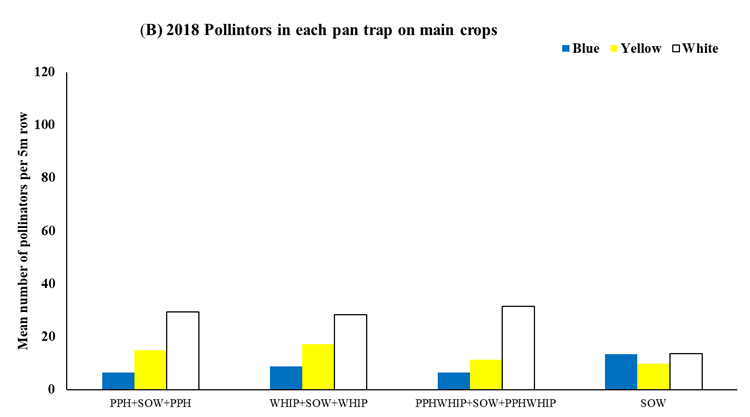
Fig. 35. Mean number of pollinators on pan traps on all three main crops (combined SOW) intercropped with cowpeas and control (SOW) without cowpea in 2018.
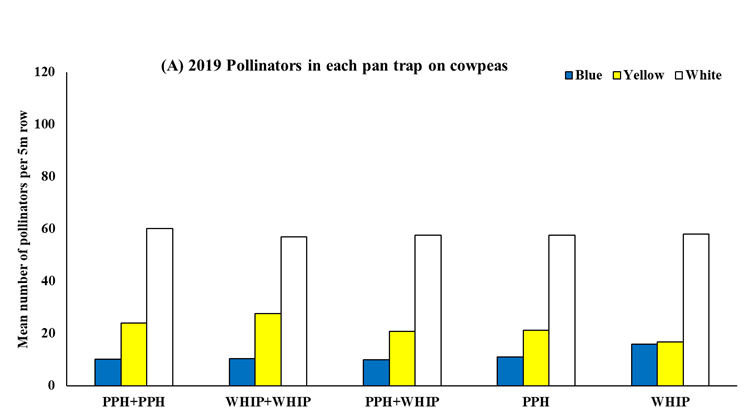
Fig. 36. Mean number of pollinators recorded in pan traps on each cowpea variety in 2019.
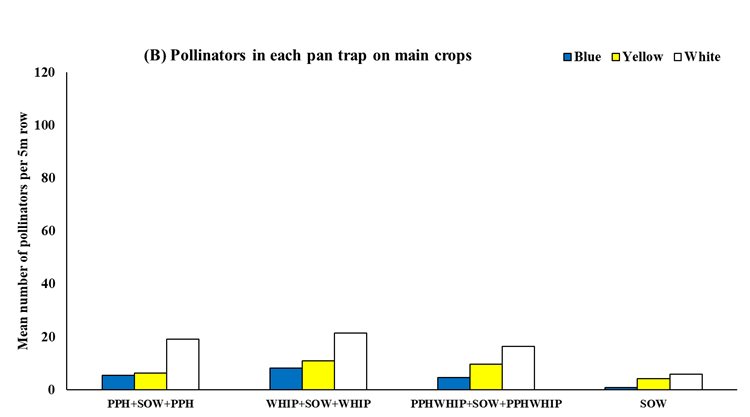
Fig. 37. Mean number of pollinators on pan traps on all three main crops (combined SOW) intercropped with cowpeas and control (SOW) without cowpea in 2018
Pollinators from six insect families (Apidae, crabonidae, halictidae, tachinidae pyralidae and vespidae) were recorded on sticky traps however, pollinators in the tachinidae and halictidae families were the most abundant (Table 4). Total pollinator from sticky trap (Table 4) show cowpea intercrop recorded the highest number of pollinators compared to the control (main crop without cowpea).
Table 4: Mean number of different pollinator families captured on sticky trap per 5m for each of cowpea intercrop with three main crop (PPH+Squash+PPH), (WHIP+Watermelon+WHP) and (PPH+WHIP) and control without cowpea intercrop.
|
Intercrop |
Apidae |
Crabronidae |
Halictidae |
Tachinidae |
Pyralidae |
Vespidae |
Total |
|
PPH+Squash+PPH |
1.38 |
4.38 |
8.75 |
82.63 |
0.25 |
0.88 |
98.25 |
|
WHIP+Squash+WHIP |
0.50 |
4.75 |
6.38 |
75.00 |
0.50 |
0.25 |
87.38 |
|
PPH+Squash+WHIP |
0.75 |
1.75 |
5.63 |
69.38 |
0.50 |
0.38 |
78.38 |
|
Control Squash |
1.083 |
8.00 |
11.83 |
43.17 |
1.83 |
2.00 |
67.92 |
|
PPH+Watermelon+PPH |
0.00 |
13.88 |
33.75 |
110.00 |
0.63 |
0.63 |
158.88 |
|
WHIP+Watermelon+WHIP |
0.25 |
17.25 |
30.38 |
140.00 |
0.38 |
1.50 |
189.75 |
|
PPH+Watermelon+WHIP |
1.25 |
11.00 |
33.50 |
139.37 |
0.38 |
1.38 |
186.88 |
|
Control Watermelon |
0.33 |
12.25 |
23.58 |
44.41 |
1.00 |
1.67 |
83.25 |
|
PPH+Okra+PPH |
0.25 |
12.38 |
20.00 |
120.00 |
0.88 |
1.13 |
154.63 |
|
WHIP+Okra+WHIP |
0.38 |
18.25 |
27.63 |
119.88 |
0.63 |
2.13 |
168.88 |
|
PPH+Okra+WHIP |
0.50 |
17.13 |
31.50 |
110.50 |
0.88 |
2.38 |
162.88 |
|
Control Okra |
0.33 |
12.42 |
21.17 |
58.83 |
0.92 |
3.50 |
97.17 |
Anthocoridae, berytidae, dolichopodidae and Geocoridae, were the most abundant natural enemies recorded and their abundance (Table 5). Total natural enemy abundance recorded from sticky trap show cowpea intercrop recorded the highest number compared to the control (main crop without cowpea).
Table 5. Mean number of different beneficial families captured on sticky trap per 5m for each of cowpea intercrop with three main crop (PPH+Squash+PPH), (WHIP+Watermelon+WHP) and (PPH+WHIP) and control without cowpea intercrop.
|
Intercrop |
Anthocoridae |
Berytidae |
Dolichopodidae |
Geocoridae |
Total |
|
PPH+Squash+PPH |
7.25 |
0.13 |
7.00 |
0.25 |
14.63 |
|
WHIP+Squash+WHIP |
6.50 |
0.00 |
8.38 |
0.25 |
15.13 |
|
PPH+Squash+WHIP |
4.88 |
0.00 |
7.38 |
0.13 |
12.38 |
|
Control Squash |
2.92 |
0.00 |
5.25 |
0.25 |
8.42 |
|
|
|
||||
|
PPH+Watermelon+PPH |
10.25 |
0.50 |
29.50 |
2.25 |
42.50 |
|
WHIP+Watermelon+WHIP |
11.38 |
0.38 |
26.00 |
1.63 |
39.38 |
|
PPH+Watermelon+WHIP |
9.25 |
0.25 |
36.13 |
2.38 |
48.00 |
|
Control Watermelon |
6.50 |
0.00 |
29.42 |
0.67 |
36.58 |
|
|
|
||||
|
PPH+Okra+PPH |
13.25 |
0.13 |
20.25 |
1.63 |
35.25 |
|
WHIP+Okra+WHIP |
8.38 |
0.50 |
18.88 |
1.75 |
29.50 |
|
PPH+Okra+WHIP |
11.88 |
0.25 |
23.88 |
0.63 |
36.63 |
|
Control Okra |
6.42 |
0.00 |
15.42 |
0.33 |
22.17 |
The result shows there were more pollinators recorded on the main crops with cowpea intercrop compared to the control without cowpea intercrop in both years (Table 6). At harvest, almost all main crops intercropped with cowpea recorded the highest average yield compared to the control without cowpea intercropped in both years (Table 6).
Table 6. Total number of pollinators (mean) recorded from all treatments during the five-week period and crop yield (kg) in 2018 and 2019
|
|
2018 |
2019 |
||
|
Treatment |
Total Pollinators |
Yield (kg) |
Total Pollinators |
Yield (kg) |
|
PPH+Squash+PPH |
669.5 |
68.7 |
564.0 |
21.1 |
|
PPH+Watermelon+PPH |
746.5 |
21.8 |
420.5 |
47.4 |
|
PPH+Okra+PPH |
762.0 |
16.2 |
627.0 |
10.7 |
|
WHIP+Squash+WHIP |
655.0 |
77.4 |
540.0 |
18.8 |
|
WHIP+Watermelon+WHIP |
876.0 |
19.7 |
465.5 |
47.4 |
|
WHIP+Okra+WHIP |
810.5 |
14.3 |
654.0 |
10.3 |
|
PPH+WHIP+Squash+PPH+WHIP |
609.0 |
89.4 |
642.5 |
19.1 |
|
PPH+WHIP+Watermelon+PPH+WHIP |
882.0 |
22.9 |
440.0 |
40.6 |
|
PPH+WHIP+Okra+PPH+WHIP |
757.0 |
12.1 |
624.5 |
9.1 |
|
Squash (Control) |
487.7 |
51.1 |
201.3 |
6.6 |
|
Okra (Control) |
603.7 |
14.0 |
309.0 |
8.1 |
|
Watermelon (Control) |
467.3 |
4.8 |
181.7 |
15.3 |
Education
Due to the COVID-19 pandemic the project implementation was severely affected. There were no demonstration plots setup, no workshops or field day. We were able to perform limited work on insect identification. With so much sample collected from the research plots, we are still working on completing this process after which we will publish our findings in a peer review journal.
Educational & Outreach Activities
Participation summary:
Beatrice Dingha and Louis Jackai (2020) Assessment of Cowpea (Vigna unguiculata) as Pollinator Attractant: Implication for Enhancing Pollinator Abundance and Diversity in an Intercropping System. 2020 Joint Eastern & Southeastern Branch Meeting. March 29-April 02-2020.
Paul Omaliko, Beatrice Dingha and Louis Jackai (2020). Intercropping with Cowpea (Vigna Unguiculata) to Increase Pollinator Abundance and Crop Productivity. 2020 Joint Eastern & Southeastern Branch Meeting. March 29-April 02-2020.
Dingha, B.N., and L. E. N. Jackai (2020). Cowpea (Vigna unguiculata) as pollinator enhancer in a vegetable production system: The effect on pollinator abundance and crop yield. Entomological Society of America (ESA), St. Louis MO.
C. Omaliko, B. N. Dingha and L. E. N. Jackai (2019) Alleviating the Effect of Pollinator Decline Using Cowpea (Vigna unguiculata) in an Intercropping System and the Impact on Crop Yield. National Sustainability Summit taking place April 16-19, 2019 in Tampa, FL.
Beatrice N Dingha, M. E. Heffner and L. E. N. Jackai (2019) Cowpea Increases pollinator activity: Implications for Intercropping to Enhance Biodiversity. ARD Symposium March 30-April3-2019, Jacksonville, FL
Paul C. Omaliko, B. N. Dingha and L. E. N. Jackai (2019) Evaluate Cowpea (Vigna unguiculata) in an Intercropping System as a Pollinator Enhancer for Increased Crop Yield. ARD Symposium March 30-April3-2019, Jacksonville, FL
Demonstration plots (companion cropping of cowpea and okra, squash and watermelon) was setup during the Small farm day with the hypothesis that inclusion of cowpeas in a mixed vegetable cropping system will increase pollinator and beneficial arthropod activity as well as soil (N) health, crop yield and farm profitability. During the second year of the project participating farmers intercropped selected cowpea varieties (based on results from year one) with other vegetable crops they grow (mostly cucurbits).
Learning Outcomes
N/A for this reporting period.