Final report for LS20-341
Project Information
The rapid decline in water supply for irrigation in the Texas High Plains is encouraging some growers to convert their irrigated cropland to production of dryland crops and low water requiring forages. Reduced irrigation will directly depress crop yields and financial security. Research on the impacts of transitioning toward reduced water input can reveal soil and crop management practices that build up the soil’s health. Switching to more diverse cropping systems can enhance numbers and activities of introduced and native bees, which are potential pollinators. We studied changes in soil health indicators, ground-nesting bees (as an indicator of pollinator habitat), and water use by annual crops and perennial forages in the context of transition from high irrigation to low irrigation to dryland management. Studies were conducted on four commercial farms in the South Plains of the Texas High Plains, and the Texas Tech University pasture research facility near New Deal, TX. Three of the growers were already part of long-term studies by a cooperating agency (USDA-ARS) for soil health; hence three additional years of data (through 2023) extended the analysis. In addition, pollinators (i.e., native bee communities) were sampled in 2021-2022 to determine if communities were related to irrigation transition scenarios and soil conditions. Differences in soil conditions were documented across fields including reductions in soil water content, potassium, sodium, and soil organic carbon with transition to subsurface irrigation and dryland systems (from center pivot irrigation). Furthermore, severe drought in the final year of the project reduced total fungi and multi-enzyme activities. However, differences detected in soil conditions were not revealed in the bee communities across irrigation-transition scenarios or in relation to soil conditions. A total of 4427 bee individuals and 71 morphospecies were collected across the four farms, which is a relatively high number when considering the region is intensively managed for crop production. The CRP site (DgC), the house site (H_site) and the tree-lined field border (Ma T1) produced the greatest number of morphospecies and total abundances of native bees; these on-farm habitats should be further investigated to better understand use by native bees in foraging and soil-nesting, and how they might benefit sustainable crop production.
1) Estimate the water use and water-use efficiency of annual crops and perennial forages transitioning to limited irrigation and dryland production.
2) Evaluate soil health indicators under different transitions to dryland including changing annual crops from irrigated to dryland production, and interseeding alfalfa into established perennial grassland.
3) Compare irrigated and recently transitioned dryland croplands, alfalfa, grass-alfalfa, and grass pastures on ground-nesting bee communities as indicators of insect pollinator health and abundance.
Cooperators
- - Producer
- - Producer
- - Producer
- - Producer
Research
Background - Growers in the Texas High Plains are increasingly forced to convert their irrigated croplands to limited irrigation and dryland production of crops and forages owing to diminished groundwater supply for irrigation. These changes in management may significantly decrease beneficial insect communities and soil organic matter, which will alter the capacity of soils to store water with potentially negative cascading effects on soil microbial communities and associated soil processes. The declining groundwater resources in the Texas High Plains prompt a need for effective water management practices to sustain crop and forage production. It is not known whether recently transitioned dryland, relative to irrigated croplands, and grass-alfalfa mixtures relative to alfalfa and grass monocultures, have any effect on water use, soil health, and pollinators in semiarid climates that are already extreme and variable in climatic conditions. Among pollinators, the focus is on native ground-nesting bees because of their wide plant-host range for native plants for the local pumpkin-squash industry. In addition, their need for undisturbed soil for nesting results in their abundances serving as indicators of community-wide agroecosystem health and land use. Understanding the effects of changes in management practices following the transition out of irrigation on crop water use, soil health, and ground-nesting bees are important components in selecting management practices in semi-arid Texas High Plains.
Project Objectives (listed above) and outcomes are addressed in the following two sections below: A) SARE Report on Soil Health, and B) SARE Report on Pollinator Communities and Relationships with Soil Conditions. Because soil sampling occurred beginning in 2019, soil conditions were reported over time and concurrently with irrigation transition across farms and fields. Beginning in 2020, pollinator sampling was initiated across the same fields, with the goal to assess variation over time and space according to field locales and irrigation-transitions. In pollinator sampling, an additional farm habitat was sampled to address a general hypothesis that ground structure in terms of coarse woody debri (i.e., dead and alive woody trees at field edges/corners) could support pollinators by providing least disturbed and local resources for foraging and nesting bees.
Grower groups: Our team is cooperating with growers to conduct on-farm studies of soil health indicators, crop water use, and ground-nesting bees (pollinator indicators) in relation to water use. The on-farm studies fall into two groups. 1) Alfalfa production for hay by grower Randy McGee will be paired with alfalfa-grass and grass-alone pastures and hay fields at the TTU New Deal Research Station (8 miles apart on the same soil mapping unit, Pullman clay loam, 38% clay content) to emphasize measurements of season-long water use, but also including evaluations of soil microbial communities and ground-nesting bees. 2) Annual crops on farms near Littlefield, TX, owned and operated by Randy Gray, Brian Mueller, Nick Martin. These growers have taken part in the NRCS cost-share program to place some of their land under subsurface drip irrigation to conserve water, while still having other areas under center-pivot and dryland production. Data will be collected to emphasize soil health indicators in relation to transitions from irrigated (center pivot) cotton into subsurface drip irrigated cotton, dryland sorghum, cotton or grasses (e.g., short-term and long-term dryland rye fields). They have already allowed us access to their fields since October 2018 for soil sampling. Soils evaluated in this study represent the predominantly sandy-loam Amarillo soil west of Lubbock which contain >49% sand and <1% organic matter.
Water use and water use efficiency
Measurements will track water inputs on the Group 1 farms (Gray, Mueller, Martin) from rainfall and irrigation. A simplified WUE calculation will be performed assuming no runoff and no deep percolation. We justify that because these soils are essentially level and a nearly impermeable limestone (caliche) layer exists at around 3 feet depth which restricts water flow and root penetration (Dhakal et al., 2019b). We will use the method used by TAWC (explained the 2017 annual report at http://www.depts.ttu.edu/tawc/resources.php) for calculating WUE.
Water use = Effective precipitation + Irrigation – change in soil volumetric water content (VWC) between beginning and end of cropping season.
WUE = Crop yield (lbs.) / Water use (acre-inch)
The growers will collect on-site rain gauge precipitation data. Researchers will calculate “effective precipitation” according to Brouwer and Heibloem (1986). determine changes in soil VWC by extracting cores in three sites per field down to the caliche layer, weighing the core samples, followed by drying and reweighing the cores. This gravimetric water content data will be converted to volumetric content by correcting for bulk density. Soils will be measured by sampling for bulk density at the time of core sampling. Crop yield will be reported by the grower by his harvester yield monitor.
For Group 2 farms (McGee and Texas Tech research station), weekly recordings of soil volumetric water content will be done with a portable Delta-T PR2/6 Profile Probe and local precipitation collection. Three access tubes will be installed in McGee’s field (they are already installed in the Texas Tech pastures). The probe records VWC at depths of 4, 8, 12, 16, 24, and 48 inches, and the probe is accurately calibrated according to Dhakal et al. (2019a). Water use will be calculated according to Dhakal et al. (2019b) and WUE according to the equation used for Group 1 above.
Soil health assessment
Soil sampling
Soil sampling at a 0-15 cm depth will be conducted in summer (June) and fall (November) of 2020, 2021 and 2022 in order to sample different years and seasons that would likely have different soil moisture and temperature conditions and plant growth activities. Soil samples will be collected from three growers’ irrigated annual crop land (cotton and corn) and annual dryland crops (cotton, corn, and sorghum), and perennial dryland grass fields in Littlefield Texas near Texas Tech University with nearly level soil (0–1% slope) of an Amarillo fine sandy-loam. Similarly, soil samples will be collected from old world bluestem (OWB) and OWB-alfalfa pastures at TTU New Deal research farm in a Pullman clay-loam soil. Grower’s (Mr. Randy McGee) alfalfa monoculture field near to New Deal research farm will be used.
Analyses of soil microbial community size, structure, and enzymatic activities as indicators of soil health
Soil MBC and microbial biomass nitrogen (MBN) will be determined by the chloroform-fumigation extraction procedure according to Brookes et al. (1985) and Vance et al. (1987) on 15 g of field-moist sample with a CN analyzer (Shimadzu Model TOCV/CPH-TN, Shimadzu Corp., Kyoto, Japan). In brief, organic C and N from fumigated (24 h) and non-fumigated (control) soil samples will be extracted with 0.5 M K2SO4 and then quantified with a CN analyzer. The values obtained from non-fumigated soil samples will be subtracted from those from fumigated soil samples. A kEC factor of 0.45 as described by Wu et al. (1990) and kEN factor of 0.54 as described by Jenkinson (1988) will be used to calculate the MBC and MBN, respectively. For each sample, we will perform duplicate analyses and express the results on a dry-weight basis. Gravimetric soil water content will be determined by drying samples at 105°C for 48 h and adjust for bulk density. Soil microbial community size and structure will be evaluated according to the ester-linked FAMEs (EL-FAMEs) method (Schutter and Dick, 2000) to define the relative abundance of broad taxonomic microbial groups.
Soil organic matter and nutrient cycling and availability will be evaluated according to SOC, total N (TN), POXC (Weil et al., 2003; Culman et al. 2012), and different enzyme activities involved in biogeochemical cycling. SOC and TN will be determined by automated dry combustion (LECO TruSpec CN; Joseph, MI) of air-dried samples by a commercial laboratory (Ward Laboratories, Inc., Kearney, NE, USA). Soil pH will be determined in the same laboratory. Four different enzyme activities will be determined for mineralization of C (β-glucosidase), C and N (β-glucosaminidase), S (arylsulfatase), and P (acid phosphomonoesterase) using common methods (Tabatabai, 1994; Parham and Deng, 2000). The activities of these four different enzymes will be determined simultaneously using a combined assay developed by one of our team researchers (Acosta-Martínez et al. 2019). The substrates for the enzymes will be, respectively, p-Nitrophenyl-β-D-glucopyranoside (0.05 M), p-Nitrophenyl-N-acetyl-β-D-glucosaminide (0.01 M), p-Nitrophenyl phosphate (0.05 M), and p-Nitrophenyl sulfate (0.05 M). The four different substrates will be added to each soil sample and their combined product, p-nitrophenol, will be determined colorimetrically. This combined activity represents an index of biogeochemical cycling potential in soil. In brief, only 0.5 g air-dried soil is needed for this combined assay (1.5g for two reps and a control) which saves time and resources. The soil is incubated for 1 h at 37 ˚C with 0.5 mL of acetate buffer (pH 5.8) and a 2 mL solution with the four substrates of these enzymes. Following incubation, 0.5 mL of 1 M CaCl2 will be added to each sample, and the reaction will be terminated by adding 2 mL of 0.1 M THAM pH 12.0. Subsequently, the total final volume (5 mL) of soil suspension will be filtered through a Whatman No.2v filter, and the combined product released (p-nitrophenol; PNP) will be determined colorimetrically at 400 nm.
Pollinator community
Pan Pan trap “bee bowls” will be used to trap bees and other foragers (mostly pollinators) that are attracted to preferred colors (i.e. fluorescent blue, yellow, and white). Bee bowls (3.3 oz., New Horizons, Upper Marlboro, MD, USA) also trap other foragers that are attracted to bright colors (Shapiro et al., 2014). Bees and other pollinators will be collected in summer of 2020, 2021, and 2022 as described by Bhandari et al. (2018b), except that bee bowls will be elevated slightly above ground level and according to the maximum height of the canopy in a particular crop. In each field, along three separate transects, 10 bee bowls will be set with 16-feet distance between adjacent bowls. In each field treatment, 30 bee bowls will be set and constitute the bee bowl sample for that field. Bees and other insects contained in all 30 bee bowls from three transects within each replicate field will be collected after 24 hours and transferred into labeled specimen jars containing 70% ethanol for preservation. In addition to bee bowl sampling, during the period of flowering for each visited crop, insect foragers visiting flowers will be hand-collected along the transects using 5-minute sweep sampling along transects. The composition of each sampled community from each field, including taxonomic composition, and measures of community structure including diversity and functional-group indices, will be compared across fields and transitional production types. An established reference collection developed by our team will aid in identification of pollinators, with a focus on bees occurring across the different agroecosystems.
Data Analysis
The R-Program (R Core Team, 2017) will be used to evaluate the impacts of transitioning to dryland on the different soil microbial characteristics and establish linkages of changes in microbes and the functions impacted. To illustrate the microbial community composition, unconstrained principal coordinates analysis (PCoA) will be performed for FAME markers using the Vegan package in R. Analysis of variance will be used to analyze the data in a randomized complete block design which consisted of bluestem-alone, bluestem-alfalfa, and alfalfa treatments. Data will be analyzed using Proc Mixed in SAS 9.4 (Littell et al., 2006). For analyses of insect community differences across treatments and fields, a non-metric multidimensional scaling (NMS) ordination method will be used for comparison of communities based on taxonomic compositions, while indicator species analysis will be used to determine bee taxa with affinities for particular crops (PC-ORD).
A. SARE Report on Soil Health
The decline in groundwater supply in the Texas High Plains due to historical excessive irrigation within the past 20 years, but more frequently due to extreme droughts, is forcing some growers to convert center-pivot irrigated cropland to dryland production.
This SARE funded research project assessed the changes in soil health indicators (chemical and biological indicators) during 5 years in fields representing two transition scenarios: (a) from high irrigation method to low irrigation method (center pivot to subsurface drip) and (b) from high irrigation method to dryland (center pivot to dryland), in comparison to continuous center-pivot management.
Our study began in October 2018, and we continued to take soil samples every year until 2022. The study was conducted in Lamb County near Littlefield, TX (approximately 34.00 N, 102.36 W), in fields operated by three different growers (Table 1). The maximum distance between fields was 45 km. Irrigation is required in this region to meet crop water requirements owing to low average annual precipitation of about 470 mm (Lascano, 2000). These growers participated in the Environmental Quality Incentives Program (EQIP), a USDA-NRCS cost-share program, to convert some of their center-pivot (CP) irrigation area to SDI, while retaining other areas under CP and converting some to dryland production.
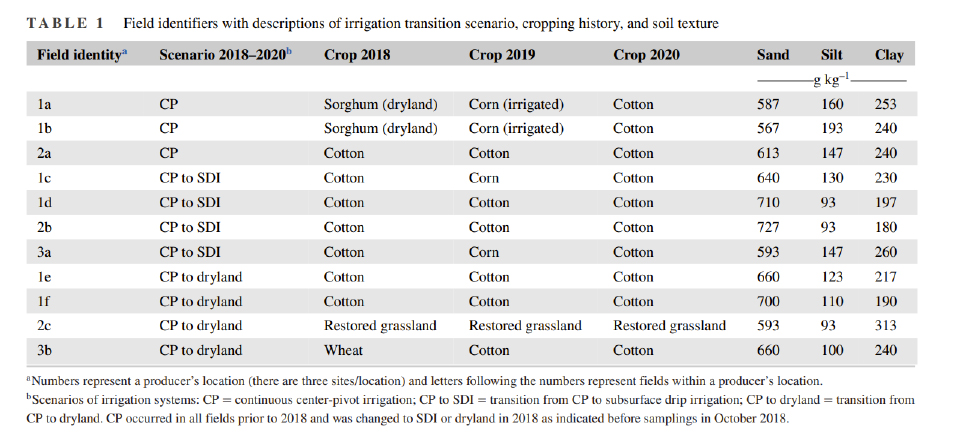
There are two phases of our study. Our first publication, which acknowledges this SARE grant (LS 20-341), reported the changes in soil health within the first 3 years (short-term) changes of these transitions. The publication can be cited as: Bhandari, K. B, Acosta-Martínez, V., Pérez-Guzmán, L., & West, C. P. (2022). Soil health within transitions from irrigation to limited irrigation and dryland management. Agricultural & Environmental Letters, 7, e20077. https://doi.org/10.1002/ael2.20077
During the first-three year’ transitions, there were three main findings and points elucidated from our soil health assessment:
- We found declines in soil water content, potassium (K), sodium (Na), and soil organic carbon with transition from irrigation to reduced irrigation and dryland.
- Severe drought in the final year revealed reduced amounts of multi-enzyme activities, total ester-linked fatty acid methyl ester (EL-FAME), and total fungi.
- Transitioning to low water-input management in this environment complicates efforts to maintain microbial components of soil health. Longer-term comparisons are needed to detect slow changes in soil health indicators on producers’ fields.'
After our first paper reporting on the first three years of our study, our samplings continued to evaluate soil health as affected by long-term transitions (5 years) to dryland in the Southern High Plains. Over time, some of the producers had to change their management for different reasons especially not use center pivot irrigation due to the below average precipitation received and extreme heat years in this region within the past 10 years. We still evaluated management transitions from center pivot to drip irrigation or center pivot to dryland as shown in the table below. These fields and irrigation scenarios were used in pollinator sampling to assess native bee communities across fields (Table 2).
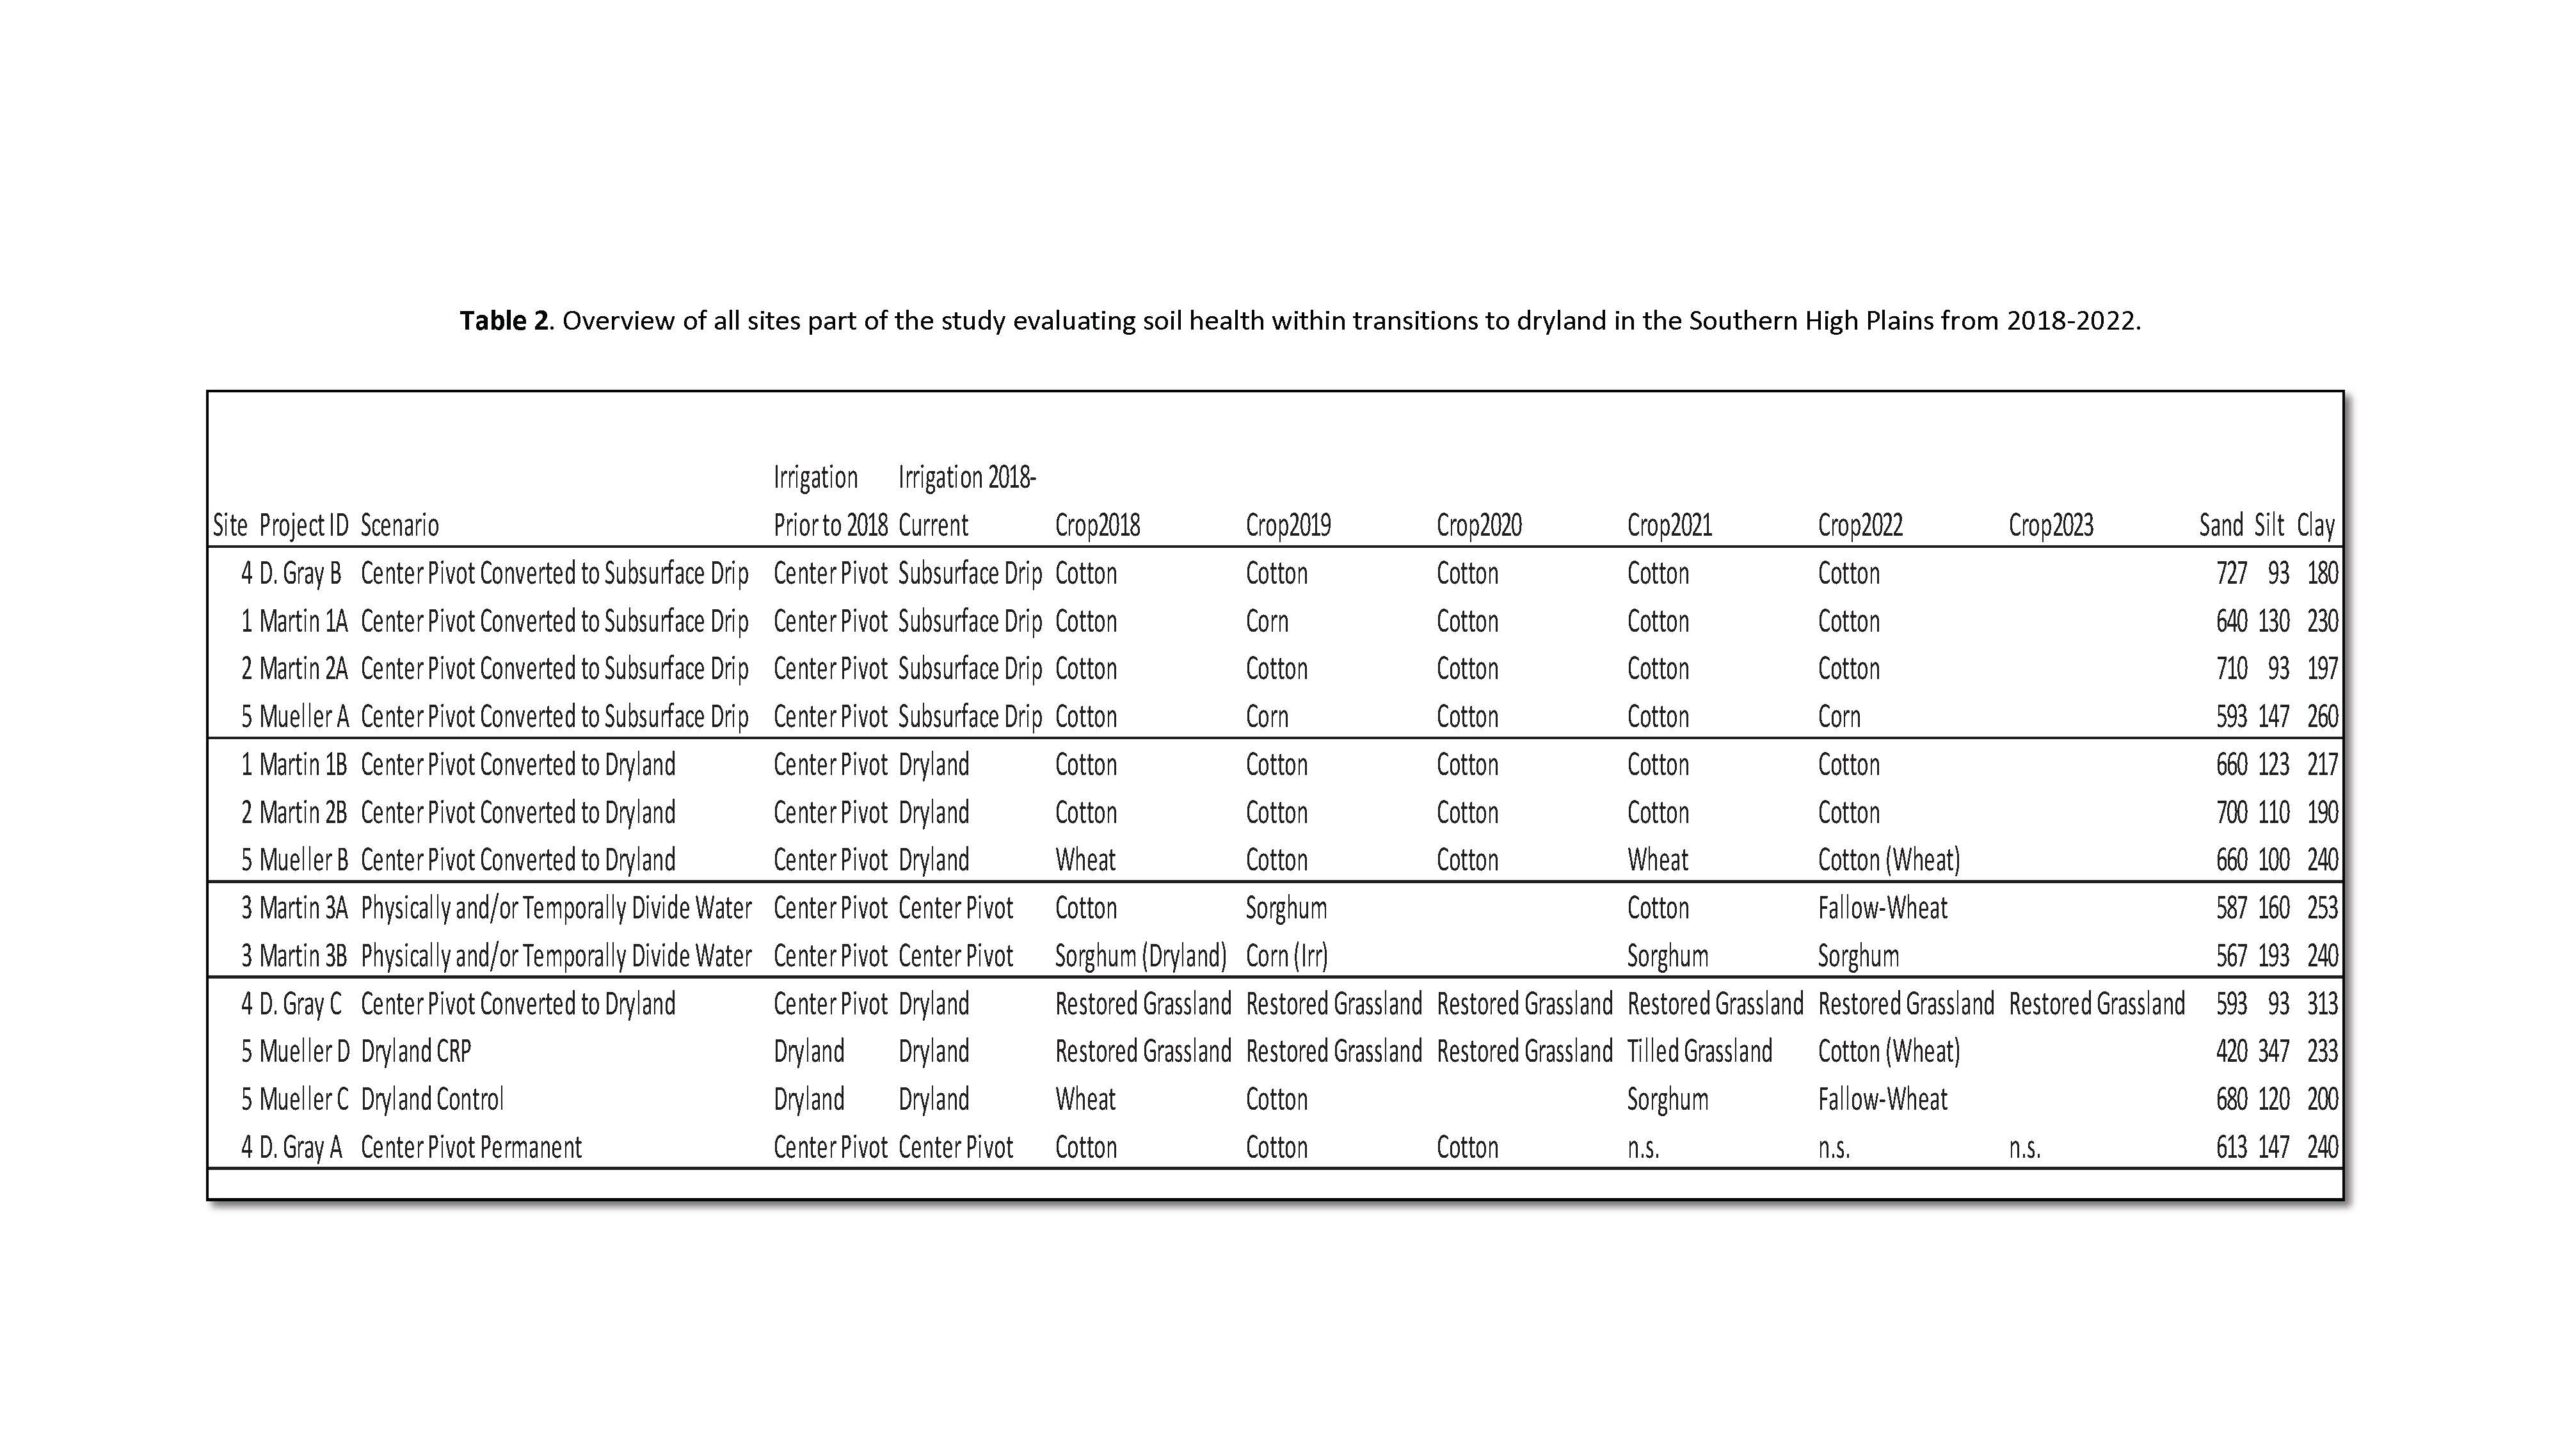
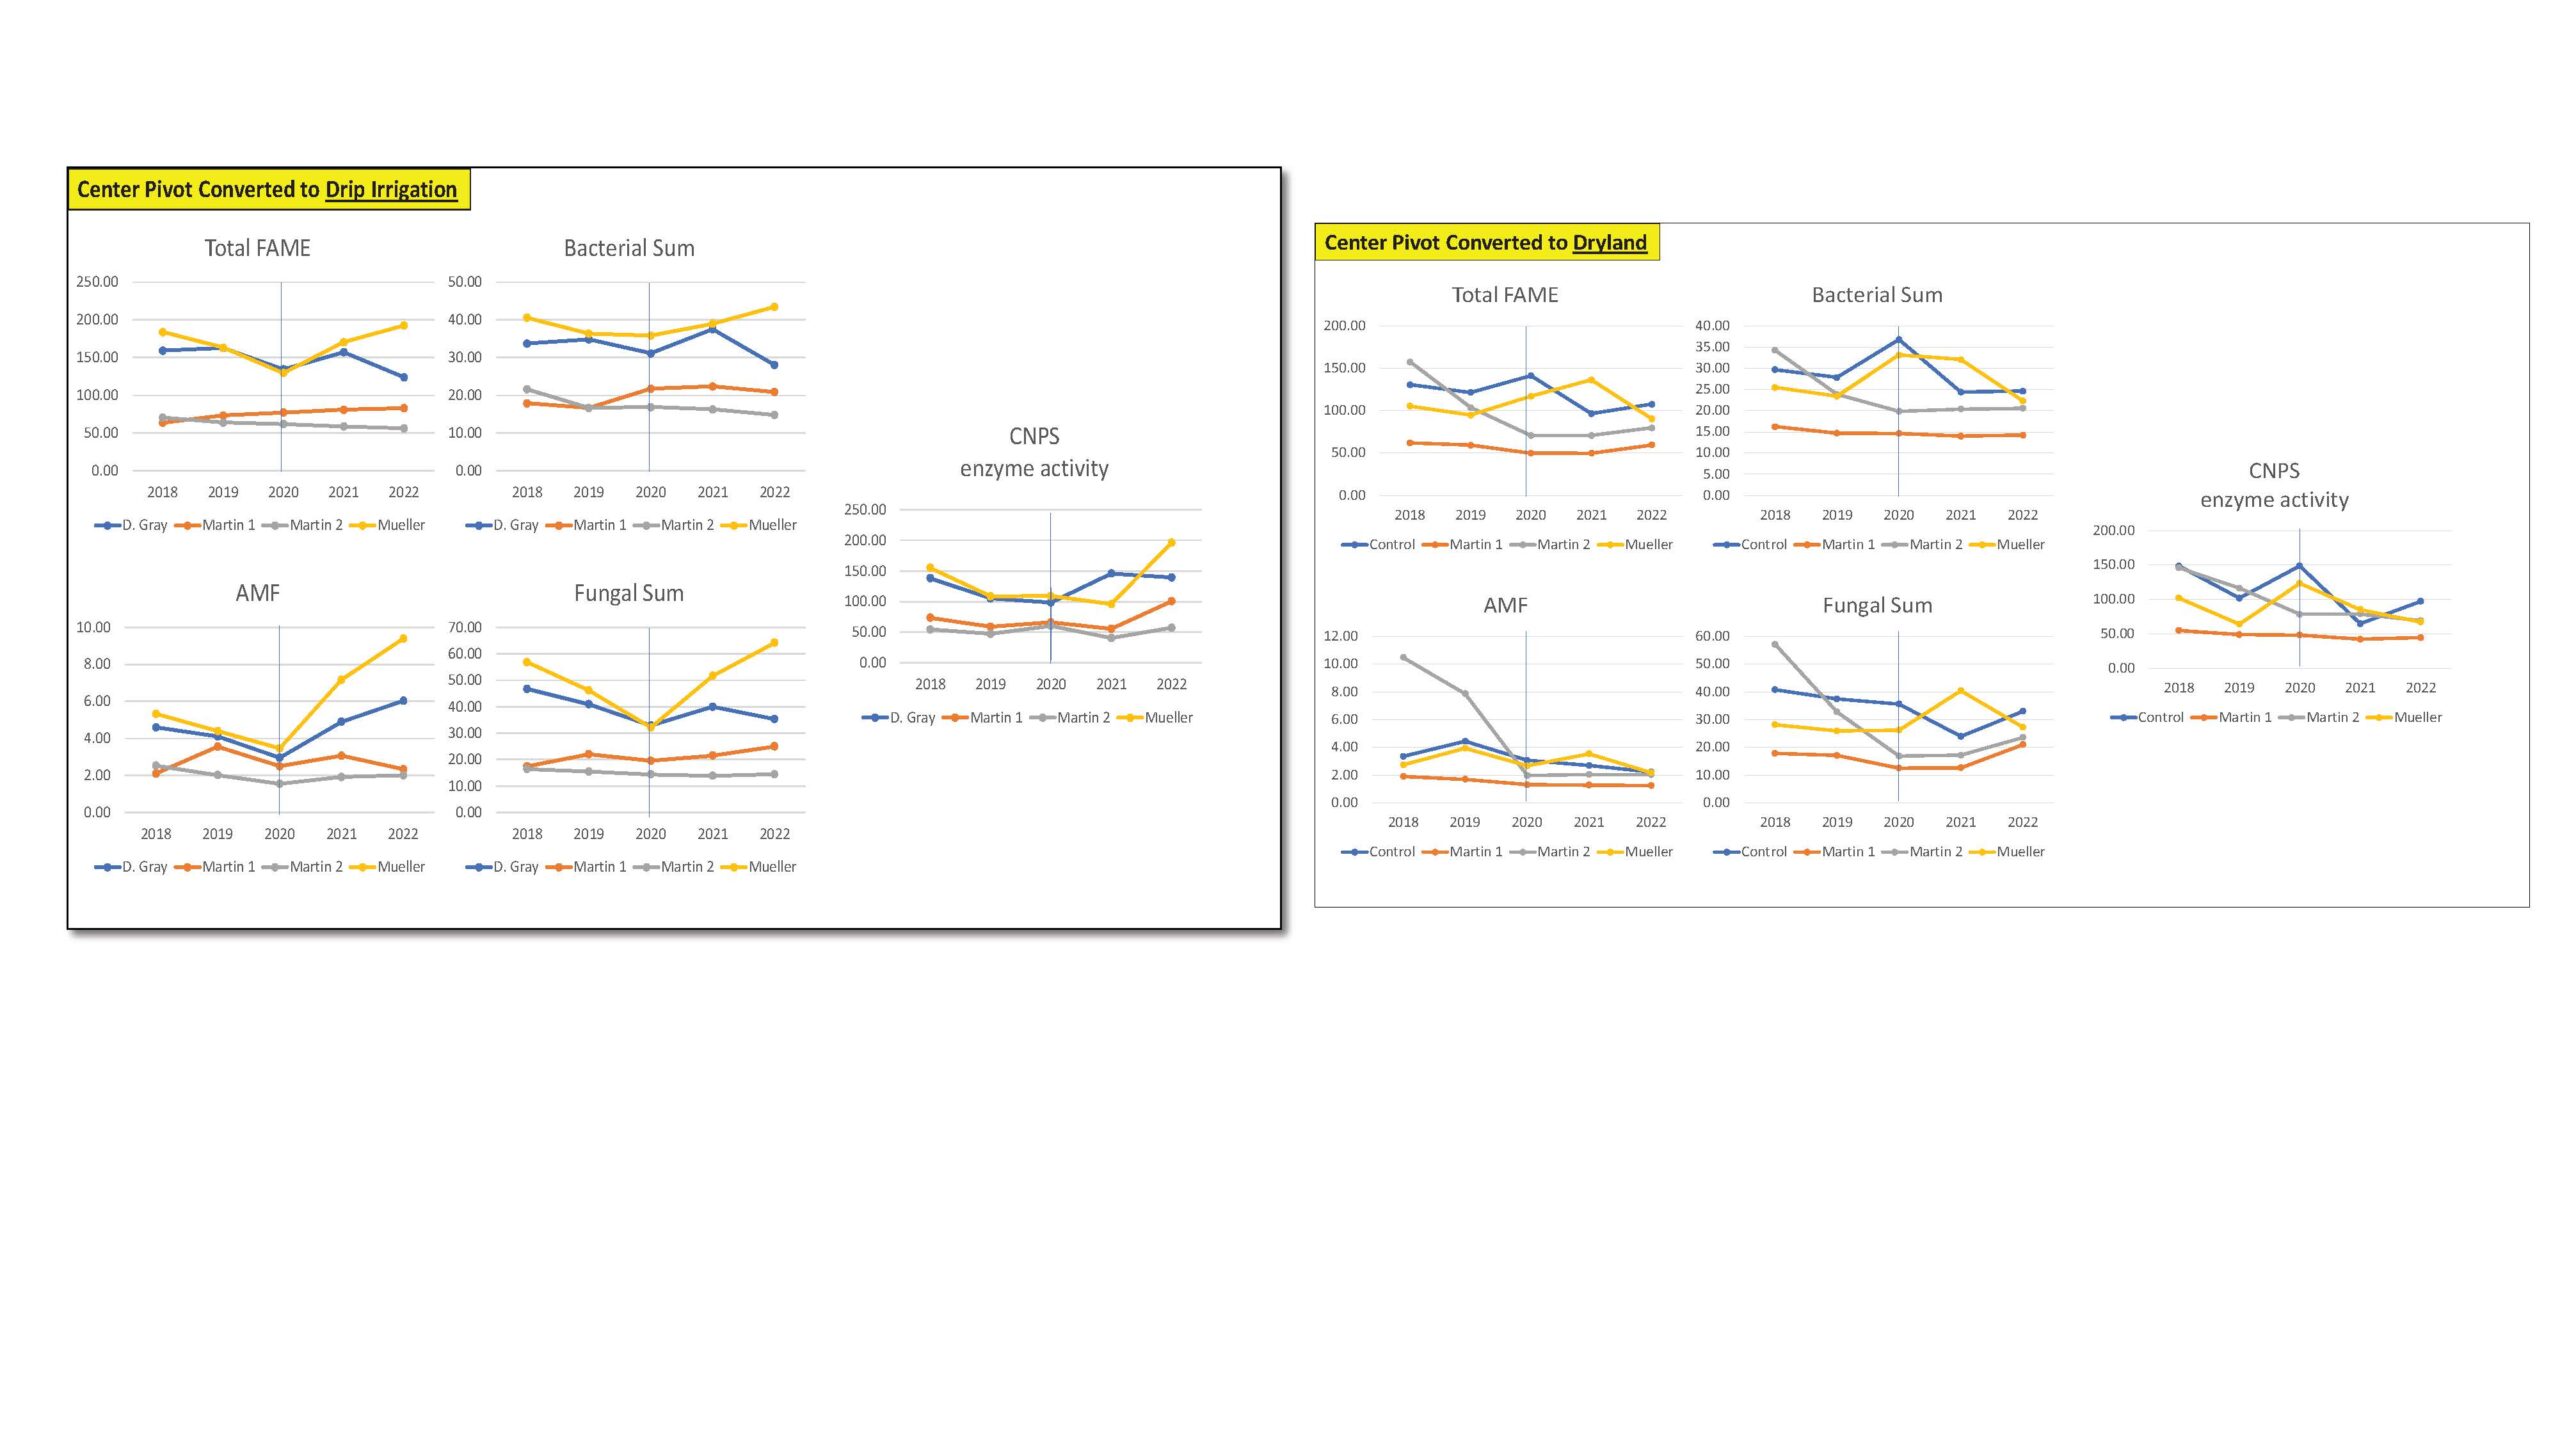
Our soil health assessment continued to use total FAMEs as indicators of soil microbial community size, microbial community composition based on bacterial, fungal and AMF (arbuscular mycorrhizal fungi) markers, and enzyme activities involved in carbon, nitrogen, phosphorus, and sulfur cycling from the CNPS assay.
Our overall assessment for the first transition scenario on the conversion of center pivot to drip irrigation as shown in the figure below demonstrated no significant change in the total FAMEs or the microbial community size over all 5 years. We also did not find any major change in soil bacteria and fungi, including AMF, a type of fungi that when associated to plant roots, will increase their nutrient and water uptake from soil. The trends were similar for CNPS activity representing several enzyme activities involved in nutrient cycling key for plant nutrition. These trends could mean that the transitions from center pivot to drip irrigation in this region and/or type of soils may not represent significant changes in water available in soils and provided to soil microbes and their enzymatic capacity.
Our overall assessment for the second transition scenario on the conversion of center pivot to dryland evaluated (Fig. 1), demonstrated no significant (consistent) change in the total FAMEs or microbial community size over all 5 years. We also did not find any major change in soil bacteria and fungi, including AMF, a type of fungi that when associated to plant roots, will increase their nutrient and water uptake from soil. The trends were similar for CNPS activity representing several enzyme activities involved in nutrient cycling key for plant nutrition. In this transition, where we know that less water is being delivered to the soils as they are transitioning to dryland, we acknowledge the need to select management practices that could maintain these communities and these key enzymatic processes in the future.
Figure 1. Total FAME, Bacterial Sum, AMF, Fungal Sum and CNPS enzyme activity measured across agricultural fields undergoing transition from center pivot irrigation to drip irrigation (left) and dryland (right).
Overall findings of the soil health study:
- Our 5 year-study provided a soil health assessment framework to evaluate soil health in the fragile soils of the Southern High Plains that continue to be used as several fields transition to dryland. Our soil health assessment is based on methodology that can establish the linkage of soil microbial communities and key processes related to soil organic matter dynamics and biogeochemical cycling because they can influence soil conservation.
- Within our study, the region experienced a drought from 2018 to 2020, and our soil health assessment demonstrated decreases in the soil microbial communities due to this additional layer of factors that can impact soil microbial communities and the soil health. It is expected an intensification of more severe and extreme climatic conditions in this region, and the soil health assessment framework established in our study will be key to better address the effects of climate extremes in overall soil health and essential functions that microbes provide. As the studies continue in other sites, we will be able to evaluate management practices that could buffer and minimize the detrimental effects of climate extremes.
- Our study is delivering key data on soil microbial components that will key to be available for future comparisons on the transition to dryland
B. SARE Report on Native Bee Communities: Biodiversity and Relationships with Irrigation Scenarios and Soil Conditions
Despite the likely importance of pollinators in cotton, corn, and sorghum production, an understanding of pollinators occurring in these crops in the Texas High Plains and their contributions to the production of these crops remain incomplete. Furthermore, in this intensively managed agricultural region, wild bees and pollination services are vulnerable to non-target agrochemical exposure, which can in turn impact crop production and native biodiversity. Thus, understanding pollinator communities across a transition related to irrigation practices is an important component in selecting management practices in field and forage crops. Importantly, understanding how different irrigation practices directly influence soil habitats and resident nesting and developing bees is a vastly understudied area of pollinator research. The Southern High Plains provides both the bee biodiversity, and the cropping transition types necessary to investigate these processes.
The pollinator focused objectives of the work included to 1) document biodiversity across a limited subset of farms in the Southern High Plains and 2) determine differences in bee communities across designated irrigation scenarios involving shifts from dominant center pivot irrigation to subsurface drip and dryland production fields.
Sampling was conducted on five dates (June through September) from 2021-2022 across three different farms (Designated Dg, Mu, and Ma, Table 2 above). The number of fields across farms varied, with the goal to replicate fields having one of the three types of irrigation scenarios (i.e. center pivot, subsurface drip, and dryland). In addition to these fields, three additional transects were included because of the dominance of coarse woody debri occurring at three edge-of-field locations on the partner farms. For this sampling, the general hypothesis was that these areas could provide refuge and resources for wild bees (e.g., non-crop flowering vegetation, soil nesting sites, and lower soil surface temperatures).
At each field, 60 m linear transects were marked and bee bowls (i.e., 3.5-ounce plastic cups) were placed at 5 m intervals along the transect. Bee bowl contents were retrieved after 24 hours and specimens were processed by pinning or by preserving in 70% ethanol in glass vials. Along each transect and opportunistically at field edges, the soil surface and any bee activity were observed in order to locate potential ground nesting bee habitats.
In the lab, native bee morphospecies were analyzed, documented, and tallied according to each collecting date and field. For analysis, bee counts were combined across dates to yield a native bee community sample for each field and according to the different irrigation-transition scenario (Table 2).
An initial summary of the total diversity of native bees was developed across all fields. Bee morphospecies were ranked according to total abundances and total relative abundances. A site by species data matrix (12 sites by 71 morphospecies) was used to calculate 1) S; the total number of non-zero cells and morphospecies for each row/field, 2) E; Evenness of the native bee community, 3) H; Shannon index, and 4) D; Simpsons diversity index. These measures were used to evaluate relationships with soil health variables using principal components analysis. The site by species matrix was used to further conduct an analysis of the native bee communities occurring across fields and irrigation scenarios using non-metric multidimensional scaling (NMDS). This method is robust to community datasets containing an inflated number of empty cells (i.e., with values of zero). Prior to NMDS analysis and to remove noise in the community data, native bees occurring with less than 3 non-zero values were removed from the dataset prior to analysis, which resulted in a reduction of native bee morphospecies from 71 to 29. Using NMDS, a second matrix containing soil variables was analyzed to determine if soil variables were related to potential bee community groupings. To aid interpretation, sites were labelled according to both the field/farm number and with the current irrigation scenario (using symbols). Finally, indicator species analysis was used to determine native bee morphospecies affinities for irrigation transition scenarios.
Results
Native Bee Communities
Across all farms and fields, a total of 4427 individual bees were collected across four bee families: Halictidae, Andrenidae, Apidae and Megachilidae (Table 3). The family Apidae contained the greatest number of morphospecies, followed by the Andrenidae. A total of 31 genera were collected across all families and 71 morphospecies were reported. Of these 71 morphospecies, 38 were confirmed at the species level. The genus Perdita contained 17 individual morphospecies, these were sorted by careful examination of the facial and tergal patterns (see Fig. 11). The genera Triepeolus and Lasioglossum contained five different morphospecies. Overall, the total number of morphospecies represent approximately 25 percent of the total number of bees reported to occur in the High Plains of western Texas (approx. 280 species, unpubl. data).
Bee community data developed from this study was compiled by collecting bees using bee bowls (i.e., 3.5 oz plastic cups), which is a type of pan trap containing a soapy water solution. These traps are known to bias community samples because they variably detect species, with a known (high detection) bias towards the abundant small sweat bees (i.e. Halictidae). Therefore, while a high number of bee taxa collected in this study occurred with less than 5 individuals, this could reflect both taxon detection using bee bowls or their naturally low abundances. While the current data provides a strong relative snapshot of the community across farms, including other means of collecting (e.g. hunt sampling, belt transects, blue vane traps, etc.) should improve information on abundances and species’ rarity in these systems.
Table 3. Summary of bees collected from four farms in the Southern High Plains.
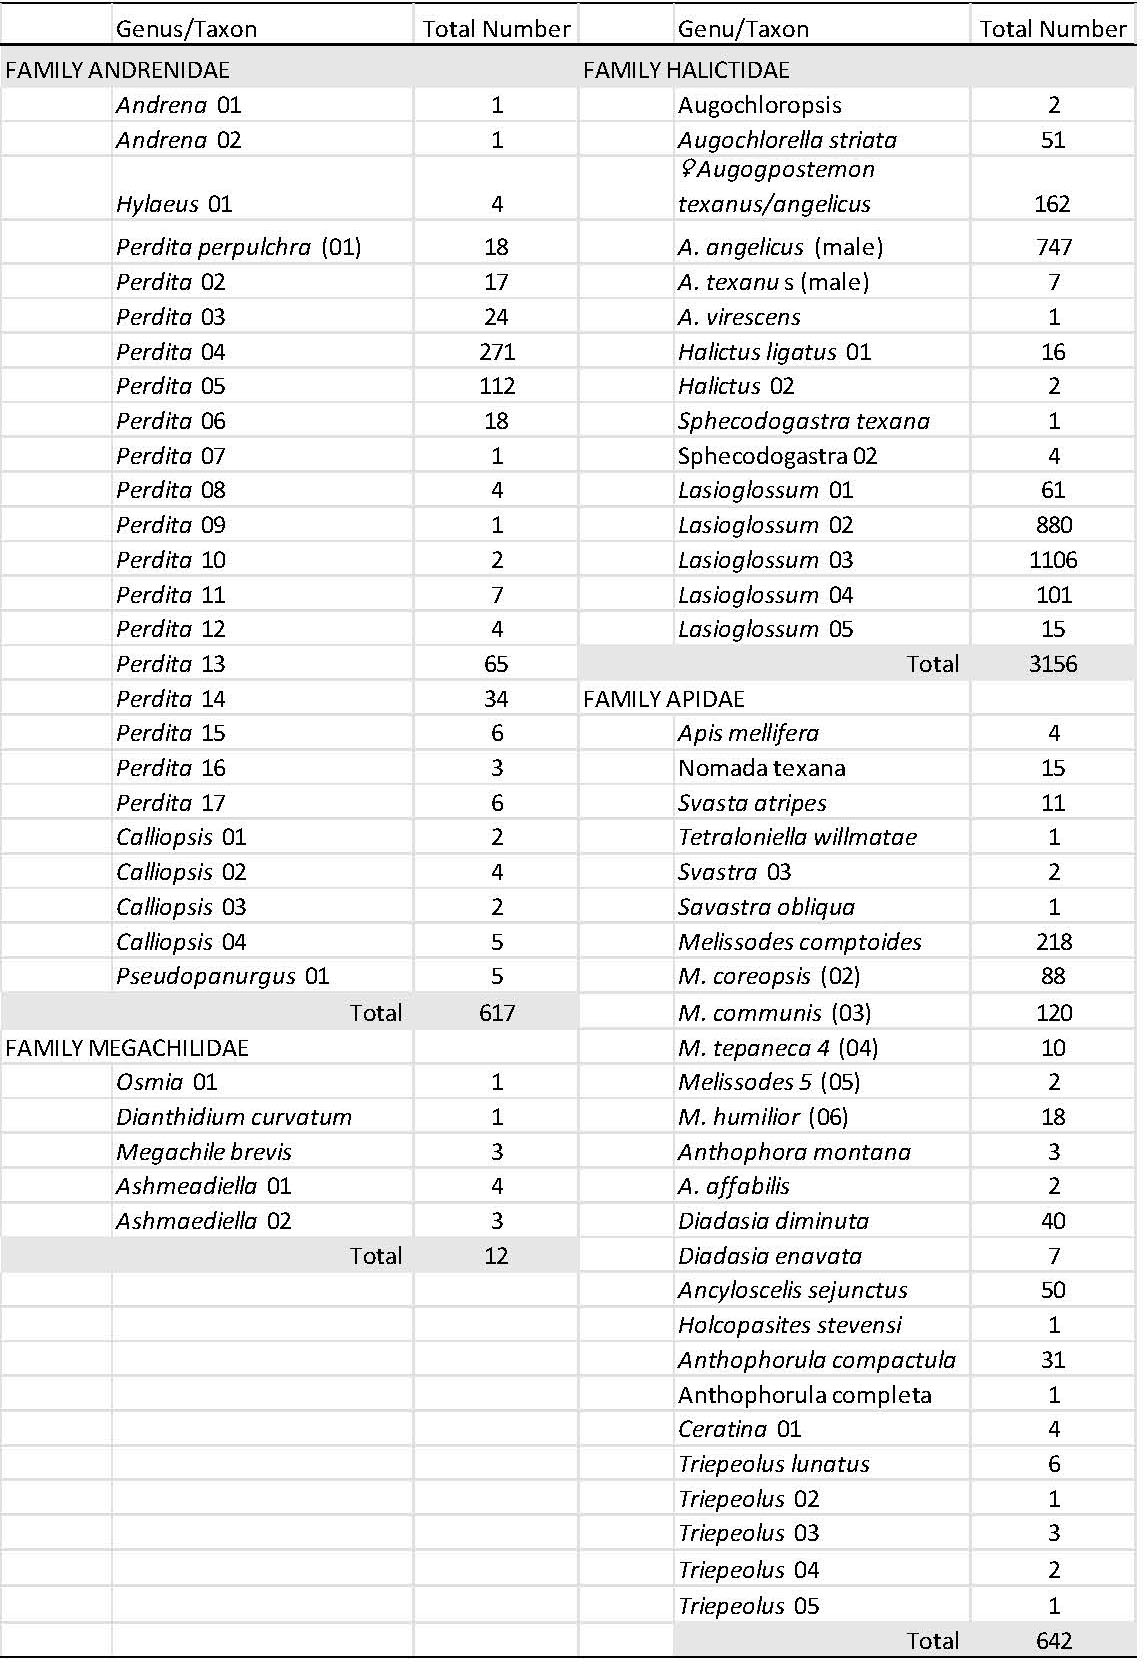
Overall, and as typically observed in native bee communities, there were a few taxa that numerically dominated the bee community (Table 4). The top 10 numerically dominant taxa (above upper dashed line) made up over 85 percent of the total number of individuals collected, with the top five taxa comprising over 72 percent of the total number of individuals. A total of forty-four morphospecies occurred with less than 10 individuals across all sampling dates and locations. Twenty-seven morphospecies occurred in abundances greater than 10 individuals (above lower dashed line), and only 14 morphospecies occurred with greater than 50 individuals.
Table 4 Bee morphospecies collected from this study, ranked by total numbers of individuals collected and taxon relative abundances.
|
Bee Taxon/Morphospecies |
Family |
No. Individuals |
Relative Abundance |
Cumulative Relative Abundance |
|
Lasioglossum 03 |
Halictidae |
1106 |
0.2498 |
0.2498 |
|
Lasioglossum 02 |
Halictidae |
880 |
0.1988 |
0.4486 |
|
A. angelicus (male) |
Halictidae |
747 |
0.1687 |
0.6173 |
|
Perdita 04 |
Andrenidae |
271 |
0.0612 |
0.6786 |
|
Melissodes comptoides |
Apidae |
218 |
0.0492 |
0.7278 |
|
♀ Augogpostemon texanus/angelicus |
Halictidae |
162 |
0.0366 |
0.7644 |
|
M. communis (03) |
Apidae |
120 |
0.0271 |
0.7915 |
|
Perdita 05 |
Andrenidae |
112 |
0.0253 |
0.8168 |
|
Lasioglossum 04 |
Halictidae |
101 |
0.0228 |
0.8396 |
|
M. coreopsis (02) |
Apidae |
88 |
0.0199 |
0.8595 |
|
Perdita 13 |
Andrenidae |
65 |
0.0147 |
0.8742 |
|
Lasioglossum 01 |
Halictidae |
61 |
0.0138 |
0.8880 |
|
Augochlorella striata |
Halictidae |
51 |
0.0115 |
0.8995 |
|
Ancyloscelis sejunctus |
Apidae |
50 |
0.0113 |
0.9108 |
|
Diadasia diminuta |
Apidae |
40 |
0.0090 |
0.9198 |
|
Perdita 14 |
Andrenidae |
34 |
0.0077 |
0.9275 |
|
Anthophorula compactula |
Apidae |
31 |
0.0070 |
0.9345 |
|
Perdita 03 |
Andrenidae |
24 |
0.0054 |
0.9399 |
|
Perdita perpulchra (01) |
Andrenidae |
18 |
0.0041 |
0.9440 |
|
Perdita 06 |
Andrenidae |
18 |
0.0041 |
0.9480 |
|
M. humilior (06) |
Apidae |
18 |
0.0041 |
0.9521 |
|
Perdita 02 |
Andrenidae |
17 |
0.0038 |
0.9560 |
|
Halictus ligatus 01 |
Halictidae |
16 |
0.0036 |
0.9596 |
|
Lasioglossum 05 |
Halictidae |
15 |
0.0034 |
0.9630 |
|
Nomada texana |
Apidae |
15 |
0.0034 |
0.9663 |
|
Svasta atripes |
Apidae |
11 |
0.0025 |
0.9688 |
|
M. tepaneca 4 (04) |
Apidae |
10 |
0.0023 |
0.9711 |
|
Perdita 11 |
Andrenidae |
7 |
0.0016 |
0.9727 |
|
A. texanus (male) |
Halictidae |
7 |
0.0016 |
0.9742 |
|
Diadasia enavata |
Apidae |
7 |
0.0016 |
0.9758 |
|
Perdita 15 |
Andrenidae |
6 |
0.0014 |
0.9772 |
|
Perdita 17 |
Andrenidae |
6 |
0.0014 |
0.9785 |
|
Triepeolus lunatus |
Apidae |
6 |
0.0014 |
0.9799 |
|
Calliopsis 04 |
Andrenidae |
5 |
0.0011 |
0.9810 |
|
Pseudopanurgus 01 |
Andrenidae |
5 |
0.0011 |
0.9822 |
|
Hylaeus 01 |
Andrenidae |
4 |
0.0009 |
0.9831 |
|
Perdita 08 |
Andrenidae |
4 |
0.0009 |
0.9840 |
|
Perdita 12 |
Andrenidae |
4 |
0.0009 |
0.9849 |
|
Calliopsis 02 |
Andrenidae |
4 |
0.0009 |
0.9858 |
|
Ashmeadiella 01 |
Megachilidae |
4 |
0.0009 |
0.9867 |
|
Sphecodogastra 02 |
Halictidae |
4 |
0.0009 |
0.9876 |
|
Apis mellifera |
Apidae |
4 |
0.0009 |
0.9885 |
|
Ceratina 01 |
Apidae |
4 |
0.0009 |
0.9894 |
|
Perdita 16 |
Andrenidae |
3 |
0.0007 |
0.9901 |
|
Megachile brevis |
Megachilidae |
3 |
0.0007 |
0.9907 |
|
Ashmaediella 02 |
Megachilidae |
3 |
0.0007 |
0.9914 |
|
Anthophora montana |
Apidae |
3 |
0.0007 |
0.9921 |
|
Triepeolus 03 |
Apidae |
3 |
0.0007 |
0.9928 |
|
Perdita 10 |
Andrenidae |
2 |
0.0005 |
0.9932 |
|
Calliopsis 01 |
Andrenidae |
2 |
0.0005 |
0.9937 |
|
Calliopsis 03 |
Andrenidae |
2 |
0.0005 |
0.9941 |
|
Augochloropsis |
Halictidae |
2 |
0.0005 |
0.9946 |
|
Halictus 02 |
Halictidae |
2 |
0.0005 |
0.9950 |
|
Svastra 03 |
Apidae |
2 |
0.0005 |
0.9955 |
|
Melissodes 5 (05) |
Apidae |
2 |
0.0005 |
0.9959 |
|
A. affabilis |
Apidae |
2 |
0.0005 |
0.9964 |
|
Triepeolus 04 |
Apidae |
2 |
0.0005 |
0.9968 |
|
Andrena 01 |
Andrenidae |
1 |
0.0002 |
0.9971 |
|
Andrena 02 |
Andrenidae |
1 |
0.0002 |
0.9973 |
|
Perdita 07 |
Andrenidae |
1 |
0.0002 |
0.9975 |
|
Perdita 09 |
Andrenidae |
1 |
0.0002 |
0.9977 |
|
Osmia 01 |
Megachilidae |
1 |
0.0002 |
0.9980 |
|
Dianthidium curvatum |
Megachilidae |
1 |
0.0002 |
0.9982 |
|
A. virescens |
Halictidae |
1 |
0.0002 |
0.9984 |
|
Sphecodogastra texana |
Halictidae |
1 |
0.0002 |
0.9986 |
|
Tetraloniella willmatae |
Apidae |
1 |
0.0002 |
0.9989 |
|
Savastra obliqua |
Apidae |
1 |
0.0002 |
0.9991 |
|
Holcopasites stevensi |
Apidae |
1 |
0.0002 |
0.9993 |
|
Anthophorula completa |
Apidae |
1 |
0.0002 |
0.9995 |
|
Triepeolus 02 |
Apidae |
1 |
0.0002 |
0.9998 |
|
Triepeolus 05 |
Apidae |
1 |
0.0002 |
1.0000 |
Bee Community Relationships with Irrigation Scenarios and Soil Conditions
Across the 16 sampled transects among fields, the total number of specimens collected ranged from 26 to 534 individuals, and from five to 40 bee morphospecies (Table 5). The highest numbers of individual bees collected came from the CRP plot (DgC, Fig. 2), and this site also had 31 morphospecies, while the greatest number of morphospecies were collected from one of the tree-lined field corners (n = 40, Fig. 3). An average of 22 morphospecies were collected among sampled fields. A dryland, subsurface drip, and center field had relatively high numbers of morphospecies (30, 29, and 28) and with relatively high numbers of individuals collected. The alfalfa field was sampled on only two dates, and therefore the numbers for this field (i.e., 28 morphospecies) would likely be at the higher end if it had been sampled on every sampling date. The lowest number of morphospecies (10, 10 and 12) came from three dryland fields, while a sandy tree lined corner contained the lowest number of morphospecies at five; however, this site suffered from bee bowls being damaged and covered by blowing sand, rendering the samples damaged and incomplete.
While the number of morphospecies (S) showed some variation across fields (from 5 to 40), the community diversity indices E, H and D were not found to be statistically different across irrigation scenarios, nor were these diversity indices correlated with any of the soil condition variables (see below). Furthermore, indicator species analysis provided no significant indicator taxa significantly related to any of the irrigation transition scenarios.
Table 5. Summary of native bees occurring across fields according to irrigation scenarios (i.e. center pivot, subsurface irrigation and dryland). One Conservation Reserve Program field was sampled (DgC), and three additional field-edge plots containing woody trees were sampled (Ma 1T, Ma 2T, and H_site) that were proximal to production fields.
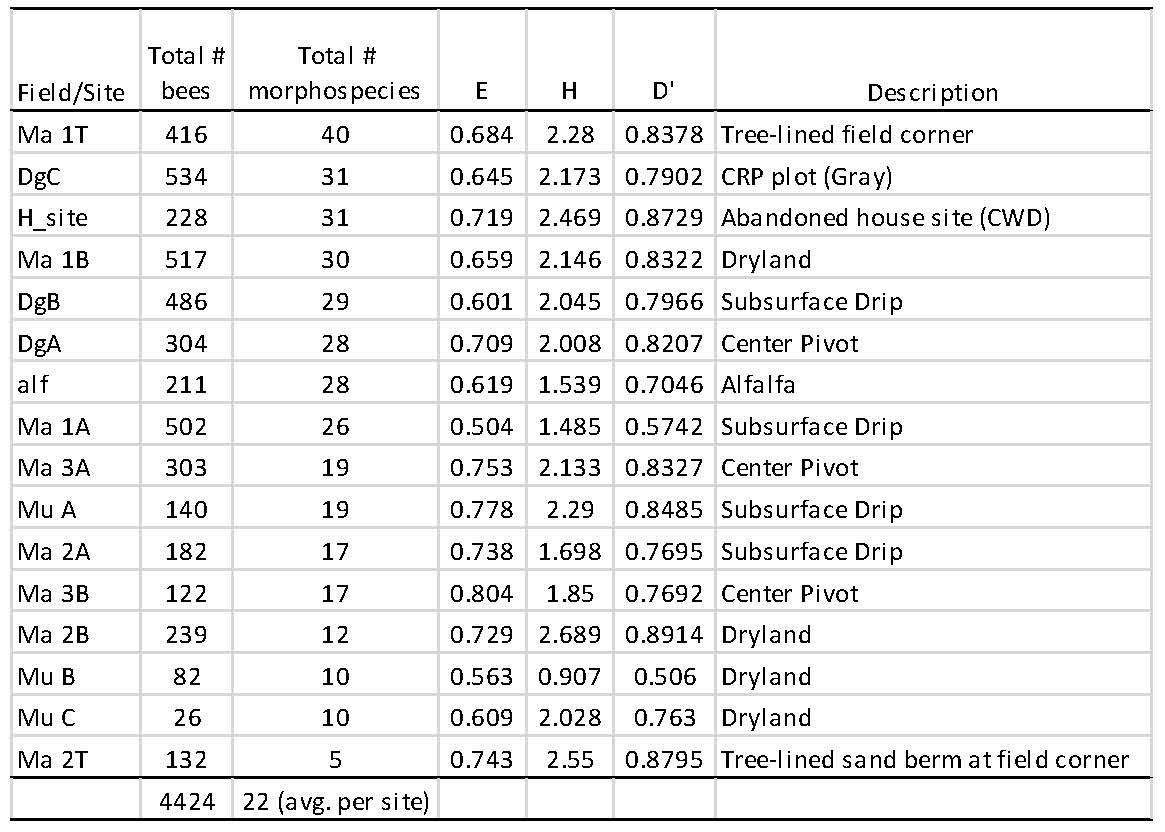
S = Richness = number of non-zero elements in row; “Total # morphospecies” in table
H = Diversity = - sum (Pi*ln (Pi)) = Shannon`s diversity index
D = Simpson`s diversity index for infinite population = 1 - sum (Pi*Pi)
where Pi = importance probability in element i (element i relativized by row total)
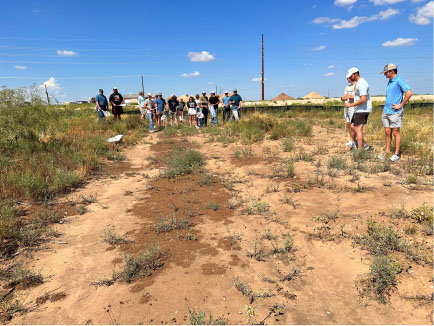
Figure 2. CRP grassland site (DgC), which contained the second highest number of morphospecies (31) and the overall highest number of bee individuals (534) (Table 5).
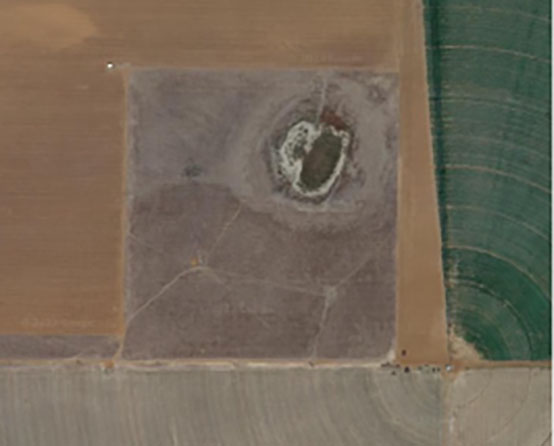
Figure 3. Tree-lined corner of Ma 1T, which contained the highest number of bee morphospecies (40) and a high number of bee individuals (416) (Table 5).
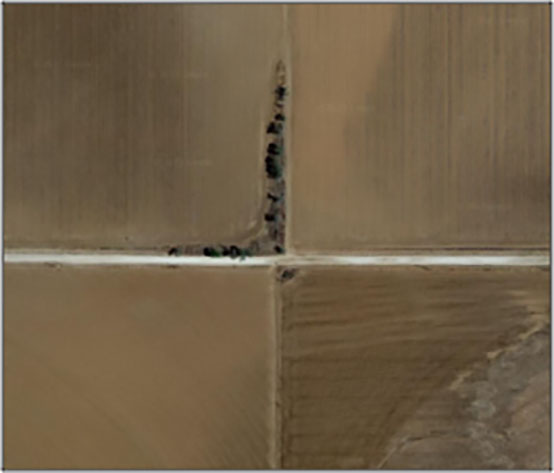
Table 6. Soil variables measured in each field from 2019 to 2023. These variables were used in multivariate ordinations to analyze relationships between soil variables and bee communities.
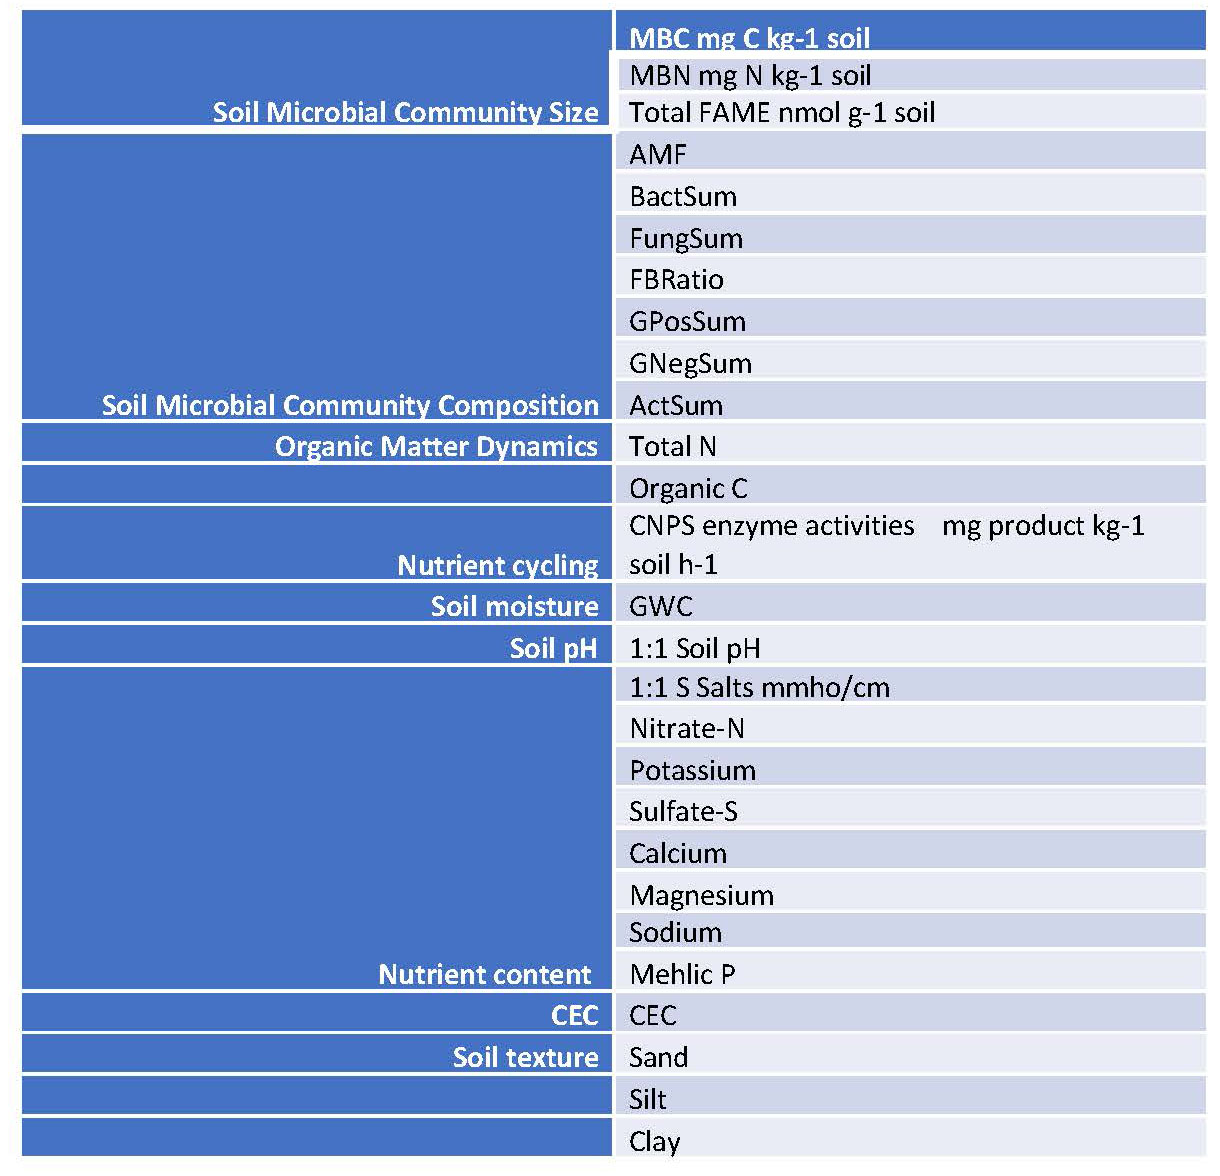
Figure 4. NMDS ordination biplot showing each field (labelled) according to irrigation scenario (symbol). The proximity of fields in the graph reflect the general similarities in bee communities, with fields futher apart being more dissimilar in bee community structure. The “tree” sites and the alfalfa samples were included in this analyses, but these were not used in the analyses of soil variable relationships (i.e. soil was not sampled at these additional fields: H_site, Ma 1T, ans Ma 2T). The final stree of this ordination was 8.55, and a 2-dimensional solution was recommended (i.e. most variation is extracted in just two orthogonal axes). The first two axes were significant based on Monte Carlo simulations using randomized data.
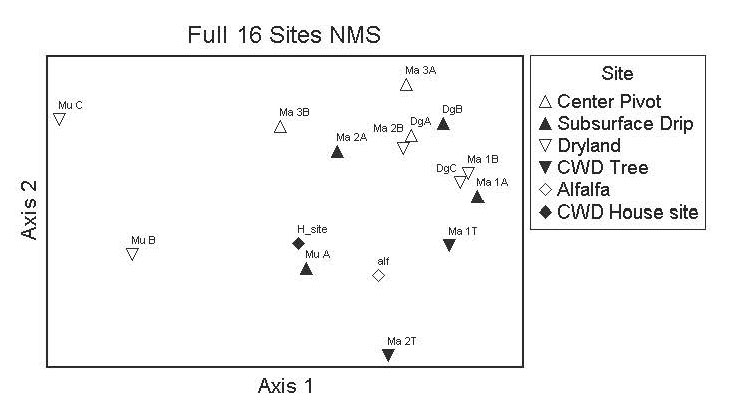
Figure 5. NMDS ordination with overlay of a second environmental matrix containing the soil variables in Table 6, using soil data from 2019 (top figure) and 2021 (bottom figure). The variables Soil C and F/B ratio were weakly correlated bee communities along axis 2 in 2021 (bottom), while in 2019 N-N was weakly correlated with sites grouped according to native bee communities along axis 1 (top).
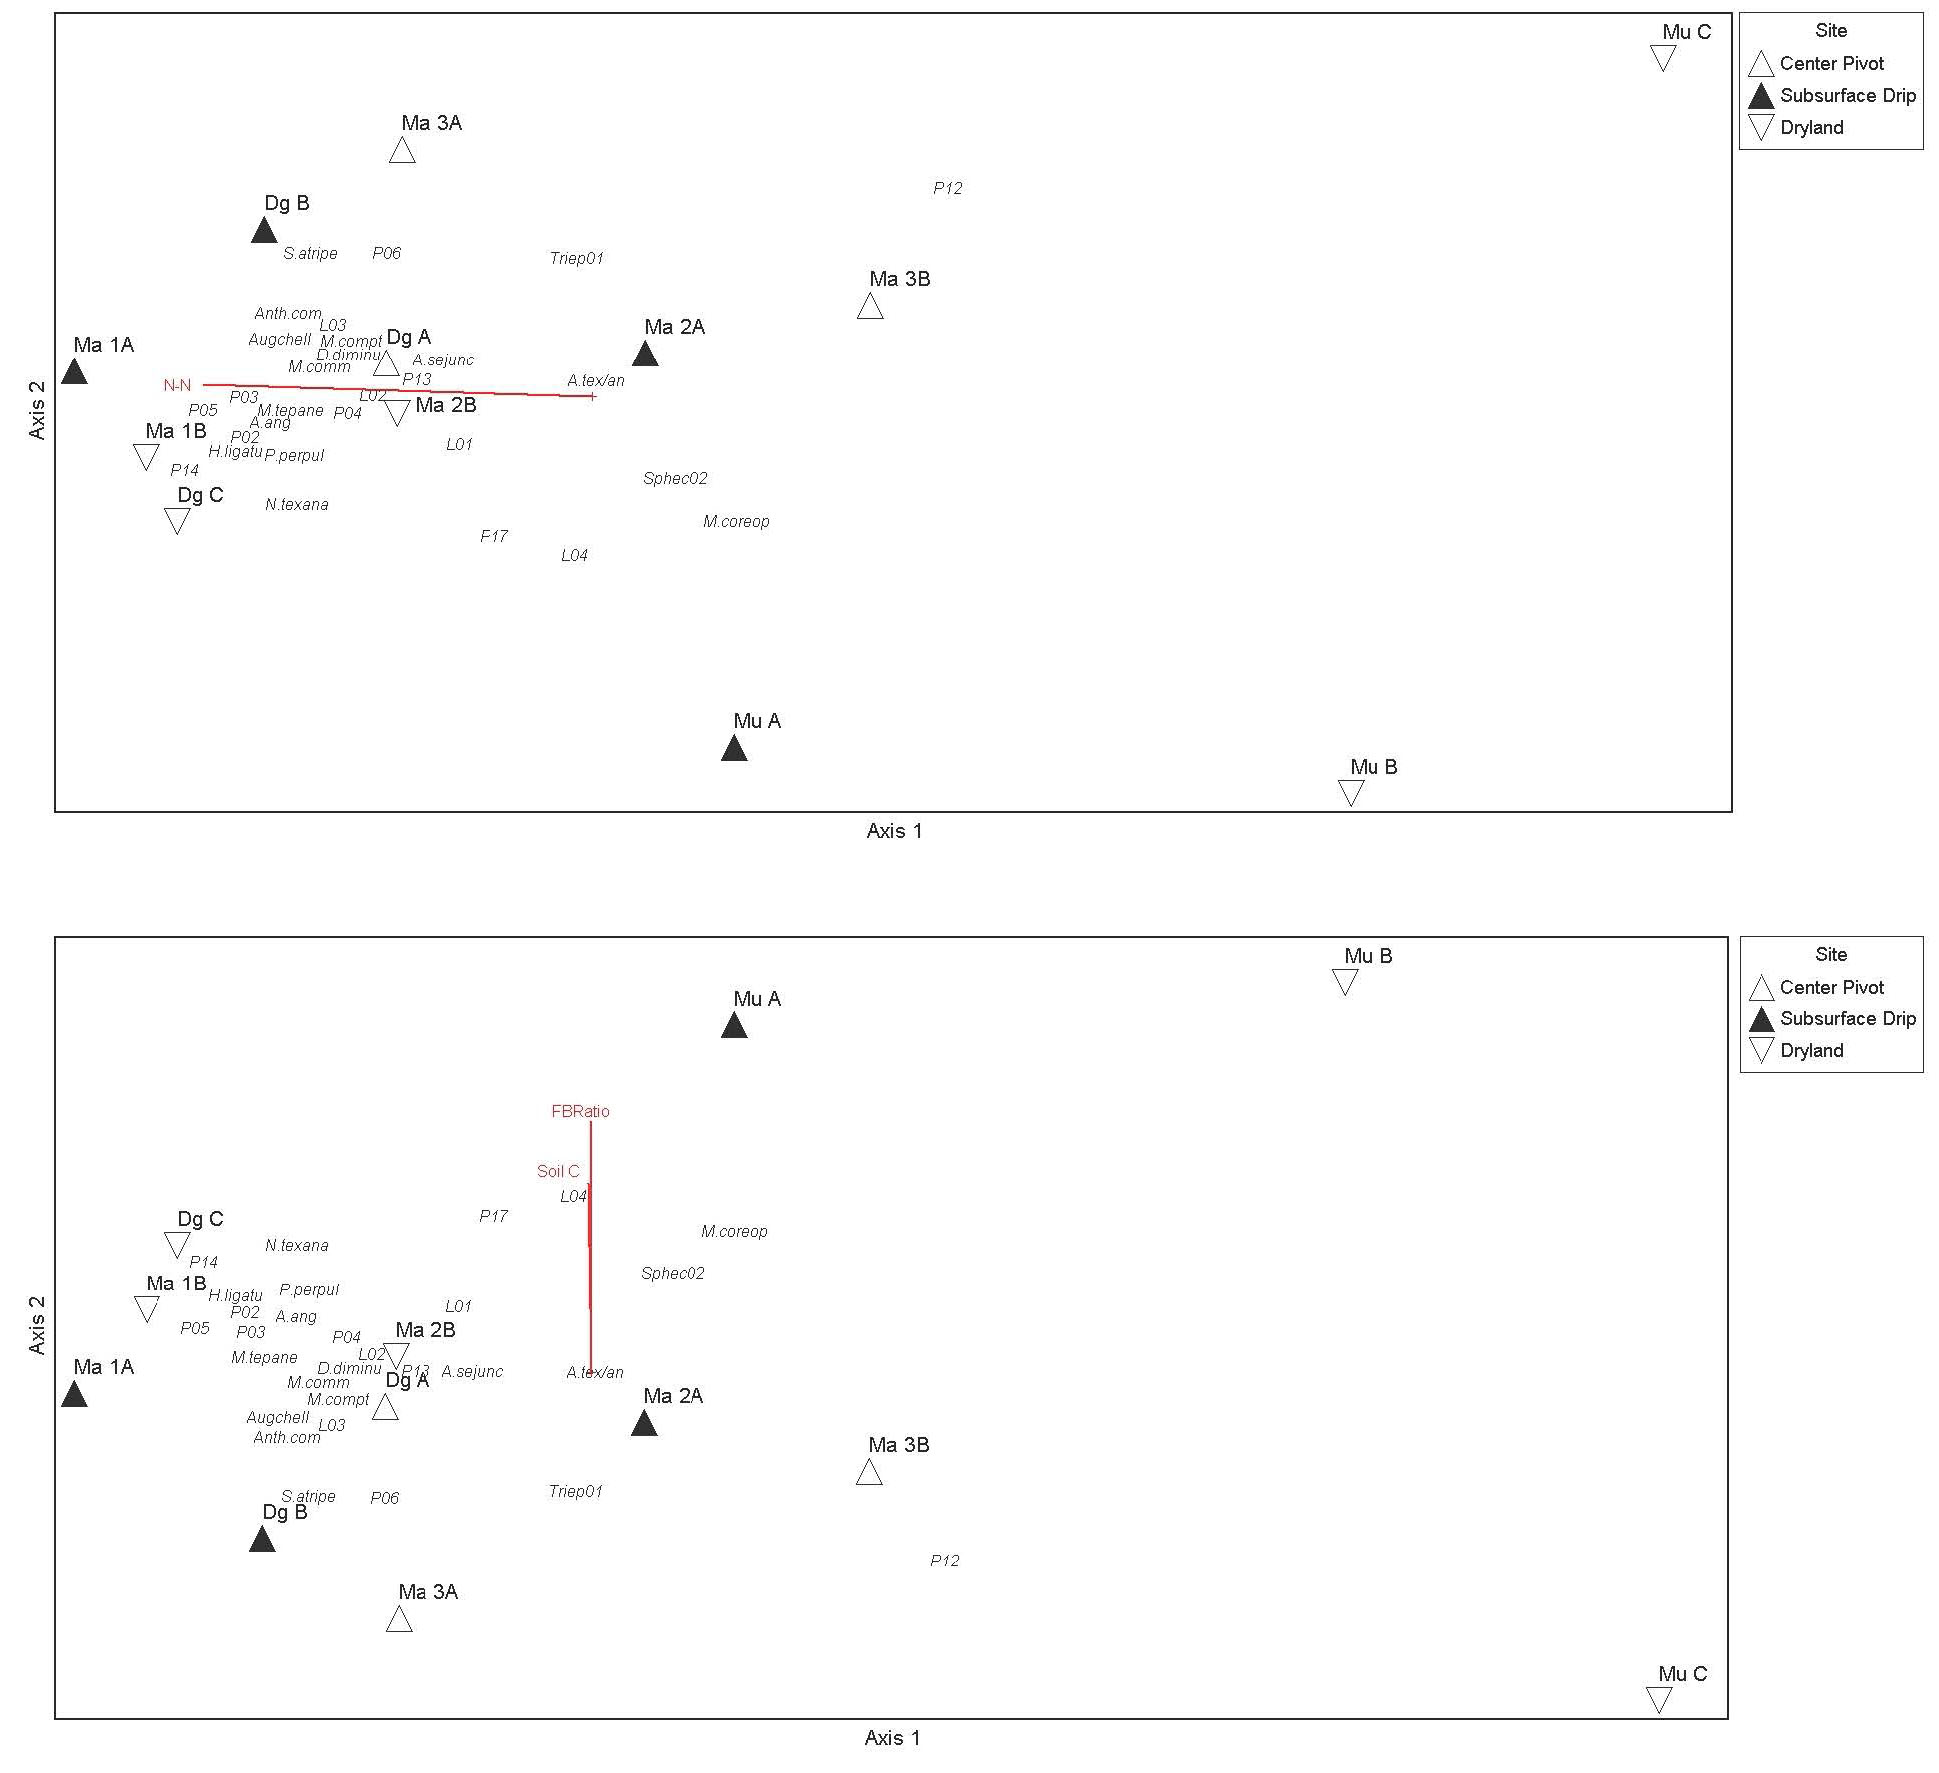
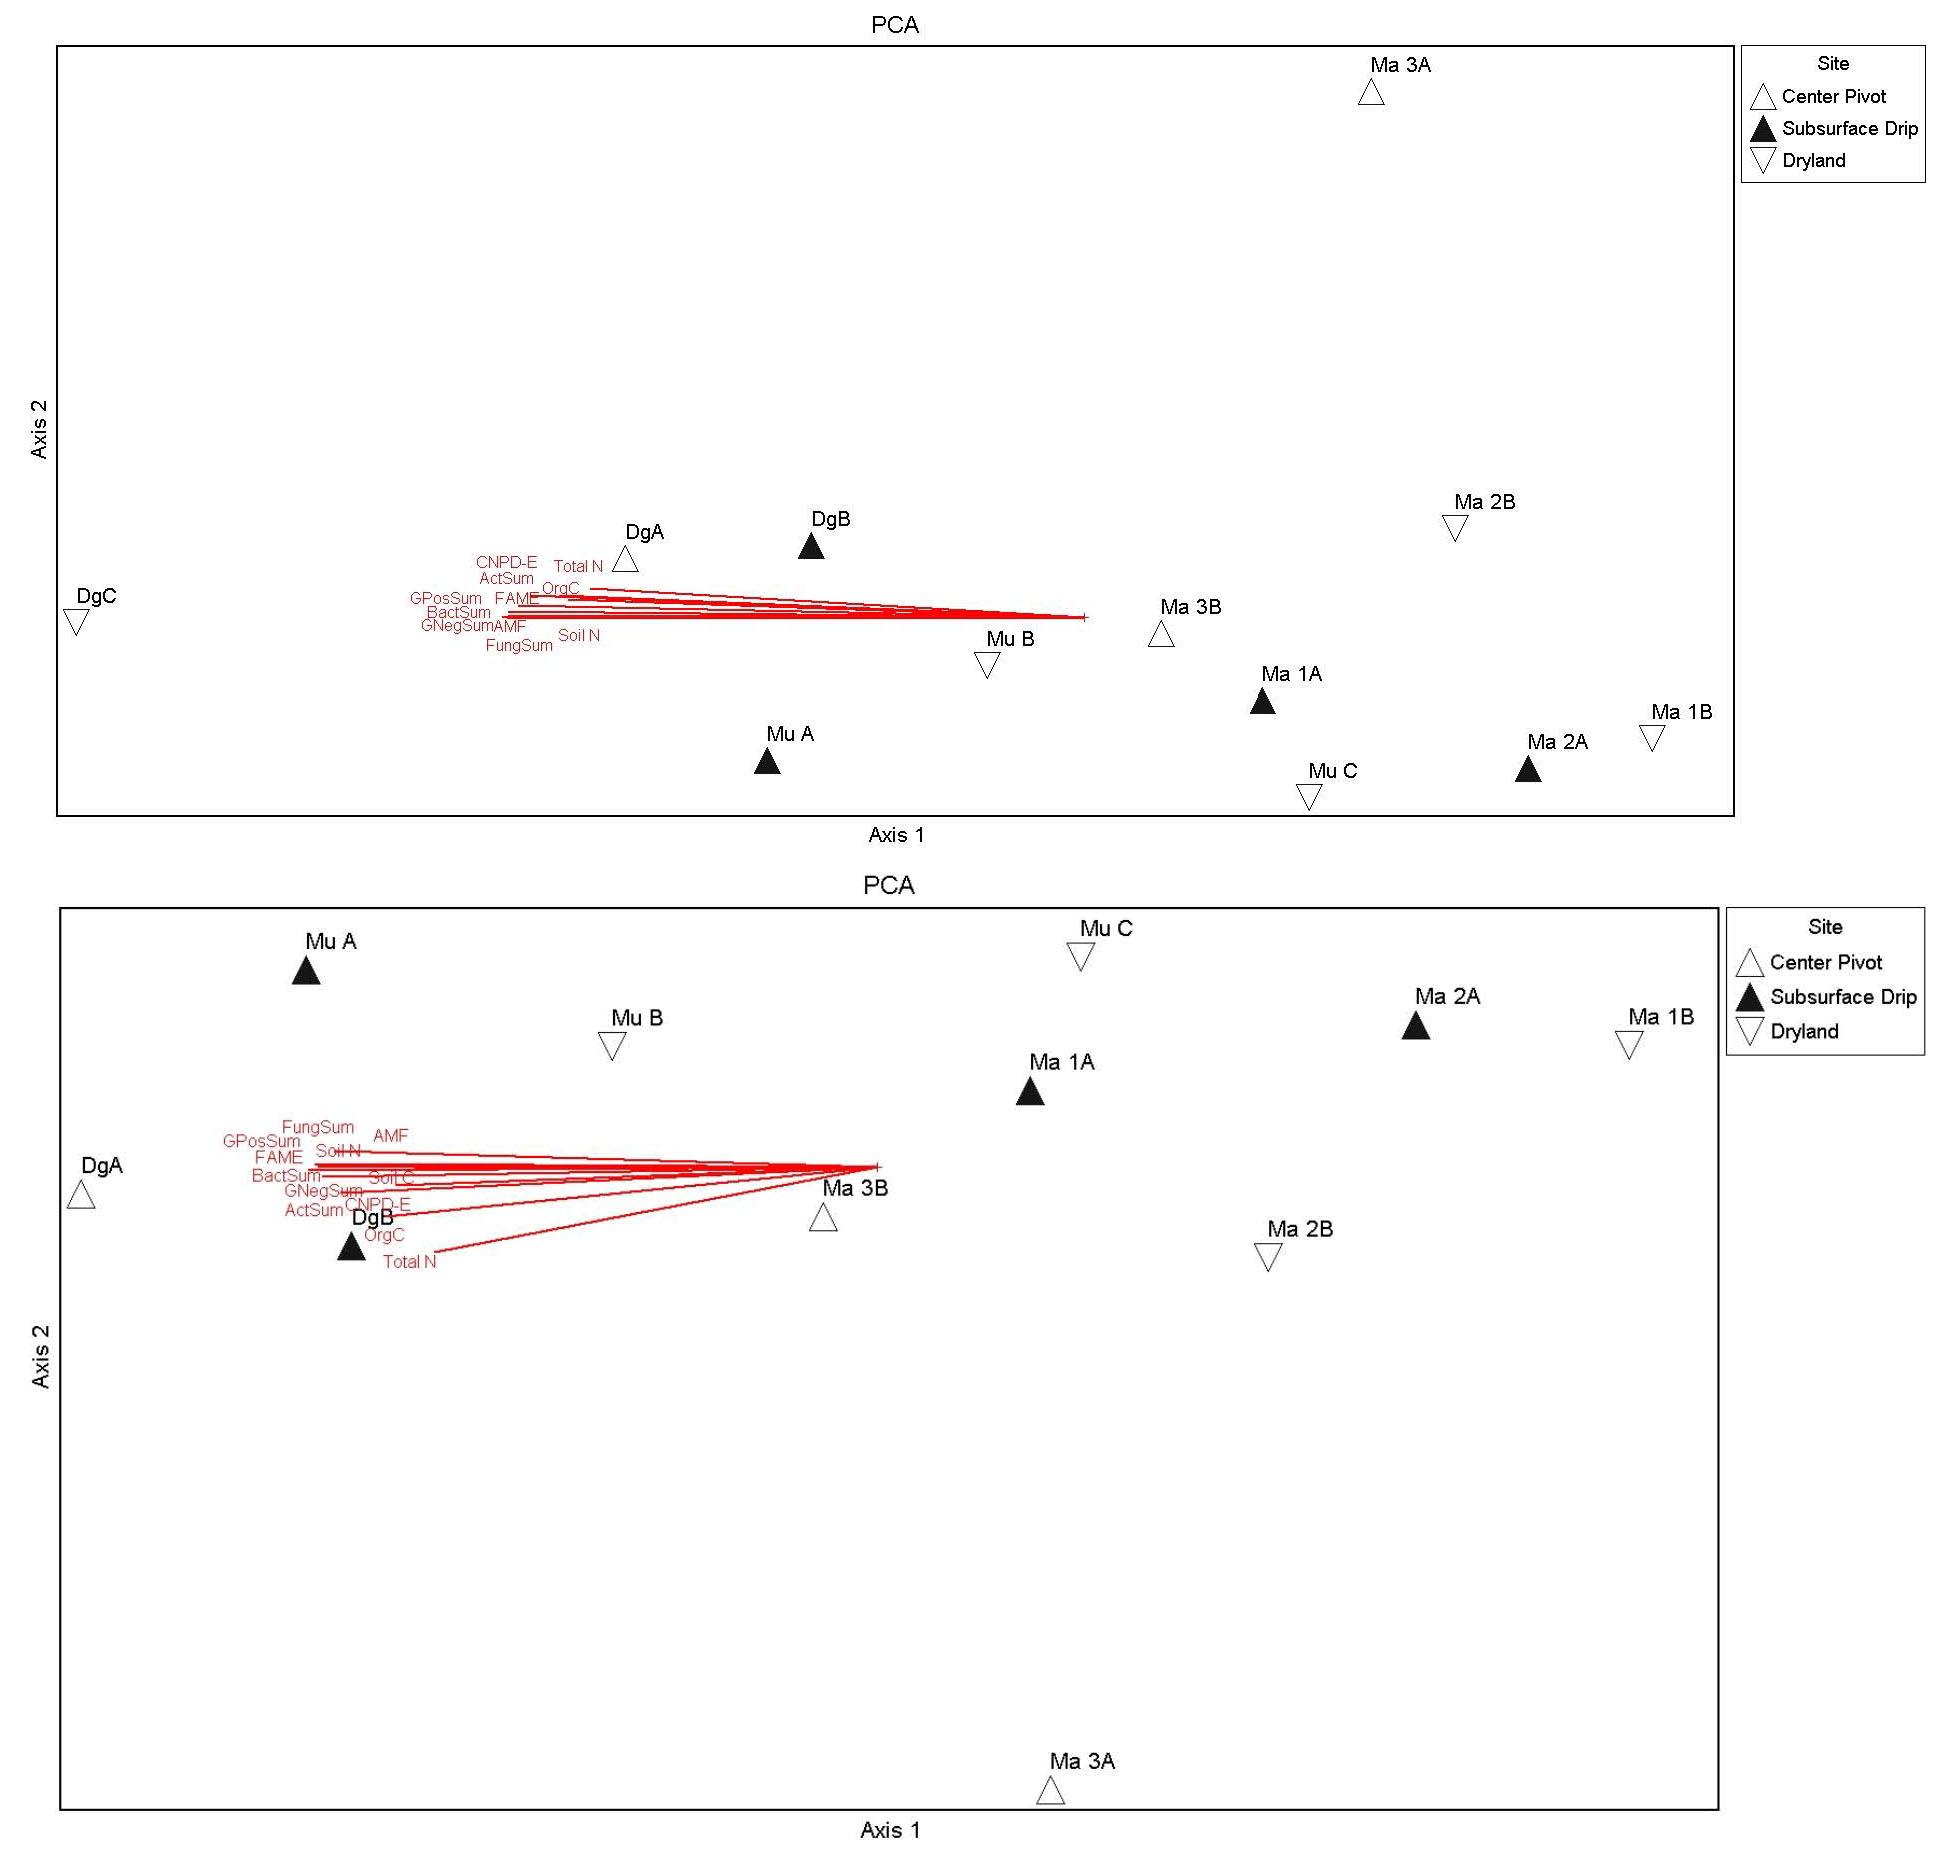
Figure 6. Principal components analysis (using correlation matrix) showing relationships of soil condition variables and S, E, H, and D community indices (Table 5) across fields different irrigation scenarios (symbols). Soil condition variables were highly multicollinear, with vectors correlated and grouped along axis 1. The top figure includes the CRP field that was heavily influencing the PCA biplot and site groupings (as an outlier; DgC). A second PCA (bottom) was run with this outlier removed, which resulted in a better separation of sites along axis 1, but still with high multicollinearity of variables along axis 1 and influenced by another field (DgA) located at the same farm as the CRP plot (DgC). DgA was also an initial grassland control containing a good stand of TEFF grass, but this field was terminated in 2022.
While no bee nests were observed in the field during our transect sampling or during opportunistic surveys, a large nest of the chimney sunflower bee (Diadasia enavata) was observed at the Quaker Avenue Research Farm at Texas Tech University. Since 2020, a total of three bee species have been observed in large nesting aggregations at this location (Fig. 7).
Figure 7. A soil nest of a native bee (shown by darker soil), Diadasia enavata. Students of the course Introductory Entomology at Texas Tech University had the opportunity to learn about the importance of undisturbed bare soil habitats on farms for native bee nesting, including old unused roadbeds as shown here.
(Click link) Video of Diadasia enavata nesting (Quaker Avenue Research Farm, Department of Plant and Soil Science, Texas Tech University)
Figure 8. Pinned specimens of the chimney sunflower bee, Diadasia enavata, collected from the large ground nest shown in Fig. 7 above.
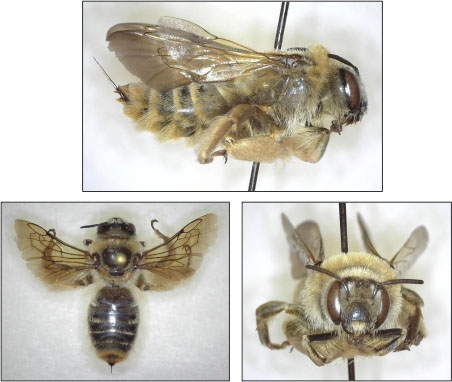
Figure 9. A specimen drawer showing the organization of bee specimens prior to morphological analysis and data digitization.
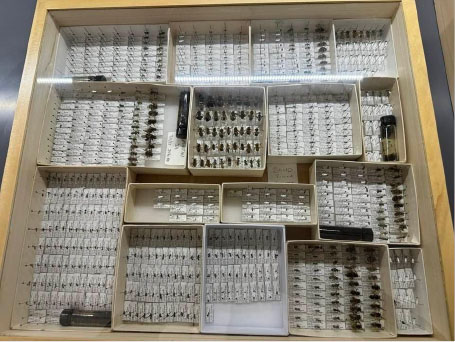
Figure 10. A native bee cleptoparasite, Holcopasites stevensi. This bee was collected from Ma 1A and represents only a handful of specimens collected from Texas.
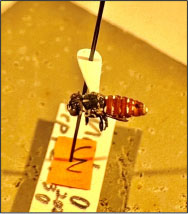
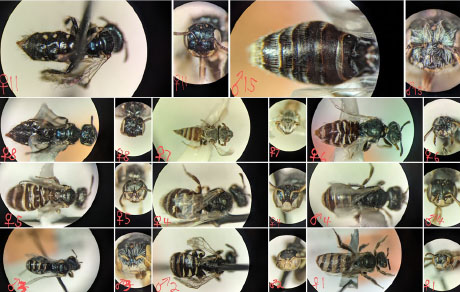
Figure 11. Small native bees in the genus Perdita. This group is very diverse with a total of 17 morphospecies identified from the SARE collections. Ongoing work continues to document morphological variation of this group to determine species level biodiversity. (Photos by undergraduate native bee researcher J. Winsauer)
Overall Findings of Pollinator Communities and Relationships with Irrigation Transitions and Soil Conditions
- The bee community occurring across the partner farms was diverse, represented by a total of 71 morphospecies including species rarely collected (e.g. Fig. 9).
- A few taxa dominate the bee community, with the top five numerically dominant taxa comprising over 72 percent of the total number of individuals collected. Most native bees were represented by less than 10 individuals.
- Bee communities were not different among irrigation transition scenarios, although there was a wide range of morphospecies numbers and total abundances across fields. Total abundances, morphospecies richness and diversity indices were not significantly different among transition scenarios or correlated with soil variables.
- The high number of morphospecies and total individuals in the CRP site, tree-lined corner (Ma 1T), and the house site (H_site) suggest these could be important on-farm habitats for providing foraging and nesting resources for native bees. A need exists to better understand how these unmanaged wild lands provide resources for bees and other beneficial insects, and how this biodiversity could assist sustainable agriculture.
Educational & Outreach Activities
Participation summary:
A journal article is being developed to publish the results of the pollinator communities, in part to highlight the diversity supported by CRP and on-farm ruderal habitats.
Project Outcomes
Soil Sampling and Analyses
Within our first year of this project, we are making significant progress in the evaluation of the soil biological health component within the dryland transition experienced (by producers) in the Southern High Plains. Our first soil sampling was conducted in July and the samples are being processed for different soil biological indicators of the soil health. We only need to conduct the second soil sampling of this year, which will be done in October. The sampling in October will complete 4 years of fall samplings allowing a long-term evaluation of the transitions that producers are making. Having two samplings in the same year, possible through this grant, will allow our evaluation of any changes in the soil microbial component due to seasonal fluctuations for different water management agroecosystems. Specific soil health indicators linked to water conservation we identify in this research could help guide sustainable management for water-limited environments. Optimization in the detection of early changes in soil health and their linkages with soil functions, specifically related to soil water conservation, will reduce crop yield declines, improve farm incomes, and nurture rural livelihoods in the long run.
Pollinator Sampling
Pollinator sampling was initiated at two fields in 2020, yet because of restrictions related to COVID-19 much of the field work in 2020 was not accomplished. In 2021, pollinator sampling has been initiated at the proposed fields, and we are continuing to sample pollinator communities through cotton flowering in August and September. Concurrent and related activities involving pollinators in agroecosystems was a project conducted by two undergraduate students in barley and wheat crops beginning in March 2021. These students sampled pollinators using bee bowls at different fields containing either wheat or barley crops on five different dates through Spring 2021. A primary objective of this study was for the students to initiate learning of native bee taxonomy with a focus on early-season bees foraging in cover crops. Samples from these studies are currently being processed in the lab, while bee identification and community analysis will take place in fall-winter and combined with pollinator data acquired form the same fields in the 2022 growing season.
Concurrent with pollinator sampling in 2021 has been the development of a brief publication on pollinators in farm lands in the Southern High Plains region, emphasizing native bees, their habitats and conservation in working farms. This document is supported by a recent checklist of native bees (Discua and Longing, in manuscript) and highlights conservation practices and other farming practices in support of native bees.