Final report for LS22-372
Project Information
The Dallas–Fort Worth (DFW) metroplex contains some of the nation’s highest concentrations of food deserts, where limited access to fresh food, low household income, restricted transportation, and the legacy of outward migration have resulted in widespread vacant and underutilized land. Urban agriculture offers a promising strategy for improving food access, generating local economic opportunity, and strengthening community resilience. Early engagement activities with local farmers and community partners identified three critical barriers to expanding sustainable urban farming in resource-limited areas of southeast Fort Worth: (1) the need for low-cost, locally accessible soil-management strategies; (2) improved market access and financially viable pricing models; and (3) tools to help growers identify suitable land for production. This project addressed these barriers through four integrated objectives.
Objective 1 produced a high-resolution, interactive mapping tool that identifies and rates vacant lots in SE Fort Worth for urban crop production using zoning, slope, flood risk, soil characteristics, and infrastructure proximity. The analysis identified 15.5 km² (3,835 acres) of land exceeding the minimum 445 m² (0.11 acre) threshold for viable production, with 98% rated as moderately or highly suitable, providing a foundational resource for site selection by prospective growers, nonprofits, and community organizations.
Objective 2 evaluated food-waste compost and legume cover crops as low-cost soil-amendment strategies through a two-year, on-farm study (2023–2024) involving monthly soil sampling, tomato yield measurements, and drone-based NDVI monitoring. While early challenges required discontinuation of two participating farms, the consolidated research site demonstrated measurable treatment effects. Compost and cover-crop combinations improved vegetation vigor, moderated seasonal stress, and influenced soil pH and nutrient dynamics. Yield patterns suggest that amendments can be tailored to optimize plant performance in urban soils, informing future site-specific fertility recommendations.
Objective 3 employed mixed methods—including farmer interviews (n=8), customer surveys (n=44), market assessments (n=39), and community conversations—to evaluate the feasibility of a 75:25 (for-profit : non-profit) sales model. Findings highlight the diversity of farm business structures in the region, strong consumer interest in fresh and local produce, persistent cost and accessibility barriers for low-income households, and operational constraints that limit uniform adoption of tiered-pricing models. The results provide actionable insights for socially driven farmers and market organizers seeking to balance mission with economic sustainability.
Objective 4 originally aimed to produce a new toolkit integrating project findings. However, given the availability of a recently published urban farming manual authored by project Co-PIs, efforts shifted toward youth outreach and agricultural workforce development. Across 2023–2025, the project engaged 13 middle- and high-school studentsthrough hands-on farm experiences, research internships, and training in soil analysis, data interpretation, and drone imagery. Two high-school interns and two graduate assistants presented project-related research posters at the 2025 SSARE-sponsored SPI Conference, advancing SARE’s long-term goal of cultivating future agricultural leaders.
Collectively, this project provides a replicable framework for urban-agriculture development in resource-limited communities by generating actionable land-suitability tools, low-cost soil-management insights, market-informed strategies, and youth-centered pathways into sustainable agriculture.
The proposed project will address farmer-identified barriers to sustainable tomato production on resource-limited urban farm (in the study area) via four specific objectives;
1) mapping and rating vacant lots in SE Fort Worth for urban crop production;
2) evaluating food-waste compost with a legume cover crop as low-cost sustainable soil amendment;
3) evaluate a proposed 75: 25% (for-profit: non-profit and visa-versa) selling model in the context of social entrepreneurship and available local markets;
4) using the results from objectives 1, 2 and 3 to develop outreach and training material to support peer-to-peer and community-based training for sustainable urban crop production in resource-limited areas.
Cooperators
- - Technical Advisor - Producer
- - Producer
- - Producer
- - Producer
Research
Research activities under this project occurred within three of the four proposed objectives. The fourth objective, which focused on outreach and education, is discussed separately under the Outreach and Education section of this report. The three research objectives were:
-
Mapping and rating vacant lots in southeast (SE) Fort Worth for urban crop production;
-
Evaluating food-waste compost with a legume cover crop as a low-cost, sustainable soil amendment for supporting tomato growth; and
-
Evaluating a proposed 75:25 (for-profit: non-profit) selling model in the context of social entrepreneurship and available local markets.
Work on Objective 1 spanned three reporting cycles (2022–2025), while Objectives 2 and 3 were carried out during the 2023–2025 reporting periods.
Objective 1: Mapping and Rating Vacant Lots in SE Fort Worth for Urban Crop Production
Activities under Objective 1 began with the use of Google Maps data (2022–2023) to identify church properties with potentially available land for urban agriculture and to develop an initial inventory and ranking system. In the 2023–2024 cycle, this effort expanded to include GIS-based ground-truthing and analysis of multispectral satellite imagery to identify additional vacant lots suitable for crop production. Each site visit recorded the following: (1) land condition and clearing requirements, (2) landscaping presence, (3) parking access, (4) fencing, (5) storage infrastructure, (6) adjacent land use, and (7) evidence of prior cultivation. Unsuitable sites, such as paved or gravel-covered areas or those lacking basic infrastructure, were excluded from the inventory.
In the final reporting cycle, high-resolution (50 cm) WorldView-2 imagery was analyzed using a supervised machine learning approach (Support Vector Machine, SVM) to classify bare land and vegetated open areas. Suitability for urban crop production was evaluated across six criteria: area, zoning, slope, flood risk, soil characteristics, and road proximity. Each criterion was scored on a 1-3 scale (low-high suitability).
-
Area: No restriction except for zoning districts H and MU (maximum one acre).
-
Zoning: AG (agriculture) = 3; other districts = 2; H, MU, and form-based = 1.
-
Slope: Derived from DEM; 0–5% = 3; 5–10% = 2; >10% = 1.
-
Flood risk: 1-year = 1; 5-year = 2; 100-year or none = 3.
-
Soil: Aggregated from slope gradient, drainage, available water storage (0–100 cm), flooding frequency, and water table depth (SSURGO data).
-
Road proximity: 0–300 m = 3; 300–1000 m = 2; >1000 m = 1.
Figure 1 shows the study area and respective data layers used in developing composite suitability map. The resulting composite suitability map provided a ranked index of candidate sites as an accessible interactive web-based map for future urban crop development in SE Fort Worth. The map was made available via ArcGIS Online with a free account sign up. Link to the map is provided in the Results and Discussion section of this report.
Objective 2: Evaluating food-waste compost with a legume cover crop as a low-cost, sustainable soil amendment for supporting tomato growth
Activities under Objective 2 during the 2023–2025 reporting cycles focused on two primary areas consistent with Southern SARE’s emphasis on adaptive research and stakeholder engagement: (1) revising the on-farm research strategy in response to climate disruptions and personnel changes, and (2) establishing new research plots for the 2024 tomato growing season to ensure continuity and data integrity.
The project initially sought to recruit community members as on-farm researchers and farmer-collaborators; however, persistent challenges with research compliance and, in one instance, a credible safety concern, led to discontinuation of two sites and pivoting to hiring new on-farm researchers. In cases where on-farm research was discontinued at the sites, both farmers were compensated and one continued to participate in outreach and educational activities. Subsequently, new project personnel were hired to manage data collection, and analytical consistency for on-farm research activities.
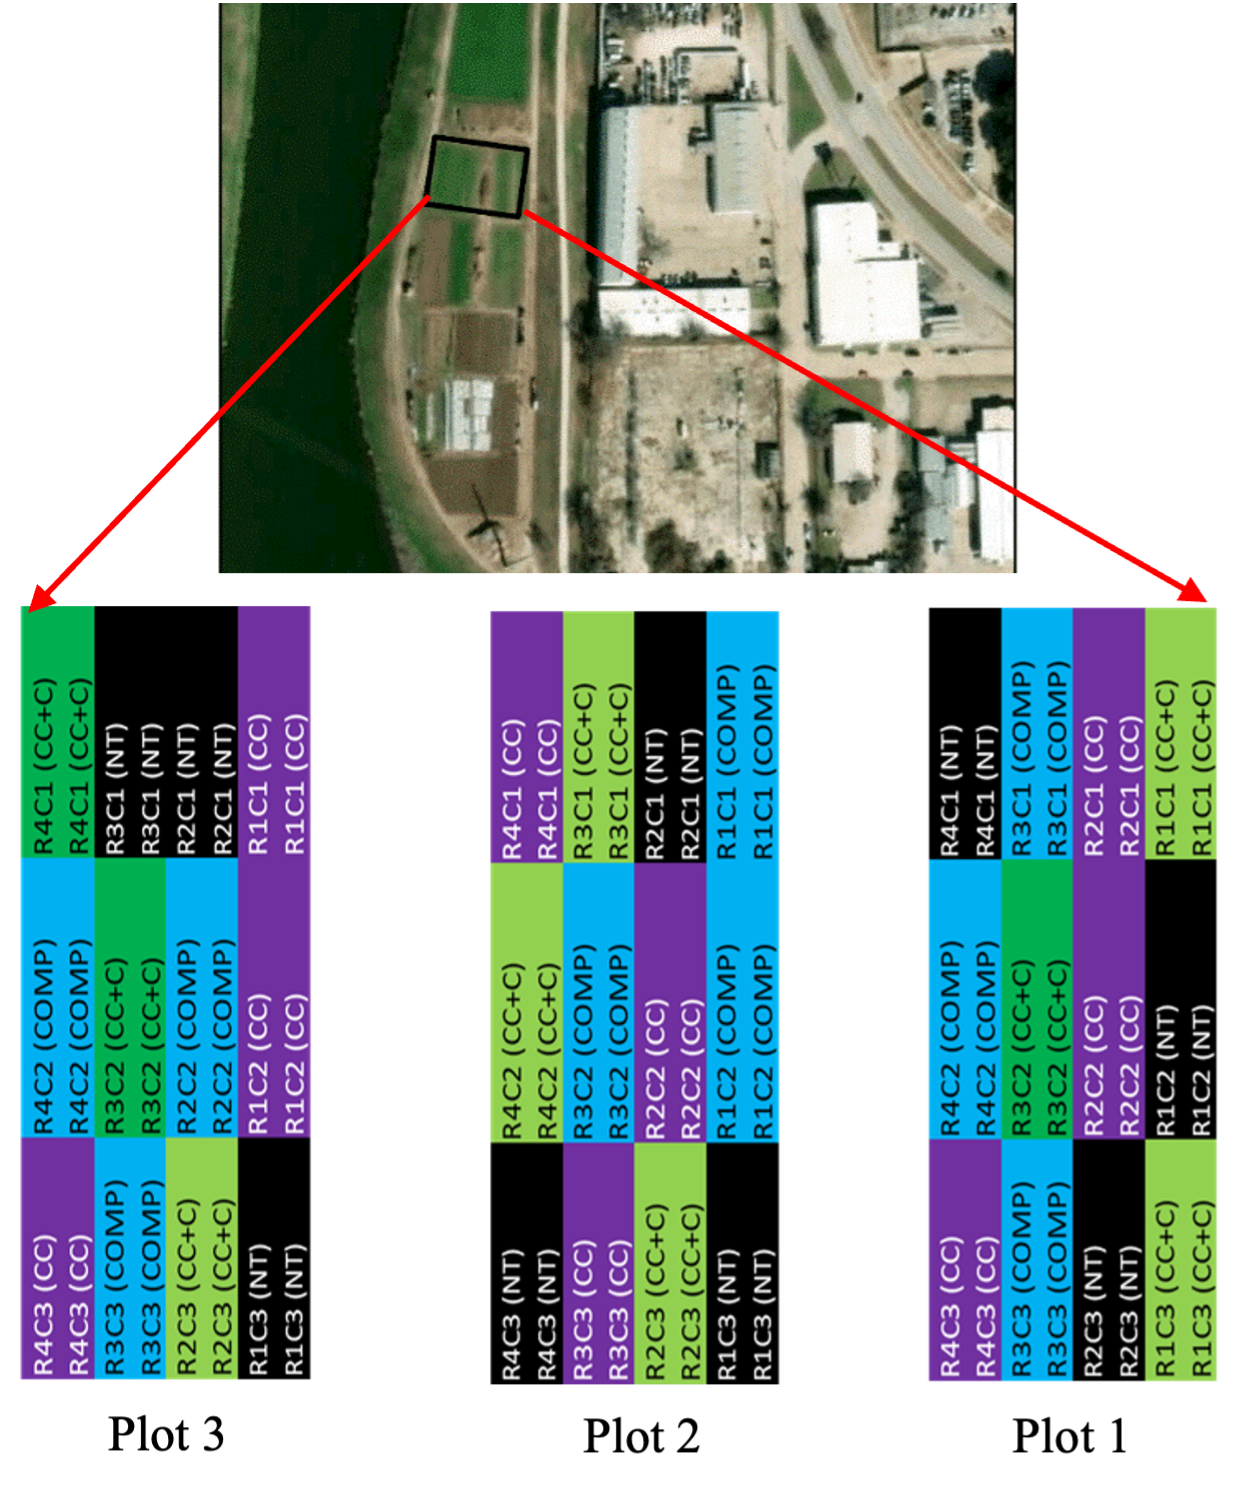
Two new on-farm research plots (Plot 2 and Plot 3) were established on virgin land in December 2023 at the sole functioning site that produced usable data during 2023, bringing the total at that farm to three plots. Figure 2 shows the layout of the experimental plots and respective treatments. Plot 1 was the same plot from 2023 - providing a second year of data at that location. Plot 2 was similar to Plot 1 in being conventionally tilled to 6" depth while Plot 3 was deep dug manually to 18" after conventional tilling. The same randomized design with triplicates across four treatments of compost + cover crop, compost only, cover crop only, and control (no compost + no cover crop) was used across all three plots. Each 12 ft × 8 ft treatment cell featured a dual-bed design (3-ft-wide beds separated by a furrow) with ten tomato plants per cell, spaced 2 ft apart. Two inches of compost were applied to relevant treatments, and winter pea cover crops were seeded as designated. Soil samples were collected at randomized points, composited in paper bags, oven-dried, crushed, sieved, and stored for analysis.
Soil pH, electrical conductivity (EC), and elemental composition (C, H, N, S) were measured monthly. Soil pH was determined using a 2 g soil : 8 mL 10 mM CaCl₂ slurry, and EC was measured using a 1:2 soil-to-deionized water mixture. Both were analyzed with an Accumet AB200 meter using respective probes. Elemental composition was determined via dry combustion (Elementar vario Micro Cube, 5 mg samples). Additional data included tomato yield (fruit count and weight) and drone-based NDVI to assess canopy health and spatial variability. Although the project originally planned to include the Haney Soil Health Test, instrument malfunction with the ICP-OES prevented completion during the reporting period.
Tomato transplants (Celebrity hybrids) were provided by Mr. David Cole and his team at Tarrant County College–Northwest Campus. Plants were supplied in 4.5-inch pots and transplanted mid-March each season (March 18–21). All plants were fertilized, supported with cattle panels, and managed under uniform conditions across treatments.
Objective 3: Evaluating a 75:25 For-Profit : Non-Profit Sales Model
Objective 3 evaluated the feasibility of a 75:25 revenue-sharing model designed to promote social entrepreneurship while improving community food access. Mixed qualitative and quantitative approaches were used, including farmer interviews, customer surveys, farmers’-market assessments, and community conversations.
Between March and August 2023, eight farmers were interviewed to assess production practices, business models, pricing strategies, and community engagement efforts. Semi-structured interviews (30–60 minutes) were conducted in person or by phone, recorded in field notes, and thematically analyzed for patterns in profitability and social impact.
Customer surveys were administered at the Cowtown Farmers Market on June 10 (N = 20) and July 8 (N = 24), 2023. Surveys explored motivations for market attendance, purchasing behavior, and openness to socially equitable pricing. Participants received $15 vouchers redeemable at the market.
To contextualize the local retail environment, 39 farmers’ markets across the Dallas–Fort Worth region were assessed for vendor composition, pricing, visitor experience, accessibility, payment methods (cash, card, SNAP, WIC), and governance. Observations were recorded using a standardized Market Assessment Form and supplemented with photographs and brief interviews with vendors and staff.
Finally, community conversations were convened with two groups: (1) local stakeholders (nonprofit leaders, clergy, advisory board members) and (2) women aged 25 and older who make household food purchases in target zip codes. Each 45–90-minute discussion followed a semi-structured guide addressing shopping behavior, cooking practices, and barriers to food access. Notes were analyzed to identify common themes around affordability, accessibility, and trust in local food sources.
Together, these activities generated an integrated understanding of how a 75:25 model could function in practice and informed subsequent evaluation of its social and economic feasibility in regional food systems. (Full interview and Target Group discussion questions are included below)
Farmer Interviews
Name:
Date:
- Tell me about your farm. Do you own it? Work it?
- What type of business structure (sole proprietor, LLC, nonprofit)? Why was this chosen?
- What is the size of the farm? What type of growing methods do you use? Who else works there?
- What do you grow and sell? What types of produce? Any value-added products? How are your products priced? What is the method?
- How much do you sell at a higher price versus selling at a lower price?
- Where else do you sell your products? Other markets? Restaurants? Grocery stores? What are the plans for the future?
- If you sell elsewhere, where and why? What about the market influences this decision?
- How do you promote your products? Do you have a logo? Do you have a newsletter or other communication? What social media channels are used?
- What nonprofits and/or causes are you affiliated with (if any)?
- Do you currently find ways to provide for food-insecure communities? (donations, sell at discount).
- Whom do you feel are your key customers? How often do they buy? What do they buy? How many WIC customers do you think you have? What are they looking for?
- Approximately what is your monthly revenue? What is your profit margin? What are your key costs?
Key Target Group Questions
- Tell us a little about your role within your family and meal preparation.
- Who does the cooking?
- Who does the shopping?
- How often do you purchase food for your family?
- How often do you cook at home?
- Many people do you cook for at home?
- Tell us about a typical trip to the store to get groceries to prepare meals.
- Where do you typically shop? How often in a typical month? Tell us about a typical experience and what influences your decision to shop there.
- What are the primary items purchased? Why?
- What other types of stores (e.g., convenience stores) do you shop? Tell us where you may shop, about that experience, and what influenced your decision to shop there. How often does this occur?
- Have you ever purchased food at a farmer’s market? If so, tell us about those experiences and what influences this decision. If not, tell us why.
- Are there other places where you get food (e.g., church, food pantries)? What are the primary items received? Tell us about that experience and what influences this decision.
- Do you use SNAP benefits on any part of your food purchases? If so, what?
- What other daily factors influence your decisions around shopping and preparing meals?
Objective 1: Vacant Land Identification and Suitability Assessment
Work on Objective 1 progressed well across the three reporting cycles, beginning with the identification of church-owned properties (2022–2023) and culminating in a comprehensive, GIS- and machine-learning–based suitability assessment incorporating all vacant lots in the study area (2024–2025).
During the first reporting cycle, 145 churches were identified within the target zip codes of southeast Fort Worth, of which 76 churches (52%) had at least one acre of potentially leasable land suitable for urban crop production. Ground-truthing in the 2023–2024 period refined this estimate further: based on criteria such as land condition, availability of basic infrastructure (parking, fencing, storage), and absence of conflicting land uses, 50 church properties remained viable. These properties were distributed across the study area as follows: 76119 (n = 12), 76105 (n = 22), 76104 (n = 14), and 76111 (n = 2). Collectively, these church properties represent approximately 50 acres of potentially productive urban cropland—highlighting the importance of faith-based institutions as partners in community food initiatives.
Building on these findings, the project expanded the search to include non-church vacant parcels across southeast Fort Worth by combining GIS layers, parcel attribute data from the Tarrant Appraisal District, and high-resolution WorldView-2 multispectral satellite imagery. A supervised machine learning classification (Support Vector Machine, SVM) identified an additional 248 properties unused or underutilized that may support urban agriculture. These properties were subsequently incorporated into a broader suitability assessment to quantify potential cropland availability across the entire study area.
Using six criteria - area, zoning, slope, flood risk, soil characteristics, and road proximity - the analysis classified parcels into high, moderate, and low suitability for urban agriculture. Across the region, 16 km² (3,953.69 acres) of vacant land were identified as potentially viable (Figure 3A). Although only 1.14% (1.8 acres) met all optimal criteria and were classified as highly suitable, the majority (96.6%, or 3,802 acres) were moderately suitable, meaning they could be converted into productive land with modest investment in site preparation and infrastructure. Parcels classified as low suitability represented 2.26% of the total. Recognizing that very small parcels are often impractical for production agriculture, suitability was reassessed using a minimum lot size threshold of 445 m² (0.11 acre) a common benchmark in the urban agriculture literature (ref). When applying this threshold, 15.5 km² (3,835 acres) of land remained suitable for farming, offering a more realistic estimate of land that could support food production within the targeted neighborhoods (Figure 3B).
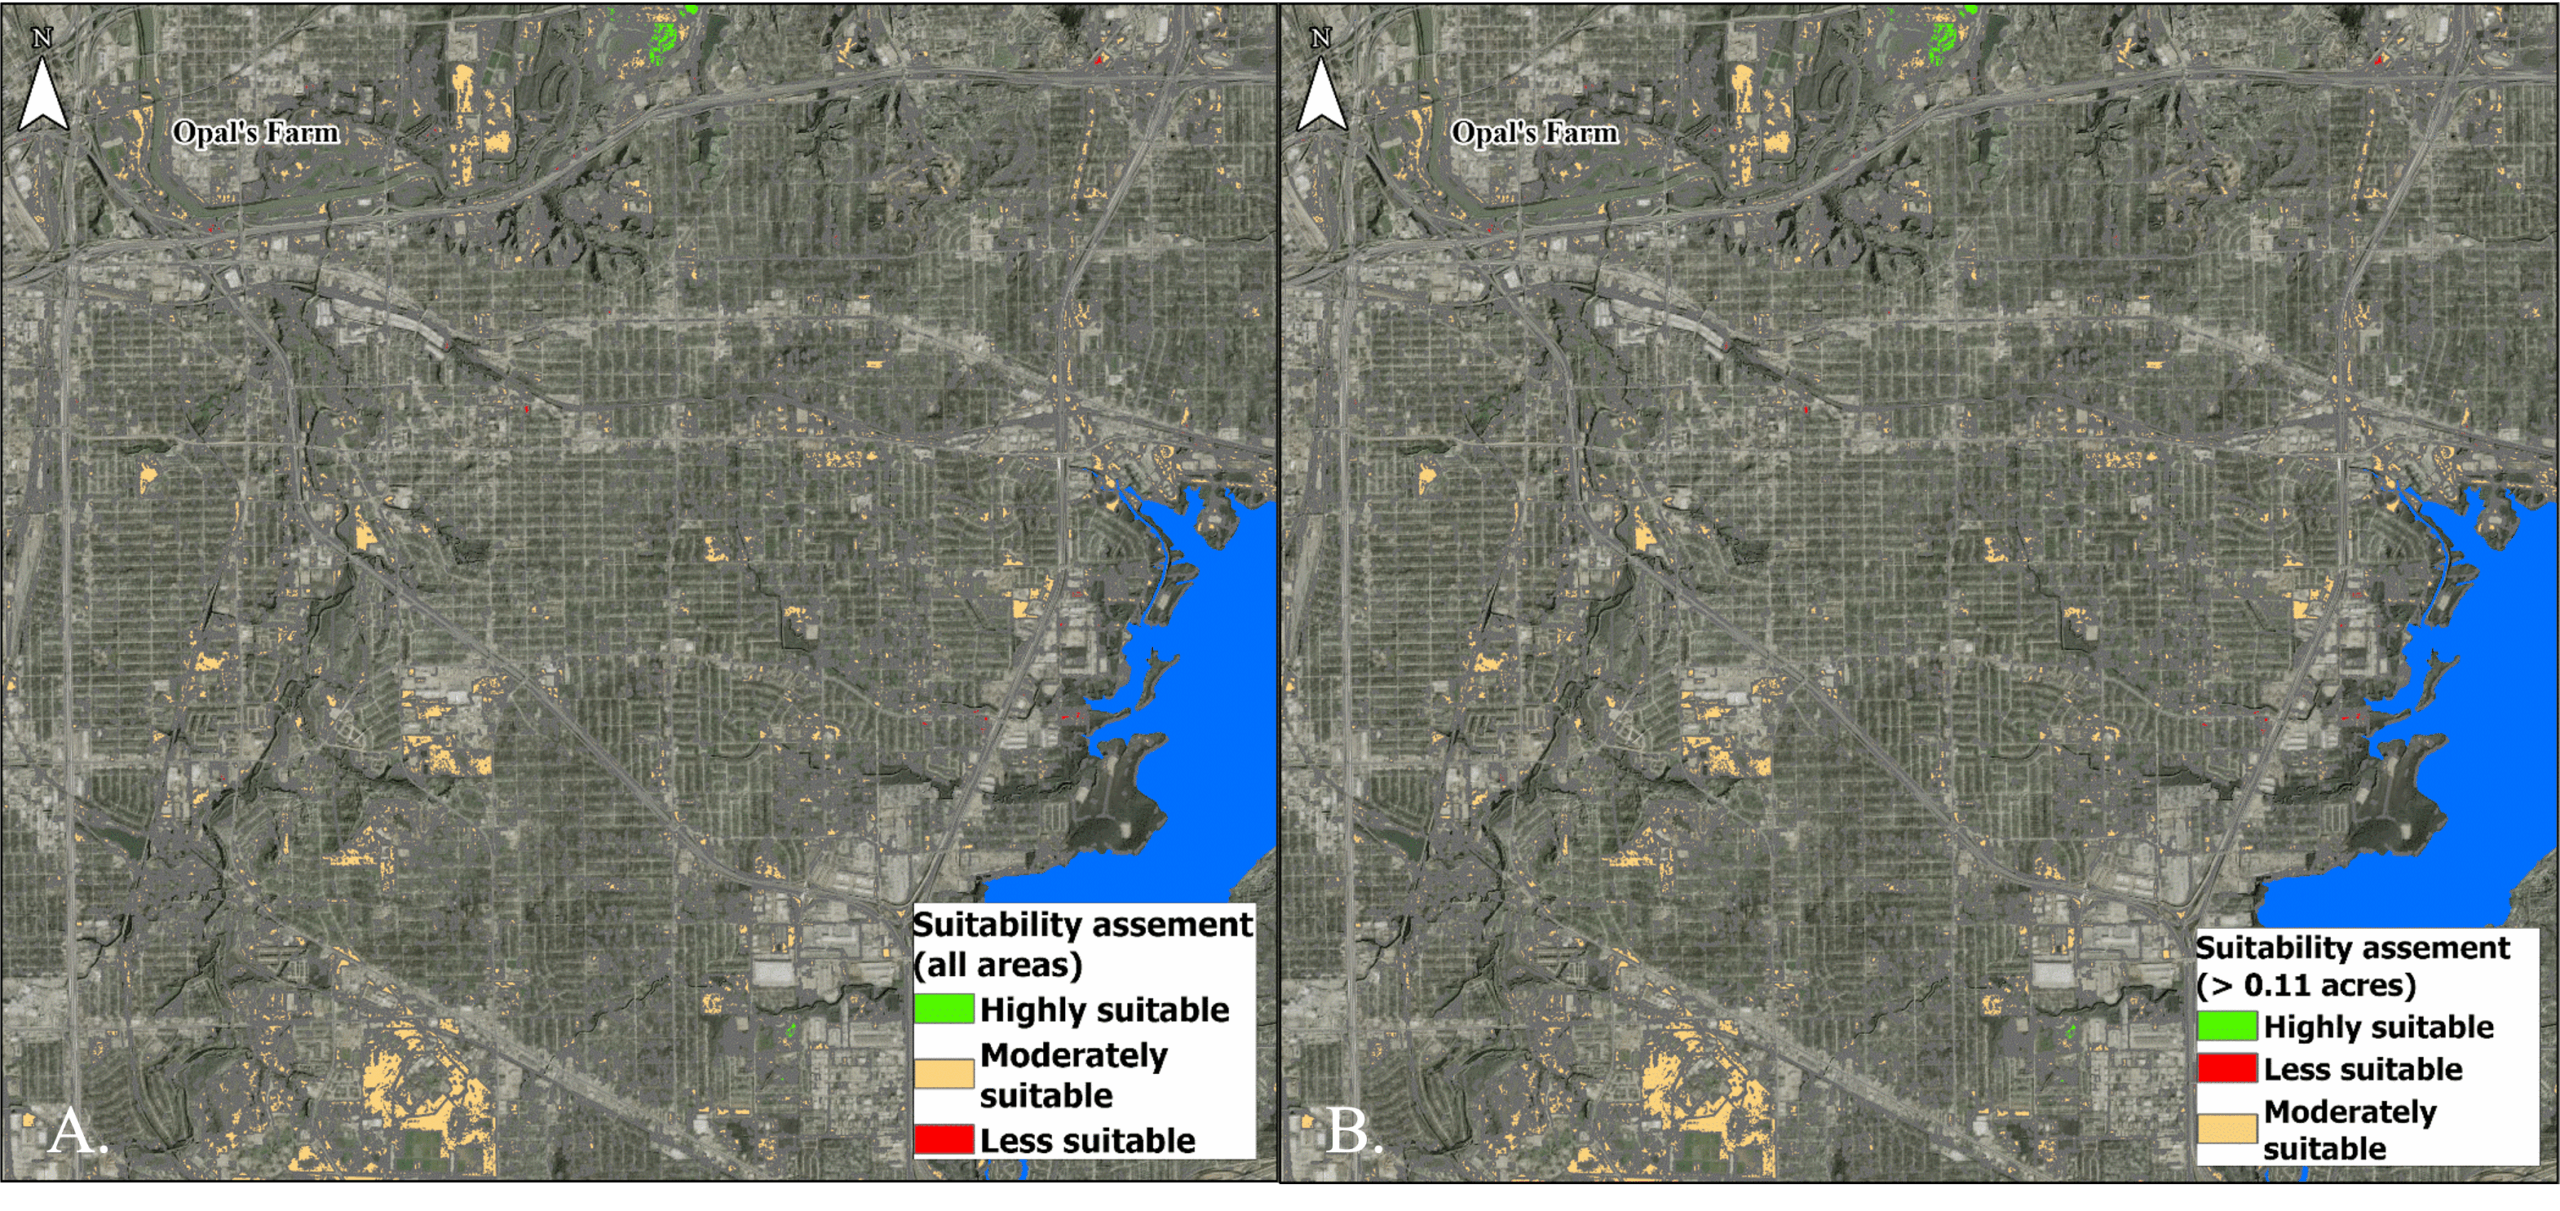
Taken together, these results provide a robust, data-driven foundation for future urban agriculture planning in southeast Fort Worth. They also demonstrate that, although a limited number of parcels meet ideal conditions, there exists a substantial area of moderately suitable land where targeted investment in infrastructure, soil improvement, and site consolidation could enable meaningful food production efforts. An interactive version of the suitability map is publicly accessible (with a free account sign up) here. Signup for the requisite free ArcGIS account can be complete here.
Objective 2: Evaluating food-waste compost with a legume cover crop as a low-cost, sustainable soil amendment for supporting tomato growth
During the 2023–2024 reporting cycle, project activities under Objective 2 shifted toward strengthening on-farm data quality due to the discontinuation of two partner sites. These sites were removed because of agronomic failures, inconsistent research compliance, and, in one case, a credible safety concern reported by project personnel. All discontinued partners were compensated, and the research design was consolidated to a single functioning site. Two new on-farm research plots were established in December 2023 to ensure adequate replication and continuity into the 2024 growing season.
Despite early setbacks, a full dataset was successfully generated at the remaining site, including tomato yield, monthly soil chemistry (pH, EC, %C, %H, %N, %S, C:N, C:S), and monthly drone-based NDVI to assess canopy vigor and spatial variability. The dataset provides early evidence regarding the benefits and limitations of food-waste compost and legume cover crops in small-scale urban farming systems. The data set used for soil chemical assessment and ANOVA/Tukey HSD analysis are provided here: Soil_Data_ANOVA_report_2024 TukeyHSD_Treatment_Plots1to3-report
1. Soil pH and Electrical Conductivity
Across the study, soil pH remained slightly above (0.16 - 0.21 pH units) the optimal range for Celebrity tomatoes (6.2 - 6.8), but consistent treatment differences emerged. Compost-only (COMP) treatments frequently produced small but statistically significant increases in pH (Figure 4). For example, in Plot 1, COMP had significantly higher pH than CC (p = 0.0028), CC+C (p = 0.0062), and NT (p = 0.0016). Similar patterns were observed in Plot 3, where COMP again had higher pH relative to CC (p = 0.0016). These shifts are consistent with food-waste compost containing base-forming cations that impart a mild liming effect.
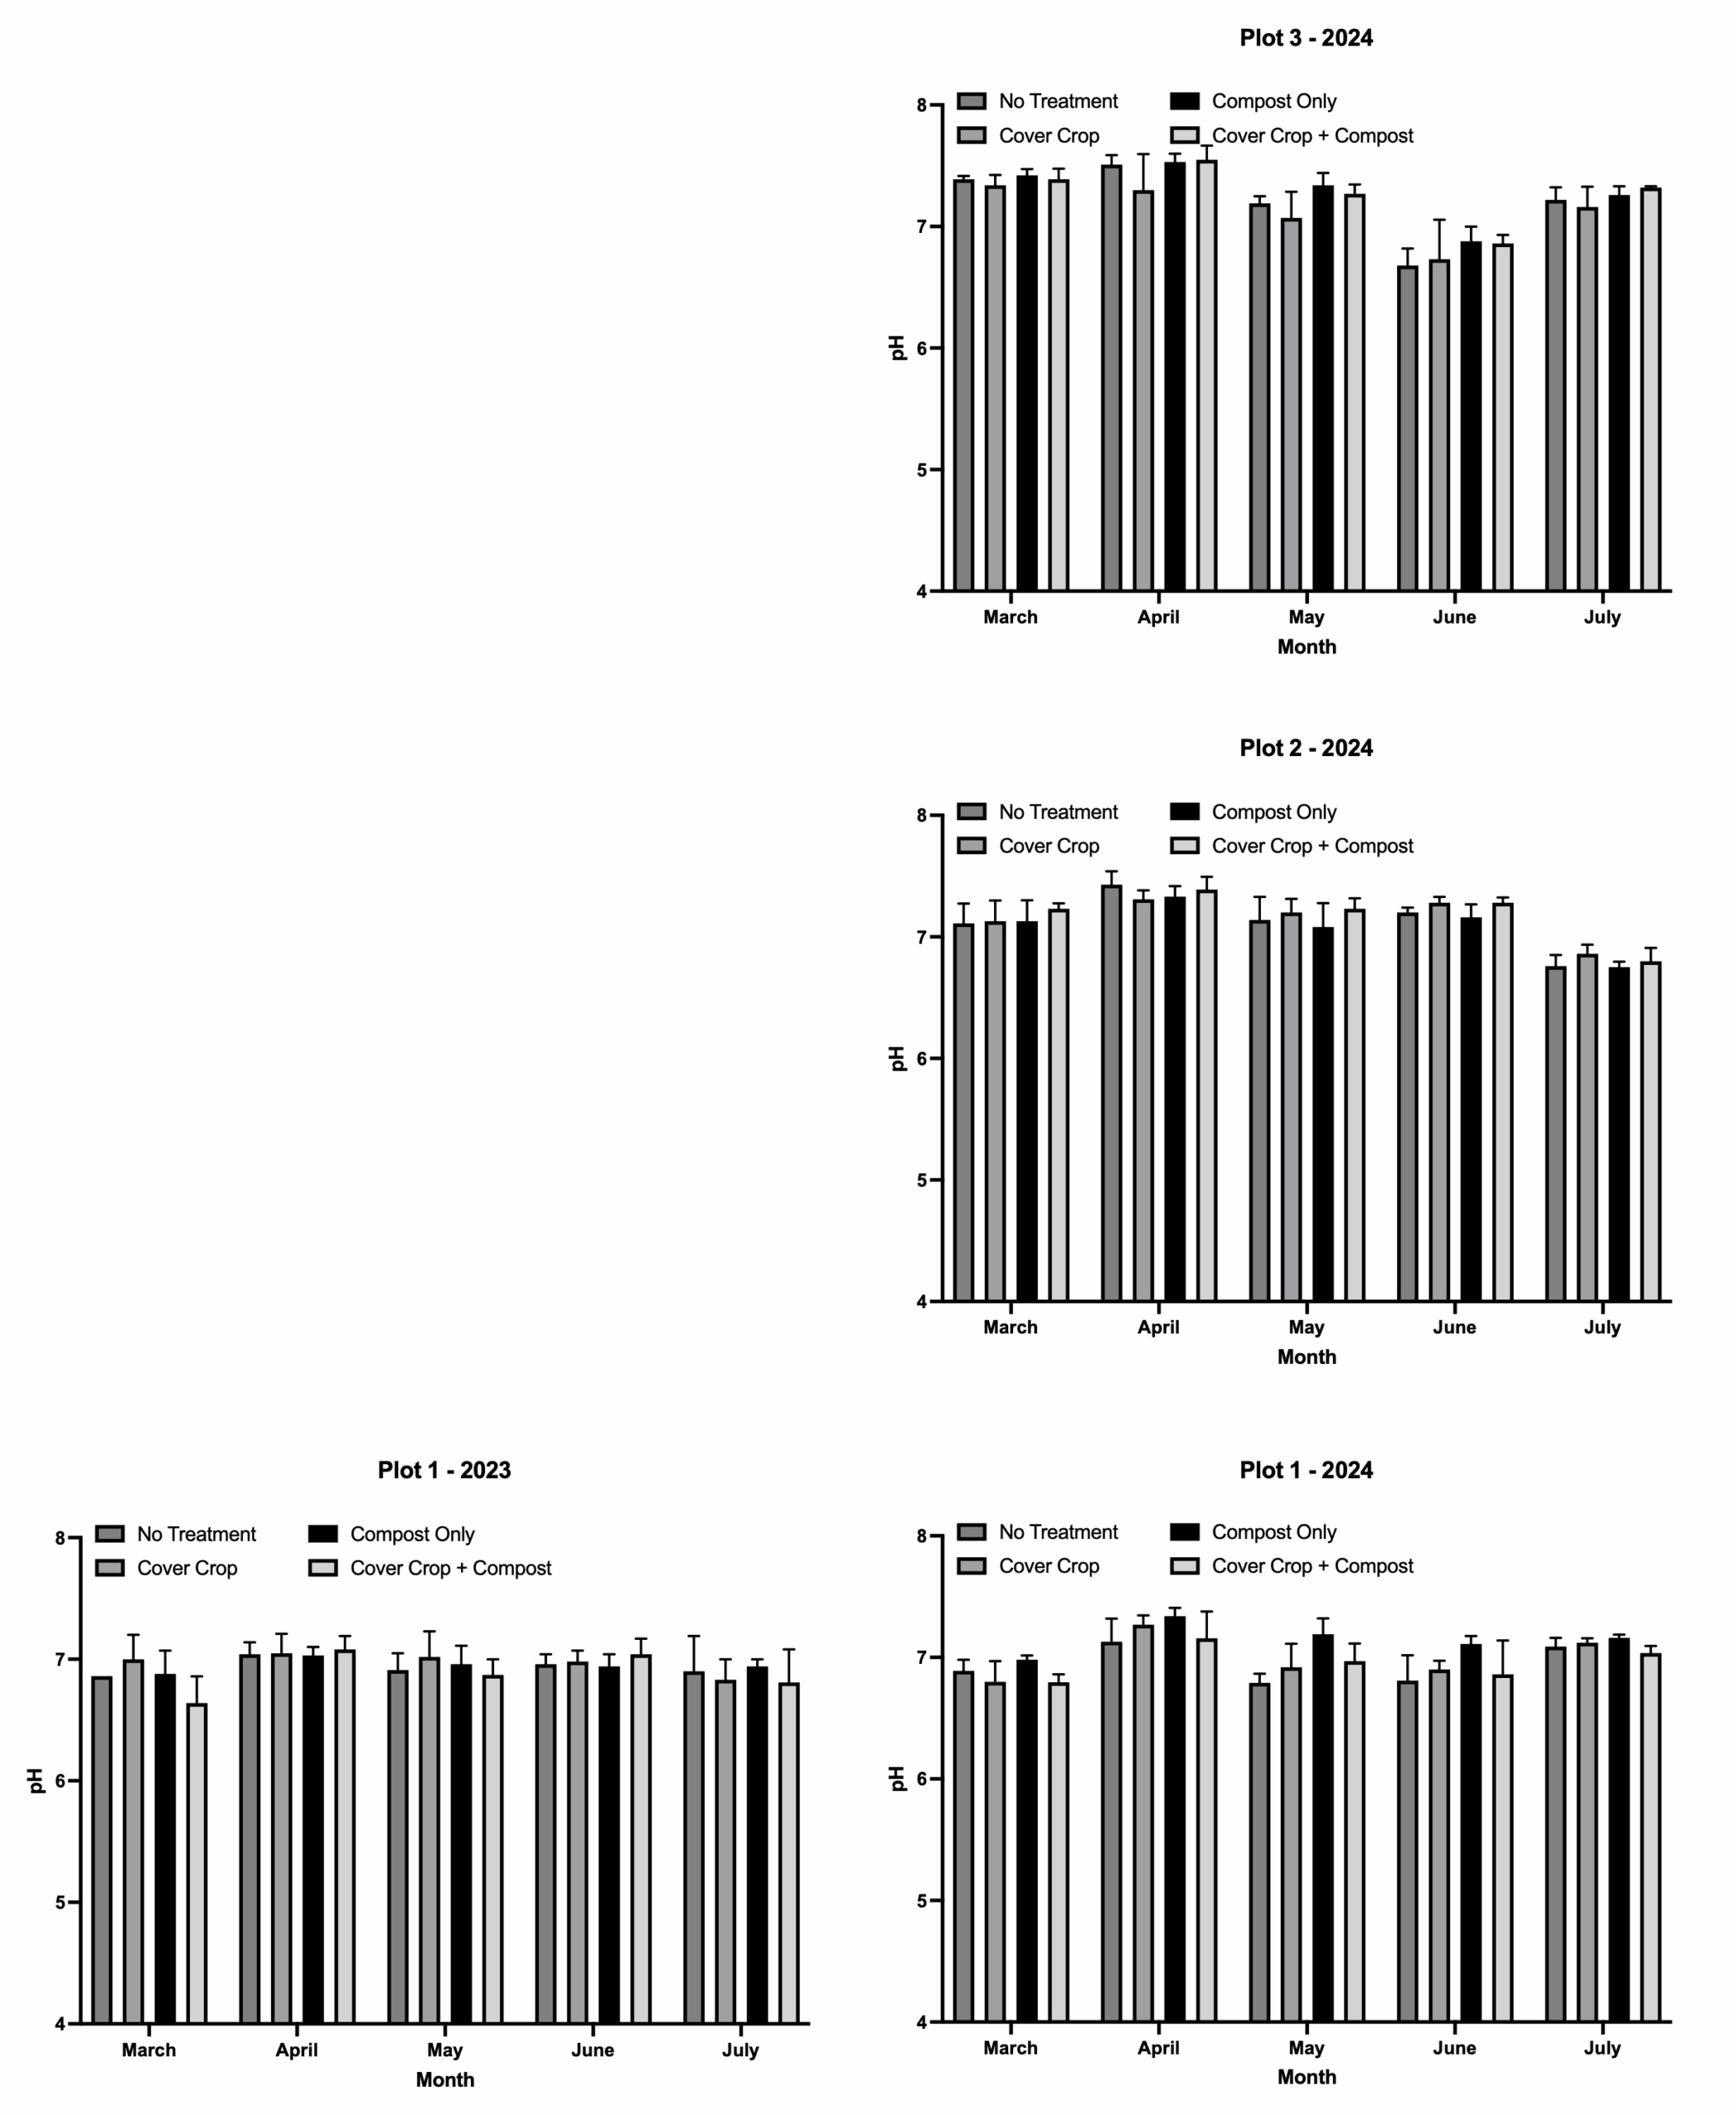
Electrical conductivity (EC) did not differ significantly among treatments in any plot (all Tukey p-adj > 0.05), indicating that compost additions did not cause salt accumulation during the study period, a key concern for urban growers using food-waste-derived materials.
2. Soil Carbon and Nitrogen Dynamics
Although treatment effects on soil chemistry were generally modest, several statistically significant differences emerged in organic carbon and nitrogen. In the double-dig Plot 3 where soil structure was improved through deep loosening, cover crop alone (CC) produced significantly higher %C than CC+C (p = 0.0245) and COMP (p = 0.0004). This suggests that in physically improved soils, legume cover crops may contribute more to short-term surface soil carbon than compost additions.
Soil nitrogen (%N) differences were concentrated in Plot 1, where COMP had significantly higher %N than CC (p = 0.0247), CC+C (p = 0.0013), and NT (p < 0.0001). This pattern aligns with the rapid mineralization of food-waste compost and demonstrates the potential of compost to supply short-term soil fertility benefits.
No significant differences were detected in %H, %S, C:N, or C:S in any plot, consistent with early-stage soil amendment research where multi-year observations are typically required to detect strong treatment effects.
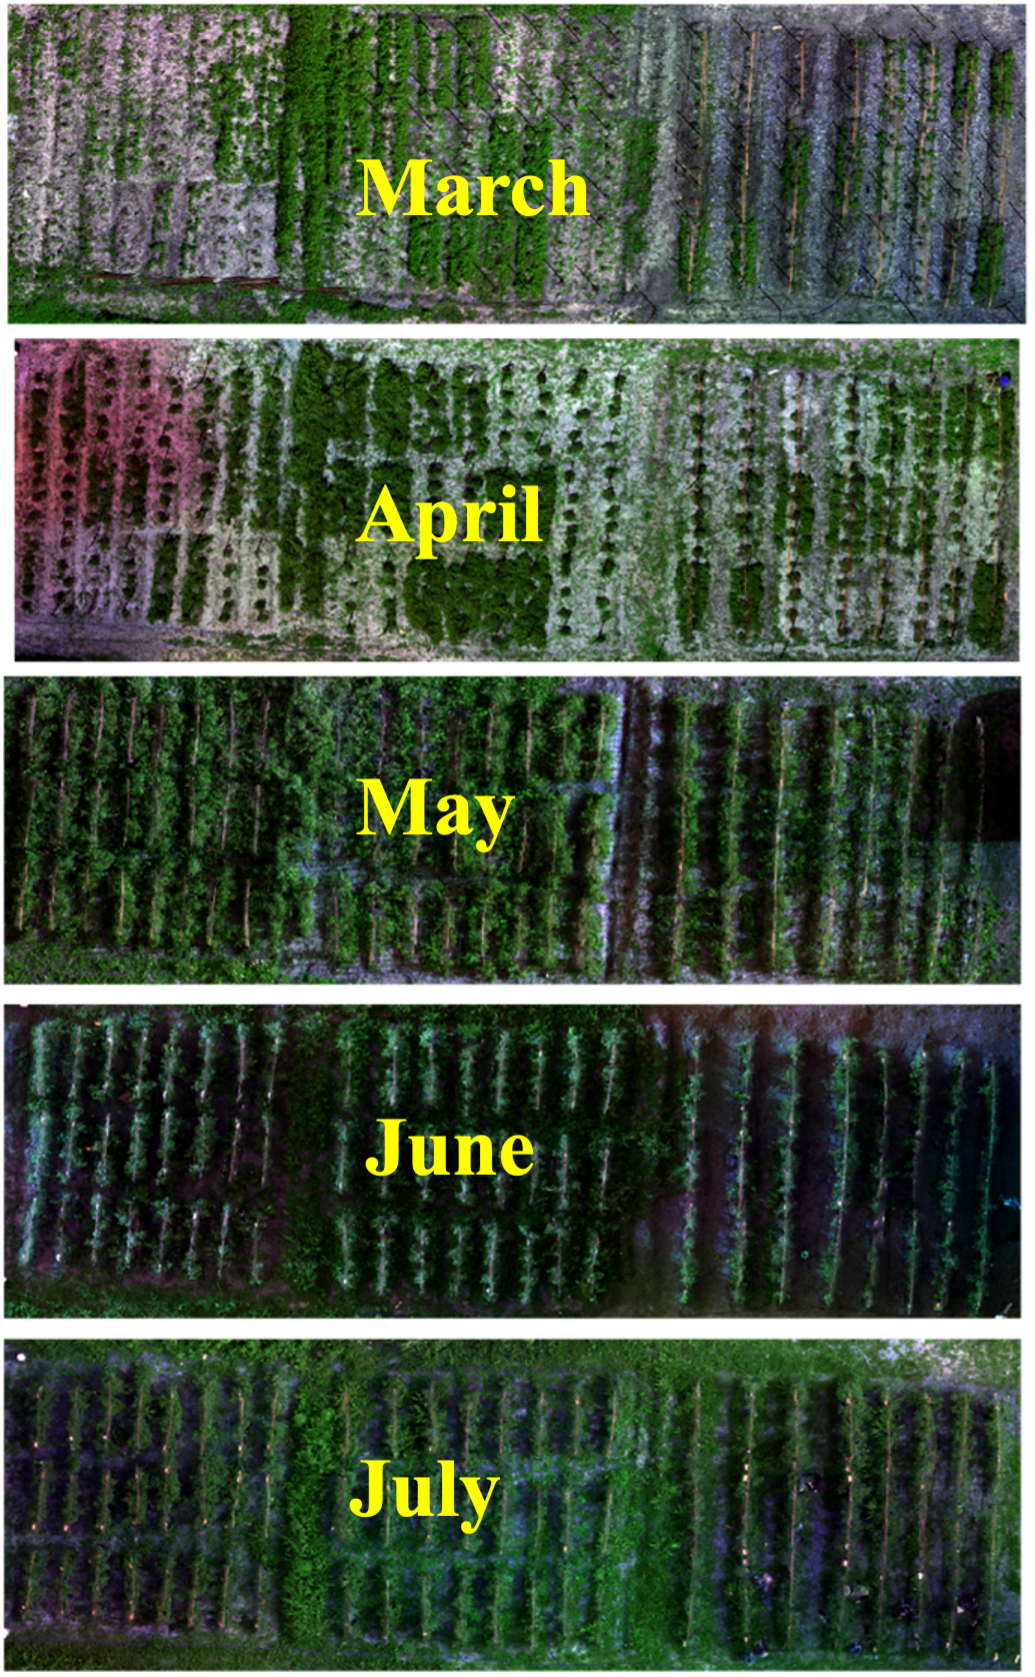
3. NDVI-Based Crop Health Assessment
Monthly NDVI data from drone imagery (Figure 5 and 6) provided a spatially explicit assessment of crop vigor across treatments. Across all plots, NDVI increased from March through May-June and declined by July due to heat, water stress, and tomato phenology (Figure 3). However, treatment-specific patterns were evident.
Conventional Tillage (Plot 1)
-
CC+C sustained the highest NDVI values through early- and mid-season, reflecting strong vegetative vigor.
-
CC exhibited consistently higher NDVI than NT early in the season.
-
COMP and NT declined gradually but remained within the “moderately healthy” NDVI range.
Conventional Tillage (Plot 2)
-
COMP exhibited the highest midseason NDVI, indicating improved soil fertility and water retention.
-
CC and CC+C supported above-average early-season NDVI compared to NT.
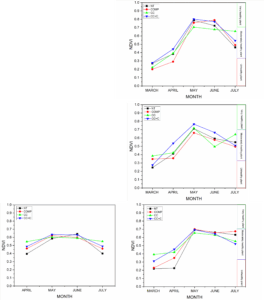
Figure 8. NDVI for Plot 1, 2 and 3 across treatment for 2023 and 2024 growing season. Treatments included cover crop (CC), compost (COMP), combined (CC + C), and no-treatment (NT) controls.
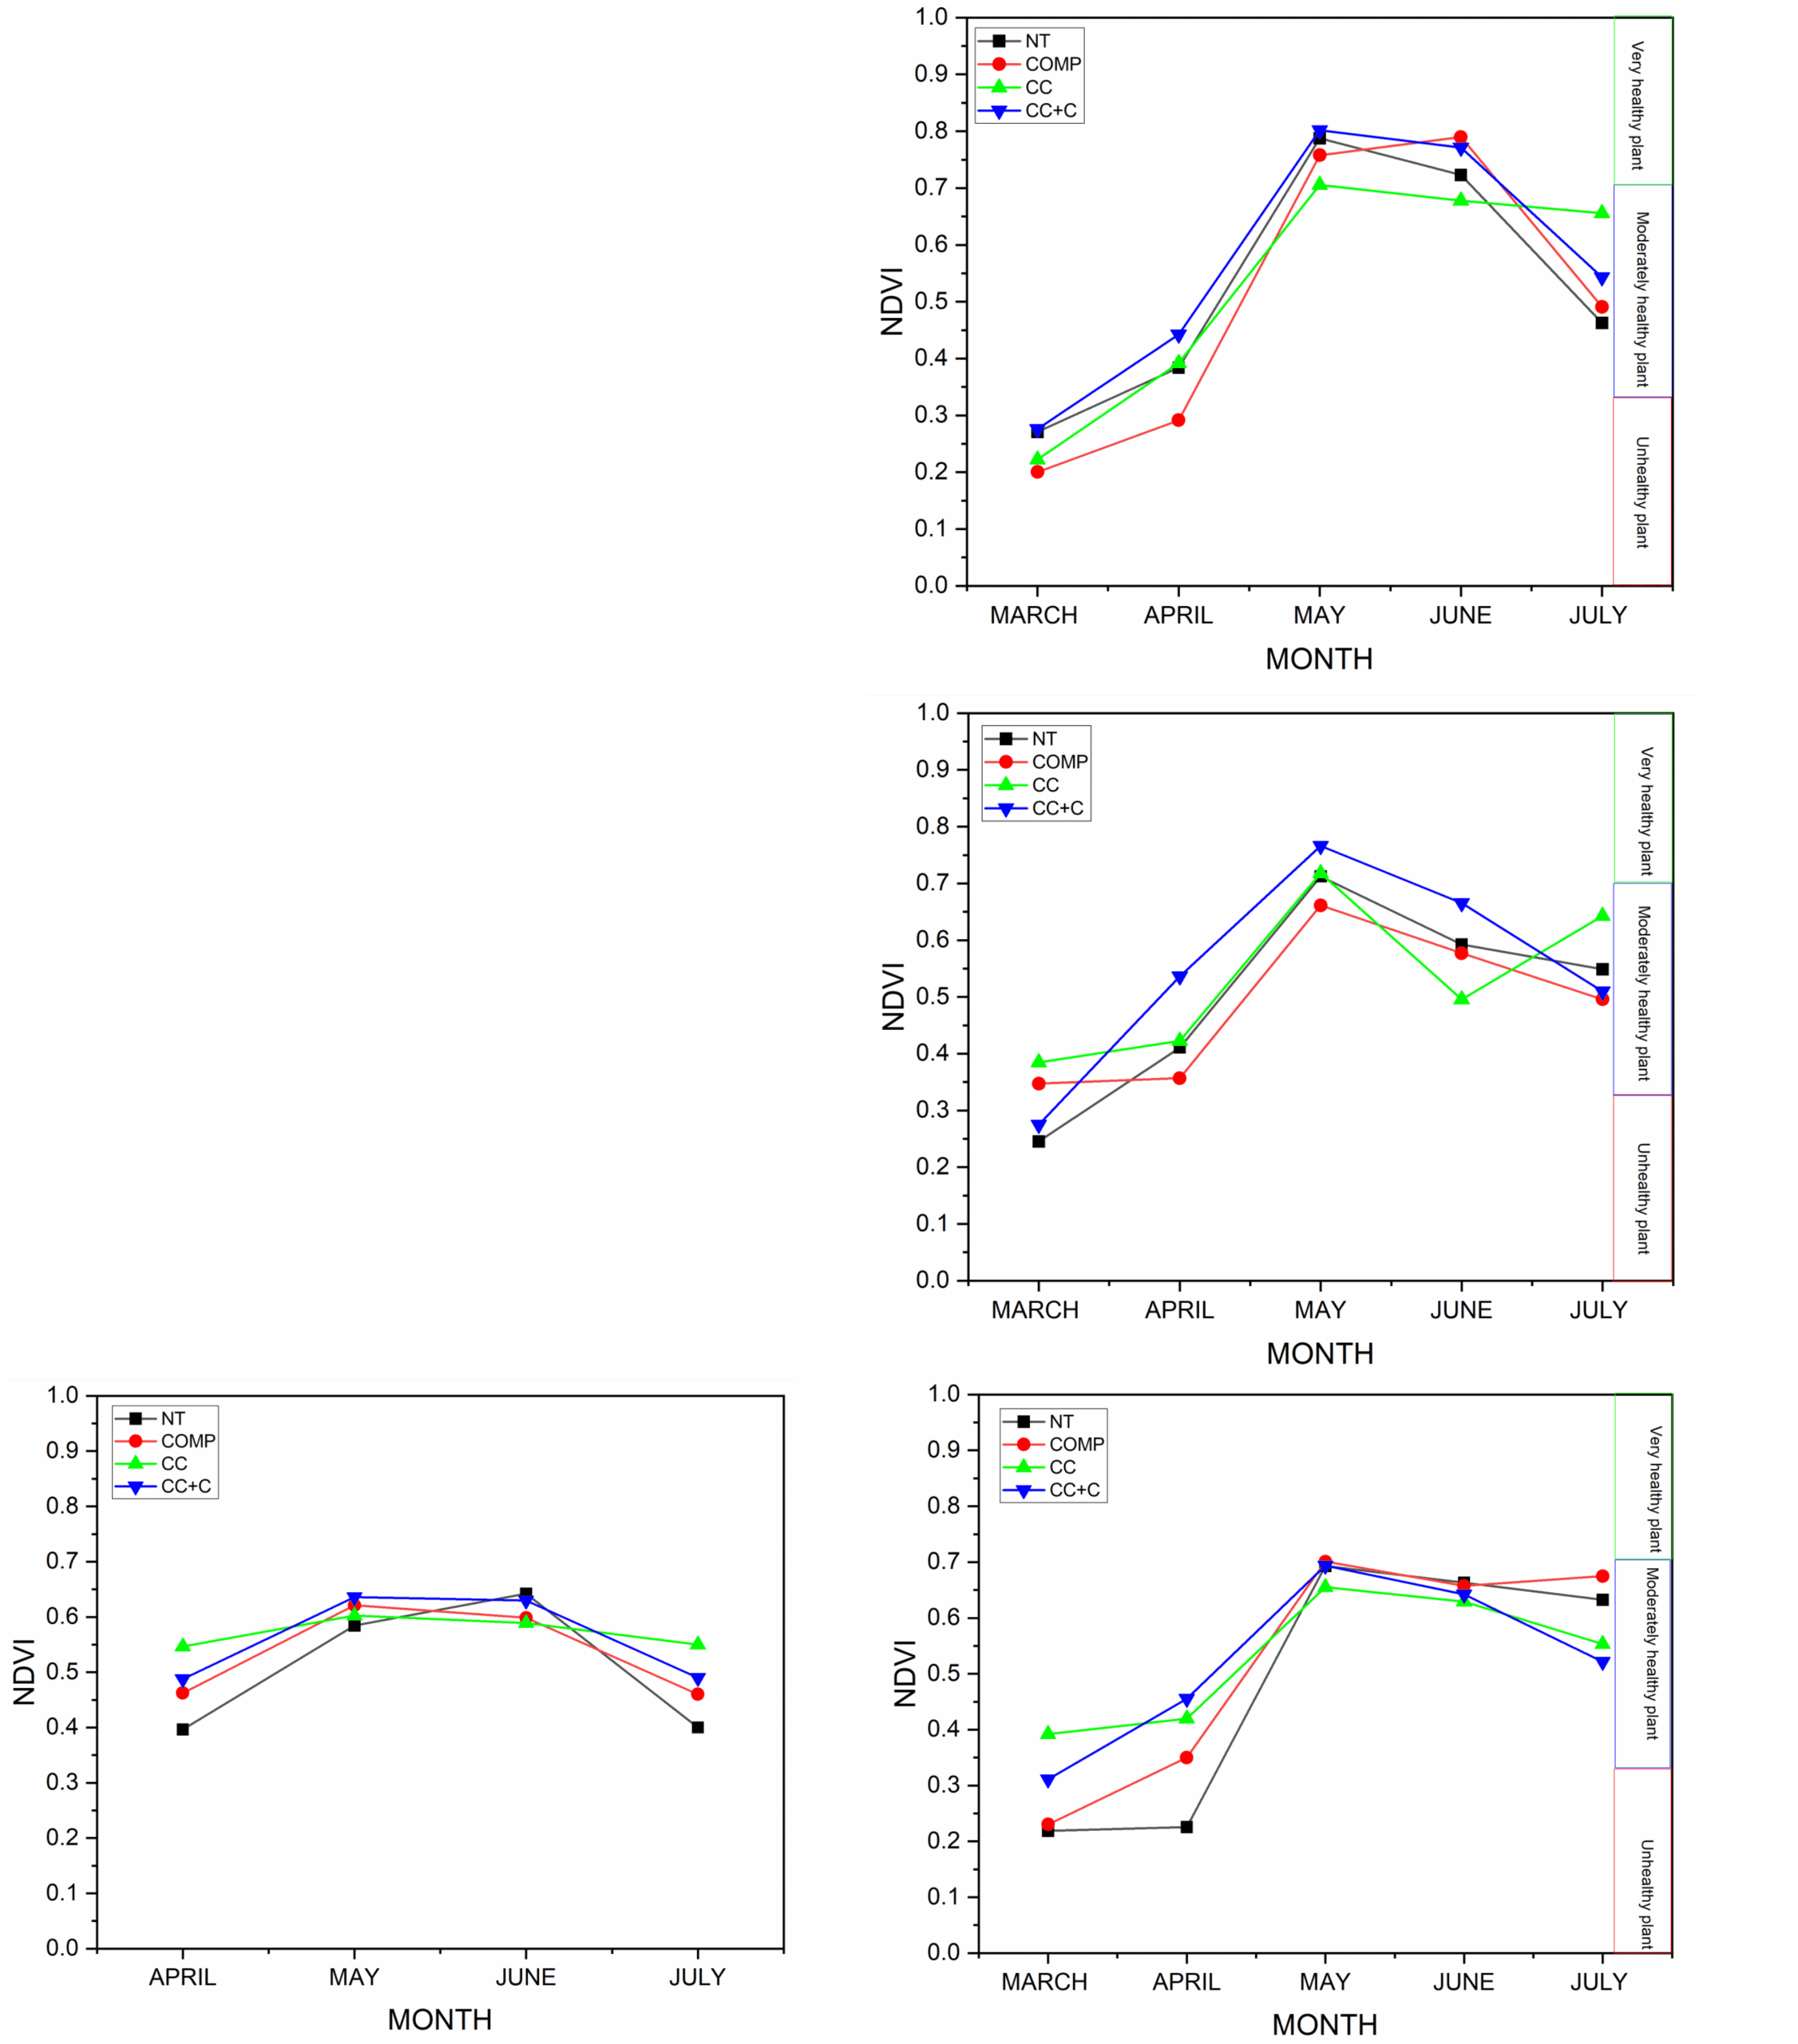
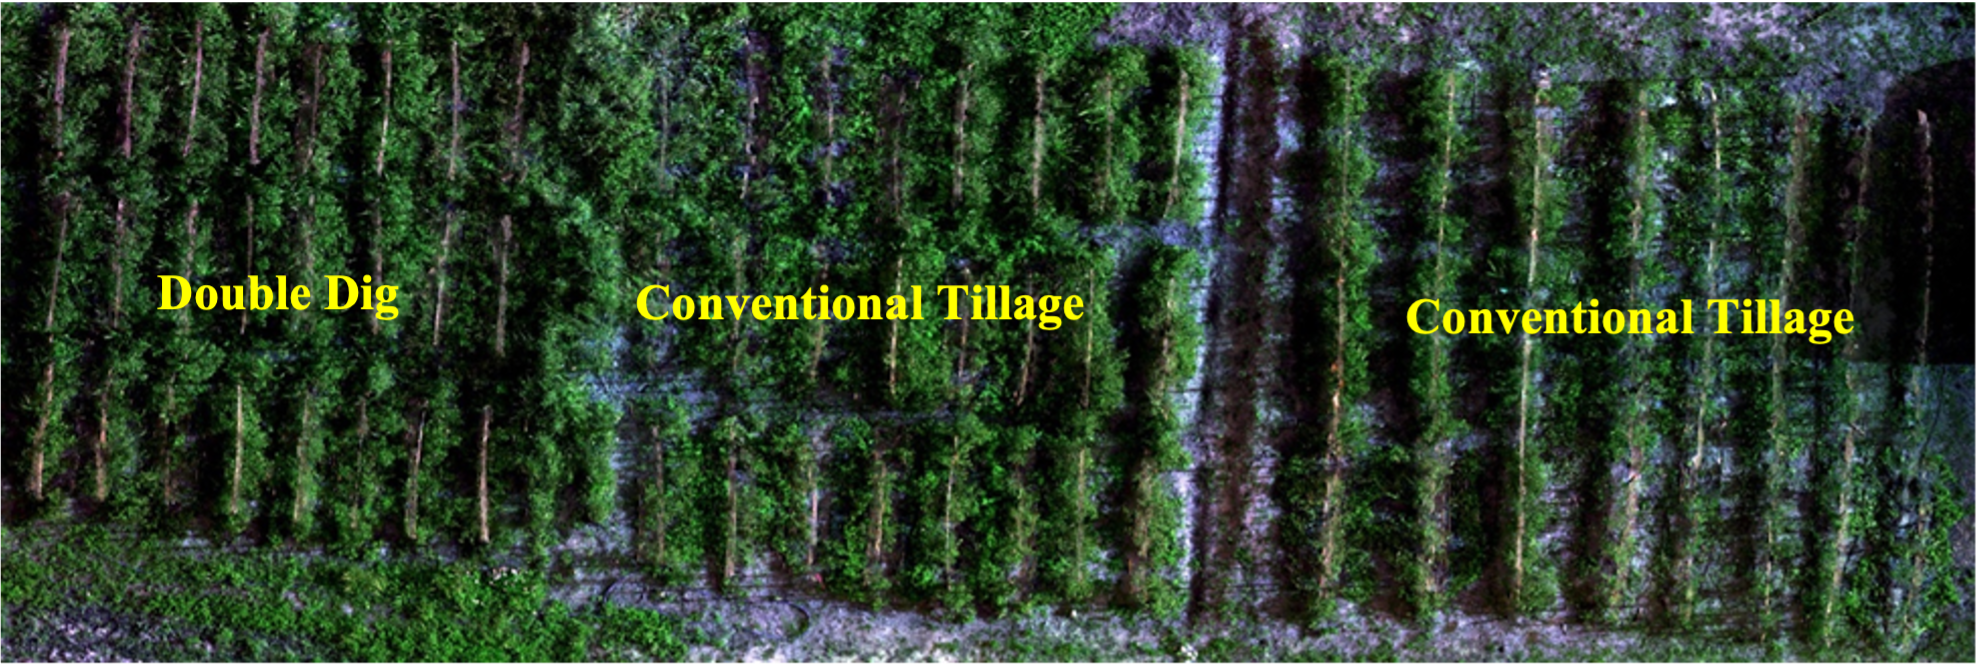
Double Dig (Plot 3)
-
All treatments displayed higher early-season NDVI than the conventionally tilled plots, reflecting the advantages of deep soil loosening.
-
COMP and CC+C maintained the highest NDVI levels in June, suggesting strong synergy between improved rooting conditions and organic inputs.
Soil-Plant Correlations
Correlation analyses across all plots showed:
-
Negative relationships between pH and NDVI, indicating reduced canopy vigor as soil pH increased beyond optimal tomato ranges.
-
Positive associations between soil carbon and NDVI, especially in the double-dig plot where CC increased %C.
These findings highlight the importance of balancing soil pH, organic carbon inputs, and physical soil structure to support crop vigor in urban soils.
Tomato Yield (2023 Season)
While treatment differences in fruit count and fruit weight were not statistically significant in Tukey post-hoc tests (all p-adj > 0.05), several practical patterns emerged:
-
Total yield ranged from 70,000 to 76,050 lb/ac, with the highest yield under COMP.
-
Fruit per plant increased from NT (41) → COMP (45) → CC (46) → CC+C (48), suggesting cover crops influence fruit number.
-
Average fruit weight was highest in NT and COMP (≈6 oz) and lowest in CC and CC+C (5.2–5.4 oz).
Together, these early patterns suggest that compost tends to improve fruit size and total yield, whereas cover crops increase fruit number. Combining both practices may balance these effects, although additional years of data are needed.
Across soil chemistry, NDVI, and yield data, the earliest and most consistent impacts were observed in:
-
pH and nitrogen (driven by compost inputs),
-
soil carbon accumulation (driven by cover crops, especially in deep-loosened soils),
-
canopy vigor (enhanced by combined compost + cover crop treatments),
-
root-zone improvement (enhanced by deep-digging).
These results indicate that food-waste compost and legume cover crops are accessible, low-cost strategies that can improve soil health and crop vigor in resource-limited urban farming environments. Importantly, the data also show that soil physical improvements (deep digging) amplify the benefits of biological amendments.
Objective 3: Evaluating the Feasibility of a 75:25 For-Profit : Non-Profit Sales Model
The soil amendment research under Objective 2 directly informs the project’s broader goal of strengthening sustainable urban agriculture systems in Southeast Fort Worth. While Objective 2 focused on biological and soil management strategies that increase crop productivity and ecological function, Objective 3 shifts the focus to the economic and social sustainability of small-scale urban farming, including how farmers interact with markets, consumers, and community needs. By combining soil-health research (Objective 2) with market and community analysis (Objective 3), the project provide insights into both the production and distribution challenges that urban farmers face - increasing the probability that technical improvements in soil management translate into meaningful economic and social benefits.
The goal of Objective 3 was to evaluate whether a 75:25 revenue model, where a portion of sales supports subsidized or low-cost produce for underserved communities, could function sustainably within the context of small and urban farms in Fort Worth. Using a mixed-methods approach that incorporated farmer interviews, customer surveys, regional farmers’-market assessments, and community conversations, the project examined feasibility from three essential perspectives: the community, the farmer, and the marketplace.
1. Community Perspectives on Food Access and Local Markets
Roundtable discussions and community conversations revealed significant structural barriers affecting food purchasing behavior in East and Southeast Fort Worth. Residents consistently identified lack of full-service grocery stores, limited transportation, and the high prevalence of fast-food and convenience stores as key obstacles to healthy eating. While some participants used food pantries or church-based programs, stigma, pride, and inconsistent quality limited widespread utilization.
Awareness and perception of farmers’ markets were low. Many residents perceived markets as expensive, culturally misaligned, or physically inaccessible, and most were unaware of the Cowtown Farmers Market. Although some residents expressed interest in purchasing directly from farmers, they also highlighted practical barriers such as hours of operation, limited product knowledge, and a lack of inclusive or welcoming market environments.
These findings suggest that for a subsidized 75:25 pricing model to be effective, farmers’ markets or farm stands must be situated closer to underserved neighborhoods, designed with cultural relevance in mind, and paired with active education and outreach strategies.
2. Farmer Needs, Constraints, and Opportunities
Farmer interviews highlighted the diversity of farm types operating in Fort Worth (from sole proprietorships to nonprofits and emerging social enterprises). Across these models, farmers reported several persistent challenges affecting profitability and their ability to implement subsidized pricing. These include that:
- Profit margins remain thin, particularly for startup farms facing land preparation, infrastructure, certification, and labor costs.
- Most farmers rely on supplemental income, grants, or value-added products to remain operational.
- Market participation requires significant time and resources, and prices often need to match grocery store prices to retain customers.
- Infrastructure gaps (particularly cold storage, wash/pack areas, and processing spaces) limit scalability.
- Labor shortages and limited local training resources remain major barriers.
- Climate stress and extreme weather events impact yields, consistency, and profitability.
While many farmers embrace sustainable practices (no-till, organic methods, regenerative agriculture), these practices require time and labor that can be difficult to sustain without adequate support. In this context, most farmers expressed limited capacity to adopt a 75:25 pricing model on their own, especially without external investment or a strong organizational mission centered on food justice.
3. Market Environment and Customer Insights
Customer survey findings from Cowtown Farmers Market reveal strong consumer motivations around quality, freshness, supporting local farmers, and market ambiance, with average importance ratings of 4.7–4.9 out of 5. Customers primarily purchase produce, baked goods, eggs, and dairy, and many attend weekly or twice monthly, indicating stable demand. However, customers who frequent Cowtown differ demographically and socioeconomically from residents in underserved East and Southeast Fort Worth communities. Most Cowtown shoppers are women, middle-aged, and from smaller households, with many paying by card or cash rather than SNAP/WIC. These characteristics signal that existing regional farmers’ markets may not currently reach the populations most in need of subsidized produce.
The assessment of 39 farmers’ markets across Dallas–Fort Worth further highlights variability in pricing, vendor composition, cultural relevance, payment options, and accessibility. While some markets offer SNAP/WIC and Double Up Food Bucks, many operate in higher-income neighborhoods or during hours misaligned with working families. For farmers evaluating market entry, the compiled data serve as a valuable decision-support tool.
4. Feasibility of the 75:25 Revenue Model
Across all data streams, the project found limited evidence that a 75:25 model would be broadly feasible for most farms. Profit margins, production variability, and operational expenses pose challenges to providing subsidized produce while maintaining farm viability. Furthermore, farmers differ widely in their missions, capacity, business structures, and community engagement goals. However, the model appears most feasible for farms operating under a nonprofit structure or a hybrid social-enterprise approach, particularly when aligned with an explicit mission to address food insecurity and when supported by external grants, donations, or volunteer networks. Opal’s Farm represents a strong proof-of-concept scenario:
- It is embedded within a nonprofit organization (Unity Unlimited).
- It operates with a clear food-justice mission.
- It benefits from city land-use agreements, community partnerships, and strong branding.
- Its tiered pricing model with donations (10%), discounted neighborhood sales (30%), and market/restaurant sales (60%) demonstrates how a mission-driven farm can balance operations with community impact.
Such a model, however, depends heavily on mission alignment, external support, and unique partnerships that are not replicable across all farms.
5. Summary of Key Findings
Overall, the evaluation of the 75:25 for-profit : non-profit sales model revealed that while community demand for fresh, locally grown produce is strong, significant barriers (including limited grocery access, transportation challenges, and low awareness or mistrust of farmers’ markets) continue to shape purchasing behavior in underserved neighborhoods. Farmers in the region operate under a wide range of business structures, but most face thin profit margins, high startup and input costs, and ongoing labor shortages, making subsidized pricing difficult to sustain without external support. Likewise, although existing farmers’ markets attract committed customers, their locations, hours of operation, and inconsistent acceptance of SNAP/WIC benefits limit their reach among lower-income households. As a result, a universal 75:25 pricing model is not feasible for the majority of small or emerging farms. The model appears most viable within nonprofit or mission-driven farm structures that can leverage external funding, volunteers, and community partnerships to offset operational costs. Opal’s Farm provides a strong example of how tiered pricing can succeed when embedded within a food-justice mission and supported by institutional relationships. Looking forward, promising opportunities include the development of culturally tailored farmers’ markets, expanded SNAP/WIC matching, improved business and branding support for growers, and targeted investments in farm infrastructure and farmer training to strengthen the long-term feasibility of socially inclusive pricing models.
Educational & Outreach Activities
Participation summary:
Objective 4. Using the results from objectives 1, 2 and 3 to develop outreach and training material to support peer-to-peer and community-based training for sustainable urban crop production in resource-limited areas.
The original intent of Objective 4 was to synthesize findings from Objectives 1–3 into a stand-alone urban farming toolkit to support peer-to-peer and community-based training. However, during the project period, two project Co-PIs published a comprehensive, community-ready Urban Farming Manual through Healthy Tarrant County Collaboration (HTTC), which effectively meets the needs of local growers, churches, and community organizations. Given that this high-quality resource was already publicly available (https://healthytarrant.org/httc-publishes-an-urban-farming-manual/), the PI strategically shifted the project's outreach focus toward youth education, agricultural workforce development, and early engagement with food-system careers—an area of strong community need and fully aligned with SARE’s mission to support future farmers and agricultural leaders.
Youth Engagement and Experiential Learning (2023–2025)
Across Summer 2023 and Summer 2024, the project directly engaged 13 middle-school and high-school students in structured, experiential learning that combined agricultural production, soil science, and food-system education.
Middle School Engagement (Summer 2023)
The project supported 11 middle school students, introducing them to fundamental agricultural practices and food marketing through hands-on experiences at one of the partnering farms. Students participated in planting, weeding, harvesting, composting, and basic marketing strategies for locally grown produce. These sessions emphasized sustainability, soil stewardship, and the importance of local food systems, helping students understand the connections between food production, nutrition, and community well-being.
High School Internships (Summers 2023 & 2024)
High-school engagement focused on career development and STEM skill-building:
-
Summer 2023:
Two high-school student intern trained directly with two participating farms, learning vegetable production, compost integration, irrigation basics, and farm-scale problem-solving.
-
Summer 2024:
Two high-school students served as Agricultural Research Assistants in the PI’s laboratory. Their training integrated:
-
Soil sample preparation and laboratory techniques
-
pH, EC, and elemental analysis
-
Basic statistics and exploratory data analysis
-
NDVI interpretation from drone imagery
-
Data organization and project documentation
-
Translating research findings into outreach materials
Both students contributed to research activities that supported ongoing project goals and completed scientific posters.
-
Student Research Dissemination and Conference Participation
As part of SARE’s emphasis on cultivating future agricultural leaders, the project supported research presentation and scientific communication training:
-
Two high-school students and two graduate assistants presented posters at the Southern SARE–sponsored SPI (Sustainable Practices & Innovations) Conference at Texas State University in 2025.
-
Posters covered topics related to soil health, compost and cover-crop performance, and remote sensing of tomato production.
-
Students gained experience in scientific communication, poster development, and professional networking within the sustainable agriculture community.
This effort significantly expanded students’ exposure to agricultural research careers and strengthened the pipeline of young scholars entering food-system and environmental fields.
Community Impact and Alignment with SARE Goals
Although the original toolkit development plan was revised, the project’s education and outreach efforts successfully:
-
Built early agricultural literacy among middle school youth.
-
Developed research and analytical skills among high school students, preparing them for college-level STEM pathways.
-
Strengthened the regional pipeline for emerging farmers, agricultural scientists, and conservation practitioners.
-
Expanded awareness of sustainable practices through direct engagement with partnering farms and the PI’s laboratory.
-
Leveraged an existing high-quality toolkit rather than duplicating efforts, ensuring efficient use of SARE resources.
These outcomes directly support Southern SARE’s investment in capacity building, youth education, and community-based pathways into sustainable agriculture, while ensuring that project outputs were responsive to real community needs and existing resources.
Learning Outcomes
Water management