Final report for ONC18-044
Project Information
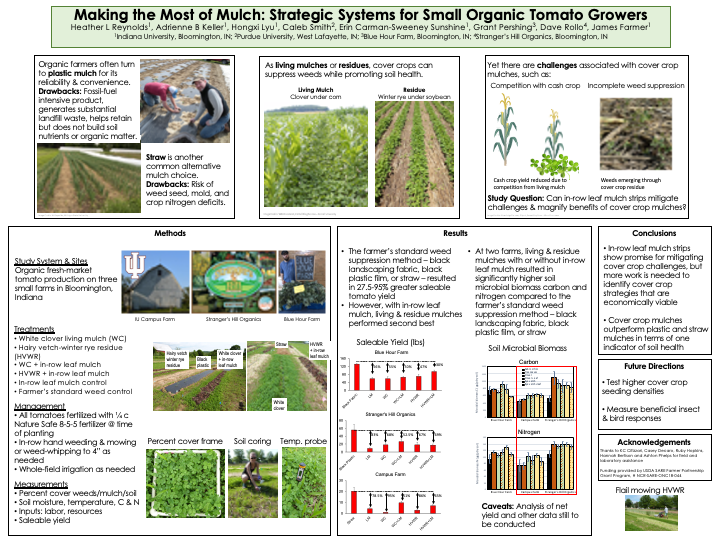
Organic mulches can suppress weeds while promoting soil health and carbon storage among other benefits. Mulches created from nitrogen-fixing cover crops, such as white clover and hairy vetch, are particularly attractive for nitrogen-demanding crops such as tomato. Yet reliability and convenience often turn farmers to plastic mulch, a fossil-fuel intensive product that generates substantial landfill waste and helps retain but does not build soil nutrients or organic matter. Straw is another common mulch choice, but can contain weed seed, promote mold, and lead to crop nitrogen deficits.
To increase their viability for small, organic farmers, cover crop mulches must be optimized for organic contexts, where herbicide is not an option for controlling either incomplete weed suppression or competition from living cover crops. We worked with farmers to test combinations of cover crops (living white clover or residue of winter rye-hairy vetch) and leaf mulch against plastic and straw mulches for organic fresh-market tomato production on three Indiana small farms. Farmers were interviewed before and after the research to explore their attitudes about and understanding of cover crops.
We found that although leaf mulch strips did improve cover crop performance, plastic or straw mulches still outperformed cover crops in terms of weed suppression and tomato yield. Results suggest that over time, cover crop mulches may promote greater soil health and carbon storage compared with plastic and straw mulches. Our results warrant follow-up research to test these cover crop strategies against different weed backgrounds. Cover crop mulches with leaf mulch strips may suppress weeds more effectively once farmers have worked to reduce the overall weed seed bank in the soil. Farmers appreciated that engaging in formal research experiments with professional researchers presented opportunities to learn about new, innovative production systems. We observed that our research led to increased interest in and use of cover crops on two of the farms. And while farmers acknowledged that it can be challenging to juggle research with production goals, there is interest in engaging in follow up research.
- Establish replicated mulch treatments and controls at three partner farms
- Collect and analyze soil, cover crop, weed, labor and crop data to assess optimal mulching strategies
- Share project rationale, methods and results with farmers and agricultural professionals via a video, extension-style technical report, IU Campus Farm webpage, Indiana Small Farms Conference poster presentation, and agronomic journal article
Cooperators
- (Researcher)
Research
Study Sites and Experimental Design
Study fields at each of 3 farms (Strangerʼs Hill Organics, SHO; Blue Hour Farm, BHF; and Indiana University’s Campus Farm, CF) were tilled to 4-inch depth in early October 2018. At BHF, raised beds were created after tilling.
Beds (2-4-ft x 22-ft) were laid out in a randomized block design at each farm, with corners of beds marked with survey flags color-coded for each treatment or control type. Treatments consisted of white clover living mulch (WC) or winter rye-hairy vetch residue (WRHV) with and without undecomposed leaf mulch (LM) applied in the central 12-inch planting strip. Controls consisted of leaf mulch by itself and the current standard practice at each farm (black plastic mulch at SHO, landscape fabric at BHF, straw at CF). Control methods were put in place just prior to planting beds in late May 2019.
Field Preparation
Leaf mulch was collected from the Indiana University campus in November 2018 and stockpiled at CF until application to plots. For beds receiving leaf mulch, an ~12-inch wide, six-inch deep layer of leaf mulch was applied down the center planting strip just prior to planting in late May 2019. To facilitate standardized application of leaf mulch, two guidelines running lengthwise down the planting strip were staked 12-inches apart, and nine four-gallon buckets of leaf mulch were distributed within each strip.
WC and WRHV cover crops were seeded into beds October 6-8, 2018 at seeding rates of 15 lbs/acre (WC) and 60/25 lbs/acre (WR/HV). Seed for each bed was mixed well with soil from the bed, hand broadcast, and raked in to 1/2-inch (WC) or 1.5-inch (WRHV) depth with an iron rake. Due to either winter kill (BHF and CF) or initial poor germination (SHO), white clover treatments were reseeded at all farms in mid-March 2019. Reseeding produced good cover by late April 2019 at all farms. Rye-vetch treatments established well at all farms from the single seeding in October 2018. An ~one-two inch thick rye-vetch residue was created by flail mowing in late May 2019.
Tomato planting and bed maintenance
Tomato seed was started in plug trays in early April 2019 for late-May transplanting to field plots. Each farmer started their own seedlings at each farm, using their chosen seed variety (Celebrity (F1) at CF and BHF, Mountain Fresh (F1) at SHO) and 32-cell trays filled with a soil mix made from OMRI-certified perlite, coarse vermiculite, peat moss, potting soil, bone meal and blood meal.
Tomato seedlings were planted into treatment and control beds in late May 2019. Before planting, drip tape was laid down along the center of the planting strip and, for white clover plots lacking leaf mulch strips, a six-inch width within the planting strip was wheel-hoed to remove white clover cover. Ten seedlings per bed were planted at CF and SHO. Due to limited seedling establishment, nine seedlings per bed were planted at BHF. Within the planting row, seedlings were spaced two-feet apart. Planting holes were made using a stainless-steel dibble. A one-time application of 1/4 cup of OMRI-certified Nature-Safe 8-5-5 fertilizer was made to each planting hole before dropping in the seedling plug. At CF, tomatoes were stunted due to poor soil conditions, and an application of foliar fish emulsion was made to tomatoes weekly starting in early July 2019. Tomatoes at all farms were irrigated to soil saturation at time of planting and whenever farmers deemed necessary due to dry conditions. Irrigation was done on a whole-field basis.
Beds were maintained by in-row hand weeding (all farms) and mowing (CF, SHO) or weed whipping (BHF raised beds) to four-inch height as needed. Maintenance inputs (time, gas) were recorded on data sheets for later conversion to dollar amounts. Tomatoes were trellised starting in early June 2019, using four hardwood stakes evenly spaced along the planting strip and strung with baling twine.
Relatively minor insect herbivory and little to no disease was observed at any of the three farms. Little to no mammalian herbivory was observed at CF or BHF. Mammalian herbivores were a challenge at Stranger’s Hill Organics, the most rural site. Seedlings were bent and sometimes pulled from planting holes within a few days after planting, resulting in one-three tomato plants missing from just over half of the beds by the end of June 2019. Furthermore, obvious deer predation (heavily browsed stems) occurred in just over one third of beds at the end of June 2019. OMRI-certified deer repellent (Messinas® Deer Stopper® Ready-to-Use Repellent Spray) was applied to tomato stakes and around the perimeter of the experimental area during the first three weeks of July 2019, until deer fencing was installed. The deer fencing was constructed from extra trellis stakes installed around the perimeter of the experimental area and strung with three rows of baling twine, creating an approximately five-foot high fence. Strips of white flagging were tied onto the twine at intervals. This low-cost fencing strategy was effective, and no further deer herbivory was observed.
Field Data Collection & Statistical Analyses
Percent cover of cover crops, weeds and litter/bare ground for all treatment and control beds were estimated from three, ~10-inch square quadrats evenly spaced along the length of each bed in late May 2019, prior to flail mowing the WRHV cover crop or applying leaf mulch strips or straw and plastic control mulches and planting tomatoes. As another measure of initial percent cover, percent of photosynthetically active radiation (PAR) was measured in each treatment and control bed in late May 2019, using a ~ three-foot long Decagon Sunfleck Ceptometer held across at ground level across the bed width at three evenly spaced points along the bed length. Percent cover was estimated using the same protocol for all treatment and control beds again in early July 2019, ~six weeks after flail mowing, applying leaf mulch, control mulches and planting the tomatoes.
Tomatoes were harvested from late July 2019 through late September 2019, once or twice weekly depending on yield. Harvesting did not start until mid-August 2019 at SHO, as tomato plants were set back due to the heavy herbivory experienced at that farm. All tomatoes were harvested that had any amount of red color developing. Both the total and saleable yield from each replicate bed were weighed to the nearest pound. Saleable yield varied slightly by farm. At CF, saleability criteria included no splitting, no end rot, and less than or equal to one blemish. At BHF and SHO, saleability was defined as no end rot and 30% or less blemishes. Net profit was calculated on a per tomato plant basis for controls versus treatments at each farm by subtracting the dollar cost of inputs (e.g., supplies, labor) from the dollar amount of sales.
Soil properties were measured three times over the duration of the study. Soil pH, total soil C and N, particulate organic matter and mineral-associated organic matter C and N, microbial biomass C and N, inorganic N and N mineralization rate were measured immediately prior to seeding cover crops in Fall 2018, at the time of tomato planting in late May 2019, and at the final harvest in early summer 2019. For each of these samplings, six PVC soil cores (5 cm diameter) evenly spaced throughout each bed were taken to 8-inch depth and combined into a Ziplock bag to create one bulked sample per bed. Soil samples were held on ice until transport to Indiana University’s Biology Department, where they were processed for soil pH, total soil C and N, particulate organic matter and mineral-associated organic matter C and N, microbial biomass C and N, inorganic N and N mineralization rate. For the second soil sampling (May 2019), only microbial biomass C and N, and inorganic N and N mineralization rates were analyzed, as these fast processes were most likely to change over the short term compared to soil pH and soil C and N stocks.
Soil bulk density was measured in June (CF) or July (BHF, SHO) 2021 in order to standardize the soil C and N variables described above to a grams of dry soil basis. At each site, four PVC soil cores (as above) were taken either along the perimeter of (CF) or in the original beds (SHO, BH). Soils were placed in pre-weighed Ziplock bags and transported to Indiana University’s Biology Department, where soils were sieved to 4 mm to remove large rocks and litter fragments and then subsampled for wet-dry soil mass conversion. Bulk density was measured as the proportion of dry soil mass (g) to soil volume (cm3).
Soil water and soil temperature were measured to ~two-inch depth at three points evenly spaced along the length of each bed in late May, late June and early August 2019, using a Dynamax SM150T soil moisture probe and an Escali digital kitchen thermometer.
To test for treatment effects on net profit and soil variables, we constructed mixed effects linear models using the nlme package in R Core Development Team (2020, R 4.0.3).
Farmer Interviews
Farmers at all three farms were interviewed October 2018 and 2019 to explore their pre- and post-project tomato growing practices, current and planned use of cover crops and mulches on their farm, sense of the environmental/economic/social benefits of cover crops and mulches, attitudes toward climate change, awareness and implementation of carbon farming, and sense of satisfaction with organic farming and weed management.
Treatment Effectivity
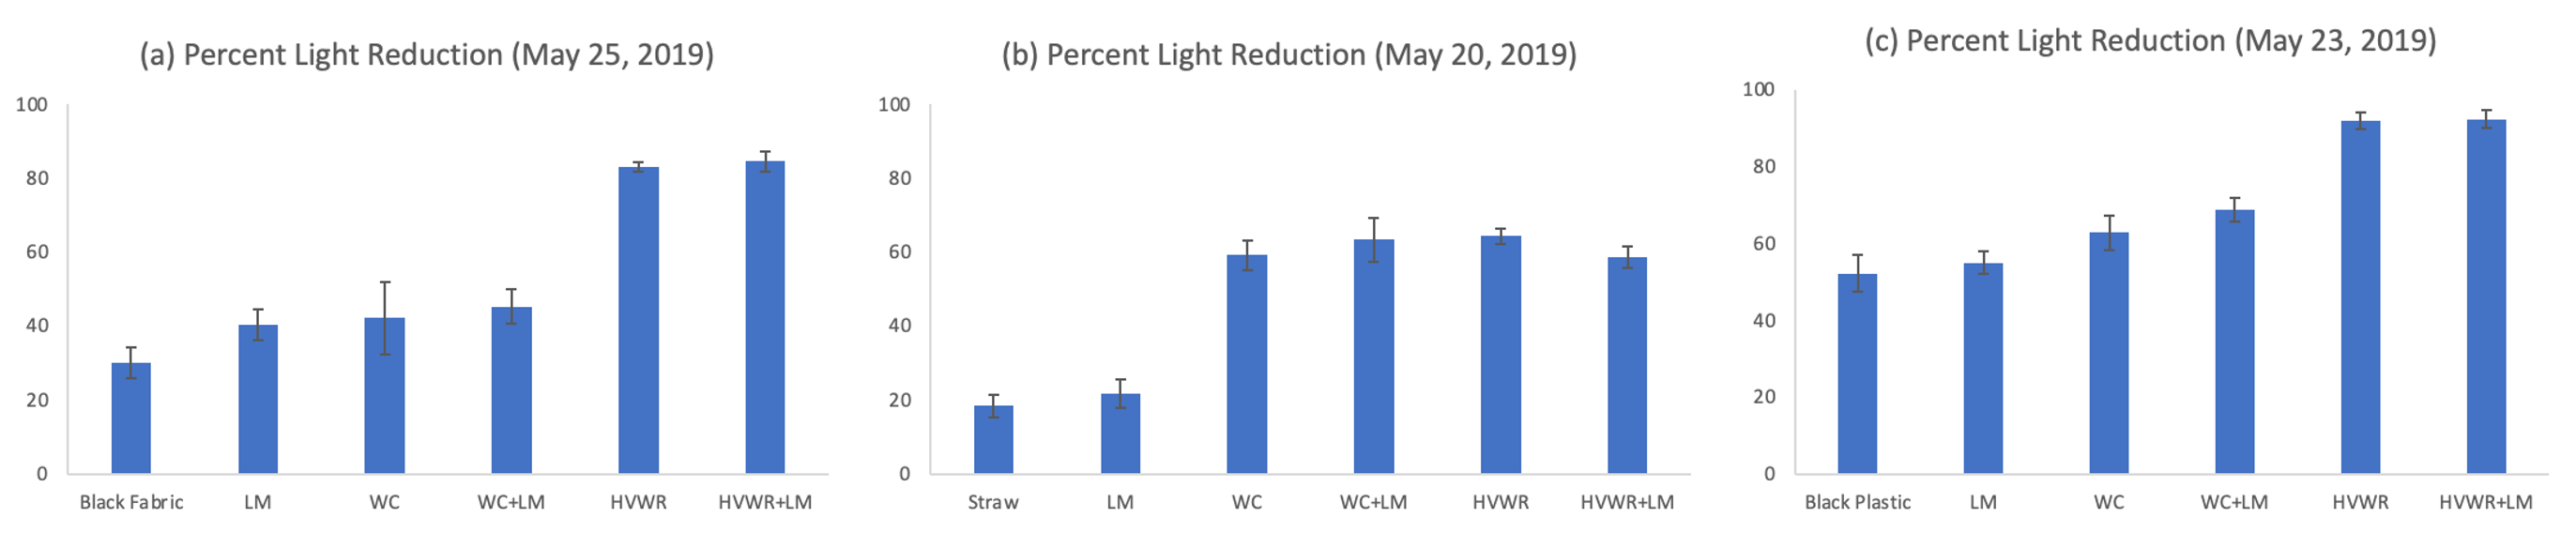
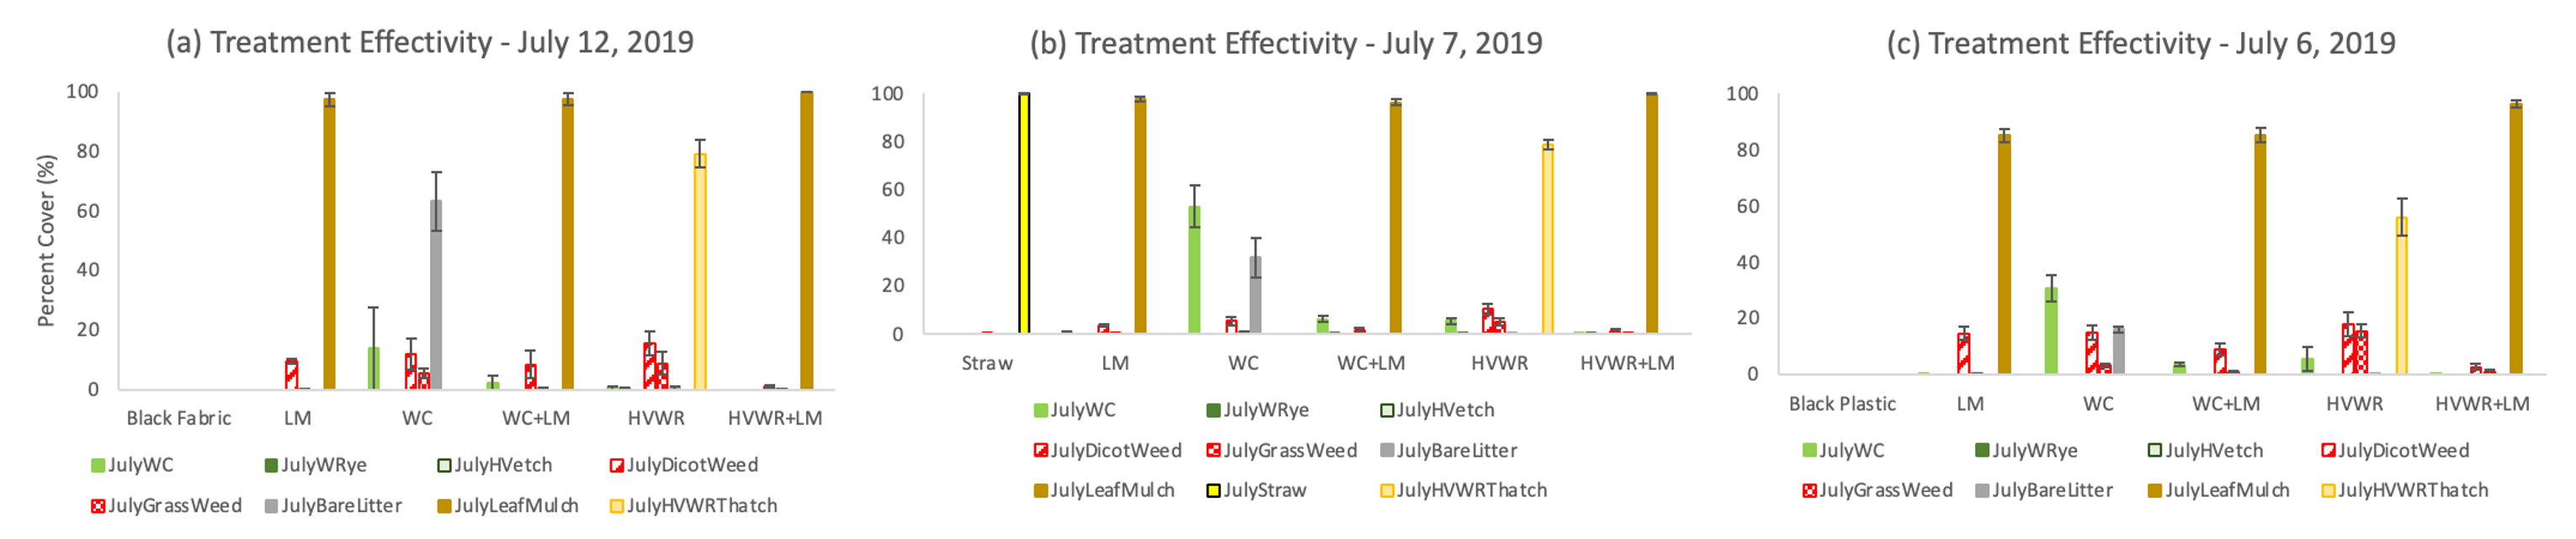
Percent cover and percent light data indicate that cover crops established reasonably well at all farms, except for white clover at SHO where initial cover was only 20-40% (Figures 1, 2). However, while straw and plastic mulch controls reduced broad-leaf and grass weeds to negligible levels, weeds ultimately emerged in all treatment beds, although less so in beds with in-row leaf mulch (Figure 3). Regular mowing was required in treatment beds to keep weeds suppressed.

Tomato Yield
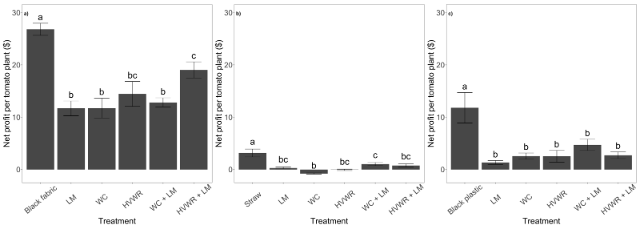
At all farms, the farmer’s standard weed suppression method (i.e., the controls: black fabric at BHF, straw at CF, black plastic at SHO) resulted in the greatest net profits. The farmer control treatment was 29%, 67%, and 60% more profitable than the next most profitable treatment at BHF, CF, and SHO, respectively. Among experimental treatments (i.e., excluding the farmer control), winter cover crops with leaf mulch were most profitable. Specifically, HVWR + LM had the highest net profit per surviving tomato plant among experimental treatments at BHF, whereas WC + LM was the most profitable experimental treatment at both CF and SHO. However, WC alone and LM alone tended to perform the worst across farms (Figure 4).
Soil Measurements
Baseline soil properties
Initial soil measurements indicate that BHF soils were ~ twice as rich in available nitrogen pools as soils at CF and SHO (Table 1). Soil pH was comparable at BHF and SHO, while CF had more acidic pH (Table 1).
|
|
Blue Hour Farm (BH) |
Campus Farm (CF) |
Stranger's Hill Organics (SHO) |
|||
|
Soil Variable |
Mean |
SE |
Mean |
SE |
Mean |
SE |
|
Inorganic N (NH4+NO3, lbs/acre) |
48.60 |
2.04 |
25.80 |
1.64 |
26.00 |
3.14 |
|
Net mineralization (lbs/acre/day) |
1.52 |
0.05 |
2.40 |
0.09 |
1.31 |
1.22 |
|
Net nitrification (lbs/acre/day) |
3.66 |
0.11 |
3.06 |
0.10 |
2.42 |
0.20 |
|
pH |
6.66 |
0.03 |
5.75 |
0.03 |
6.70 |
0.02 |
Treatment effects on soil health: carbon, nitrogen and pH
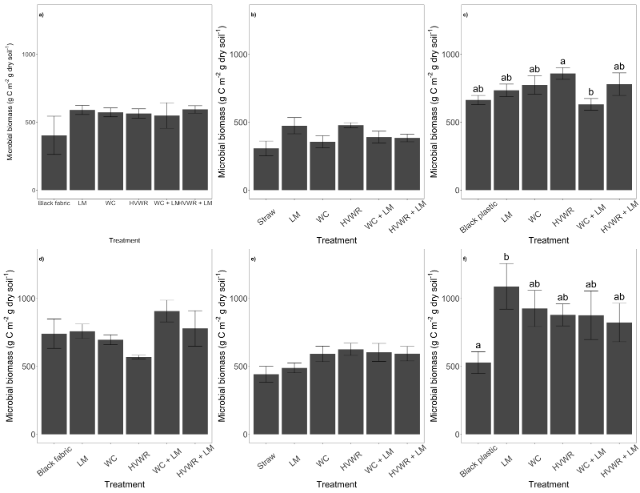
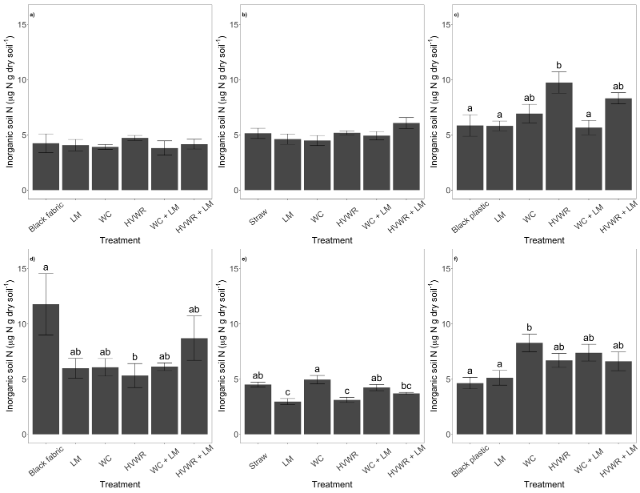
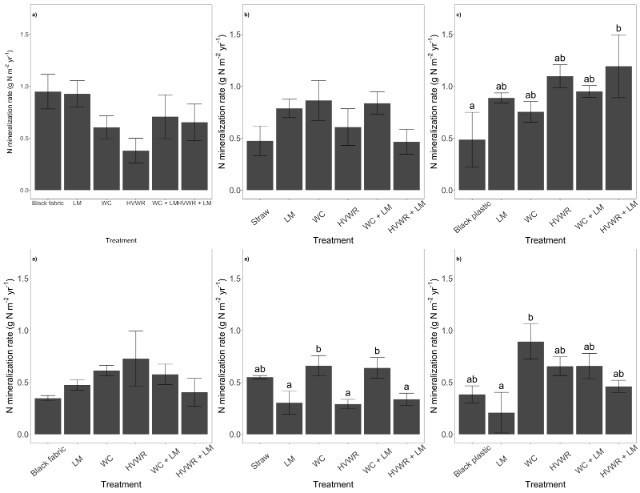
In contrast to the observed treatment effects on net profits, differences between control and experimental treatments were less predictable across farms for most metrics of soil health. There was evidence for greater microbial biomass C and N under alternative mulching practices compared to the farmer control, although the effects tended to be small and statistically insignificant. These alternative mulching effects were most pronounced at SHO, especially late in the growing season (Figure 5). Similarly, treatment effects on inorganic soil N pools early in the growing season were only statistically significant at SHO where HVWR plots had greater inorganic soil N compared to black plastic, LM, and WC + LM treatments (Figure 6a-c). However, late in the growing season, WC tended to promote greater inorganic soil N across farms compared to HVWR (Figure 6d-f). Likewise, late in the growing season, N mineralization rates tended to be highest in WC plots at both CF and SHO (Figure 7). There were no pairwise differences in soil pH (measured at the end of the growing season) among treatments at any farm.
Treatment effects on soil carbon storage
While there were few statistically significant treatment effects on soil C pools, total soil C and soil C fractions were consistently lowest in the farmer control plots across all farms. Meanwhile, LM and WC, either alone or in combination, tended to promote the greatest soil C pools. Over the course of the experiment, soil C pools in the farmer control plots either decreased or did not significantly change, while soil C did increase in some experimental treatments over time.
Treatment effects on soil water and temperature
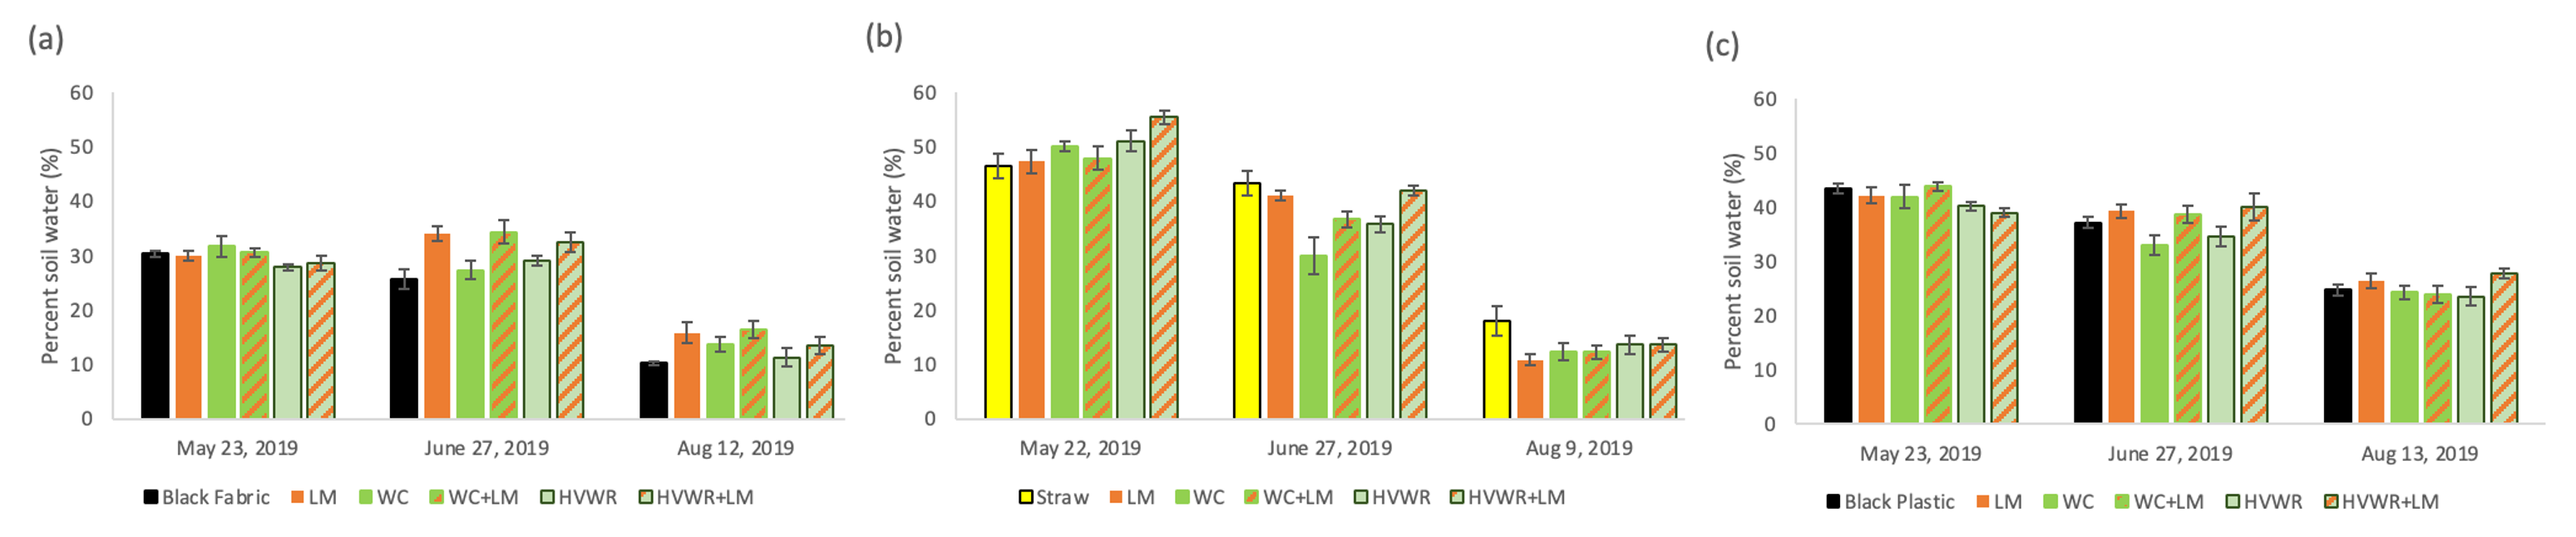
Control versus treatment effects on soil water and temperature varied by time and farm. For soil water, May data tended to be similar across controls and treatments at each farm, likely reflecting the fact that May data was taken prior to flail mowing the WRHV cover crop or applying leaf mulch strips or straw and plastic control mulches and planting tomatoes. At BHF, June and August soil water tended to be highest whenever in-row leaf mulch was present (Figure 8a). At CF, soil water tended to be lowest under WC in June and highest under straw in August (Figure 8b). At SHO, soil water tended to be highest whenever in-row leaf mulch was present in June, but fairly similar among controls and treatments in August (Figure 8c).
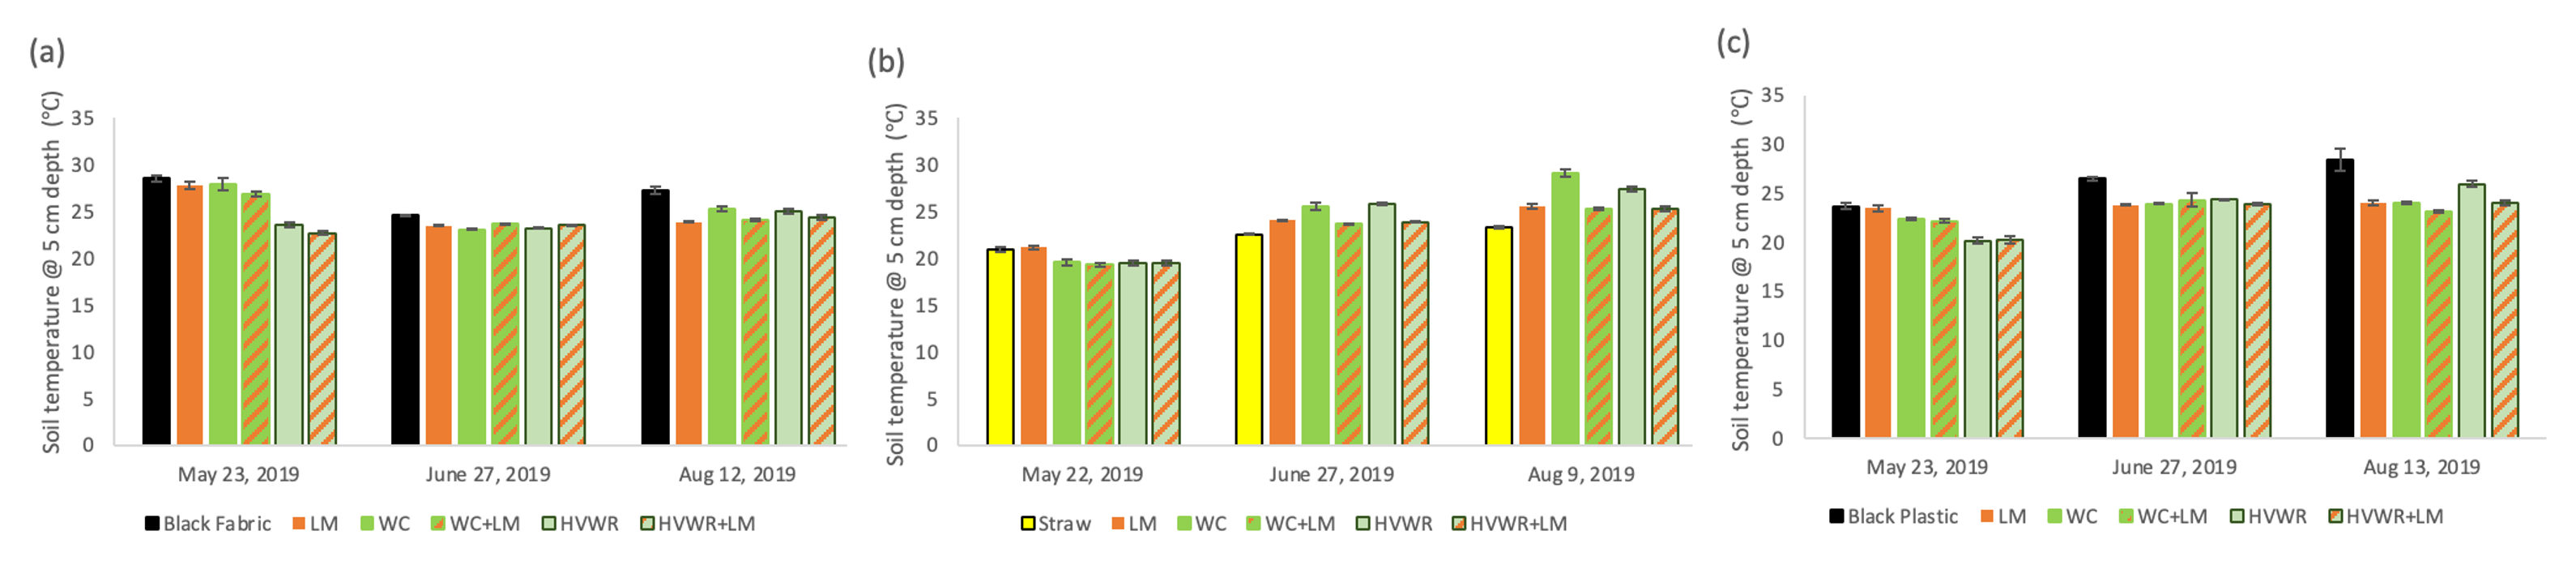
May soil temperature also tended to be fairly similar across controls and treatments at each farm, albeit with a tendency for lower soil temperature in HVWR beds at BHF and SHO (Figure 9a, 9c). At BHF and SHO, June and August soil temperature tended to be highest under black plastic mulches (Figure 9a, 9c), whereas at CF, June and August soil temperatures tended to be lowest under straw and highest under WC or HVWR mulches without in-row leaf mulch (Figure 9b).
Farmer Perspectives
In pre-project interviews, farmers discussed using a variety of practices for tomato production. Black plastic was acknowledged as a common, successful method for mulching/ground cover. All farmers noted that leaf mulching was beneficial for moisture retention and reducing plastic waste, but required well-advanced planning to ensure access to leaf mulch 7-9 months after the autumn season. Farmers discussed challenges from climate change including the need for earlier irrigation (with rainfall in May and June less frequent in recent years) and some interest in carbon farming. Two of the farms are quite small in landholdings and carbon farming at a useful scale may not be feasible. Two of the farmers use traditional tillage techniques in combination with black plastic (and sometimes leaves) to combat weed pressures, while one farmer is more accepting of weeds and minimizes soil cultivation across the board.
Post-project interviews revealed that none of the farmers were surprised by the research results, as all three producers had expected that their standard weed suppression methods would maximize production while minimizing inputs (money, time, etc.). That is, by trial-and-error season to season and year after year, all three farmers had developed best practices to meet farming goals, available labor, input budgets, and needed production yields.
Farmers recognized that engaging in formal research experiments with professional researchers presents opportunities to learn about new, innovative production systems. Farmers also found it challenging at times to deal with the detailed processes and protocols that must be followed to maintain rigorous control of the research. We observed that our research led to increased interest in and use of cover crops on two of the farms, and there is interest in engaging in follow up research.
Educational & Outreach Activities
Participation summary:
We presented a poster of results-to-date at the 2020 Indiana Small Farm Conference. Two faculty researchers, one farm manager, and two Indiana University students attended.
We planted cover crop demonstration beds at Indiana University's Campus Farm, adding crimson clover to the demonstration beds along with the original white clover and rye-vetch cover crops. The demonstration field day planned for July 2020 was cancelled due to COVID-19. In lieu of the field day event, we adapted outreach plans to create a video describing the project and its findings, using footage from the demonstration plots and images from the experimental research.
We produced a webpage about the project for the university's Campus Farm website, and a downloadable technical report is in preparation. We contributed to a SARE Field Notes article about this project. An academic journal article is in preparation.
Learning Outcomes
Nothing to report yet
Project Outcomes
We found that although leaf mulch strips improved cover crop performance, plastic or straw mulches still outperformed cover crops in terms of weed suppression and tomato yield. Results suggest that over time, cover crop mulches may promote greater soil health and carbon storage compared with plastic and straw mulches.
Nothing to report yet.
Our results warrant follow-up research to test these cover crop strategies against different weed backgrounds. Cover crop mulches with leaf mulch strips may suppress weeds more effectively once farmers have worked to reduce the overall weed seed bank in the soil. It would also be useful to measure other benefits of these cover crop mulch strategies. For example, cover crops may provide habitat for bees, birds and other animals, supporting overall farm biodiversity as well as benefits such as pollination and insect control.