Final Report for ONE10-131
Project Information
Community Harvest Project has been growing vegetables at Brigham Hill Farm and donating them to the Worcester County Food Bank since 1992. The farm is located near the headwaters of the Blackstone River. Horse manure compost and hog manure slurry were applied to fulfill P requirements of 90 lbs P/acre. Soil moisture sensors (Decagon 10HS soil moisture sensors) were installed in each of the six fields and connected to a data management and control module (Campbell Scientific CR1000). When soil moisture dropped below an adjustable trigger, irrigation commenced. In half of the fields, irrigation was pulsed (30 minute duration); in the other half irrigation was conventionally (90 minute duration) applied. The system was fully operational on 15-August and ran through the end of September. Neither the conventional nor the pulse irrigation regime statistically affected vegetable yields. When there was sufficient rain no irrigation occurred. Over the 6-week period when the system was fully operational, the pulse irrigated fields required 2.24 inches and the conventional irrigated fields required 3.28 inches of water. Pulsing the irrigation saved 32 percent water. Next year’s plans are to track the water movement under each of the systems to further refine irrigation duration recommendations for growers.
Introduction:
Locally grown food initiatives are allowing intensive agriculture to return to the Blackstone River Valley and with it come the associated challenges of nitrate (N) leaching and phosphorus (P) runoff. Agricultural N and P losses reduce soil fertility, are expensive, and cause eutrophication of surface waters. Combined with other sources of nutrients (i.e., from septics and lawns) surface waters become overgrown with aquatic vegetation that dies in the winter. In the spring, the dead plant material and dissolved oxygen is consumed by biological decomposition. Without oxygen, the fish can’t breathe and leave the area or die.
Lake Ripple in Grafton, MA provides a venue for hikers and anglers (see Figure 1 in the pdf attachment). It is bounded on the west by Potter Hill and Brigham Hill. On top of both hills are farms; one owned by Community Harvest Project (CHP) and the other by the Grafton Land Trust. Both organizations desire preservation of farmland and water resources in Grafton, near the headwaters of the Blackstone River Valley at the confluence of the Quinsigamond and Blackstone Rivers.
Extended dry periods and well drained soils require use of irrigation for vegetable production in the Blackstone River Valley. Many growers already supplement rain with drip irrigation, a low water volume style of irrigation. With this technology, soil moisture can be maintained at the optimum level for maximum crop production. The question remains, what is the optimal irrigation schedule to maximize productivity while allowing the most soil water storage capacity to capture impending rain without leaching nitrate N.
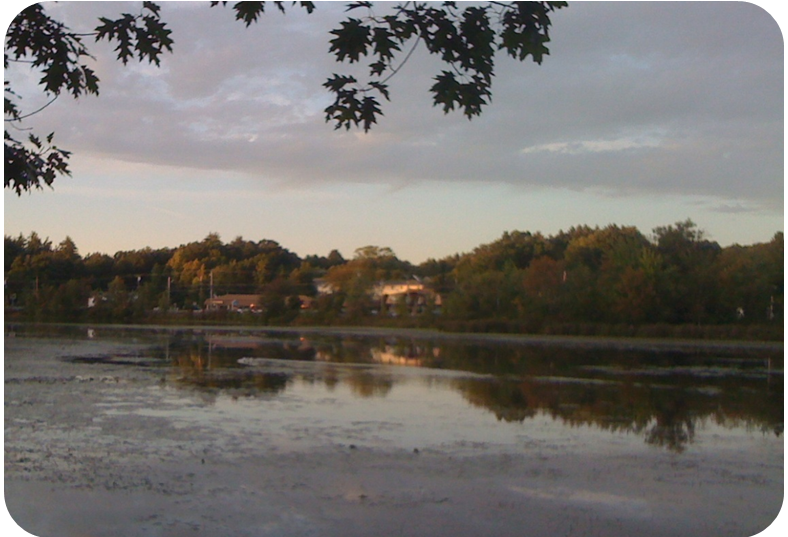
Figure 1. Lake Ripple in Grafton, MA overgrown with aquatic vegetation (14-Sept 2009).
The question regarding the optimal frequency and duration of drip irrigated row crops to reduce nitrate leaching was investigated by Waddell et al. (1999 and 2000). In that experiment, I automated an irrigation system using tensiometers. Tensiometers measure the soil-water tension, a direct measure of the force required by plants to extract water from the soil. Replacing the gauge with a digital pressure transducer allows electronic signaling and control of irrigation. If the tension on the tensiometer becomes too large, air will enter the device and the gauge will read zero; the tensiometer is said to have “broken.” If the soil dries enough to cause the device to break, crop yield and quality were already significantly impacted.
Tensiometers have an advantage over other types of soil moisture sensors because they work in the wet soil range and work independently of soil type or density. If growers think they are irrigating properly based on sight or feel, they most likely either over-irrigate, wasting water and money or they under-irrigate impacting yield and quality. Several authors have suggested various triggers for initiating irrigation. I proposed a soil water potential trigger of 30 kPa (4.3 psi) to initiate irrigation when threatened with summer thunderstorms. Shock et al. (2005), proposed 20 kPa for onions in a semiarid climate with one drip line for two rows of plants unthreatened by frequent summer thunderstorms Both worked well for the various situations—but the 30kPa trigger maximized yields while also limiting nitrate leaching by efficient use of water and nutrients.
Once irrigation is initiated, the next question is to determine the proper duration of the irrigation event. With the flow rate of 0.45 gallons/minute/100 feet, drip tape can provide 0.14 inches of water per hour when spread evenly over the soil surface. Crop demands may exceed 1/4 inch per day and soil water storage is adequate for about 3 days on a sandy loam (Waddell et al., 1999).
Proposed are two strategies of drip irrigation:
- To maintain ideal moisture content in wetted soil portion by pulsing irrigation when needed for 30 minutes based on soil moisture, or
- To attempt to refill the soil to field capacity with irrigation events lasting 90 minutes when needed.
This project proposes to evaluate the High Frequency/Low Duration irrigation management strategy versus the Low Frequency/High Duration strategy on yield, quality, water, and nutrient use efficiencies.
Cooperators
Research
The site is located in Grafton, MA (42.22 N Lat, 71.71 W Lon) and soil is dominated by the Woodbridge Fine Sandy Loam Series; coarse-loamy, mixed, active, mesic Aquic Dystrudepts. Topography is nearly uniform with a slope of 7 percent. The farm has been in production since 2002. Typical management after final harvest (October) includes application of horse manure compost and rototilling to a depth of 20 cm followed by broadcasting annual rye. This management has been conducted for the past 5 years including fall 2009. Additional rototilling occurs early spring prior to bed formation every year for the past 5 years including 2010. Soil samples were taken in April, 2009 to a depth of 20 cm in the upper, middle, and lower portions of the fields (see plot plan). UMass soil test results prior to the growing season are presented in Table 1. It is evident by pH that ample lime has been applied and the Ca:Mg ratio (mean of 11.2) may be high. The most striking factor is the very low soil P. Soil test results recommend application of about 90 lbs P (200 pounds of P2O5) fertilizer per acre.
The entire field was disked after production ceased at Brigham Hill Farm. Hog manure slurry and horse manure compost were applied at various times over the late fall and winter. Hog manure slurry was injected 4 to 6 inches deep at a rate of 2400 gallons per acre. According to manure analyses, 136 pounds N per acre, 174 pounds P2O5 per acre, and 63 pounds K2O per acre were applied to the fields. Of the nitrogen, 52% was in the readily available ammonium form with the remaining N organically bound. We also applied 1 ? yards of horse manure compost per 1000 square feet (72 yards per acre or about 0.5 inch depth) over the winter. According to compost analysis by UMass, we applied 29, 13, and 0.8 pounds of N, P2O5, and K2O per acre.
The fields were rototilled with a Kuhn Model EL-92 230 pulled by a John Deere 2950. The many rocks were manually removed by generous volunteers. Then a bed shaper, plastic mulch, and drip irrigation tape laying machine made by RainFlo model 2600 formed beds 12 inches high with a 30 inch top. In beds where a single row of plants (i.e., cucurbit, and tomato) were planned, the drip irrigation tape was laid to the upper side of the raised bed. In beds where two rows of plants were planned, the drip tape was centered on the bed. We used 8 mil drip tape (T-Tape by John Deere Water) with emitter spacing of 12 inches. We patched over 150 leaks in the irrigation tape throughout the year due in part to deer hooves but mostly to the abusive nature of over 5000 volunteers aged 6 to 90. The black plastic mulch was neatly and firmly held in place with soil heaped by the effective machine.
After the beds were formed, soil was sampled, sent to UMass soil testing lab, and are presented in Table 2. Twenty or more soil cores (1 inch diameter, 8 to 12 inch depth) from each field were thoroughly mixed and dried prior to sending to UMass. Comparing fall (Table 1) and spring (Table 2) soil test results, there was a statistically significant increase in P due to fertilizer applications, a decrease in K and Mg, and no change of pH and Ca due to lime addition. Phosphorus is the only nutrient considered “LOW” in the soil test report.
Soil Water Properties
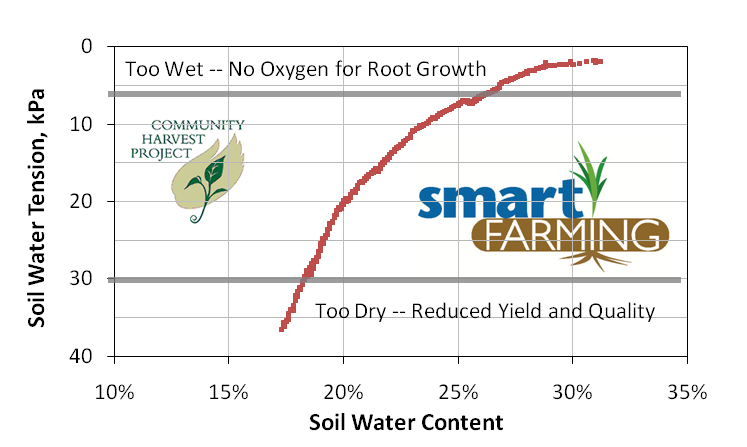
A digital tensiometer was paired with a volumetric soil water sensor in early spring for about a week. The two sensors were installed close to one another at the same depth (about 4 inches deep) and measured every second. A sprinkler attached to a hose was used to wet the soil to field capacity. Data in Figure 2 shows the drying curve for a thoroughly wetted Woodbridge fine sandy loam at Brigham Hill Farm over a 5-day period.
Soil tension in Figure 2 relates to the energy required for plants to extract water from soil. When soil tension is zero, the soil is flooded and can hold no more water. Once the soil tension reaches 30 kiloPascals (4.4 PSI), plant-stomates begin to close developing turgor within the plant allowing more water extraction. As soil continues to dry, plants begin to utilize water stored in fruit, reducing yield and quality. Additionally, if soil moisture exceeds 60 kPa the tensiometers will cavitate resulting in erroneous data and sensor malfunction.
Tensiometers are sometimes temperamental. The ease of installation, range and reliability of a capacitance-type sensor, like the Decagon’s 10HS, is much more suited for a volunteer-based farming operation because it is buried and resists tampering.
On August 15, 2010, Decagon10HS volumetric soil water probes were installed in each field, Campbell Scientific’s CR1000 Management and Control Module was programmed and wired, and the system began irrigating automatically.
Maintaining Soil Moisture
Each of the 6-fields was instrumented with a solenoid valve and volumetric water content sensors (Decagon’s 10HS probe). The valves and sensors were wired to a Campbell Scientific CR1000 data management and control module. Zones 1, 3, and 6 were randomly selected to have irrigation applied for 30 minutes (Pulsed Treatment). The other zones (2, 4, and 5) had irrigation durations of 90 minutes (Conventional Treatment). We measured water use with a 1-inch Badger Read-O-Matic water meter donated by the Grafton Water District.
Soil moisture sensors in each field were read every 30 seconds. Each sensor was supplied with a 12-volt pulse and after 10 milliseconds the voltage output was read with the CR1000. Every 10 minutes, soil moisture in incremental fields was polled and if the result was less than the adjustable trigger, irrigation commenced. The adjustable trigger was set to 25 percent water and later to 20 percent as crops began senescing. When irrigation was required, a control port on the datalogger was turned on, which triggered a relay that enabled the 3 HP Goulds pump. Then another control port turned on the appropriate valve for that field. Irrigation duration for Fields 2, 4, and 5 was 90 minutes(conventional). Fields 1, 3, and 6 had an irrigation duration of 30 minutes (pulse). Irrigation was initiated in all fields when soil moisture falls below 25 percent.
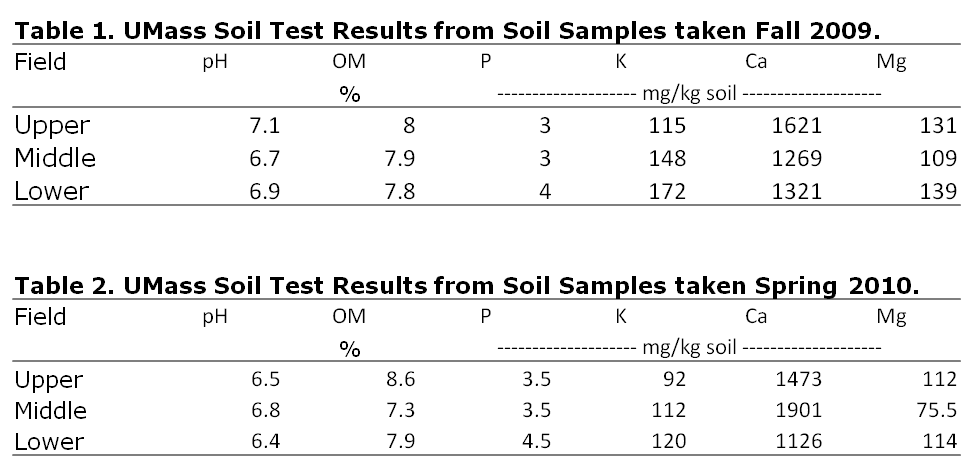 Tables 1 and 2. Soil Test Results for Fall 2009 and Spring 2010.
The automated irrigation system was not operational until 15-August. Prior to 15-August, attempts were made to manually run the irrigation during dry periods for 1.5 hours every other day but since the flow meter was not enabled, the exact amount of irrigation applied was not known.
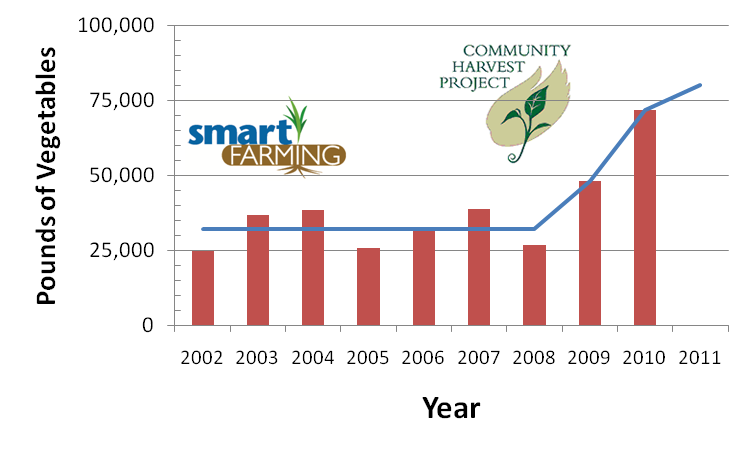
Crop yields for the entire farm are presented in Figure 3 for the last 9 years. For the past two years, there has been a 40% increase in yields due to increased irrigation and nutrient management.
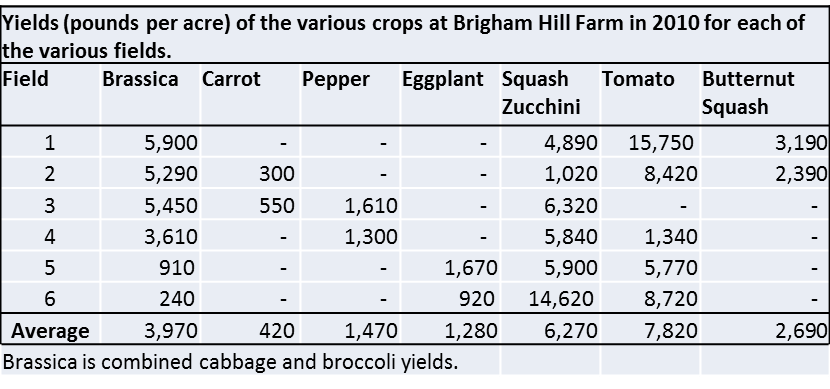
The Yield Table contains yield per acre for each crop in each field. Fields and Crops with no data in the table did not have that crop planted. Cabbage and broccoli were combined and labelled Brassica. Caution must be used interpreting the field specific information since some volunteers were not aware of the field numbering scheme. We are relatively certain that the mass of all vegetables was recorded, just not for each field.
Soil Moisture and Irrigation
Soil moisture was used to trigger the irrigation beginning on 15-August. Soil moisture sensors were installed in various crops that make differentiation of irrigation amounts difficult. Table 3 lists the fields, the crops where sensors were installed, and the amount of irrigation from 15-August through 4-September. After this period, two of the probed (fields 2 and 4) failed and it took about 2 weeks to receive replacement probes for installation. In field 1, the sensor was placed in a row with a second seeding of bean after cabbage after plastic mulch was removed. Without plastic, it was estimated that water demands were higher due to increased soil evaporation; the wetted pattern of the soil surface was about 8 inches on either side of the drip tape. Visual observation of the squash in field 2 indicated that water stress resulted in vines shriveling since rain was lacking during this period and water use was evidently lower. Thus, utilizing sensors in different crops led to challenges with irrigation amounts causing statistical interference and no significant differences.
Utilizing a qualitative approach to describe irrigation amounts, over the entire field the pulse-irrigation treatment required 29,434 gallons of water compared to 42,770 gallons for the conventional-irrigated treatment. Using the area under cultivation, the depth of water applied was 2.24 and 3.28 inches for the pulse and conventional treatments, respectively. The pulsed irrigation treatment required over 30 percent less water than the conventional irrigation treatment.
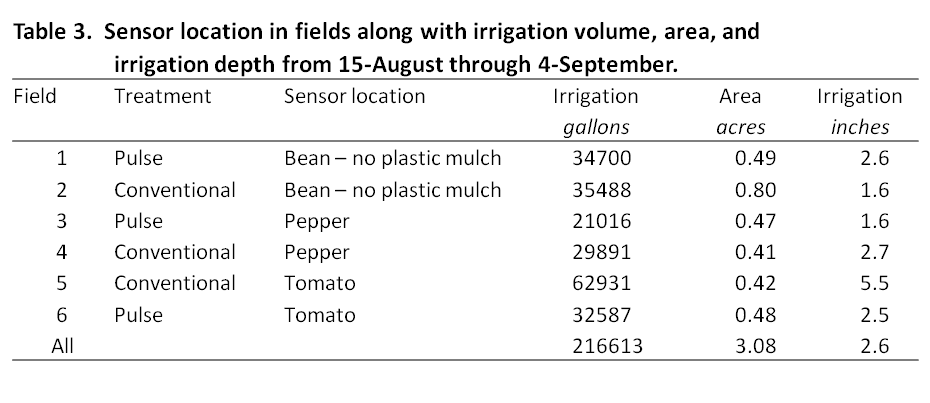
Table 3. Sensor locations and irrigation application by field.
Rainfall, irrigation, and soil moisture for the Pulse and Conventional treatments are presented in Figures 4 and 5, respectively. The numbers of irrigation events for Pulse treatments (34 irrigations) and for Conventional (13 irrigations) were significantly different (P=0.05). Variability in irrigation amounts was not statistically different although Pulsing used 29,400 gallons and Conventional used 42,770 gallons. Pulsing the irrigation saved 31 percent water.
Performance of Irrigation System
Regardless of the irrigation duration, when it rained there was no irrigation. Between 22-August and 25-August (see Figures 4 and 5) there was 1.75 inches of rain. This rain satisfied water requirements in the raised bed and no irrigation occurred in any of the fields. Since the soil moisture probe was placed near the top of the raised bed with black plastic mulch, rainwater must have entered through the holes in the plastic and/or through capillary flow from the interrows.
The well at Brigham Hill Farm supplies about 7,000 gallons per day. Routinely in August, the entire farm used about 15,000 gallons per day (equivalent to 0.19 inches of rain). The irrigation-water deficit was satisfied with a convenient connection to the Town of Grafton Water Department public water system. This amount of water use (about 0.2 inches per day) relates well with those in the literature. Rarely do plant water usage rates exceed 0.25 inches per day.
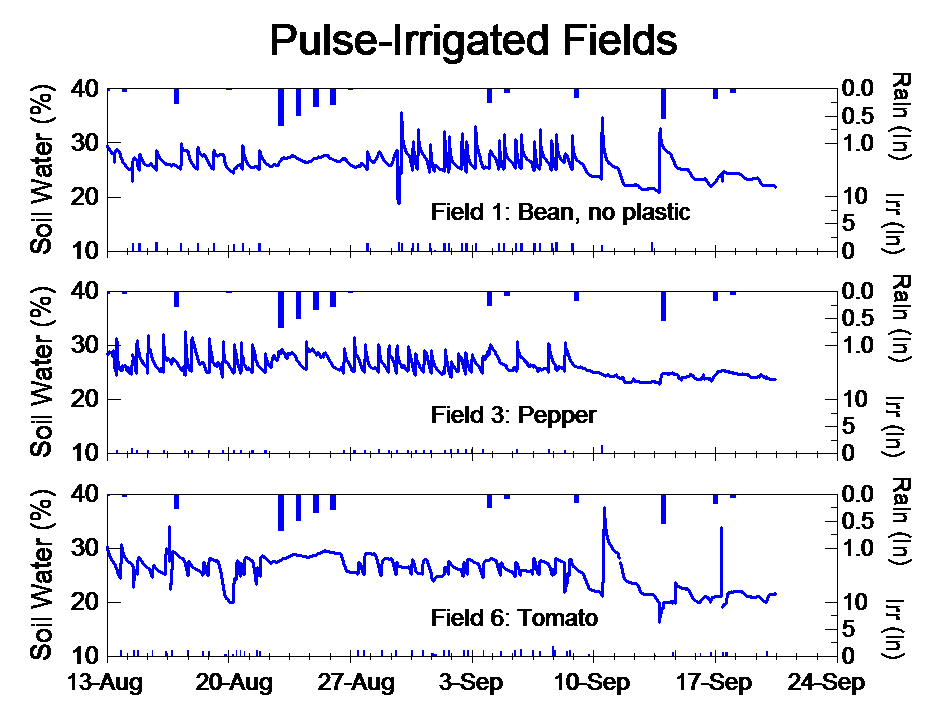
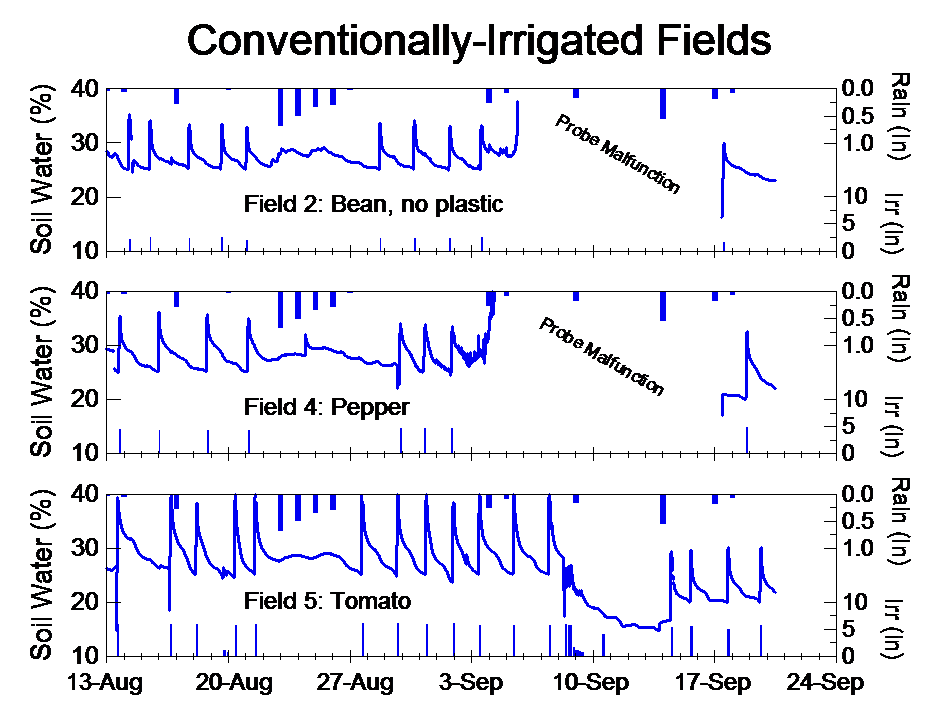
Figure 5. Rain, irrigation and soil moisture for conventional irrigated (90 minute duration) fields in 2010 at Brigham Hill Farm.
Education & outreach activities and participation summary
Participation summary:
A poster was produced for Harvest Home Festival. Several thousand people visited the all-day event at Brigham Hill Farm. In addition to the poster, a live exhibit with soil moisture probes, tensiometers was on display. Kids (and adults) could handle a probe and watch the values change when they moved it.
At the Irrigation Association’s Annual Meeting in Phoenix, I attended the Agricultural Drip Irrigation Course. Using Brigham Hill Farm as a case study, the class was able to optimize the irrigation system for optimal uniformity.

Project Outcomes
Stand-alone soil moisture sensors for irrigation control are gaining popularity. Soil moisture sensors range from $50 to over $1,000. The Decagon 10HS soil moisture probes cost about $100 each. Several of our probes produced erroneous results and Decagon replaced them with new probes. Apparently, water can sometimes seep into the electronics built into the probe if they are abused.
The data management and control module used in this study was from Campbell Scientific. The model CR1000 costs about $1,500. Less expensive control modules (without data management) are available (e.g. RainBird).
Farmer Adoption
The technology behind soil moisture based automation of irrigation systems in gaining popularity in the mainstream as evinced by at least 12 companies dedicated to irrigation automation at the annual Irrigation Association Trade Show. Many of the larger growers have adopted this technology. For example, A.D. Makepeace uses temperature sensors to trigger irrigation of cranberry bogs for frost protection.
Areas needing additional study
Much of New England is covered by fine sandy loam soils like those at Brigham Hill Farm. Depending on the depth of the topsoil, irrigation duration will need adjustment to prevent over-irrigation and water loss beyond the root zone. Next year, we plan to intensively monitor the wetted pattern in soil after irrigation at different durations. Our shallow soils require a shorter duration while deeper soils may require a longer duration pulse of irrigation to maximize productivity.