Final report for ONE15-228
Project Information
Minimum and no tillage practices have tremendous potential to reduce farmer expenses and the potentially negative impacts of intensive agriculture on soil quality and the environment. An important co-benefit of these tillage practices may be reducing regional to national greenhouse gas (GHG) emissions by storing carbon in the soil and reducing emissions of carbon dioxide (CO2) and nitrous oxide (N2O). In minimum tillage systems, however, a persistent problem is how to apply and retain nutrients stored in manure: without incorporation, more than 50% of manure nitrogen may be lost through runoff and volatilization (Jokela et al. 2004).
To identify the benefits and/or drawbacks different tillage and manure application methods, we examined two tillage practices (vertical-till and no- till) under two manure treatments (broadcast, injected) in the Manure Injection No Till (MINT) farm trial. Our primary objective was to determine the manure and soil management practices best suited for reducing GHG emissions and N losses, while increasing carbon storage.
From June 2015 to June 2017 (measurements are ongoing) we took in-field CO2, N2O, and mineral nitrogen measurements approximately bi-weekly during the growing season (May-November). In 2015 we also took 1-m deep soil cores from each treatment to examine total soil carbon and nitrogen storage.
Overall, we found that no-till decreased CO2 emissions and manure injection increased N2O and CO2 emissions, but that N2O emissions declined with decreasing soil water content. We found some evidence that manure injection decreased soil carbon storage at depth, but these results are preliminary – taken the year following establishment of the trial – and will require resampling after a more substantial period of time (planned for 2019-20 via a USDA CARE grant).
Results have been – and will be – presented at farmer-cooperator field days (2015-2017), and local and national conferences. We also worked with the USDA to produce a factsheet, and plan to host a webinar on tillage and manure application methods via a USDA CARE grant that we recently received to extend this work. Future work will focus on reducing GHG emissions by changing the timing of manure application (fall vs. spring) and incorporating cover crops.
Introduction:
Low and no tillage practices may reduce both farmer expenses and the potentially negative impacts of intensive agriculture on soil quality by storing carbon (C) in the soil (Powlson et al. 2011), increasing soil aggregation (Six et al. 2000) and preventing soil erosion and nutrient losses (Holland 2004). Low till and no till systems have also been found to reduce greenhouse gas (GHG) emission via reductions in soil emissions of carbon dioxide (CO2; Jin et. al 2014) and nitrous oxide (N2O; Omonode et al. 2011) and reductions in the required number of passes of farm machinery over the field. Thus, an important co-benefit is that, by storing C in the soil and reducing GHG emissions, minimum and no tillage practices have tremendous potential to reduce the GHG footprint of agriculture and, possibly, of the United States (Socolow and Pacala 2006).
While low till and no till practices have been widely adopted worldwide (Derpsch et al. 2010) and in Vermont (H. Darby, personal communication), a significant problem remains: when applying manure – an important nutrient source for many farms – more than 50% of manure nitrogen (N) can be lost unless it is incorporated into the soil (Jokela et al. 2004, Maguire et al. 2011). What is the best system for manure incorporation in a minimum tillage system? Recent technological advances allow farmers to “inject” manure into fields, regardless of tillage practice (Maguire et al. 2011). How does this method compare to broadcast manure application in conservation and conventional tillage practices? While manure injection is expected to reduce N losses via ammonia (NH3) volatilization, it may increase N2O emissions (Maguire et al. 2011). How will these manure application methods interact with different tillage practices to impact soil quality, nutrient status, and GHG emissions? This project will utilize an existing farm trial to examine the impacts of two tillage practices (strip tillage, the third tillage treatment, was discontinued after 2015) – vertical tillage and no tillage – and two manure application methods – injection and broadcasting – on soil C and N status and soil emissions of CO2 and N2O.
Our objective was to determine the manure and soil management practices best suited for reducing greenhouse gas (GHG) emissions, increasing carbon storage, and preventing nitrogen losses. This objective was met by taking in field GHG, soil carbon, and nitrogen samples. Our results will be used in conjunction with ongoing UVM Extension measurements (e.g., crop productivity and quality), which will allow for a more complete understanding of the benefits and disadvantages of different management practices.
Cooperators
Research
Field site: The MINT trial
The Manure Injection No Till (MINT) farm trial located at Borderview Farm in Alburgh, VT (45.005, -73.308) was established in May of 2014. The trial is in a continuous corn system. The soils at this site are classified as a Benson rocky silt loam. There are two tillage treatment strips, vertical till and no till, that are 40 feet wide by 192 feet long, with 40 foot buffer strips between them. Within each tillage plot there are two manure application methods: broadcast (no incorporation) and injection. Each tillage and manure treatment combination is replicated four times (i.e., a total of 16 plots). In each year manure was applied at a rate of 15,500+ liters ha-1 in mid-May (May 14, 2015, May 18, 2016, and May 18, 2017), the corn crop was harvested in September, and a rye cover crop was planted within a week after corn harvest. Planting occurred within two days of manure application.
Field measurements
GHG fluxes (N2O and CO2) were measured biweekly or more frequently after management practices from June 3, 2015 – June 8, 2017. Measurements were performed using static closed chambers connected to a Model 1412i infrared photoacoustic spectroscopy (PAS) gas analyzer (Innova Air Tech Instruments, Ballerup, Denmark). Static closed chambers consisted of two parts: a polyvinyl chloride (PVC) base (32.5 cm diameter and 15 cm height), which was covered during measurements with a PVC lid (inner diameter of 30 cm and inner height of 9.5 cm). The chamber lid was fitted with three sampling ports from which gas was pulled during measurement, a single gas return port, and a passive vent to prevent pressure.
One week before gas measurements began, a gas sampling point was randomly selected within each plot, and the PVC ring base was inserted in the soil to a depth of 5 cm. One base was installed in each manure by tillage treatment, for a total of 16 plot/bases (4 bases per treatment). In some cases, bases had to be removed for management activities. In such cases, bases were reinstalled immediately and were not used for measurements for a minimum of 24 hours. Before gas measurements, vegetation inside the collars was cut to a height of 4 cm in order to minimize plant uptake of gases. During measurements, the PVC lid was sealed (with a rubber seal) onto the PVC base and connected in a closed-loop system containing the PAS gas analyzer. Measurements were conducted for a period of 10 min with 1 min sampling intervals and a sampling rate of 1.8 Lmin−1.
The change in CO2 or N2O concentration over 24 hours (ΔC/Δt) was calculated by determining the difference between CO2 or N2O concentrations at the initial (time = 0) and final (time = 24 h) samples. Fluxes of CO2, and N2O were then calculated as:
F = ΔC/Δt * V/A*ρα
where F is the gas production rate for CO2 (mg CO2–C m−2 h−1) or N2O (mg N2O-N m−2 h−1), ΔC/Δt is the change in gas concentration in the chamber (10−6 L L−1 h−1), V is the jar headspace volume (0.00027144 m3), A is the soil core surface area (0.002027 m2), ρ is the density of gas at 20°C and 0.101 MPa (1 mole per 24.04 m3), and α is a conversion coefficient (28/44 for N2O; 12/44 for CO2). Here, the density of gas was calculated based on 20°C and not the actual air temperature because the PAS instrument calculates the concentration of each gas at 20°C.
Soil temperature and soil moisture were simultaneously measured near each chamber at 0-10 cm depth using a digital thermometer and a FieldScout TDR 300 Soil Moisture Meter (Spectrum Technologies, Aurora, IL). Available inorganic N was also measured by taking one soil sample (0-10cm) near each chamber during each gas sampling measurement using a 1 cm diameter soil core. Soils were homogenized extracted with 2 M KCl within 24 hours of sampling. Extracts were analyzed for ammonium and nitrate using colorimetric microplate methods on a Synergy HT Multi-Detection Microplate Reader (BioTek, Winooski, VT; Weatherburn 1967, Doane and Horwath 2003, Hood-Nowotny et al. 2010).
In 2105 we measured soil C and N in two of the four replicates for each tillage-manure treatment combination to a depth of 1 meter. Soil cores were 3.81cm in diameter. Soil cores were sectioned into 0-10, 10-20, 20-30, 30-60, and 60-100 cm as detailed in the GRACEnet soil sampling protocol (Liebig et al. 2010). Core sections were homogenized, dried in the oven at 60 degree C, sieved (4 mm), and subsampled to measure total C and N by combustion (Flash EA).
Statistical analysis
To meet normality and homogeneity assumptions, daily CO2 and N2O flux rates and ammonium and nitrate values were log transformed when necessary. Log transformed daily N2O, nitrate, and ammonium were analyzed using a repeated measures linear mixed model that included plot as a random effect and manure treatment, tillage treatment, and date (and interactions among them) as fixed effects. We also used a varIdent variance structure to account for heterogeneous errors among the manure application treatments (proc lme in R; R Core Team 2016, Pinheiro et al. 2017). Treatment significance was assessed using F tests (proc anova in R). We used the same model on untransformed data for daily CO2 fluxes.
GHG emissions
Manure injection increased both CO2 and N2O emissions, while no till practices decreased CO2 emissions and had no impact on N2O emissions (Table 1, Figures 1 and 2). Both fluxes were significantly affected by date, with larger emissions and greater differences in emissions between manure treatments immediately after manure application (Figures 1 and 2). However, the impact of injection was much larger on N2O than CO2 emissions, with average daily flux rates more than two times higher in injection vs. broadcast for N2O but only 1.2 times higher in injection vs. broadcast for CO2.
There was also substantial variation in flux sizes among years, likely due to variable weather conditions, with 2016 being very dry in comparison to 2015 and early 2017. These weather patterns were reflected in average soil moisture during these years: 19-20% in 2015 and early 2017 compared to 14% in 2015. Average daily N2O flux rates were, on average 3.5 times greater in 2015 and 2017 than in 2016, and N2O fluxes increased linearly with soil moisture (P < 0.0001, R2=0.145). Thus, our results suggest that pairing manure injection with dry conditions may reduce GHG emissions.
Table 1. Results from linear mixed model F tests for daily CO2 and N2O fluxes. Bold values are significant p-values (<0.05).
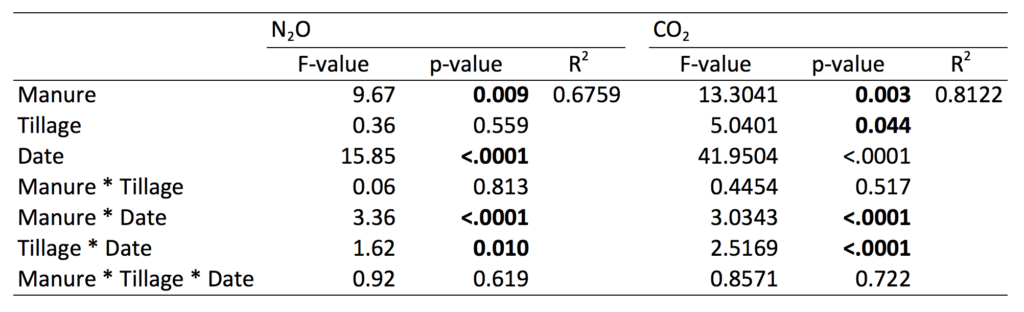
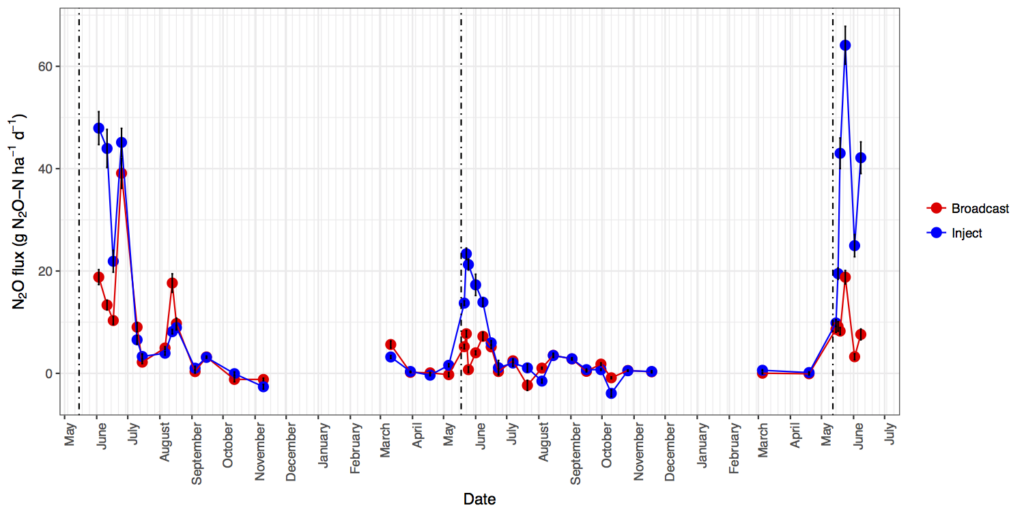
Figure 1. Daily N2O fluxes from injection and broadcast manure treatments (June 2015 – June 2017). Vertical lines show dates of manure application, tillage plus planting (all in 1-2 days).
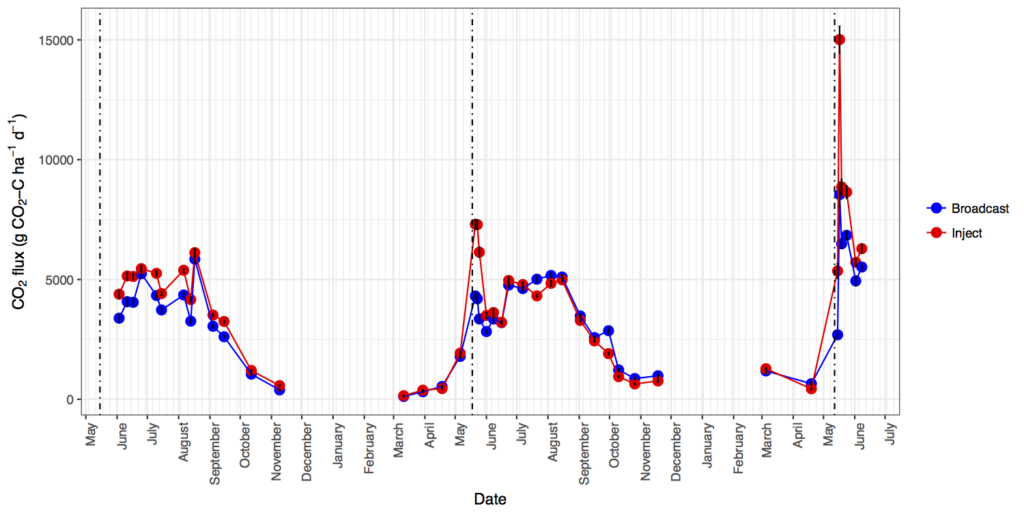
Figure 2. Daily CO2 fluxes from injection and broadcast manure treatments (June 2015 – June 2017). Vertical lines show dates of manure application, tillage plus planting (all in 1-2 days).
Tillage had much smaller impacts on N2O emissions, with only a significant tillage by date interaction (Table 1). Although N2O emissions were slightly higher in vertical till plots (approximately 1.2 times higher in vertical vs. no till), this changed depending on date, with smaller differences during 2015 (Figure 3). Tillage also had a small impact on CO2 emissions, with 1.1 times higher daily emissions from vertical till than no till plots on average (although the size of the treatment difference varied by date; Table 1; Figure 4).
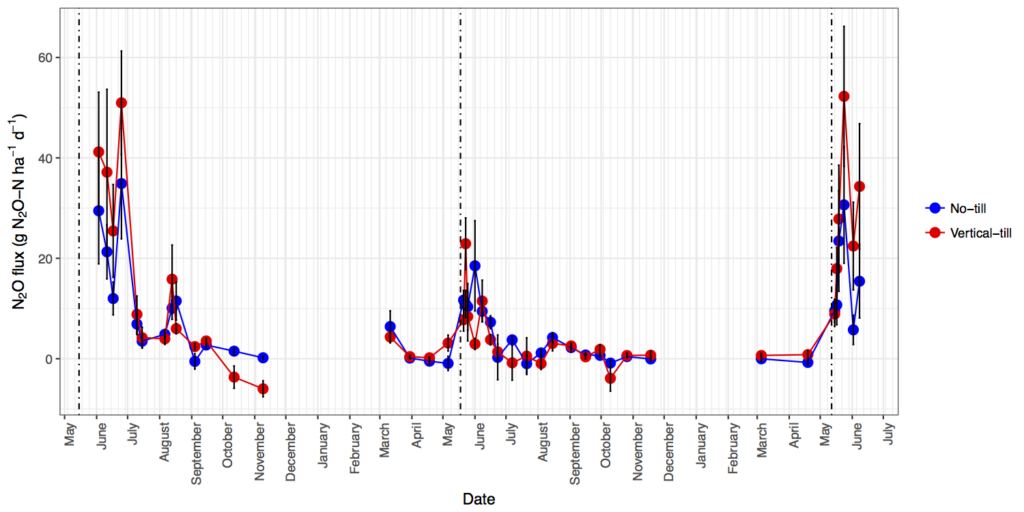
Figure 3. Daily N2O fluxes from vertical and no till treatments (June 2015 – June 2017). Vertical lines show dates of manure application, tillage plus planting (all in 1-2 days).
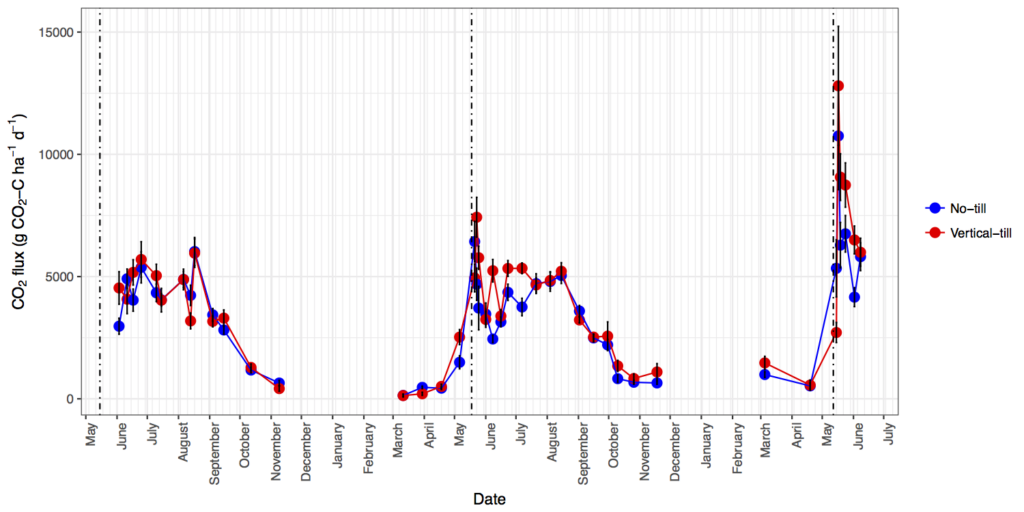
Figure 4. Daily CO2 fluxes from vertical and no till treatments (June 2015 – June 2017). Vertical lines show dates of manure application, tillage plus planting (all in 1-2 days).
Overall, we found that manure injection increased both CO2 and N2O fluxes. Because the majority of N2O resulting from manure application is produced via partial denitrification under anaerobic conditions, it is likely that injecting manure increases carbon and nitrogen availability near anaerobic microsites, increasing denitrification rates and N2O production (Montes et. al, 2013). No till, consistent with the current literature, tended to decrease CO2 emissions, likely by decreasing the physical protection of carbon against decomposition by breaking up soil aggregates (Post and Kwon, 2000).
Mineral nitrogen
Manure injection increased both ammonium and nitrate levels in the soil across the growing season, but the largest difference between treatments was just after manure application (Table 2; Figure 5). On average, nitrate and ammonium concentrations were 1.5 higher in injection than broadcast. Incorporation by injection likely reduces N losses via ammonia (NH3) volatilization, resulting in the higher observed levels (Maguire et al. 2011). Tillage had no significant impacts on ammonium or nitrate concentrations.
Table 2. Results from linear mixed model F tests for soil nitrate and ammonium. Bold values are significant p-values (<0.05).
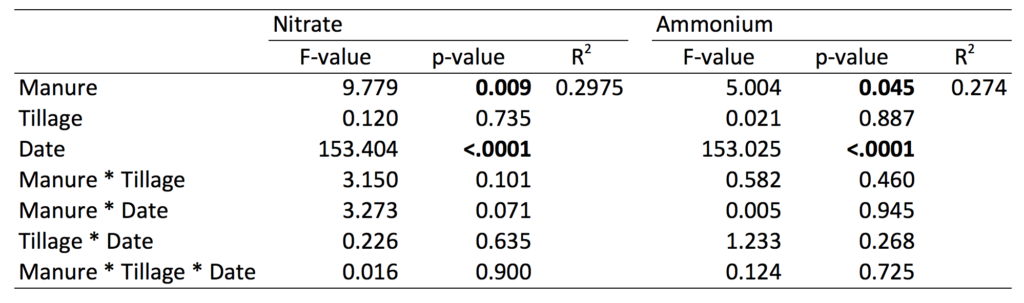
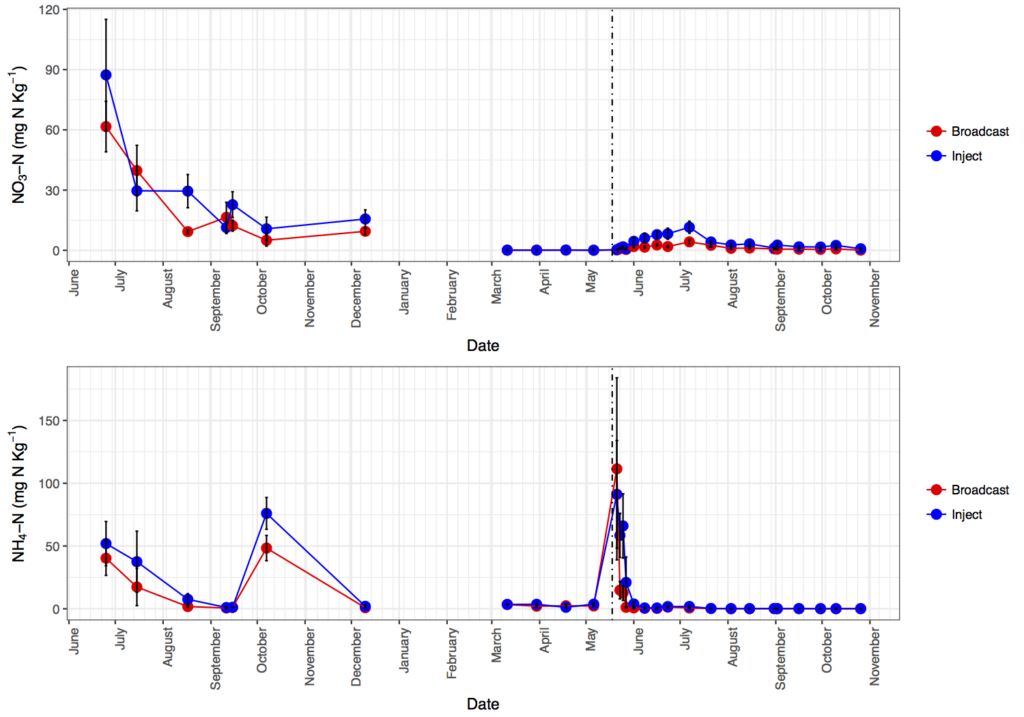
Figure 5. Soil nitrate (top panel) and ammonium (bottom panel) from broadcast and inject manure application (June 2015 – October 2016). Vertical lines show dates of manure application, tillage plus planting (all in 1-2 days).
Total soil carbon and nitrogen
Only soil carbon showed a significant response to the tillage and/or manure treatments (Figure 6; P < 0.05). At 60-100 cm, manure treatment was significant with broadcast manure having almost 2.5 times more carbon than injected manure. Tillage treatments had no significant impacts on soil carbon. Manure application and tillage method had no significant impacts on soil N.
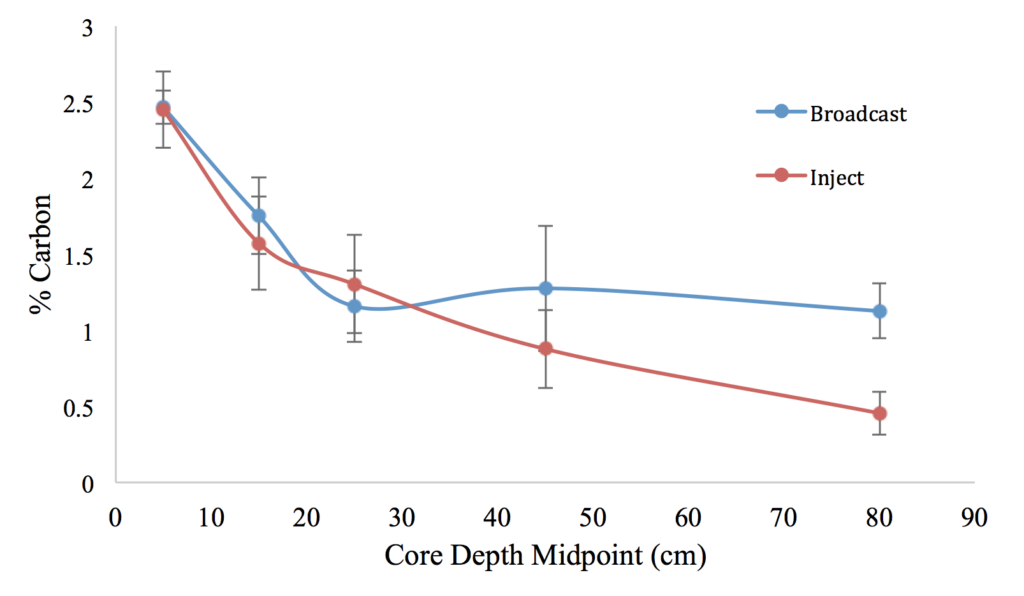
Figure 6. Percent soil carbon with depth in broadcast and inject manure application treatments.
In contrast to our expectations, we did not see a significant difference in soil C in the top 20 cm of soil, but rather found that injecting manure decreased soil C at depth within the profile. The loss of C at depth in the injection treatment may be at least partially due to the priming effect: placing fresh organic matter (FOM) at depth, via manure injection, may give soil microorganisms access to an energy source that was not previously present, causing them to increase their activity and rates of C mineralization (Fontaine et al., 2003). This suggests that an absence of fresh carbon at depth may prevent the decomposition of the organic carbon pool in deep soil layers (Fontaine et al, 2007). However, the opposite may also be true: any change in management that distributes FOM at depth could stimulate the carbon mineralization, causing it to be lost (Fontaine et al, 2007).
Also in contrast to our expectations, C storage in the soil profile was either unaffected or not increased by no till management. While no till has been found to increase soil C in surface soils (Powlson et al, 2011), other studies have found no till to have minimal impacts (Baker et al, 2007). However, the impacts of tillage practices in this study may become clearer as the study continues beyond two years. Soils in the MINT trial will be resampled for total carbon and nitrogen in 2019-2020.
Overall, we found that manure injection increased N2O and CO2 emissions, particularly in the weeks following manure application and during wet years. However, it may have also resulted in lower total N losses, resulting in higher concentrations of soil nitrate and ammonium during the growing season. Tillage practices had little significant impact on N2O emissions, but no till decreased CO2 emissions. Our research suggests that management can substantially alter greenhouse gas emissions. In particular, pairing manure injection with dry conditions may reduce the impact of this practice. Ongoing work is investigating the impact of pairing manure injection with other practices (e.g., cover crops, application timing) to reduce emissions.
Education & outreach activities and participation summary
Participation summary:
During 2016-2017 we worked with the United States Department of Agriculture Northeast Climate Hub to produce a research brief on our project. This factsheet will be on the Climate Hub website https://www.climatehubs.oce.usda.gov/northeast/educational-materials/researchbriefs and also featured in the Climate Hub’s summer newsletter in July 2017.
Tyler Goeschel presented the 2015 data during his MS defense in July 2016 at the University of Vermont. In 2015-2016, we had the opportunity to present our results to farmers and service providers at the 2015 Annual Northwest Crops and Soils Field Day (July 2015-6, Borderview Farm, Alburgh, VT). During the 2015 Field Day, we also provided a demonstration of greenhouse gas sampling and technology to interested farmers and cooperators. We will participate in this event again in 2017. During 2016, we also presented our results during a SARE Farm Tour (July 27, Borderview Farm, Alburgh, VT). Other talks where this research was presented include during a Gund Tea seminar entitled “The Potential for Agriculture to Mitigate Climate Change” and related podcast (https://soundcloud.com/gundinstitute/carol-adair-the-potential-for-agriculture-to-mitigate-climate-change; December 2015, Burlington VT) and the Gund Research Slam (April 20, 2017). We will also present our results this October 2017 at the American Society of Agronomy, Crop Science Society of America, and Soil Science Society of America Meeting.
Learning Outcomes
Farmers gained knowledge via interaction with Heather Darby and from Carol Adair and Tyler Goeschel during Annual Field Days. H. Darby let me know that farmers were very interested in our results and wanted to know more. Through our recently acquired USDA CARE grant, we will continue outreach through field days and webinars.
Project Outcomes
Through this and related work, farmers, extension workers, and others have expressed surprise at our results. In contrast to their expectations that manure injection would have only positive environmental consequences (e.g., retaining nitrogen and phosphorus in soils vs. running off into surface waters), we have found that there appear to be tradeoffs – injection increases nutrient retention but also increases GHG emissions. This has inspired us to continue working with farmers, who want to know if there are management practices that can be paired with injection to reduce GHG emissions.
Because our results suggest that manure injection reduces nutrient losses, but increases greenhouse gas emissions (GHGs), we are very interested in learning how injection may be paired with other management practices to reduce GHG emissions. Ongoing work funded by USDA CARE will begin this investigation.
Our soil carbon and nitrogen results (0-1 m) were largely inconclusive, likely because the trial had only been established in the prior year. We will resample in 2019-20, and expect to have more definitive results regarding the impacts of tillage and manure application on soil C storage at this time. During this sampling, we will also use all four replicates of each treatment.
During the field trial, one tillage method was discontinued, which reduced our tillage methods from three to two. We also only investigated reduced tillage methods. Future work will include a conventional tillage “control”.
This work will be of interest to farmers and extension workers seeking to promote management practices that promote on-farm nutrient retention in high precipitation environments (e.g., the northeastern US). Manure injection may be of interest in such areas due to its perceived (but still largely untested) capacity to prevent runoff losses of applied manure. Because our results indicate that manure injection also increases GHG emissions, the costs and benefits of this management practice should be considered locally and/or regionally.