Final report for ONE18-319
Project Information
With SARE support, BCCD evaluated whether seasonal high water tables serve as a channel for nutrient pollution when manure is stacked on soils with a SHWT. SHWTs typically have connectivity to surface waters, discharging near or in an intermittent or perennial stream. The primary audience of the study was equine farms, with the long-term end goal of increased adoption of improved manure stacking practices on equine farms. However, the results are applicable to any livestock farm with SHWT soils.
To evaluate to what degree nutrients from the manure pile were moving laterally towards surface waters, BCCD collected groundwater and soil samples on four equine farms. Delaware Valley University served as the technical advisor in the experimental layout and ran ANOVA/Tukey tests for data analysis. Groundwater monitoring wells were installed upslope of the manure stacking area, at the manure stacking area and at least 50 ft downslope of the manure stacking area. Soil samples were collected by soil horizon at these three sites on the farm. Water and soil samples were collected Spring, Summer and Fall. Phosphorus (P) is the primary manure nutrient concern for water quality in Pennsylvania. Though not a water quality nutrient of concern, potassium (K) was also evaluated as a marker for presence of manure since manure is very high in potassium. Unlike nitrogen, potassium is also fairly stable in the soil and in the water samples. For both the water and the soil test, P and K levels were significantly higher at the manure pile compared to the upslope sample. For the downslope site soil samples, the lower two soil horizons had significantly higher P and K levels compared with the upslope site. Due to data variation, the downslope water samples were not statistically different than the upslope water samples for P and K, despite being on average five and ten times higher than the upslope samples, respectively.
One of the participating farms installed a roofed manure stack pad after the spring and summer samples were pulled. The fall water sample, five months after installation of the improved manure storage, the phosphorus levels in the downslope water sample was below the manure contamination level. The fall water samples from the other three farms, remained on average, seven times above the phosphorus-manure contamination level. The quick response to the installation of the roofed manure storage indicates that water, and any nutrients in it, moves quickly through the SHWT with each rain event.
BCCD developed two educational tools highlighting key results from the research. One brochure was developed for a farmer audience and one brochure was developed for a conservation professional audience. BCCD also disseminated results via 4 consultations and 5 presentations, reaching 105 farmers and 47 conservation service providers.
Project Goal: Increase awareness of groundwater pollution relating to improper manure stacking and seasonal high water tables (SHWT) to increase equine farmers’ acceptance and implementation of improved manure stacking.
The project will achieve the above goal with the following objectives:
1.With Delaware Valley University serving as the technical advisor, conduct research on four equine farms to evaluate the extent that nitrogen and phosphorus from manure stacking on earthen surfaces contaminate SHWTs.
2.Develop two educational tools that will highlight key results from the research, one in a format easily digested by equine farmers, and another in a format easily digestible by technicians working in the agriculture conservation sector.
From a regulatory standpoint, Pennsylvania already has specific manure management regulations that prohibit permanent manure stacking on earthen surfaces. In 2012, Pennsylvania updated its manure management regulations for all farms with livestock, regardless of livestock numbers. One of those updates was specific language stating that manure stacking in the farmstead area must be on an improved stacking pad or covered via a roof or a tarp. In the field, especially on equine farms, this regulation causes many farms to be out of compliance with state manure regulations. The scale of the farms affected coupled with skepticism about the validity of the groundwater contamination claim makes enforcement and implementation of improved manure-stacking practices difficult.
As the Bucks County Conservation District (BCCD) received push back from equine farmers about the potential for groundwater contamination resulting from earthen manure stack pads, BCCD began to search for studies confirming this groundwater contamination and manure-stacking connection. A review was conducted of available studies connecting manure-stacking on earthen surfaces with groundwater contamination in soils with seasonal high-water tables (SHWTs). In addition to Web searches for similar studies in the northeastern Unites States, BCCD also queried the following agencies:
- Pennsylvania Department of Environmental Protection’s (PA DEP) water quality department
- Natural Resource Conservation Service’s state soil scientist and state engineer
- Pennsylvania State University’s nutrient management department
Neither the web search nor the interviews with the above agencies produced any evidence of research connecting equine manure stacking and groundwater contamination in situations similar to conditions found in Bucks County.
The most relevant study found was from Penn State University where nitrogen and phosphorus transport was evaluated from in-field stacking of poultry litter on two different soil types – a sandy-loam and a silt-loam (Liu et al., 2015). Interestingly, the introduction of the Penn State study also highlights a lack of research on nutrient losses from manure stacking despite the presence of manure stacking regulations in Pennsylvania. The Penn State study found that phosphorus leaching to groundwater was twenty times higher than phosphorus surface runoff. Nitrogen leaching was forty times higher than nitrogen surface runoff.
However, there are two major differences between the Penn State experiment and equine manure stacking on soils with SHWTs. First, the soil type sampled in the study is very different from Bucks County. The Penn State study evaluated both a sandy-loam and a silt loam. As expected, the sandy-loam, with a drainage class of excessively drained, leached more readily than the silt loam, with a drainage class of well -drained. In contrast, the majority of Bucks County soils are silt loams with a drainage class of somewhat poorly drained, indicating a lower leaching potential than the soils from the Penn State study. In addition to a different drainage class, Bucks County soils have a high presence of SHWTs, a hydrologic feature not present in the soils from the Penn State study. The net effect of leaching potential in somewhat poorly drained soils with the presence of a SHWTs at varied depths has not be studied.
The second key difference from the Penn State study concerns the manure type. Poultry litter is much higher in nutrient content than equine manure. Using Pennsylvania State University’s average nutrient concentrations for manure, poultry litter has a nitrogen concentration three to six times higher than horses, depending on whether it is layer or broiler litter, respectively. Phosphorus concentration in poultry manure is about 12 times higher than horses, regardless of poultry type. Those differences are very conservative figures as the poultry litter nutrient concentrations account for bedding, whereas the horse manure nutrient concentrations do not include any bedding. Thus, actual nutrient concentrations from an equine manure pile would be much lower since it would include sawdust bedding.
To the best of our knowledge, the proposed project will be the first to look at groundwater contamination from equine manure stacked on somewhat poorly drained, silt-loam soils with SHWTs. Our hypothesis is that nitrogen and phosphorus are leaching from unimproved equine manure-stacking and polluting groundwater in somewhat poorly drained soils with SHWTs in southeastern PA.
If our hypothesis is supported by the data collected, then the research conclusions will have broader implications for agricultural operations throughout the Northeast US. Since horse manure is one of the least nutrient dense manures, we believe that groundwater contamination from manure stacking of similar manure types with less bedding (i.e., cow bedded-pack manure) or more nutrient dense manures (hog, poultry) could be assumed where there is unimproved manure stacking on similar sites.
Cooperators
- (Researcher)
- (Researcher)
Research
In February 2018, Bucks County Conservation District (BCCD) procured all equipment for the groundwater monitoring wells, soil sample collection and water sample collection.
Ground Water Monitoring Well Design & Installation
In March through April 2018, BCCD installed 12 wells on 4 cooperating farms, see Well-pictures. Three farms were equine, one was a beef operation. BCCD used 4” PVC well screen pipe with 0.010 inch slot openings, see the well-detail attached to this report. Each farm has 3 wells placed at the below locations:
- Directly at the manure stacking location
- Approximately 10 m upslope of the manure stacking
- Approximately 10 m downslope of the manure stacking
A motorized auger was used to help dig the holes for the wells. However, the motorized auger did not perform well if rocks were present in the soil. Likewise, at almost all well locations, a 4” hand auger to was required to complete the final depths required for the hole for the well.
Water samples were pulled a few days after well installation from 9 of the 12 wells. Each water sample was packaged in ice and mailed out to the lab the same day it was pulled. All samples arrived at the lab within 24 hours of sample pulling. Water samples were again pulled from all 12 wells in August for the summer sample and in the first week of December for the Fall sample.
Originally, four equine farms agreed to participate. At the time of well installation, the fourth equine farm decided to not participate. A beef operation was added as a participating farm at the end of April. The wells for the fourth farm did not have water in them during the remaining weeks of spring.
Soil Descriptions & Sampling
From each farm, soil sampling was done at all 12 well locations. Soil sampling locations were the same as the well locations:
- Directly underneath the manure stacking
- Approximately 10 m upslope of the manure stacking
- Approximately 10 m downslope of the manure stacking
For each of the above sampling locations, samples were collected from each soil horizon using a trowel. A 1-inch soil probe was used to collect soil samples. Several probes were conducted in order to get sufficient sample material. A soil description was recorded for each horizon according to standard NRCS procedures including horizonation, matrix color, texture, structure, and presence of redoximorphic features (type, size, amount, and color).
Below are the horizons that were found for each well location:
- A horizon - Vadose zone (unsaturated)
- B1- Vadose zone (if present)
- B2- Saturated zone (below the water table)
Within 24 hours of sampling, soil samples were laid out to dry in order to prepare them for shipping to the lab and to prevent nitrogen loss.
Using the same methods as described above, soil samples were again pulled from all 12 well locations in August for the summer sample and in the first week of December for the Fall sample.
Data Analysis
Both soil and groundwater samples have been analyzed by Penn State’s Agricultural Analytical Services Laboratory (AASL) located in University Park, Pennsylvania. BCCD and Delaware Valley University (DVU) have chosen specific analyses based on what will produce the most industry-familiar units of measure and thus more meaningful analysis.
Soil Analysis – the following analyses have been completed on all soil samples:
- Nitrate Nitrogen
- Ammonium Nitrogen
- Total Organic Nitrogen
- Mehlich (plant-available) Phosphorus
- pH
All three nitrogen analyses were completed in order to determine the dominant form of nitrogen in the soil and water. Each form of N has different chemistry, mobility, and environmental impact.
Mehlich P is the standard test for plant-available phosphorus across the state of Pennsylvania. Technicians working in the agricultural conservation and nutrient management sector are familiar with this unit of P measurement. They will have a baseline from which to compare our results.
Groundwater Analysis – the following analyses were completed on all groundwater samples: pH, total dissolved solids, nitrate-nitrogen, alkalinity, aluminum, iron, manganese, phosphorus, sulfate, and hardness. Although not originally planned in the proposal, ammonium, nitrogen was also added to the water sample analysis.
- Soils Descriptions, Well installations, and Rainfall
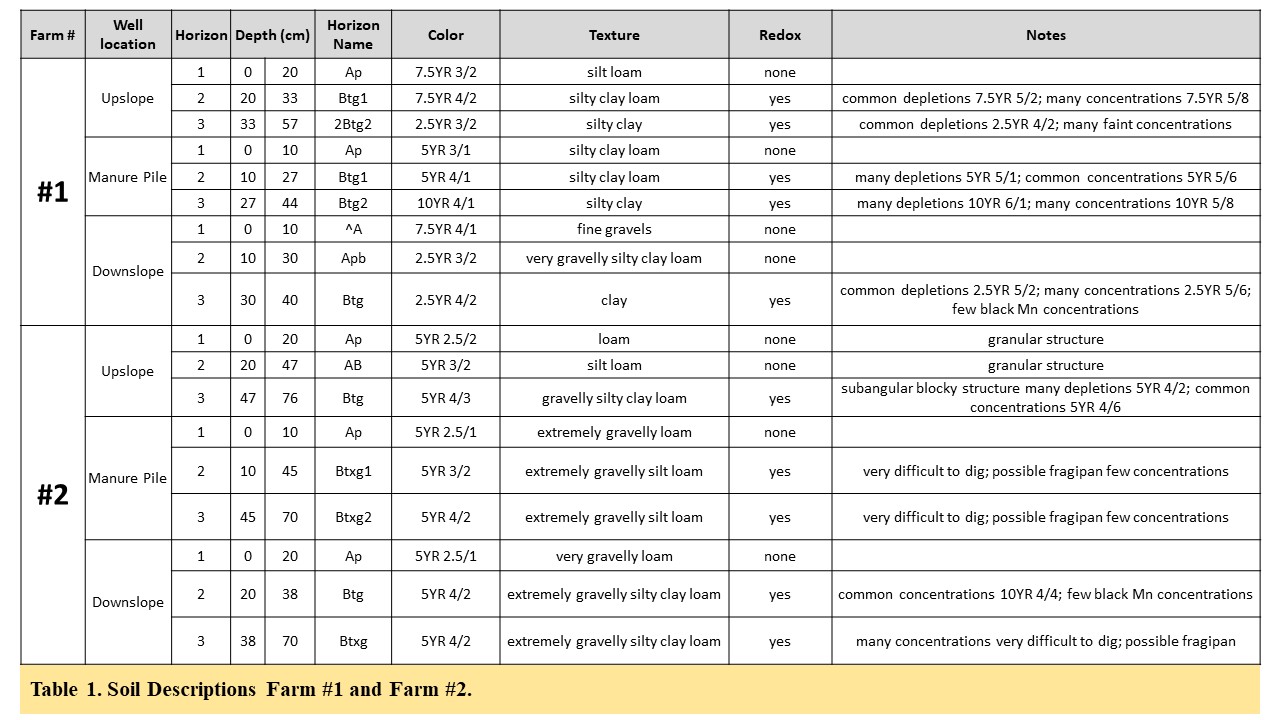
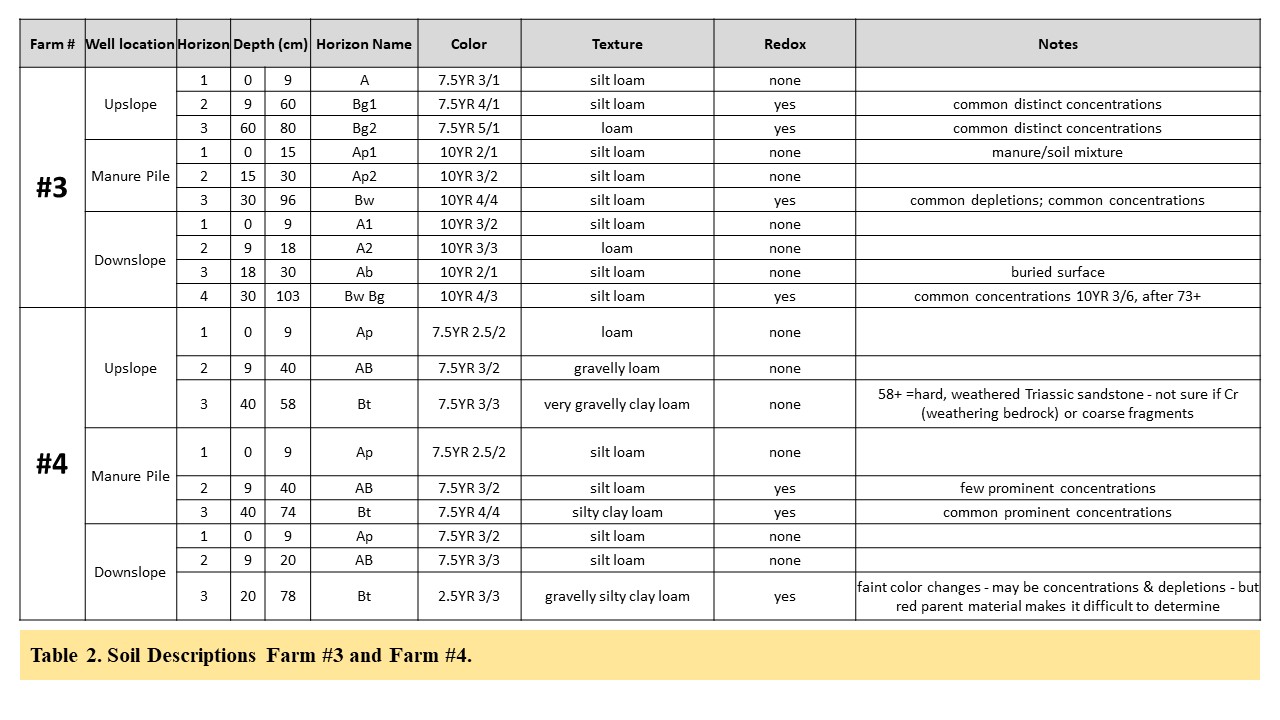
Soil descriptions were completed for all three sampling locations on each of the four farms (Tables 1 & 2). Presence of redoximorphic (redox) features indicates the presence of a seasonal high-water table (SHWT). Redox features were present at every sampling location except for the upslope sample site of Farm #4. However, water was always present at this site for the spring, summer, and fall sampling events. When water samples were taken, the sitting water in the well was baled and dumped. The water that refilled in the well was baled and collected as the sample. For the soil, three horizons were sampled at all twelve sampling locations, except the downslope site of Farm #3 with four horizons. For each of three sampling events, a total of 37 soil samples were collected.
Excavation for well installation was much more time consuming than originally anticipated. Heavy clay and channery soils made for difficult digging. However, water sampling with the 3" PVC baler was very easy. A bungee cord was attached to the baler to allow it to be lowered into and pulled back out of the well.
Farm #4 volunteered to participate in the program after the original Farm #4 fell through. BCCD was unable to get spring water samples post well installation on April 3, 2018. Spring water samples were pulled for this site April 4, 2019.
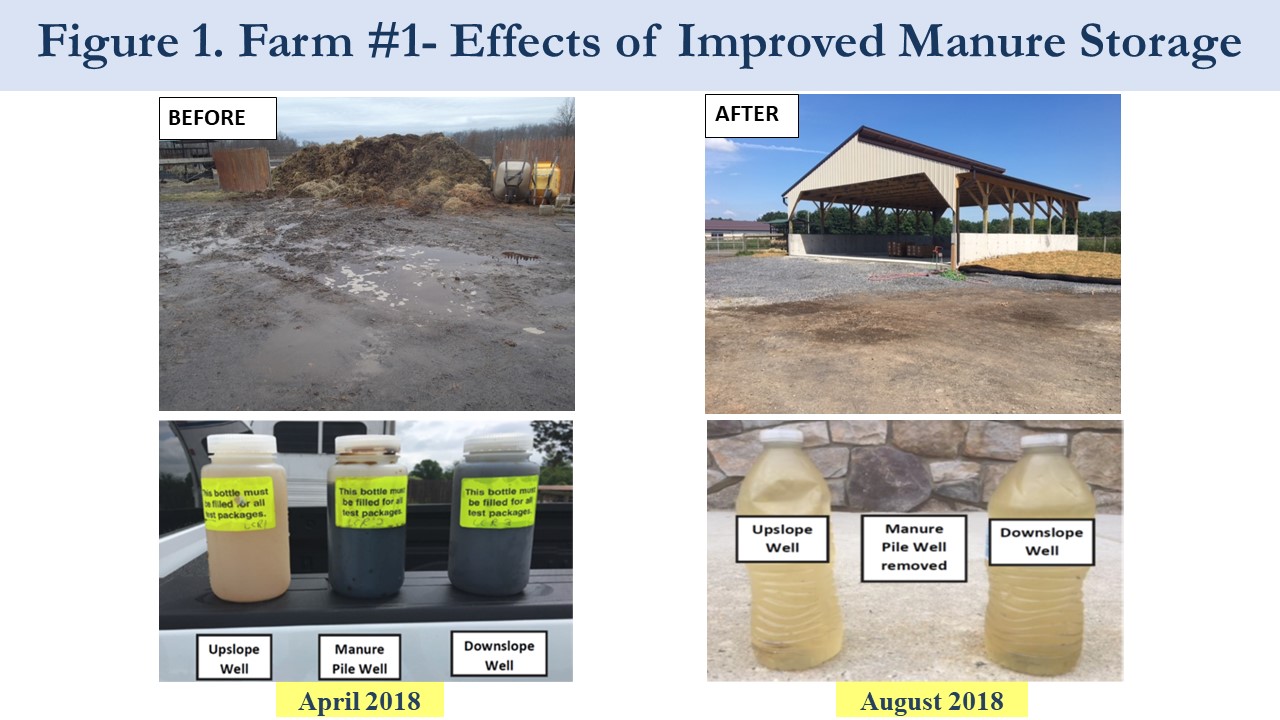
The color of the water samples due to the presence of leached organic matter varied dramatically from the upslope, manure pile and downslope wells. In June 2018, Farm #1 installed a concrete roofed stack pad at the location of the original, earthen manure stacking area. The well at the manure pile was removed just before construction. Roughly two months after completion of the roofed stack pad, water samples were collected from the upslope and downslope wells from Farm #1. The color difference in the downslope well sample from before and after the improved manure stack pad installation is quite apparent. (See Farm-1-Before-After photo). The analysis of nutrient contents from the April 2018 sample confirm the differences to be more than just color. Phosphorus in the downslope sample was 40 times higher than the upslope, and over 1200 times higher in the manure pile sample than the upslope. Ammonium in the downslope sample was 1.5 times higher than the upslope, and 220 times higher in the manure pile sample than the upslope.
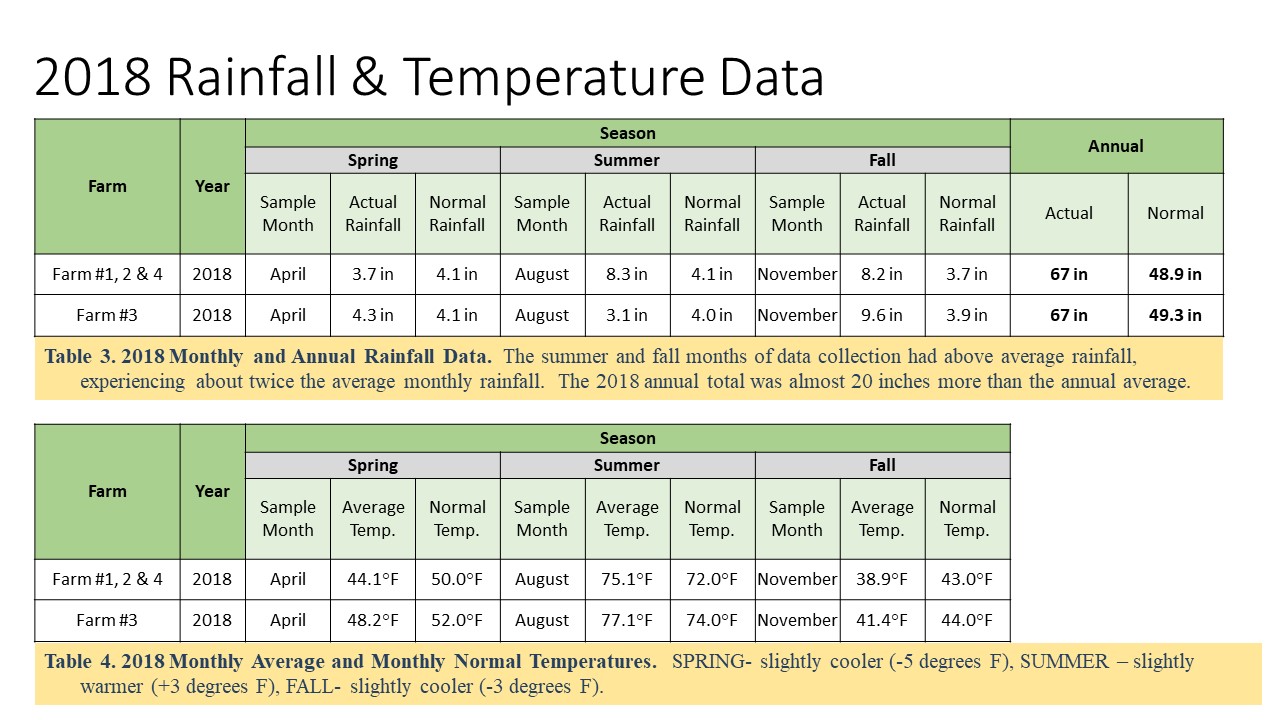
Due to the wet summer conditions, water was found in all 12 wells during the August 2018 water sample collection. As shown in Table 3, the data collection year of 2018 experienced above average rainfall. At the time of spring data collection, rainfall had been average. However, the summer and fall months of data collection had above average rainfall, receiving about twice the average monthly rainfall. As shown in Table 3, the month of August for Farm #3 was normal; however, it had twice the average rainfall in the previous month of July. The 2018 annual total precipitation was almost 20 inches higher than the annual average, representing a 27% increase. Sellersville weather station was used as the point of reference for Farms 1, 2, and 4. The Bensalem weather station was the point of reference for Farm 3.
Unlike the rainfall for 2018, the temperature for the three seasons was normal. As shown in Table 4, the spring was slightly cooler, summer slightly warmer, and fall slightly cooler.
- Data Analysis
Through the fall and winter of 2019, data analysis was completed for the project. To evaluate statistical significance of the soil and water data, Dr. Bourgault ran a one-way ANOVA test and a Tukey Honest Significance Difference (Tukey HSD). With only four farms and a one-year data-collection timeframe, the study had a very limited data set. When running the ANOVA/ Tukey HSD, all data points from all four farms and from all three seasons were combined when evaluating the significance of a single variable. The results are aggregated below by soil data results and water data results.
- SOIL DATA – See Graphs 1-5 for soil data.
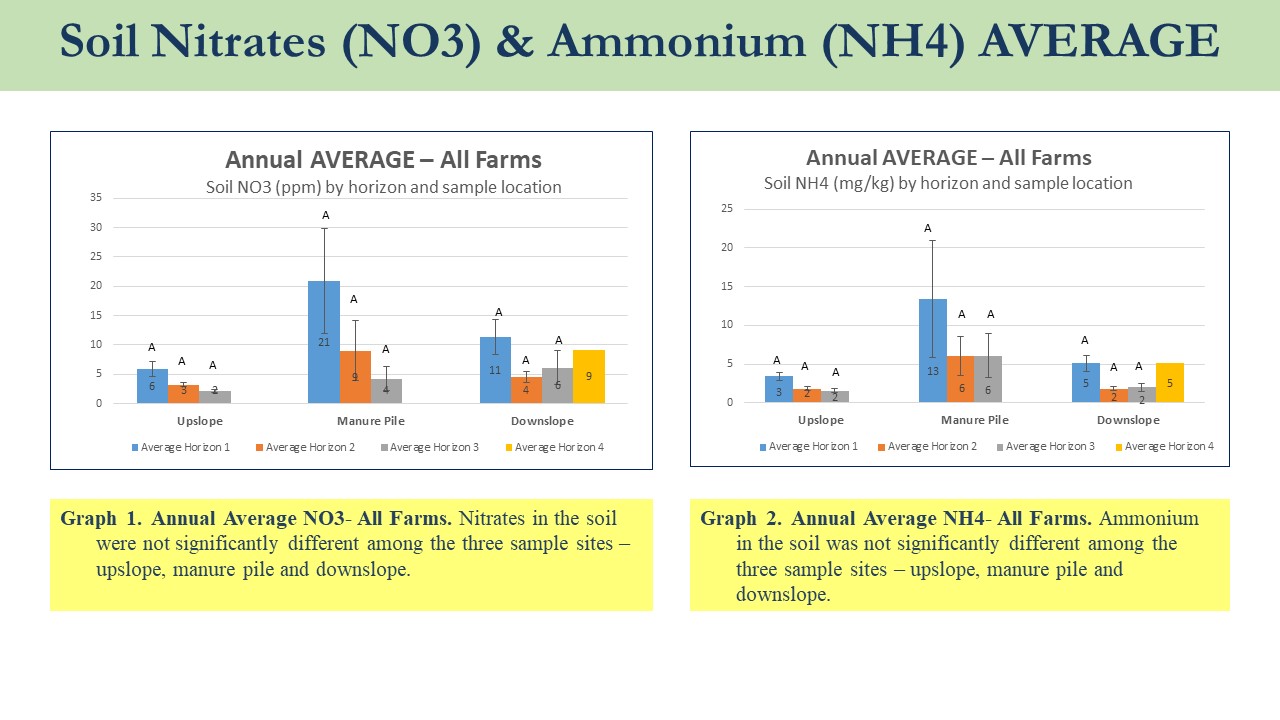
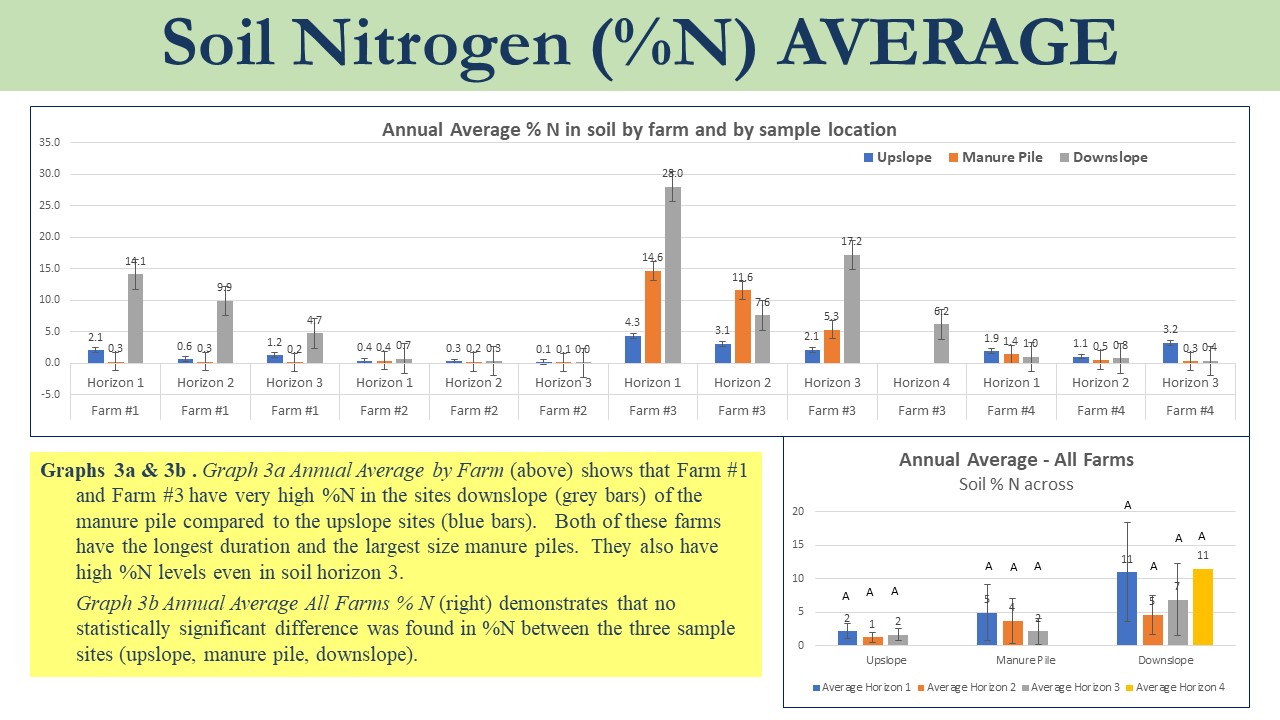
- NITROGEN –The graphed results and the statistical analysis of all three of the soil-nitrogen analyses (nitrates, ammonium and % nitrogen) did not yield consistent and significant differences between the upslope, manure pile and downslope sites. Possibly, denitrification under reducing conditions was responsible for removing any excess N caused by manure contamination.
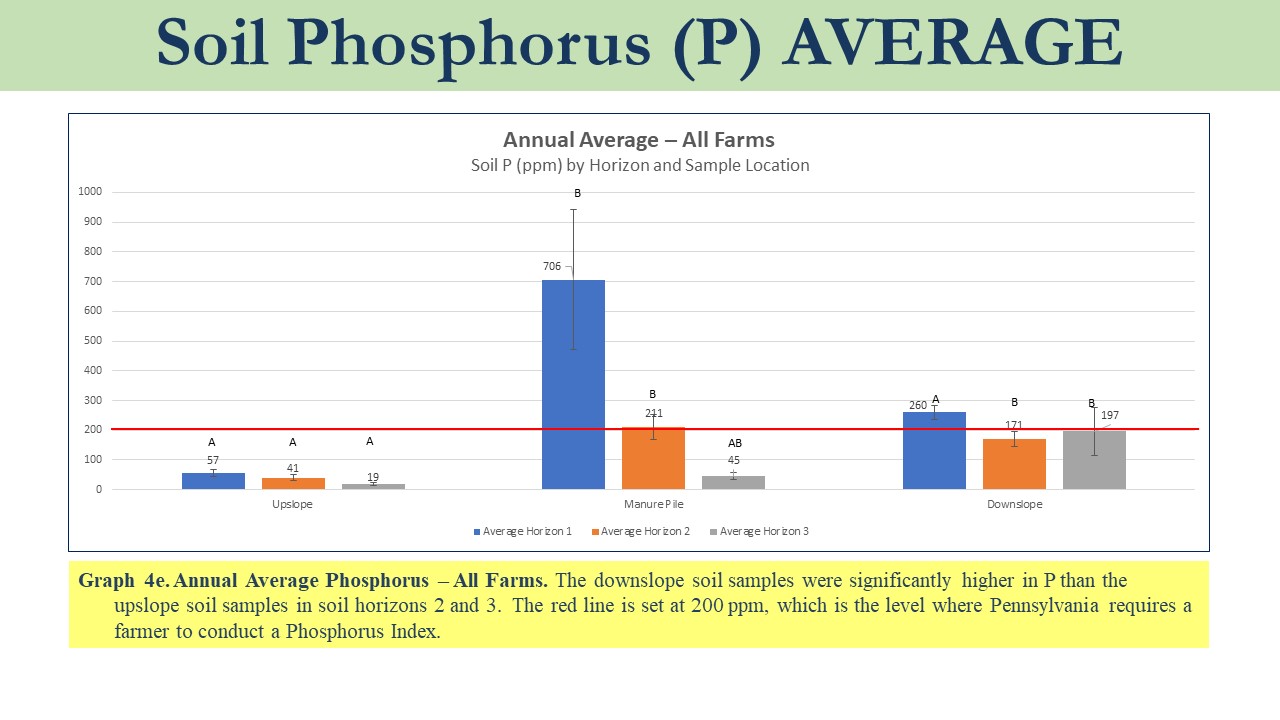
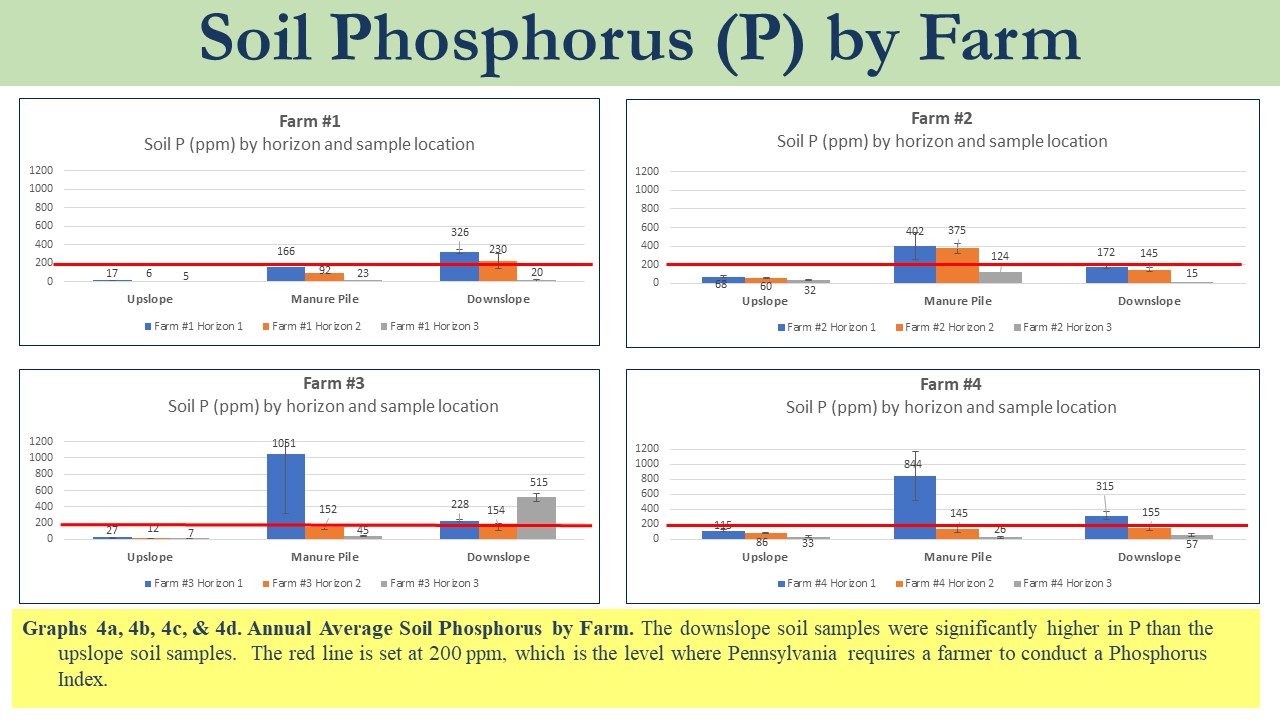
- PHOSPHORUS- Taking the average of all farms and seasons, the phosphorus in soil horizon 1 of the downslope sample site was five times higher than the upslope sample. However, per the statistical analysis, the phosphorus in the downslope sample sites were significantly higher than the upslope only within soil horizons 2 and 3. The average phosphorus in horizon 2 of the downslope site was over 4 times higher than the phosphorus in the upslope control. The average phosphorus in horizon 3 of the downslope site was 10 times higher than the phosphorus in the upslope control. The statistically significant increase in soil P in the lower soil horizons may indicate the lateral movement of phosphorus with shallow groundwater.
- In Pennsylvania, crop fields with over 200 ppm phosphorus are required to run a P-Index to evaluate suitability for manure application. Soil with over 200 ppm P is considered in excess of crop phosphorus needs, and an indicator that too much manure was applied in previous years. Three out of the four farms had downslope soil samples with over 200 ppm P, despite these areas not receiving direct land manure application. The high phosphorus could be from a combination of surface flow from the manure pile and lateral movement through the shallow groundwater.
- Phosphorus and redox features – Phosphorus tends to be less mobile than N in soils, and its dominant mode of transport is through soil erosion. However, under anerobic conditions, phosphorus becomes more mobile. If the SHWT is present for more than a week during the growing season, the soil environment tends to become anerobic, and form reducing conditions. During the reducing conditions, iron oxides dissolve, releasing the phosphorus that was adsorbed to them. All of the sample sites on all four farms were located on soils with SHWTs, evidenced by the presence of redoximorphic features. Thus, a significant amount of P could have leached into the shallow groundwater under the observed conditions.
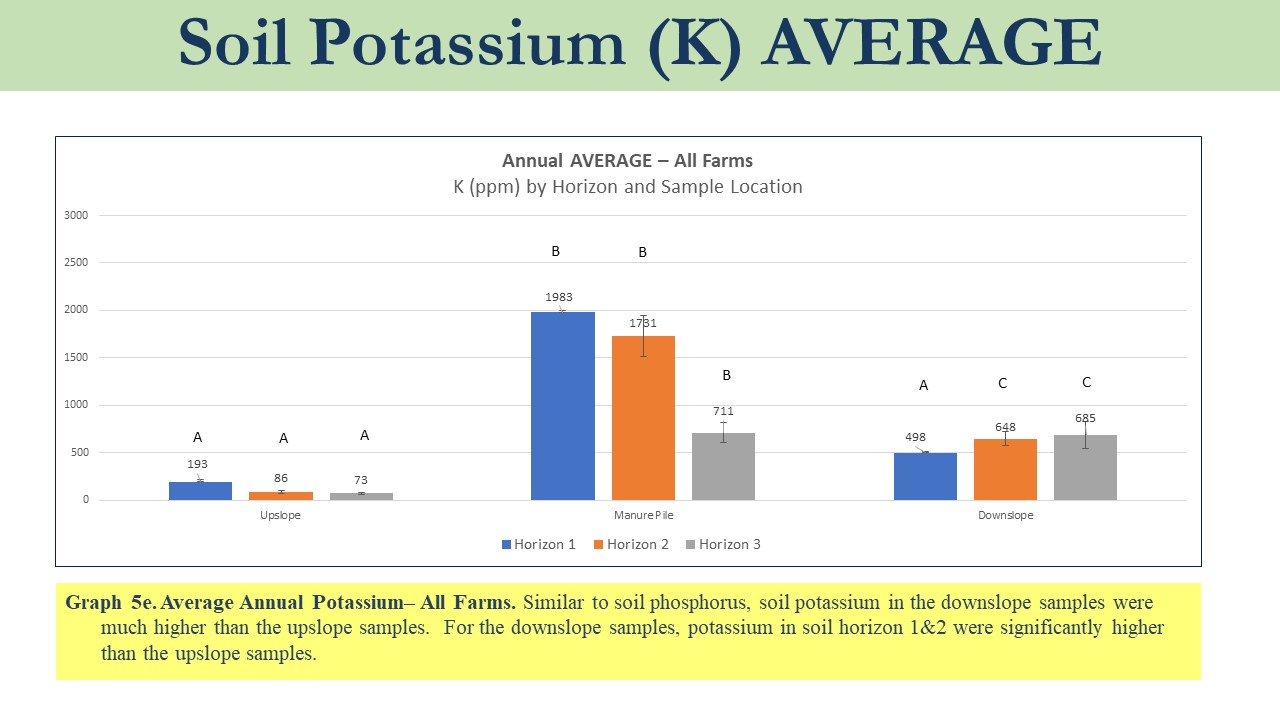
- POTASSIUM – Due to the more mobile nature of phosphorus in soils with SHWT, BCCD also analyzed potassium as another marker for manure contamination. Potassium is not a known water pollutant, but manure is high in potassium. As shown in Graph 5e, looking at the average of all farms and seasons, the potassium in soil horizon 1 of the downslope sample site was 2.5 times higher than the upslope sample. The average potassium in horizon 2 of the downslope site was 7.5 times higher than the upslope control. The average potassium in horizon 3 of the downslope site was 9 times higher than the upslope control. The potassium levels in soil horizons 2 and 3 were significantly higher that potassium levels in the corresponding upslope soil horizons. Higher potassium in the lower soil horizons of the downslope samples mirrors the soil phosphorus trends, supporting the premise that nutrients are moving laterally through the SHWT.
- WATER DATA – See Graphs 6-13 for water data
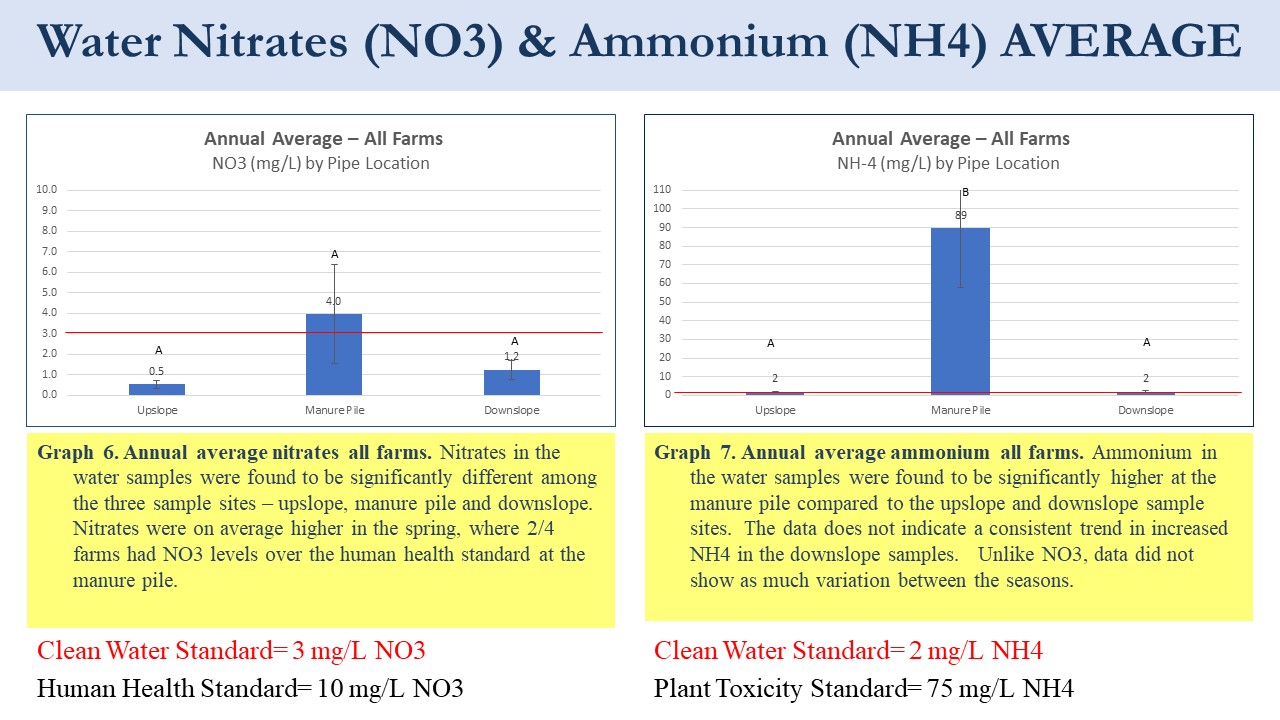
- NITROGEN –The graphed results and the statistical analysis for both of the water-nitrogen analyses (nitrates and ammonium) did not yield significant differences between the upslope, manure pile and downslope sites. Possibly, denitrification under reducing conditions was responsible for removing any excess N caused by manure contamination.
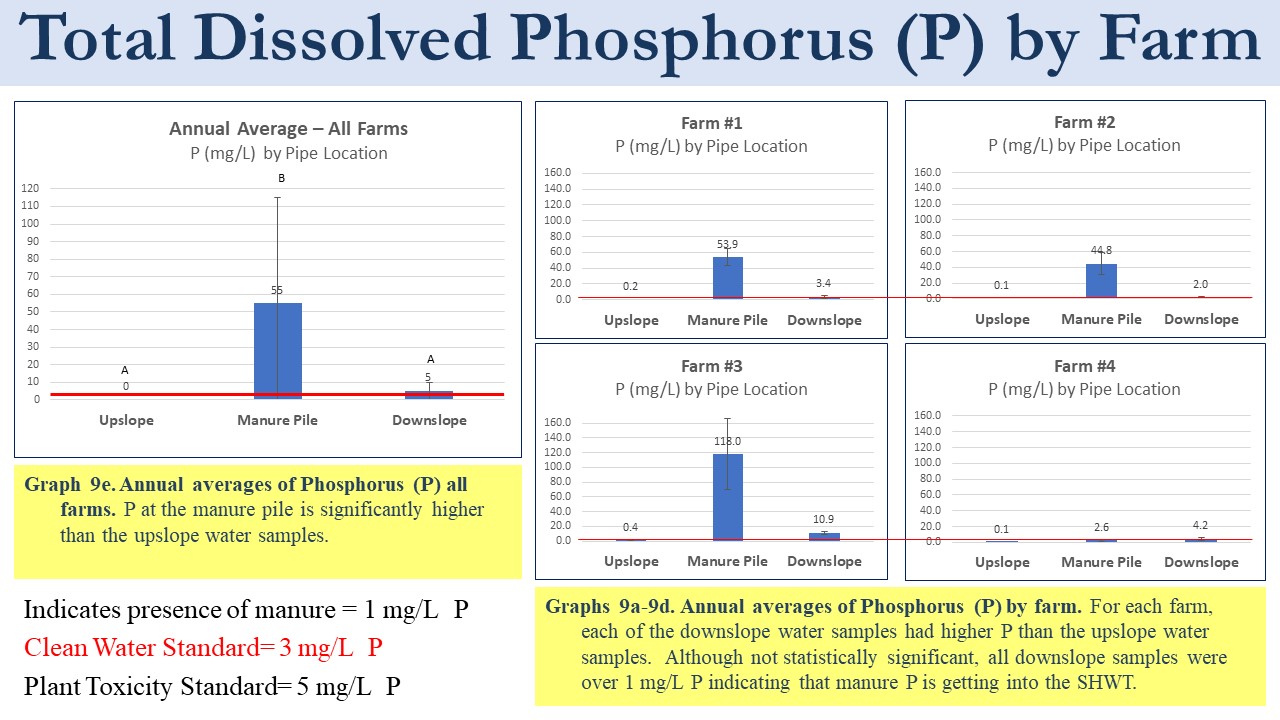
- PHOSPHORUS- For each farm, the downslope water samples had higher P than the upslope water samples, ranging from 15 to 30 times higher P. Although the difference between the upslope and downslope samples was not significant, all downslope samples were over 1 mg/L P, indicating contamination from manure or fertilizers. Since commercial fertilizer was not spread on the downslope areas, manure was the likely contamination source. The statistical analysis showed the P at the manure pile sample to be significantly higher than the upslope and downslope samples.
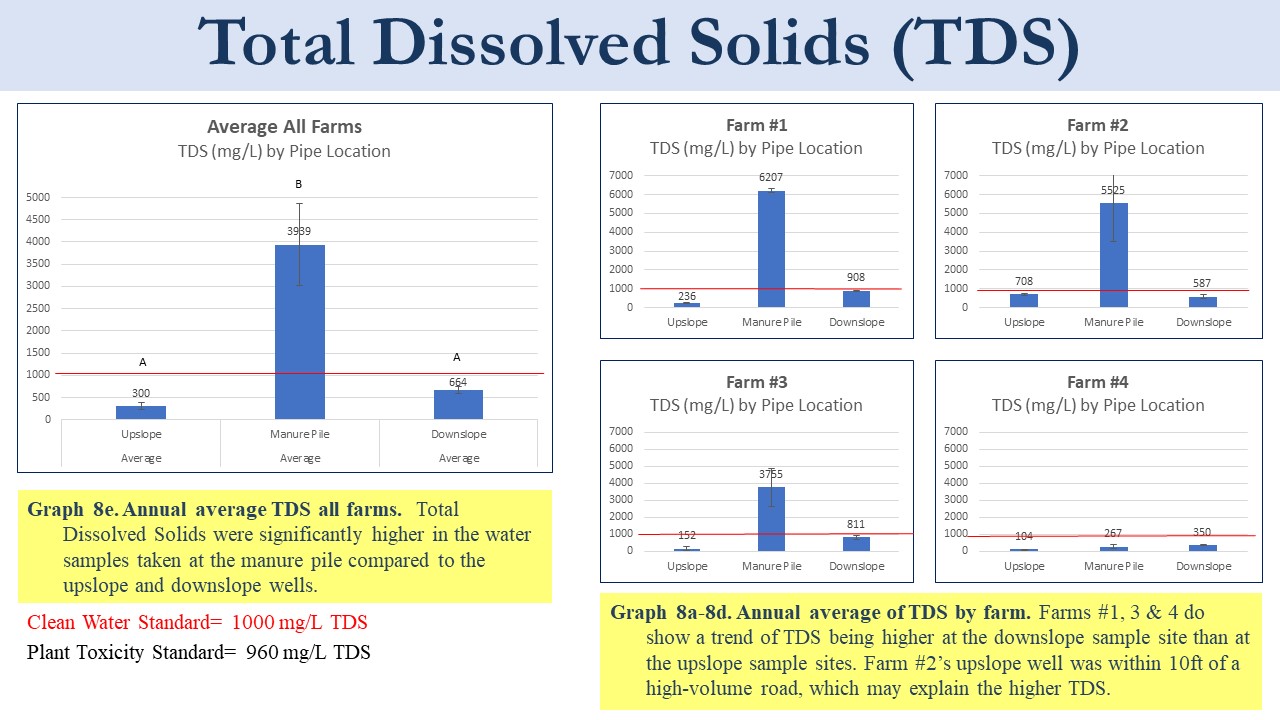
- TOTAL DISSOLVED SOLIDS - Farms #1, 3 & 4 show a trend of higher TDS at the downslope sample site than at the upslope sample sites. It is not clear why the upslope sample from Farm #2 had higher TDS than the downslope sample. One possibility is the upslope well’s proximity to the road (it is only 10 ft away from the edge of a high volume road). The statistical analysis found that TDS levels were significantly higher in the water samples taken at the manure pile compared to the upslope and downslope wells.
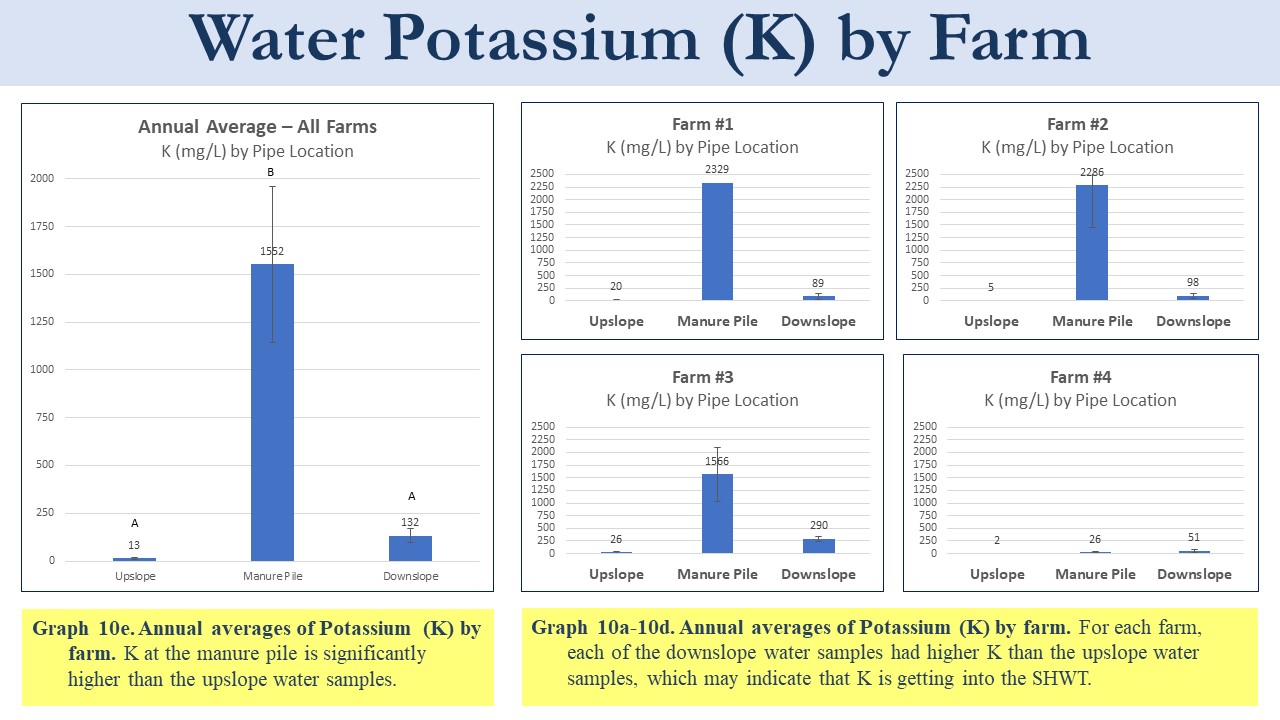
- POTASSIUM – As stated in the soil data portion, potassium is being evaluated as evidence for manure contamination even though it is not a priority water quality concern. For each farm, each of the downslope water samples had higher K than the upslope water samples, which indicate that K is being mobilized into the shallow groundwater. The downslope samples had K values 11 to 20 times higher than the upslope samples. The statistical analysis found that K levels were significantly higher in the water samples taken at the manure pile compared to the upslope and downslope wells.
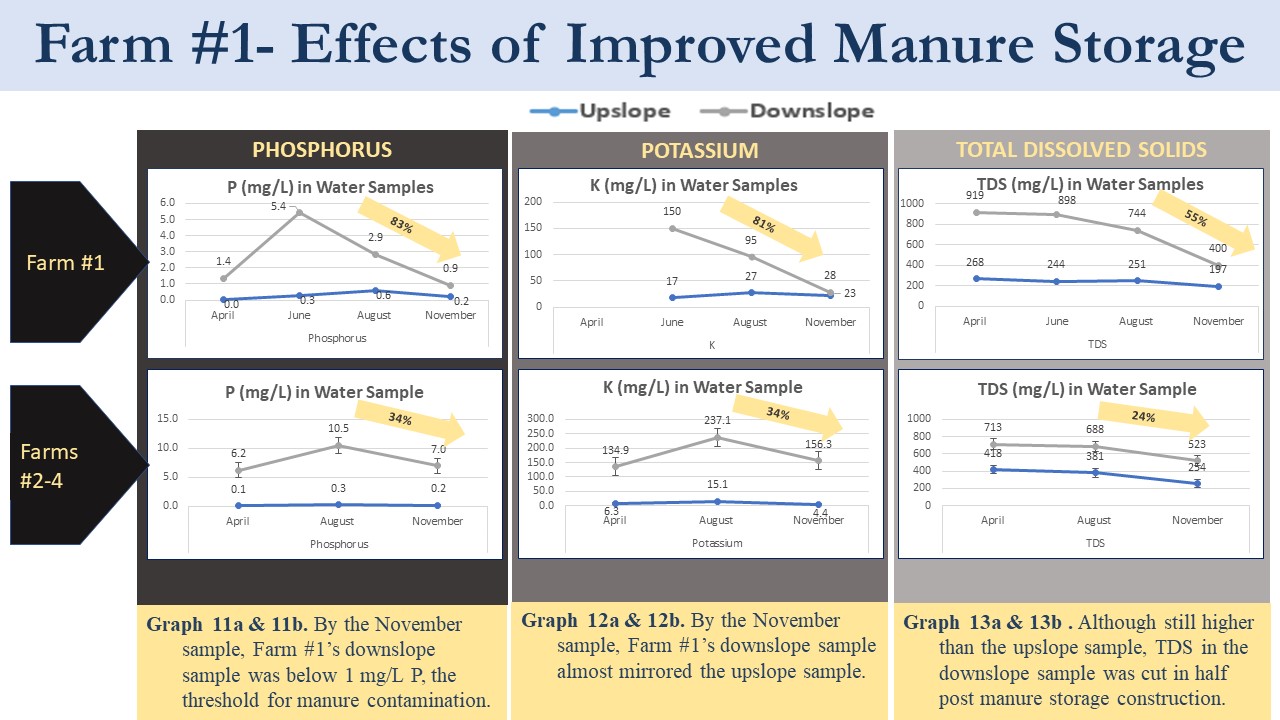
A Roofed Manure Storage was constructed on Farm #1 in June 2018. Water samples were also collected in June, just prior to construction. Graphs 11-13 display the quantities of Phosphorus (P), Potassium (K), and Total Dissolved Solids (TDS) by sample date for Farm #1 and the average quantities of the same nutrients for Farms 2-4. Due to very high values at the manure pile samples, only upslope and downslope samples are graphed.
Graphs 11-13 illustrate the % reductions in Farm #1 compared to Farms #2-4. Reductions from Farm #1 were calculated by comparing the June and November samples since June was the last sample before the storage was constructed. Reductions from Farms #2-4 were calculated by comparing the August and the November samples. Seasonal reductions in P, K and TDS were observed in water samples from all four farms between the summer and fall samples. However, Graphs 11-13 indicate that the % reductions were higher in Farm #1 than for Farms #2-4.
Phosphorus- Farm #1’s November downslope sample had 0.9 mg/L P, just under 1 mg/L, the threshold for contamination from manure or fertilizer. For Farms #2-4, all November downslope P values still indicate manure contamination.
Potassium- K levels in Farm #1’s November downslope sample was almost the same as the November upslope sample. All of the other farms’ November downslope samples showed K values higher than the upslope sample. K values from the downslope samples from Farms #2-4 were 89, 22, and 70 times higher than the upslope samples K values respectively.
Total Dissolved Solids- Farm #1 showed a 55% reduction in TDS post manure construction, whereas the other three farms showed on average a 24% seasonal reduction in TDS.
Five months after installation of the improved manure storage, water quality in the downslope well was close to the upslope levels. The quick turnaround in the groundwater quality may indicate the increased groundwater flux caused by excessive rainfall.
The project aimed to quantify to what degree manure nutrients move down gradient through shallow groundwater. BCCD completed all soil and water samples and analyses per the project scope.
For the soil samples, phosphorus and potassium levels were significantly higher in the downslope sample sites than the upslope sample sites. If manure surface runoff was just moving downslope via surface flow, nutrient increases would be limited to the top soil horizon. However, it was the lower soil horizons, where the significant increases in phosphorus and potassium were observed. Increased nutrients in the lower soil horizons indicate that nutrients are moving through the seasonal high-water table.
For the water samples, phosphorus, potassium and total dissolved solids were all higher in the downslope sample sites compared to the upslope sample sites. However, these parameters were found to be statistically significantly higher only at the manure pile site. Yet, the downslope water samples for all four farms had phosphorus levels ranging from 2 to 11 mg/L. For phosphorus, any value over 1 mg/L indicates manure contamination. All upslope phosphorus water samples were between 0.0 to mg/L BCCD feels that with longer data collection, statistical significance
Nitrogen analysis of both soil and water samples did not show consistent trends across farms. It’s possible that denitrification was actively removing N from soil and groundwater under reducing conditions.
Groundwater quality showed a quick, positive response with the implementation of a manure storage system. We did not anticipate seeing such drastic reductions in phosphorus, potassium and total dissolved solids in a five-month period. The quick improvement may indicate the degree that excessive rainfall causes a flushing effect of the nutrients downslope. This flushing effect is a positive concerning the impact of manure stacking improvements, but it also demonstrates a constant movement of nutrients into the groundwater system with each rain event.
Education & outreach activities and participation summary
Participation summary:
BCCD conducted four consultations presenting the results of the SARE grant. They are listed in chronological order below:
- Penn State Nutrient Management Consult: BCCD shared the results with Penn State’s nutrient management program director. As discussed in the Project Outcomes section, a big outcome of these discussions was the incorporation of the results into Penn State’s nutrient management trainings.
- Participant Farm Consultations: BCCD circled back to three out of the four farms to share with them their farm-specific results and the overall findings. Farm #1 improved their manure stacking area during the data collection year. However, learning that their downslope well was below the phosphorus manure contamination just five months after manure storage construction reaffirmed their commitment to conservation work on their farm.
Before the study, Farm #3 was skeptical about their manure nutrients getting into the downslope stream. Both the sampling events and the final consultation provided them with the evidence they needed to understand the connectivity. Farm #3 is an applicant for a DEP-funded conservation grant to improve it’s manure stacking area.
Farm #2 and Farm #4 were both surprised by the higher nutrient values in the downslope wells. However they are not yet ready to commit to invest in manure stacking improvements at this time.
BCCD has conducted 5 presentations educating farmers and conservation service providers on the SARE study and results. They are listed in chronological order below:
- DEP's Quarterly Roundtable Meeting: On June 12, 2018, BCCD presented the rational and project design for the SARE grant studying effects of manure stacking on soils with seasonal high water table at Pennslvania's Department of Environmental Protection's (DEP) quarterly Roundtable Meeting. Regional DEP and conservation district staff from 5 counties, 25 participants in total, attended the event. BCCD connected the grants to Pennsylvania's manure management regulations (Chpt 91/ Act38).
- Bucks County Conservation District's March Board Meeting: The Agricultural Conservation Technician presented the major findings from the SARE grant to 15 conservation professionals and 4 farmers.
- Penn State's Pesticide Update Meetings (two): BCCD presented the major findings from the SARE grant to 80 farmers, and one extension agent, at two separate training events in February 2020. BCCD had participants complete evaluations at both of these events (see Learning Outcomes section).
- Regional Conservation District Agriculture Conservation Meeting: BCCD joined three other neighboring conservation districts to host an agricultural conservation meeting in March 2020. BCCD incorporated the major results from the SARE grant into its manure conservation presentation. Eighteen farmers and 5 conservation staff attended.
The farmer evaluations from the Penn State Pesticide Meetings had questions on both the clarity of information presented, as well as the level of detail provided. BCCD used the completed farmer evaluations to develop a farmer-audience brochure showcasing project results. For the conservation-audience brochure, BCCD’s watershed specialist and district manager, both non agricultural staff, reviewed the brochure for clarity amongst a conservation audience.
Brochure 1 Audience - Agricultural Conservation Staff - Front & Inside
Brochure 2 Audience- FARMER- Front & Inside
BCCD has produced 1000 farmer audience brochures and 750 conservation staff brochures. BCCD will distribute farmer brochures at its recurring farmer outreach events. BCCD will distribute the conservation staff brochures to PA’s State Conservation Commission, PA DEP, conservation districts, watershed associations, municipalities, and municipal environmental advisory committees.
Below is a list of future outreach that will continue after the grant’s end:
- National Fish & Wildlife Foundation's (NFWF's) Delaware River Basin Agricultural Roundtable – A NFWF March 2020 workshop was cancelled due to Covid-19. NFWF is now hosting this conference as a May 2020 webinar. BCCD will be presenting the SARE results to various agricultural stakeholders within the Delaware watershed.
- Penn State Nutrient Management Manure Nutrients Training – as mentioned in the project outcomes section, PSU will present the SARE results during their Manure Nutrients Training, occurring twice a year.
- Future BCCD events - BCCD is routine speaker at Delaware Valley University’s soils and ag wastes classes, equine seminars, and various farmer events. BCCD will continue to inform farmers and community members of the sensitivity of SHWTs to manure stacking.
Learning Outcomes
Below is the farmer evaluation and results. Eighty farmers completed the evaluation. Questions 1 & 2 dealt with increased awareness of SHWTs and how manure nutrients enter groundwater. A majority of farmers, 58% and 61% respectively, responded that they had greatly increased awareness.
Participant EValuations TABULATED
Questions 3 & 4 were to help evaluate the presentation clarity and depth of information presented in order to support the brochure development.
Question 5 was a skills questions - Did the presentation improve your ability to evaluate the effects a, earthen manure stacking area may have on groundwater? 55% of farmers responded that the presentation greatly increased their ability.
Question 6 asked about behavior change, or willingness to make manure stacking improvements. The three options are Not At All, Open To It , or I’ll be calling Rachel. Rachel refers to the presenter, Rachel Onuska, who’s been the Agricultural Conservation Technician for seven years. “Calling Rachel” implies scheduling a farm visit to begin the planning and design process for improved manure stacking. NA refers to farmers who do not have livestock. Of those with livestock, 48% said that they were open to making changes to their manure stacking.
Also, as indicated in the consultations from the education/outreach section, the participant farmers also reported increased knowledge and attitudes. Seeing the difference in color from the upslope and downslope sites was a strong teachable moment. BCCD is still working on two of the four farms to take the next step towards behavior change and install improved manure stacking areas.
Project Outcomes
BCCD has coordinated with Penn State’s Nutrient Management Program to incorporate the results into their Act 38 Nutrient Management trainings. In Pennsylvania, all private and public sector employees who write or review nutrient management plans for Concentrated Animal Operations (CAOs) are required to be certified. The certification process includes required attendance at six Penn State sponsored nutrient management trainings. Penn State has committed to including the results from this study, via four power point slides, in the Managing Manure Nutrients training. They will also cite results from the study during the Animal Concentration Area (ACA) & Manure Storage training, an in the field training that demonstrates things to look for when evaluating adequacy of ACAs and manure storages. On average, these trainings reach 45 public and private agricultural conservation agents every year.
The grant allowed BCCD to establish a working collaboration with Penn State. Previously, Penn State's nutrient management program's collaboration with conservation districts, or at least with Bucks County's conservation district, was a one-way knowledge exchange channel. Penn State would share nutrient management technical information to conservation districts. However, the SARE grant provided an opportunity for a local conservation district to share information to Penn State's nutrient management program, for greater dissemination throughout the state.
Also, in November 2019 BCCD submitted a proposal for Pennsylvania DEP’s Growing Greener program to provide cost assistance for Farm #3 and another similar equine operation with a SHWT to improve their manure stacking areas. BCCD was able to cite quantifiable nutrient loading caused by the manure stacking areas as a result of the study.
BCCD is still working on linking Farm #2 and Farm #4 to cost-assistance programs for improving their manure stacking.
In addition to farmer learning and behavior change outcomes, the grant allowed for primary learning amongst BCCD and other field-level conservation staff. BCCD’s ag conservation technician, has repeatedly alluded to the results of this study during farm visits. SHWTs are the dominant soil condition for Bucks County farms. Prior to the grant, there was no information on how manure and SHWTs interacted, making discussion on manure regulations difficult. The grant has given BCCD a local, evidence-based talking point to sell conservation, specifically improved manure stacking, to farmers.
Although the study was small-scale and short-duration, it does indicate trends of manure nutrients moving laterally along a SHWT. However, to reach a statistically significant conclusion, longer trials would be needed. Also, Farm #1’s quick response in water quality following manure storage construction also supports the need for further study. If the SHWT moves quickly downslope in response to excessive rains, it also indicates that manure nutrients quickly move downslope after excessive rains.
If replicated, BCCD recommends the following changes to the experimental design:
- Given the transient nature of nitrogen and the added nitrogen-analysis cost, it may not be the best use of resources to include nitrogen analysis. Phosphorus, potassium, and total dissolved solids would be sufficient variables to illustrate manure contamination and would not incur higher soil analysis costs.
- Adding more groundwater monitoring wells downslope, along the same elevation, would allow for a “plume” analysis of contaminants. A plume analysis would enable modelling of the amount of nitrogen and phosphorus these manure piles add to surface waters each year.
- A principal objective of the study was to evaluate to what degree the SHWT acts as a channel for nutrients to move towards surface waters. The high nutrients values in both soil and water samples at the manure pile did not add a lot of value to the study’s principal objective. Sampling only upslope and downslope of the manure pile could be sufficient to further demonstrate if nutrients from the manure pile are moving downslope through the SHWT.