Final report for ONE20-363
Project Information
Johne’s Disease (JD) is a common disease in the dairy industry caused by the bacteria Mycobacterium avium subspecies paratuberculosis, causing diarrhea, weight loss and subcutaneous edema in cows, allowing for a more accurate diagnosis based on clinical signs. Clinical signs in small ruminants are more nonspecific and frequently the only sign is weight loss, which can be difficult to differentiate from other common ailments such as parasite infections. While studies from other countries indicate that JD is a widespread problem with a significant economic impact, there is no prevalence data for small ruminants in the US. This project conducted JD surveillance and determined prevalence in goat herds in Northern New York. The project used blood ELISA testing, fecal culture and PCR test results as data points and utilized the New York State Sheep and Goat Health Assurance Program (NYSSGHAP) to aid with on farm data collection and one-on-one farmer outreach and education. This project allowed us to better characterize prevalence of disease in the region using Bayesian Statistical Modeling. Outreach for this project included presentations across the state by NYS Department of Agriculture and Markets field veterinarians at continuing education events along with discussion at other NYSSGHAP meetings with individual producers. Cornell Cooperative Extension livestock educators were able to present the results at sheep and goat meetings directed at producers, one of which was recorded and posted online for wider distribution. A one page factsheet and a power point handout have been posted as instructional resources.
This project conducted Johne’s Disease (JD) surveillance and determined prevalence in goat herds in Northern New York. This project allowed further study of JD present in the area, and allowed farmers to have a better understanding of the disease in goat herds. Data was extrapolated from blood ELISA testing, fecal culture and PCR test results. Based on phase one of the project focusing on JD in sheep, we have shown that JD is widespread in the region. This project allowed us to better characterize prevalence of disease in the region using Bayesian Statistical Modeling. This statistical method allowed us to factor in the three different tests and their respective specificities and sensitivities to determine a more accurate prevalence for the region. The benefit to farmers was to heighten awareness of the presence of infection in the region, and to gain assistance with management and biosecurity relating to JD. As for farmers not in the locale, this project will not only further characterize the prevalence of JD in the Northeast; but in the US since no other studies have been done pertaining to prevalence of JD in small ruminants here.
Johne’s Disease (JD) is a common disease in the dairy industry caused by the bacteria Mycobacterium avium subspecies paratuberculosis, causing diarrhea, weight loss and subcutaneous edema in cows, allowing for a more accurate diagnosis based on clinical signs. Clinical signs in small ruminants are more nonspecific and frequently the only sign is weight loss (Pugh, 2002), which can be difficult to differentiate from other common ailments such as parasite infections. While there is significant research on JD in bovines, research into the prevalence and significance of this disease in ovines and caprines is minimal. Estimations of prevalence of JD in the sheep and goat population of Ontario, Canada in 2010 estimated that 86% of dairy goat herds and 66% of dairy sheep flocks have animals infected (Bauman, et al, 2016). Similarly, Cyprus showed a prevalence of almost 50% of goat herds and 61% of sheep flocks to be infected (Liapi, et. al., 2013). These numbers are similar to the 70% of herds estimated with JD in the dairy industry in the United States (USDA-APHIS-VS, 2008) but there is no prevalence data for small ruminants in the US (Collins, 2011).
The economic impact is not well quantified, but in Italy the presence of the JD in dairy sheep and goat farms decreased profit efficiency by up to 20% due to impacts on feed efficiency, veterinary care and labor (Sardaro, et. al., 2016). This is supported by studies showing that vaccination for JD results in a significant increase in body condition scores (Huttner, et. al., 2012) and consequently, profitability (Gautam, et. al., 2017). There is no vaccine for sheep and goats approved approved in the USA. Some studies find that JD can decrease fertility (Kostoulas et al., 2006c) which can also decrease profitability. Clinical JD was found to be associated with production losses associated with lower live weight, fleece weight and fewer lambs born, with a 46% reduction in productivity (Morris, et. al., 2006). In New Zealand, animal deaths confirmed to be JD were 0.6 years younger than animals dying from other causes (Gautam, et. al., 2017).
Johne’s disease is spread through fecal-oral transmission from infected adults to susceptible neonates (Whittington and Sergeant, 2001). Modern bovine dairy operations adjust management to protect the newborn calf from JD by quickly removing the calf to a manure free location (Windsor, 2015). However, many sheep and goat farms do not remove newborns from adults. They also utilize pasture, where the organism can be spread via ingestion of contaminated forage (Sweeney, et. al., 2012). Testing for JD is less commonly done where the economic production value of the animal is too low to justify the cost. Our goal was to do surveillance testing in Northern New York as a representative region which can be compared to surveillance in Ontario, Canada. Through partnership with (New York Department of Agriculture and Markets) NYSDAM, farmers were able to participate in testing to help determine risk of JD in their herd, develop management strategies to reduce future risk and control the infection if present.
Cooperators
- - Technical Advisor
- - Producer
- - Technical Advisor (Educator and Researcher)
- - Technical Advisor (Educator and Researcher)
- - Producer
Research
This phase of research focused on the goat herds of Northern New York as this is a growing segment of the small ruminant industry in the region. In the last 2 years, 60 farmers met in the area to work on developing a market for goat dairies. This is also seen by looking at the 11% increase in the goat inventory of New York from 2019 to 2020 (USDA, 2020), one of the highest increases in population percentage in the country. A survey of goat herds (both dairy and meat) in Lewis, Jefferson, St. Lawrence, Franklin, Clinton and Essex Counties was distributed to herds identified by Cornell Cooperative Extension, NYS Department of Agriculture and Markets and collaborating veterinarians with an interest in small ruminant health. The region was chosen in order to better compare infection prevalence in sheep done in 2019 to the corresponding level in goats. The survey screened for patterns of high risk of contagious diseases, such as JD, due to movement of animals from other farms, known infected animals, and/or animals with signs of “fading.” The study was designed to identify 22 herds where 15 animals over the age of two could be sampled. However, our survey found that there were not enough herds in the region with a minimum of 15 animals over two years old interested in participation. As a result, the threshold for inclusion was lowered in order to attempt to reach the goal of 330 animals included in the study. Farms with under 10 animals over 2 and interested in participating were enrolled in NYSSGHAP and included and herds with under 10 animals over the age of 2 but who were already enrolled in the NYSSGHAP program were also included in order to increase efficiency of sample collection. Herds with more than 15 animals over the age of 2 could randomly select up to 20 animals for sampling (random selection performed by the veterinarian in order to remove any risk of bias).
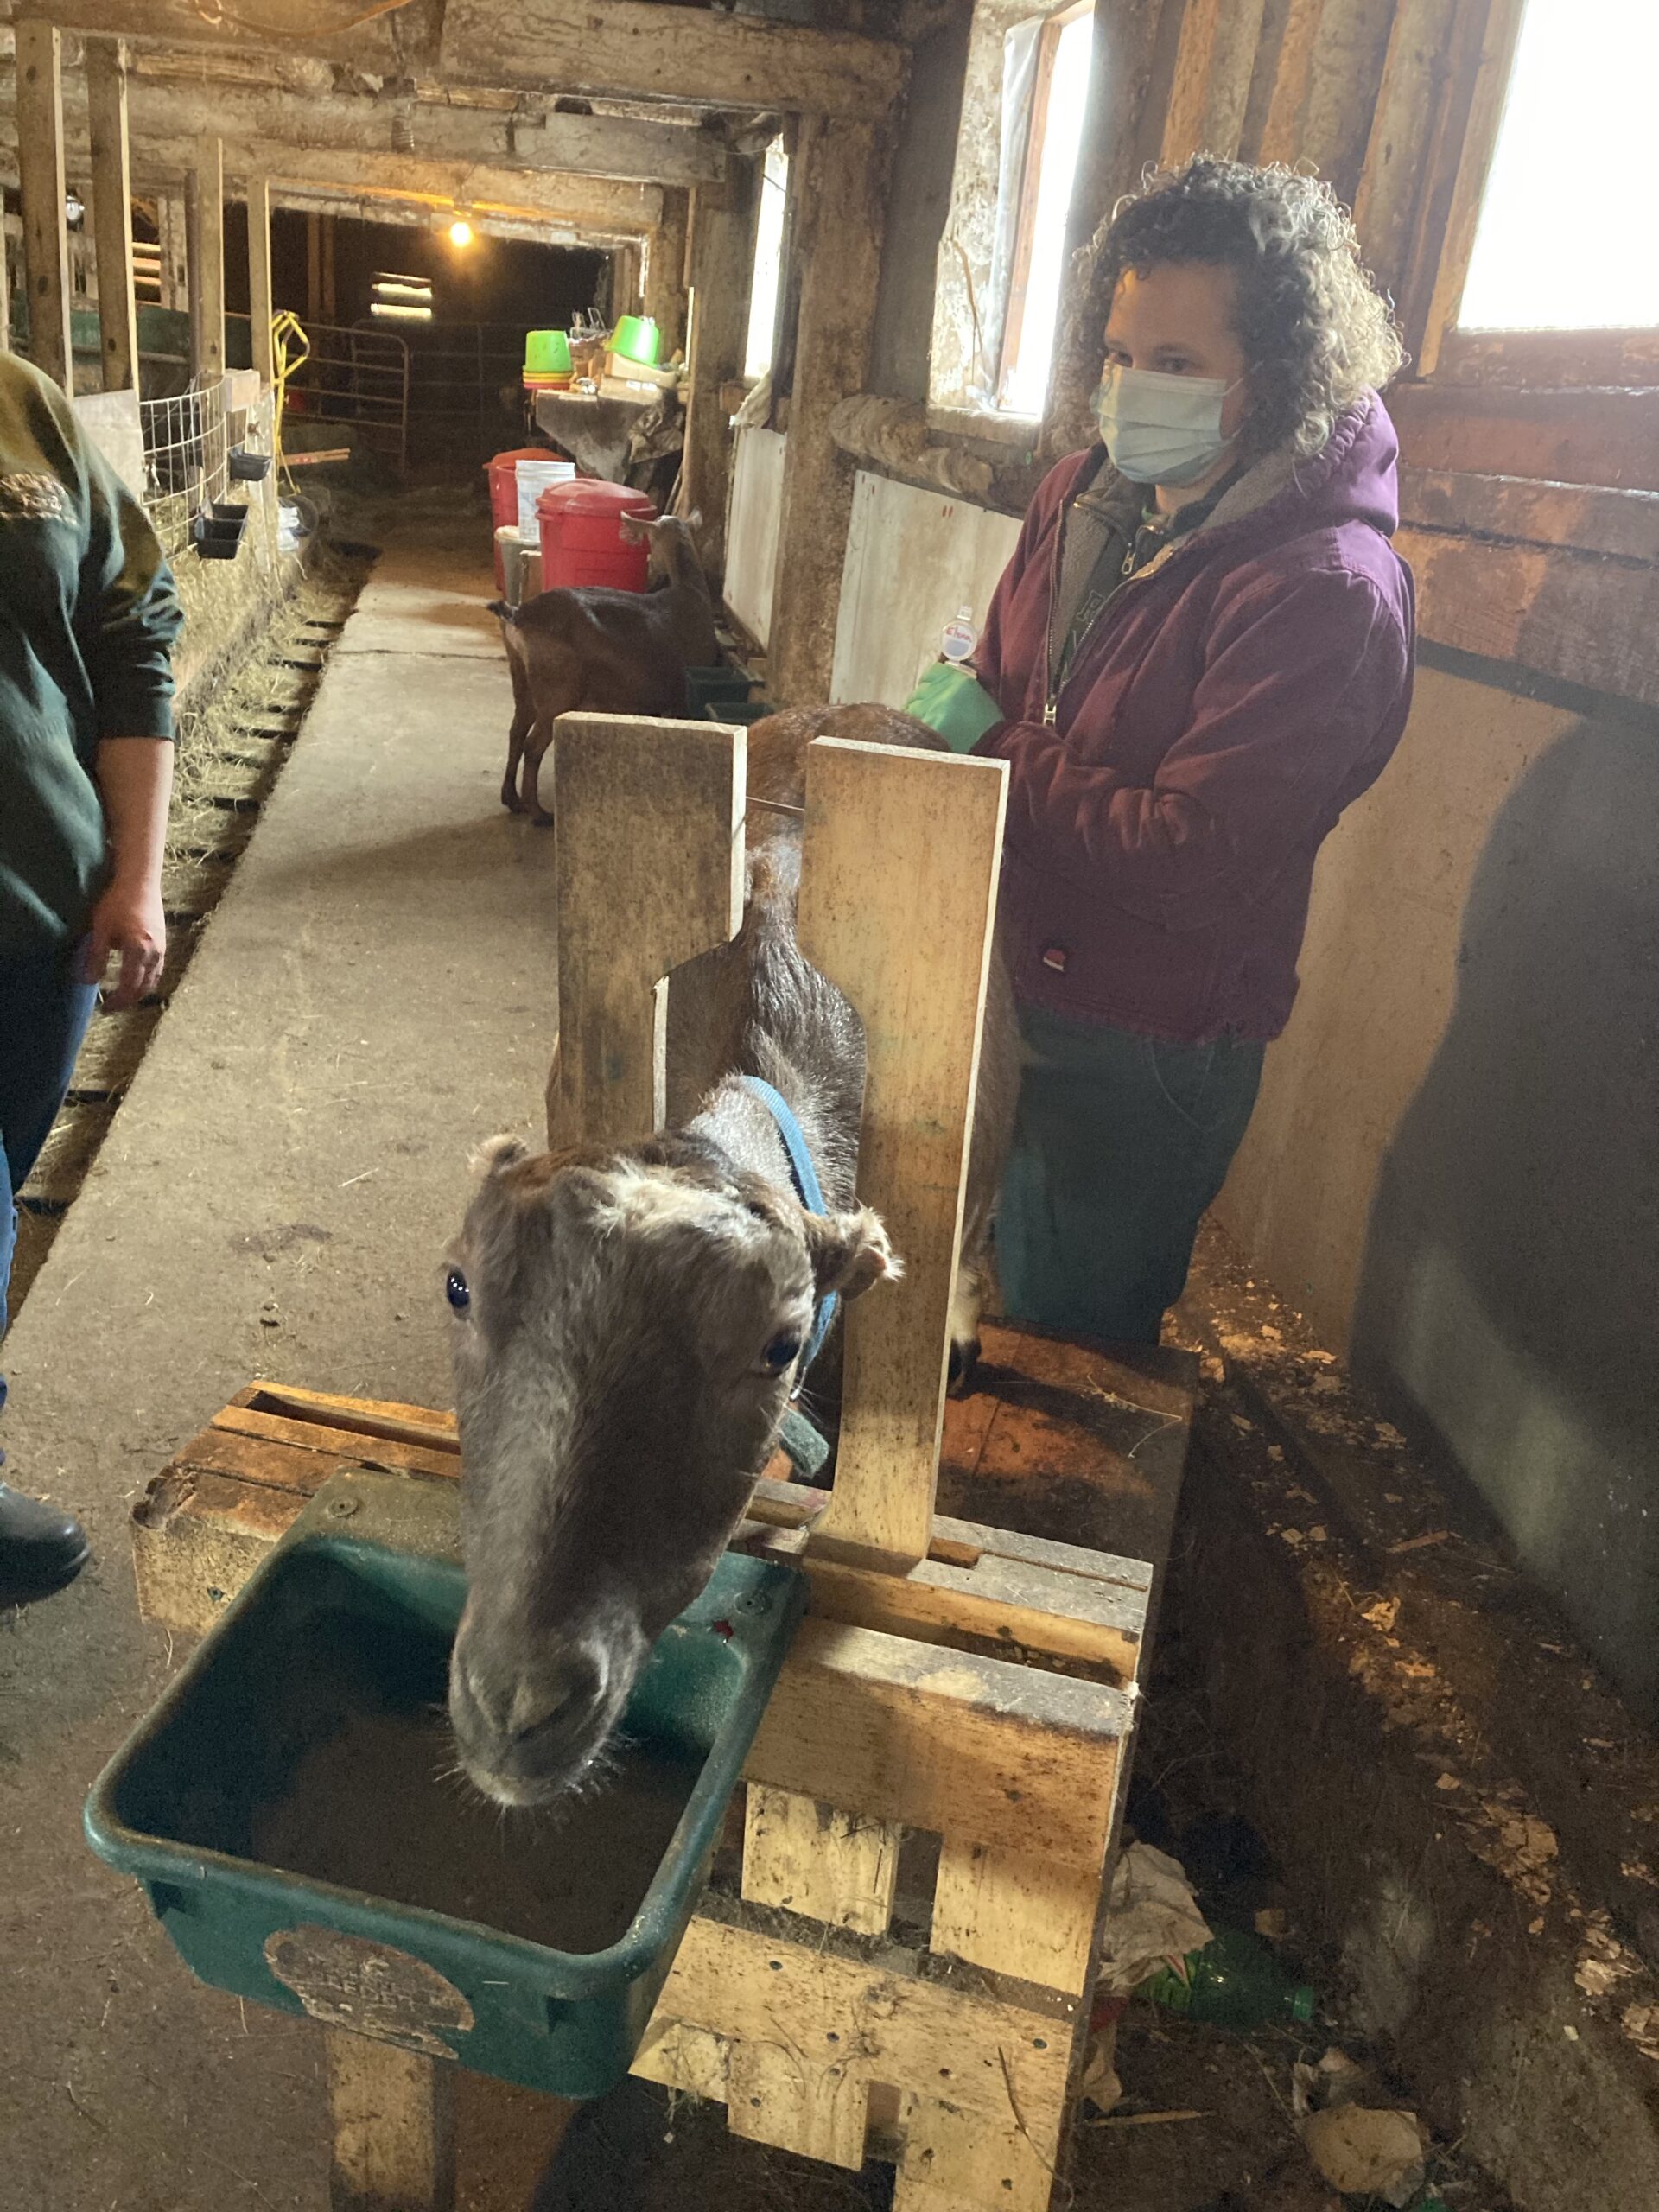
Sampling and additional data collection on management practices for included herds was done by New York State Department of Agriculture and Markets field veterinarians through the New York State Sheep and Goat Health Assurance Program (NYSSGHAP). The NYSSGHAP program was incorporated as a management tool for farmers to collaborate with their veterinarian on herd health issues such as JD, but also because the program has a budget to compensate private practice veterinarians for their participation in the meeting and sample collection. Herd veterinarians were invited to be part of the NYSSGHAP meeting to discuss potential improvements to management strategies, help educate herd owners on Johne’s disease and collect samples. Enrolled flocks had up to 20 semi-random adult animals 2 years of age or older sampled. Each animal had 4-6 ml of blood taken from the jugular vein and 10-15 grams of feces taken via rectal sampling. These samples were sent to the Wisconsin Veterinary Diagnostic Lab for fecal culture, fecal PCR and blood ELISA in order to replicate the testing done on sheep in the area in 2019 and compare to the prevalence statistics run in Ontario, Canada. The blood ELISA test screens for antibodies to the JD organism. The PCR test screens for the DNA of the JD organism (alive or dead bacteria) using the ThermoFisher VetMAX Gold MAP Detection kit with the AM1840 fecal extraction kit. Fecal cultures are used to test for live JD organism and are performed using Versa Trek Johne’s culture system (Trek Diagnostic Systems Inc.). This is the most sensitive test but requires an extensive incubation period. The Trek system uses 2 gram of feces diluted in sterile water, followed by two overnight enrichments in broth with antibiotics. Afterwards, the sample is mixed with the manufacturer’s proprietary media and incubated in capped bottles for 56 days for caprine samples. The Versa Trek System detects pressure changes in the head space of the bottle caused by the growth of the JD organism and plots those changes on a graph, which determines positivity. All samples are confirmed using acid-fast staining and positive samples are also confirmed using PCR for the IS900 gene. The lab ran additional ELISA and PCR protocols on the samples in order to provide internal validation on their commercially available methods.
Estimations of farm level prevalence, herd infection probability and within herd prevalence were calculated using Bayesian modeling in the statistics program R Studio (R Studio, Boston, MA), which will take into account the sensitivity and specificity of all three test methods, helping control for the known flaws of each test. This was preformed by Joseph Scufka and Andrew Stevens of the Clarkson University Math Department.
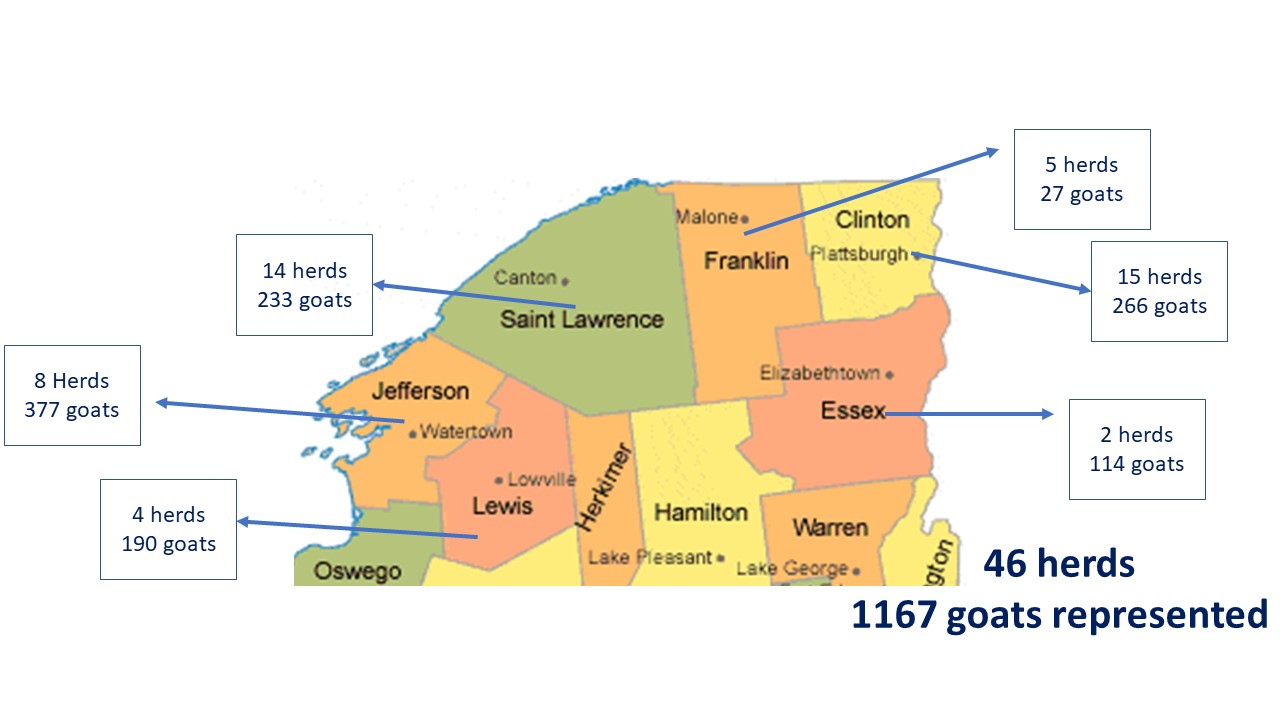
During the summer and fall of 2020 we developed the farm survey and emailed it to the CCE Sheep and Goat Update list. Dr. Scillieri Smith worked with veterinarians in the region to have them encourage their goat clients to participate. There were 46 survey responses from around the region, representing a total of 1167 goats.
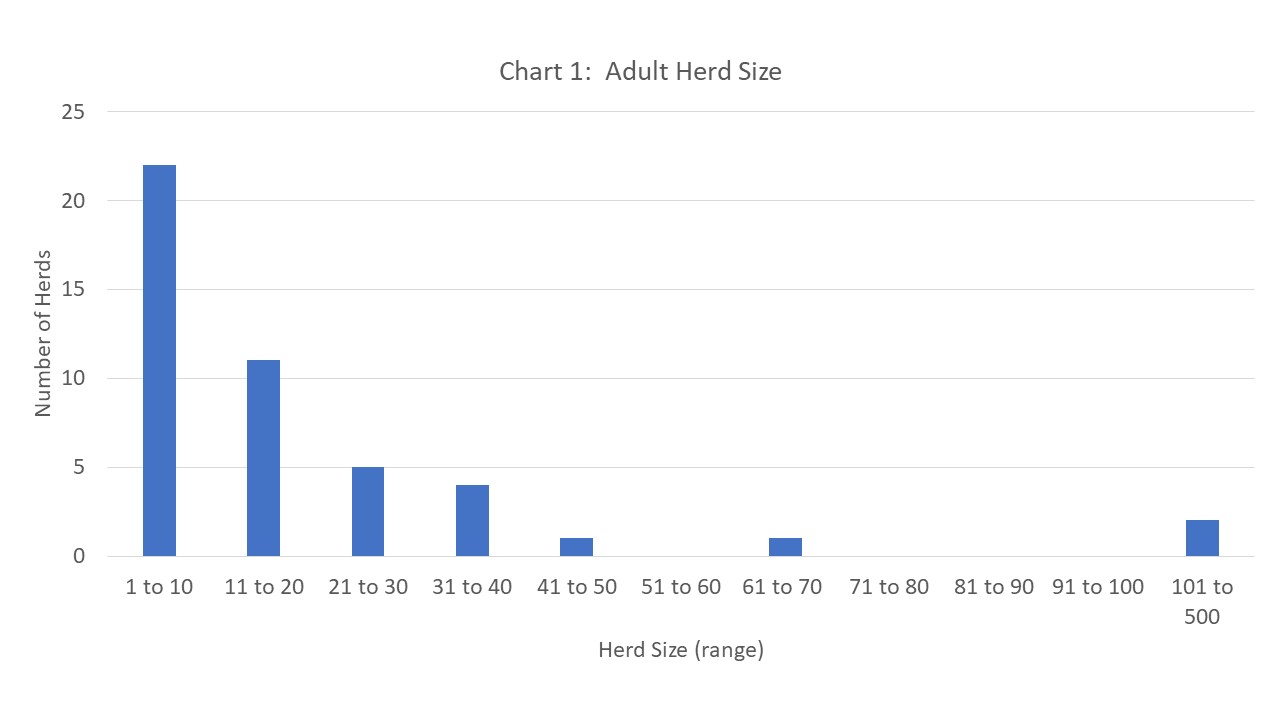
Our demographic survey showed the large range in characteristics of the goat population in Northern New York. Size of adult herd ranged from 1 goat to 106 goats (including bucks). When youngstock numbers were included, that brought the size of the largest herd to 166 animals, however, we understand that the youngstock population for each herd varies by breeding dates, sales of youngstock and if farms goals include internal herd growth. See chart 1 below for distribution of herd size in the region.
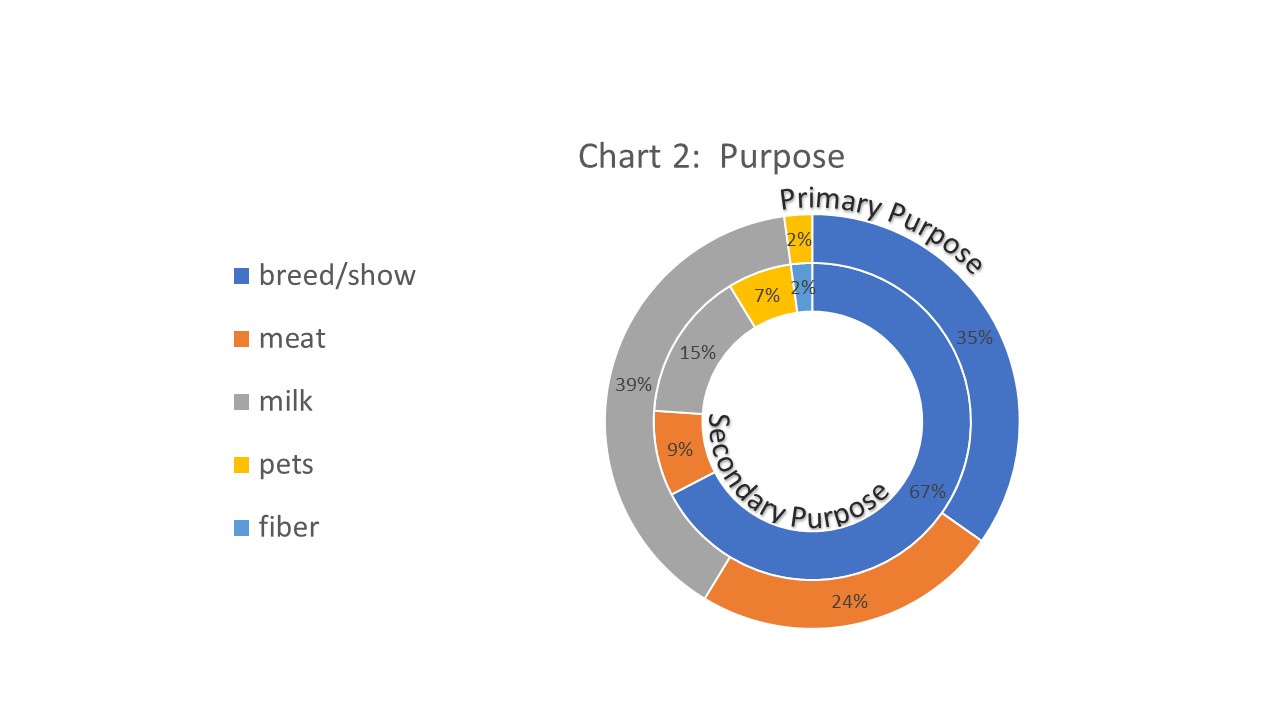
The purpose of the goat herds in the region was also quite variable. All survey responders were asked for the primary and secondary purpose for their goat herds. Milking was the most common primary purpose (18; 39%) but a less common secondary purpose (7; 15%). However, breeding and showing was the most common combined primary and secondary purpose (16; 35% listed as primary and 31; 67% listed as secondary) which is interesting given that Johne's Disease can be spread through the sale of infected but nonclinical stock or even spread at events such as fairs. Some of the included participants were aware of Johne's Disease and were on a program to do some level of screening in order to sell "disease free" stock but that was not common. Additionally, 4 responders listed the purpose of their herd as "pets" for either the primary or secondary purpose which was not a response we received on the similar sheep survey we did during the first phase of the project. See chart 2 for a donut graph of the primary (exterior) and secondary (interior) purposes reported of the goat herd in the region.
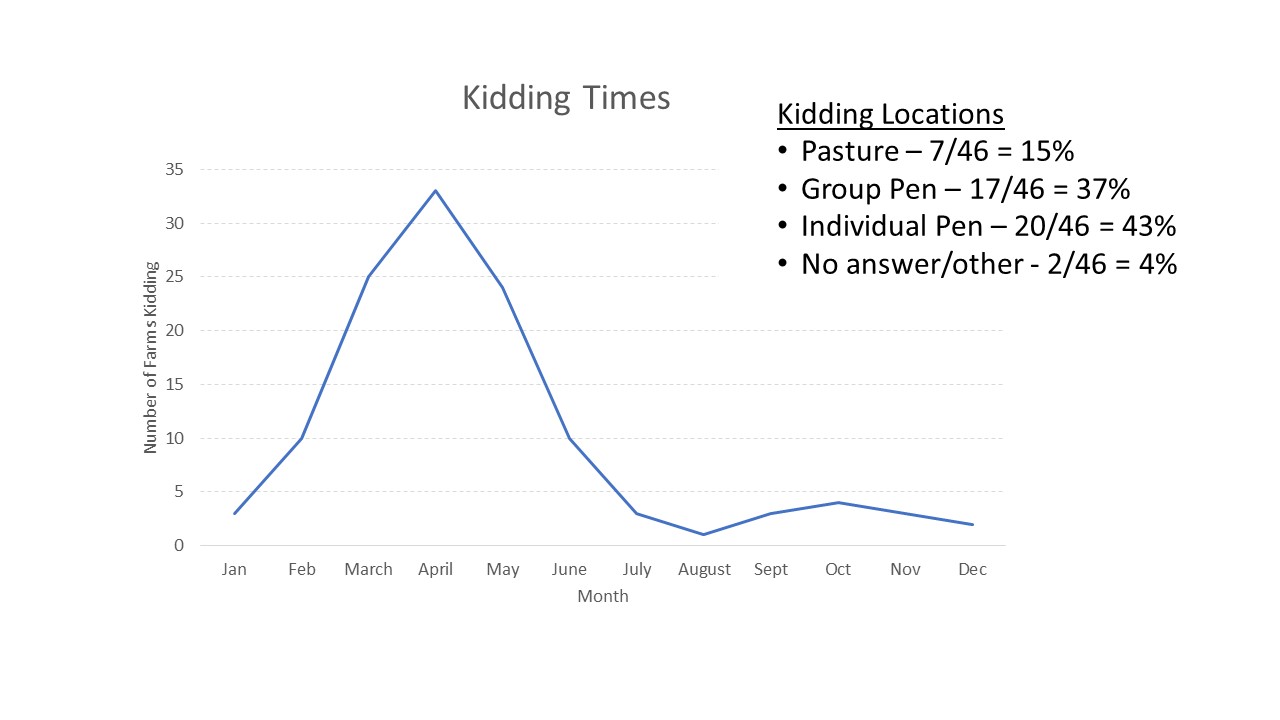
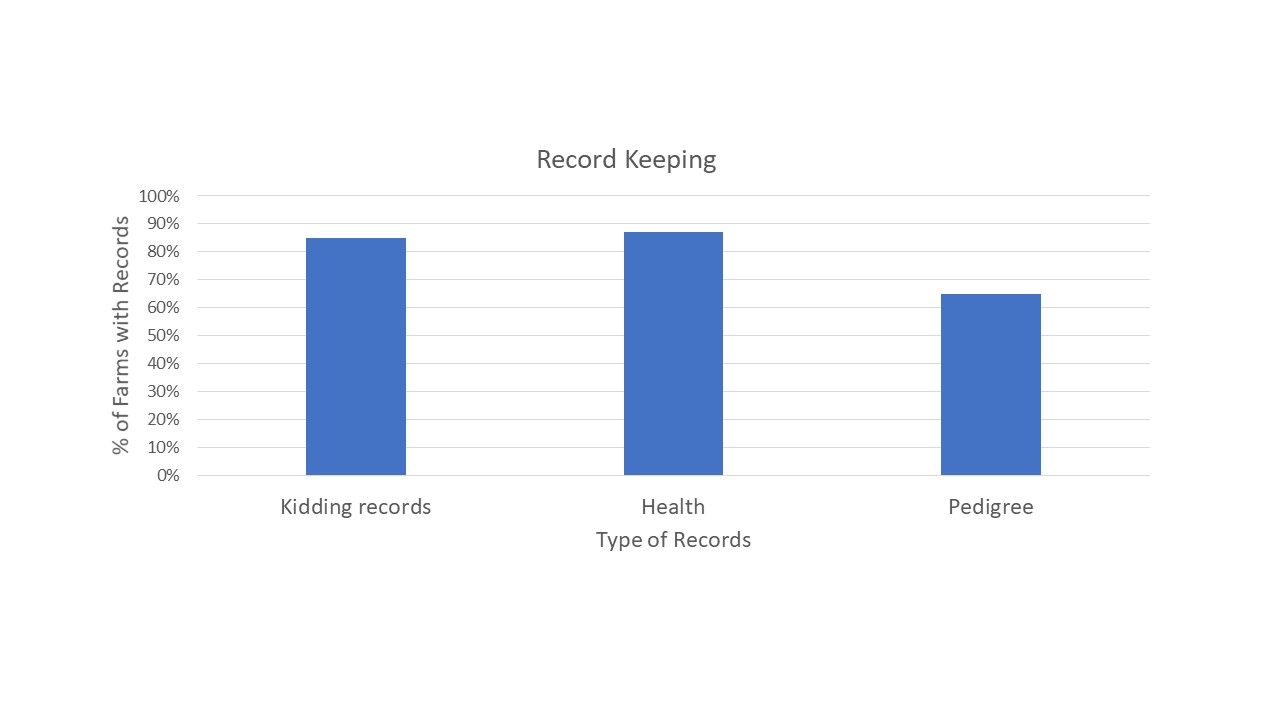
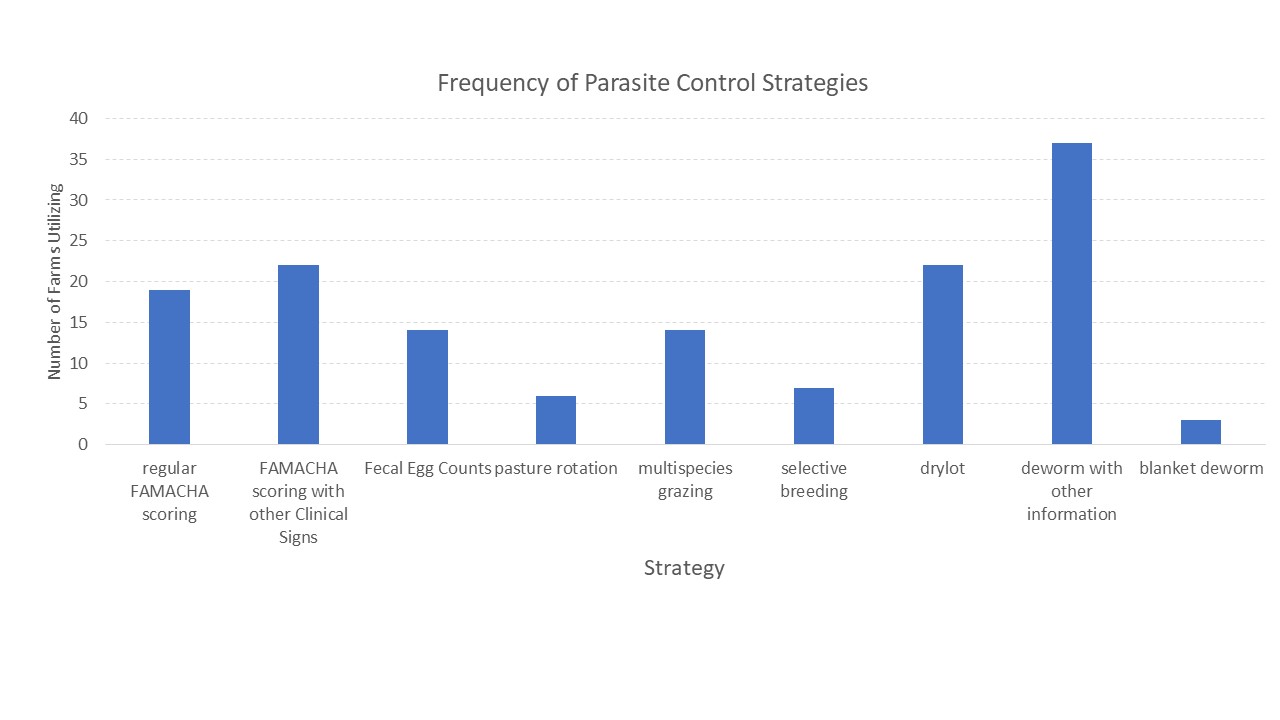
With the opportunity to further describe the goat herd in the region, we asked questions about when they planned for kids to be born and where animals were housed during kidding (chart 3), what types of records were kept (chart 4) and what routine parasite control measures they utilized (chart 5) since Johne's Disease can be difficult to differentiate from severe parasite burden without additional diagnostics. See below.
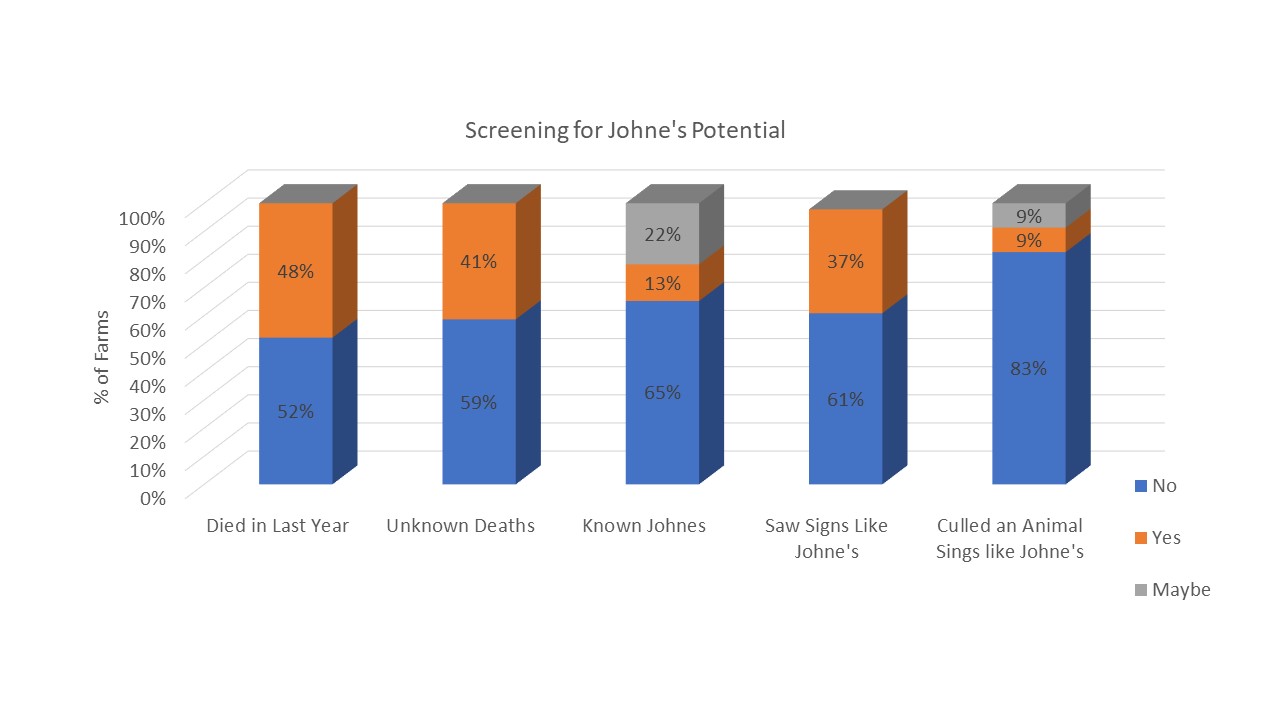
Finally, survey responders were asked about the potential presence of Johne's Disease in their herds. They were asked if any animals had died in the last year (48% had) and if any were deaths were from unknown causes (41% said yes). When asked if they knew if Johne's Disease was present on their farm, 13% said yes and 22% said maybe. As Johne's Disease can be difficult and/or expensive to diagnose, we also described the clinical signs of Johne's Disease and asked if the producer had seen animals with these signs (37% had) and if they had culled an animal with those signs (9% had and 9% said maybe). Results are shown in chart 6 below.
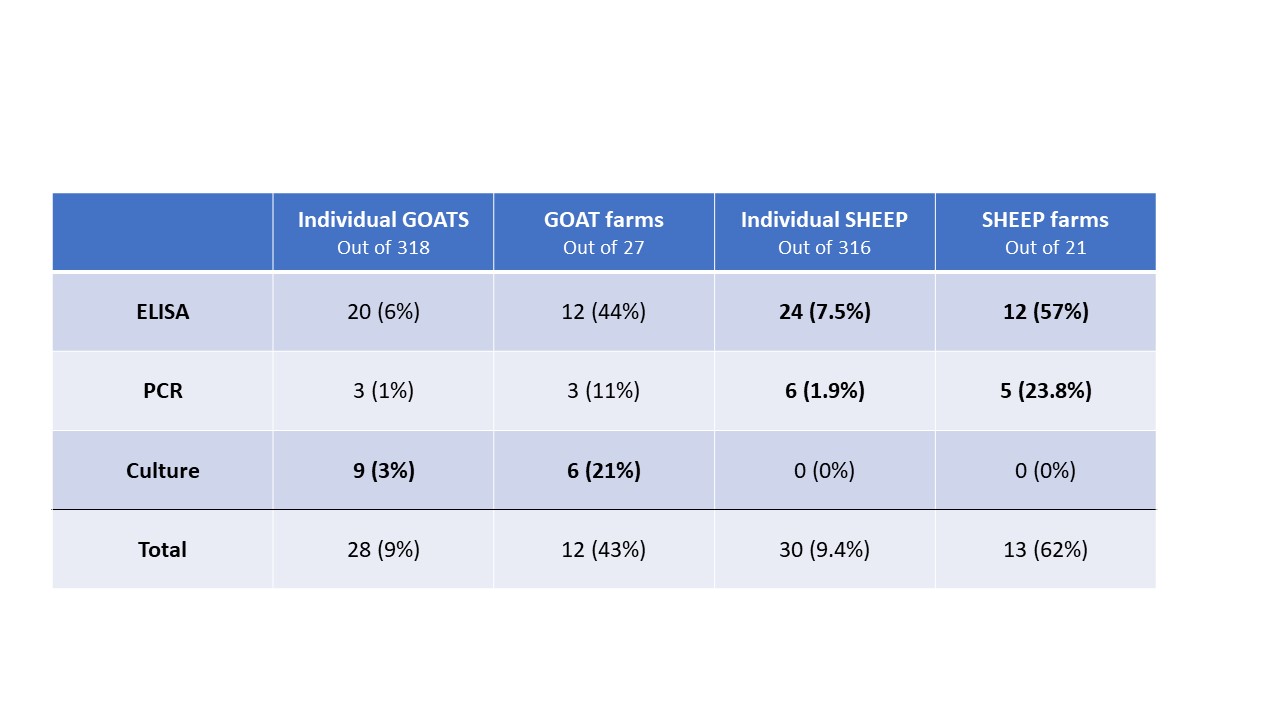
Of those 46 herds that responded to the survey, 4 did not want to be included in the project, 4 declined participation when approached for scheduling, 1 sold most of their animals before sampling began and 10 did not have enough eligible animals to include. The remaining 27 herds (59% of responding farms, with a total of 771 goats) were sampled, yielding 318 samples. Local veterinarians coordinated with the NYS Ag and Market regional veterinarians and farmers to collect individual fecal and blood samples from the goats. In addition, the herd veterinarian and the NYS Ag and Markets Regional Veterinarians conducted a NYSSGHAP interview with the farmer and sent them a management plan as follow-up. Two animals' results were removed from the dataset; one animal did not have a complete sample for the lab to run and one animal had an "inconclusive" fecal culture result, leaving 316 samples for the final analysis. From the 316 animals included, 28 animals were positive on at least one test (8.9%) and originated from 12 different farms (43%). Of those 28 positive animals, 20 were positive on the ELISA test (6%), 3 were positive on the PCR (1%) and 9 were positive on the fecal culture (2.8%). Some animals (4) were positive on more than one test (one animal was positive on all 3) and some were positive on just a single test, see venn diagram below. From a farm level perspective, 12 farms with at least one positive animal, of those 8 had more than one positive animal (30%) and 6 farms (22%) had animals that were either positive on the PCR or the culture (or both).
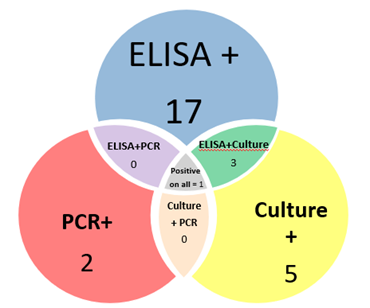
The following diagram (Chart 8) shows the results from a farm and individual animal perspective. Each bar represents a farm (numbered 1 to 27) and within the horizontal bar, each animal is a column of 3 boxes (one each for ELISA, PCR and Culture). The green shaded boxes are a positive test, allowing visualization of the number of positive animals on each farm and which test(s) those animals were positive on.
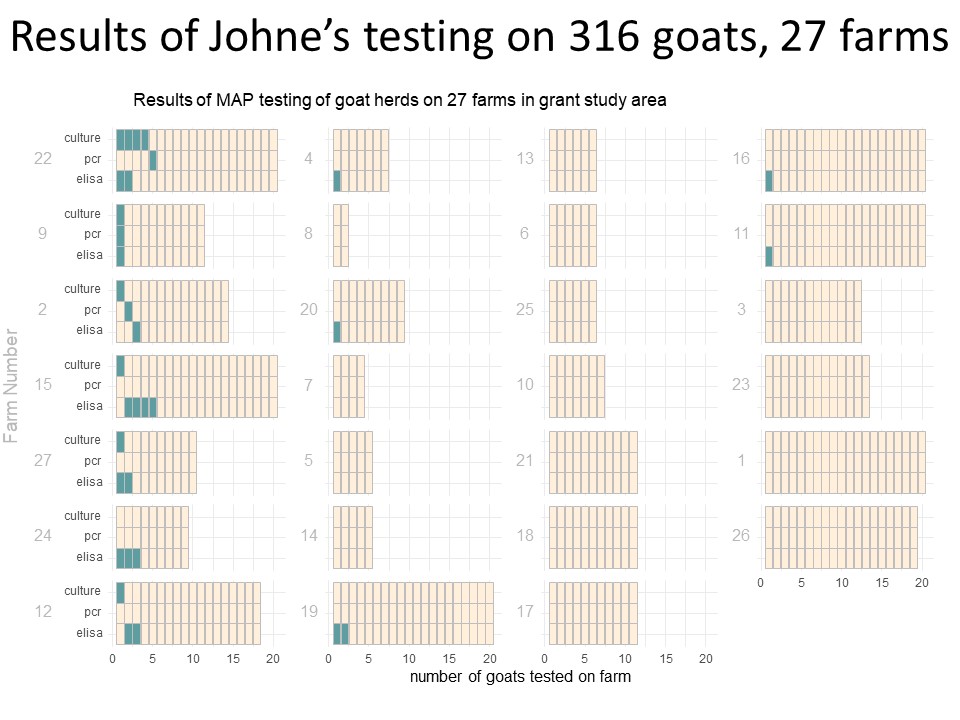
When evaluating the results more closely, it is interesting that 5 of the positive animals were male out of 37 males tested (13.5% of the male population tested) compared to 23 positive female animals (8% of the female population tested). Additionally, Johne's is generally considered to be a disease of older animals, but there were more animals that were positive who were 4 years of age or younger (20 animals) versus only very few animals that were positive that were older than 4 years (7 animals; one animal did not have age specifically reported).
Using Bayesian statistics, the objective is to estimate unknown quantities. This analysis tries to capture the uncertainty of that unknown value not just by giving a single value for those unknown quantities, but by showing a distribution (or histogram plot) of values that arise from repeated simulation. The values that result more often in the simulations are plotted with a higher likelihood. By plotting the whole distribution, we get an better understanding of not only what are the likely values, but what is the range of reasonable values. Key quantities from that analysis are plotted below.
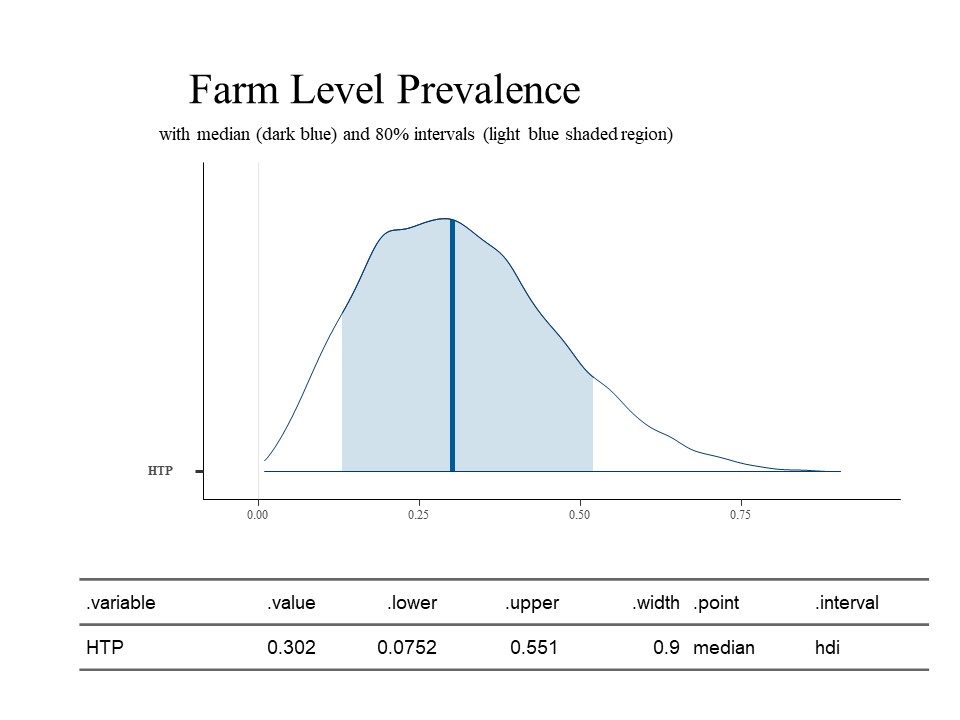
The first estimation below is for Farm Level Prevalence (FLP), which describes the fraction of herds that have at least one case of MAP infection/Johne's Disease in the herd. Without using Bayesian statistics, FLP could be directly measured if all testing were perfect, all farms were tested, and all goats on these farm were tested. Without those three parameters being possible, the FLP estimated using Bayesian statistics is that 30.2% (80% CI: .075 to 0.551) of farms can be classified as having at least one true positive animal. This is illustrated in the histogram below. This parameter is estimated from the data based on a standard model.
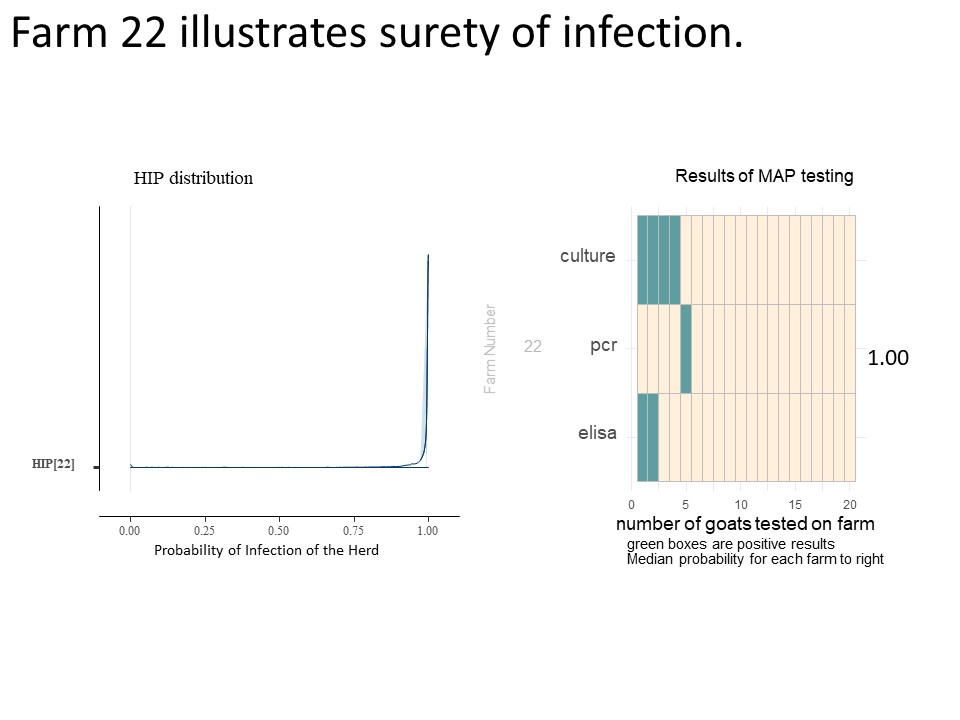
For each herd (farm), we may estimate the probability that the farm has an infected animal (within the group of animals being tested). We call this value Herd Infection Probability (HIP) and we estimate its value separately for each farm. As a Bayesion parameter, it is also shown as a distribution (of values). The value for FLP reflects an overall regional average, while HIP reflects the conditions on a farm and is a result or the data collected from that farm, as adjusted for the understanding of the accuracy of the tests and the overall conditions expected in the region. Below is the histograms showing the distribution of HIP for 7 of the farms included in this study (Chart 9). The dark blue line is the median HIP for each farm (also shown on the right) and the light blue area represents the 80% confidence interval for that value. For easy reference, the charts of each included farms' individual animal results are shown to the right of the farm's HIP histogram.
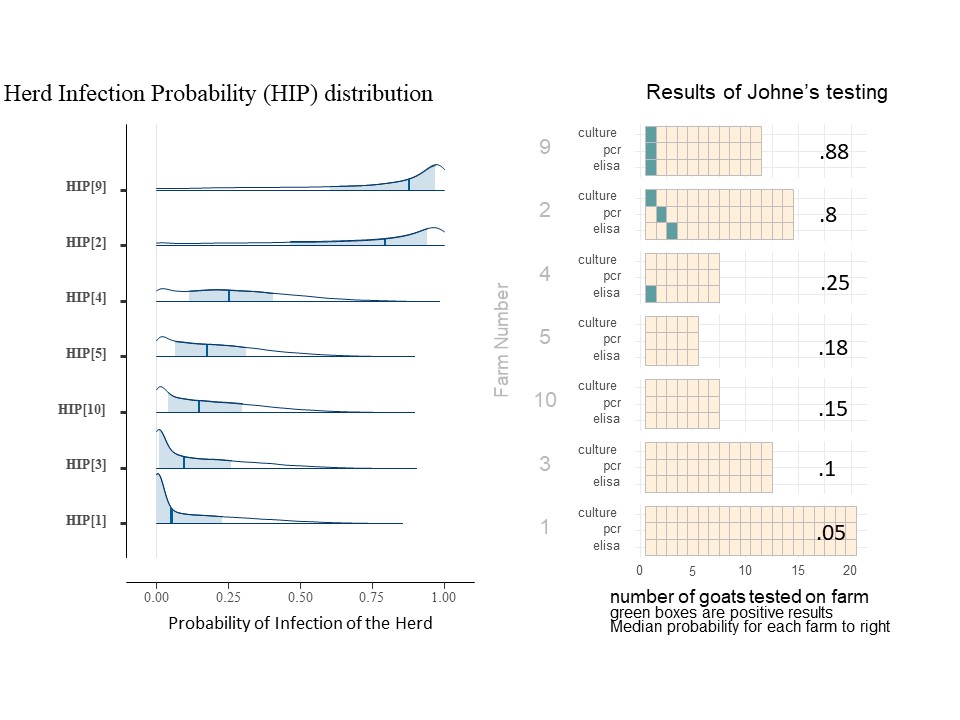
The farms included in Chart 9 illustrate the impact of more than one positive type of test, more than one positive test per animal and the number of animals tested. For example, on farm 9, the positive tests were all on the same goat which essential confirms the presence of MAP, so the infection probability is higher than on farm 2, even though it has the same number and type of positive tests. Comparing farm 4 and farm 10 with the same number of animal tested, a single positive ELISA from farm 4 pushes the HIP probability distribution (and mean value) toward higher probabilities of infection. For farms 5, 10, 3, and 1 where all animals were negative, note that as we increase the number of goats tested, the HIP shifts to the left, and the median probability is reduced. For farms 3 and 1, even though no positive tests were seen, the HIP is not 0. (The medial value on farm 3 is actually 10%). This risk of undetected Johne's Disease persists due to the known low sensitivity of the testing procedures in an operational setting. For farms 9 and 2, animals positive on the fecal PCR and fecal culture does greatly increase the HIP, but as one can see from farm 22 shown below (chart 10), that as the number of animals positive from these more reliable tests increases, the HIP reaches 100% and the confidence interval is greatly skewed to the right.
Within Herd Prevalence (WHP) calculates what fraction of goats are carrying the infection within each individual herd. In the typical model, the parameter of interest considers this questions on a per farm basis, and attempts to explain variations in biosecurity, animal movement and other management practices which impact the transmission of Johne's Disease to youngstock. This quantity is designated as the conditional WHP and is estimated, as a distribution, herd by herd for each farm, based on the testing outcomes. Below (Chart 11) shows another subset of farms with their results on the right, on the left are histograms of their WHP.
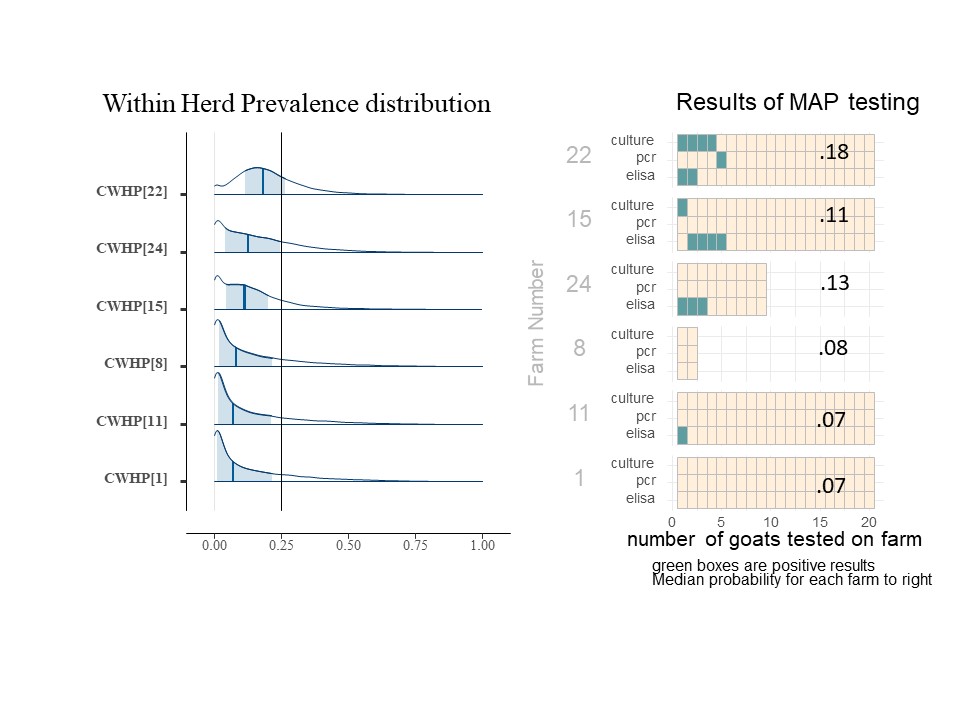
Interestingly, even for farm 22 where the most positive animals were identified, the WHP is only calculated to be a median of 18%. We can see from the selection of results shown that as the number of positive animals decreases, the median WHP value (dark blue bar) decreases. Farms 8 and 1 have no positive animals but still have a very low WHP to compensate for the risk of false negative test results. We can compare the two though and see that the WHP decreases for farms with more animals tested, although a single positive ELISA result for farm 11 does not dramatically change the WHP compared to a similarly sized group of all negative animals.
Johne's Disease testing interpretation can be confusing and frustrating. Clinical or diagnostic signs of disease may take years to develop after infection, and even once an animal begins to shed the organism in feces, shedding can be intermittent (Kawaji, et. al., 2011), meaning that test results can vary from day to day. Animals may appear to be clinically healthy while shedding the bacteria, resulting in infection of herdmates (Valentin-Weigand and Goethe, 1999). Additionally, test results can be impacted by stage of disease (Whittington & Sergeant, 2001), making comparison of tests run in parallel potentially confusing since antibody development may not correlate with fecal shedding (Sweeney et al, 2006) or may even be related to infection which was cleared by the immune system (Whittington, 2001) or other variables (Sweeney et al, 2006). In addition, there may be variation in detection when comparing different versions of the ELISA test (unpublished data, phase 1 of Johne's project on sheep) based on manufacturer. Of the three tests for Johne's disease, all options are reported to be higher specificity than sensitivity, meaning that there is a high risk with all testing for false negatives. Additionally, both fecal PCR and fecal cultures have a higher specificity than blood ELISA testing, but are also much more expensive. Fecal cultures have varying sensitivity rates reported (likely based on the differences in culture media (Whittington, 2009) and geographical variation of strains impacting ability to grow in culture (Whittington, et al, 1999), but may be as low as 23% without extended incubation times beyond the traditional ~50 day incubation (Bauman, et al, 2016). Extending the already long incubation period makes test results less useful to the producer. Many producers and veterinarians rely on the blood ELISA test for disease screening due to low cost and quick turn around time even with the risk of false negative results. This project ran all three tests offered in parallel in order to reduce the risk of missing a positive animal due to poor test sensitivity.
Logistically, our methods had to be modified beyond the original proposal in order to achieve appropriate testing numbers. There were fewer herds with ≥15 eligible animals interested in participating than originally anticipated. Additionally, several farms indicated on their survey that they were interested in participation, but when approached to schedule either declined testing or had sold their animals. As a result, the minimum number of animals was lowered to 10 for farms that were not already enrolled in the NYSSGHAP program and herds of any size were included if they were already part of the NYSSGHAP program as veterinarians were already present on those farms and sample collection was efficient (10 farms, 57 samples). And farms that had more than 15 eligible animals had additional animals tested up to 20 animals. Although this may have increased the representation of small herds in our dataset, the demographic survey did show that the goat herd population is composed of a large number of small herds.
The population tested is biased in several ways. Farms were only included after completing the screening survey, meaning that they would have already been in contact with Cornell Cooperative Extension, NYS Department of Agriculture and Markets or have a relationship with a participating veterinarian. Further, participation was completely voluntary. Several herds declined participation citing no interest in knowing disease status or lack of trust in test result accuracy. Some farms may also have been reluctant to participate during the COVID 19 pandemic as restraint of goats does not allow for social distancing between the restrainer and the veterinarian sampling.
The results of this testing compared to Phase 1 of our research which involved the same testing in 21 sheep herds (316 animals sampled) are also interesting. Compared to goat herds, more sheep flocks were found to have at least one animal with either a positive or suspect test result (57% of flocks). Additionally, more sheep were found to be positive on the PCR test (6 animals from 5 farms), but no sheep were positive on the fecal culture. That does make sense as sheep are more likely to be infected with the S strain of Johne's disease which is notoriously harder to culture (Shulaw, NAVC, 2013). The differences between the two data sets are shown below. Given the small number of positive results on the tests, the differences are unlikely to be statistically significant. The two populations are also different in purpose, which may impact farm level biosecurity and disease risk.
One of the most significant outcomes of this research was the educational component with individual producers on the complications and difficulties interpreting the results of Johne's disease testing. As can be seen from the Bayesian modeling, one whole herd negative test cannot rule out infection somewhere in the herd. Testing all animals over the age of 2 and repeated testing will increase the confidence with which a producer can claim to be "Johne's Free" and we saw in our testing, it is possible (and even likely) for ELISA testing to miss animals which are shedding infectious pathogens into the environment. Farms that have the goal of being "Johne's Free" may elect to periodically perform fecal cultures in addition to ELISA testing in order to further increase confidence in their herd status, even with the downside of the delay in results. Outreach also focused on education about the different tests offered and the pros and cons of each option so that producers can make informed decisions with their herd veterinarian in the context of their goals and priorities. Outreach materials include the recorded webinar and factsheet and are publicly available.
We sought to determine the prevalence of Johnes' Disease on goat farms in Northern New York and educate herd owners on Johne's disease, its ambiguous clinical presentation and difficulties in accurate diagnosis of sub clinically infected animals. We did find a low level of Johne's present on 44% of farms and estimate that the farm level prevalence to be about 30% (80% CI: .075 to .551). Even with about a third of farms potentially impacted, it appears that Johne's infections may maintain a low prevalence within the herds as only 28 animals (9%) were found to be positive on at least one test, resulting in a median estimation of within herd prevalence of 7 to 18% in all tested herds. It may be that Johne's disease may be more easily managed by current farm practices or that biosecurity is better than previously thought, or just that a lower level of disease can be maintained in a herd without seeing major economic or disease implications.
Education & outreach activities and participation summary
Participation summary:
The 27 farms that enrolled in NYSSGHAP were provided direct and personalized education on Johnes disease symptoms, testing, management and avoidance. The information collected in this study and the conclusions formed were and are being presented across the state by NYS Department of Agriculture and Markets field veterinarians at continuing education events along with discussion at other NYSSGHAP meetings with individual producers. Statewide distribution of information occurred in November 2021 at the Cornell Cooperative Extension Agriculture Educators In-Service where the results were presented as a webinar (rather than a poster - due to CoVid). Cornell Cooperative Extension livestock educators will be able to share the results at sheep and goat meetings directed at producers with support from Betsy Hodge.
Producer meetings took place at the end of October and early November 2021. Two meetings were offered in person in the region and one meeting was offered as a webinar for those unsure about attending in-person meetings. The webinar was recorded and was posted at the CCE St. Lawrence website (http://stlwarence.cce.cornell.edu) , CCE Livestock Website (www.ccelivestock.com) as well at the NESARE resource site. The pdf handout of the power point and a one page factsheet were also be posted at these sites.
Regional presentation of the information will occur through poster presentation at the Cornell Sheep and Goat Symposium if a larger presentation of the information is not invited. Due to CoVid restrictions, the symposium was not held during 2020 or 2021. However, when the symposium resumes the information will be presented there (planned for September 2022). The symposium draws sheep and goat farmers from all over the northeast. Collaborators will work together to generate articles directed at producers and veterinarians when the final statistical analysis is finished. A peer reviewed publication will be written after this second year of research to cover the information for both the sheep and goat population.
The final report and a link to the resources - power point, power point handout and factsheet - will be posted at the Cornell Goat Resources page and also at the CCE Livestock page when complete.
Learning Outcomes
Although there was an awareness of Johnes' Disease in cattle, many farmers were not aware that it can affect sheep and goats. The survey, on-farm consultations and sampling informed many farmers of the existence of Johnes' Disease in small ruminants. In the future they will have a better understanding of the symptoms of Johnes' Disease, testing options, bio-security, how to avoid buying animals with Johnes' Disease, and how to manage a herd with Johnes' Disease.
Through the NYSSGHAP consultations they were able to go in-depth with their personal veterinarian along with an NYS Agriculture and Markets veterinarian and talk about management topics that affect the health status of their herds. Farmers that attended the in-person and on-line meetings were able to ask questions. Understanding the different tests and what they mean and how to make decisions based on the tests was a frequently discussed topic. There are plans to produce a factsheet to help guide those management decisions. Farmers learned to be skeptical of claims of Johnes' free status and ask about testing.
When the participating herd veterinarians were surveyed, 100% responded that their clients better understood Johne's disease after participating in the project. Even more significant, 100% report that at least some of their clients had changed their management after participation. Finally, 100% of responding veterinarians reported that their participating clients were pleased to have participated. Not only did we meet our object to begin to describe the prevalence of Johne's in the region, but we also positively impacted those farms that were able and willing to participate.
Project Outcomes
It is easy to judge the project outcomes on the twenty-seven farms that participated in the testing part of the study. They all worked with their veterinarian to do a NYSSGHAP plan resulting in improving their relationship with their veterinarian and their understanding of Johne's Disease and testing. It is harder to judge how many farmers made changes after hearing about the study results in newsletters and the webinar. There were follow-up questions on email about things farmers learned in the webinar and people who appreciated the recording because they could watch it when they had time.
One goat farm with a known history of Johne's Disease used the project as a boost to get more goats tested. They followed up with culling and continued testing, and working with their veterinarian to manage and hopefully eradicate the disease on their farm.
We just completed another round of testing. All does eligible for testing were negative for CAE, CL, and Johne's. We did testing over the summer too that included animals not previously tested in the study. We also tested our sheep. We're now going to be testing regularly and requiring all animals coming in to be tested.
Another farm that sells breeding stock and shows goats made culling decisions based on test results and will be less likely to spread Johne's Disease to other farms.
Another included farm reached out and told us "we would like to start doing testing once or twice a year.. so that we can make sure to always have a clean herd."
The recorded webinar will allow farmers to watch and gain information about Johne's when they have time. When the webinar was recorded we had almost 50 people watching from all over New York and surrounding states. There were even farmers from Puerto Rico and Peru. There were several follow up emails asking more in-depth questions and being thankful for the information.
Thank you for going to the trouble of recording and publicizing the recording, which works so much better for me; I look forward to watching this weekend.
Flaws in the study design were discussed in more depth in the results and discussion section. Ideally researchers would be able to choose the farms and goats for a study randomly. That is not possible and farms were only aware of the survey if they were already in contact with Cornell Cooperative Extension, NYS Agriculture and Markets or collaborating veterinarians. There are many goat herds in the region which may have wanted to participate but never received communication about our survey. Of those surveyed, only certain herds were invited to participate in the actual sampling in order to achieve the appropriate number of samples while balancing labor and effort. Farms that got the benefit of some free testing had to agree to share information with us. Some herds did not want to participate because they didn't want to know the results or didn't feel it was worth the time.
The results led us to want to do follow up studies on the same goats. Testing them over time and following their health status in the herd. The sensitivity and specificity of the tests make interpreting the results a challenge. Testing the same goats over time may make the picture clearer (or could make it muddier). The challenges of the test reliability led us to want to go back and sample the same farms over time (6 months to 10 years) to see which animals that tested positive on one test became positive on other tests, actually showed symptoms of Johne's, and whether their test results stayed the same or changed over time.
More research needs to be done on the tests to know their true sensitivity and specificity. Several veterinary diagnostic labs are working on this topic (Wisconsin and Cornell). Because sensitivity and specificity can be calculated in comparison to different gold standards (post mortem sampling with culture and/or histopathology versus other pre mortem tests), evaluation of individual tests can be difficult. Even looking at research presented by manufacturers can have low sample numbers used to calculate these parameters. Research does support that fecal cultures, while very specific, can be impacted by culture media ingredients and even length of incubation time, all of which can impact sensitivity.
Knowing which strain of the bacteria that causes Johne's Disease (cattle versus sheep strain) found in our positive samples would be an interesting next step for study. Many of the farms included also had other susceptible species on the premise or even had previously housed other ruminant species. Does management or co-housing other at risk species impact the potential of disease or spread? Could exposure to one strain create antibodies which may protect from another strain? It is known that there are differences in how the two organisms grow in fecal culture, however, less is known about the comparison of the ELISA test results based on strain present. These difference might affect the results and therefore on farm management. Given the ease and cost of the ELISA test, this may be the most realistic tool for farmers to utilize for testing strategies. However, our results showed that some animals shedding organism may not test positive on the ELISA, and therefore these animals spreading infection would be missed. The correlation between the antibody response for the ELISA test used in this research versus shedding patterns would be useful in test result interpretation.