Final report for ONE22-415
Project Information
Hard clams are an economically important shellfish species for New Jersey. Farmers in parts of the state have recently experienced slow growth and mortality in their clams, which has led to major impacts on the hard clam industry in their area. This study was designed to provide the growers in that area with a scientific comparison to an area that has not experienced these negative growth patterns. The comparison may show what could be causing the slow growth and mortality. The study was designed with three major goals. First, to determine if there is a difference in growth between the two areas within a single season time scale. Second, to look for any long-term growth trends through ageing analysis. Finally, to examine what environmental conditions could be contributing to the growth differences between sites.
The study confirmed that there is a 10 mm growth difference between the sites over a single season. This means that the area with better growth reaches market size a year earlier than the area experiencing problems. When stocking density was standardized across farms, the clams grew at a similar rate but still had a 5 mm difference in growth over the season. The ageing analysis showed that there does not appear to be any long-term growth trend at the farm experiencing problems, but that the farm with faster growth is outperforming wild clams in both areas as well as farmed clams in the poor growth area. Environmentally, water temperature was not different between sites, but the current speed was different seasonally, which may account for some of the growth difference.
The results of the study have been presented at various regional and local meetings, as well as a blog post published by one of the coauthors. Our results have also led to further, more targeted studies by the farmer experiencing poor growth.
Objective 1:
To identify periods of slow growth during the annual production season using condition index as an indicator of metabolic energy balance. Data will be compared between sites and against historical data to describe timing and severity of changes in growth.
Objective 2:
To use shell ageing analysis of older clams to describe long-term patterns in hard clam growth within and between growing sites.
Objective 3:
Informed by observations from Objectives 1 & 2, identify changes in seasonal and long-term trends in environmental variables. Assess the sensitivity of hard clam growth and survival to conditions to provide insight on the regionally-observed poor clam production.
Outcomes/Deliverables:
This project will quantify the slow growth observed by New Jersey clam farmers. Quantitative understanding of the extent and severity of this issue will aid farmers in counteracting the problem. Identifying the timing of poor growth seasonally and any long-term trends will better inform future research, so that those studies are relevant to the problems facing the commercial sector. We intend for the results of the correlative study between environmental variables and clam performance to be applied to farm management and siting practices, to help farmers make informed choices about their production plans.
Hard Clams (Mercenaria mercenaria) are one of the top three molluscan aquaculture products in the United States and are grown exclusively on the east coast from Massachusetts to Florida (Yang, 2016). Hard clams are one of the two shellfish species cultivated in New Jersey (the other being the Eastern oyster). A 2015 outlook report estimated that approximately 7.78 million clams were sold for a farm gate value of $1.5 Million, acknowledging that this is most likely an underestimate based on the number of farmers that replied to the survey (Calvo, 2017). Farmers have recently reported to state biologists at New Jersey Department of Environmental Protection’s (NJDEP) that hard clam growth on established leases in some estuaries has declined noticeably over the past 7 years. Investigations into the cause of the observations began with some growers individually obtaining pathology screenings of their product, but a definitive disease process explaining the slow growth and mortality was not evident. After an especially poor season in 2022 (where an estimated 350,000 market clams died), one grower, Dale Parsons of Parsons’ Seafood, contacted researchers at the NOAA Fisheries Milford Lab in Connecticut for possible explanations. There has also been a great deal of interest from other growers in New Jersey, and especially the New Jersey Shellfisheries Council, to further understand these observations on these leases and the spatial extent throughout the state.
One hypothesis researchers discussed with the farmer to explain the poor growth of hard clams, while oyster and scallop growth has not changed, is a metabolic energy imbalance caused by a combination of increasing metabolic demands and declining nutrient availability. Preliminary data from NJDEP’s continuous sampling of chlorophyll (an indicator of phytoplankton abundance) has shown declines in chlorophyll concentrations in the same areas where the decrease in growth has been reported. Research at the Milford Lab has shown a feeding conversion efficiency of 2% for hard clams, 25% for oysters, and 20% for scallops (Wikfors, personal communication 2022). It is possible that the clams are also facing environmental conditions that increase metabolic demand, such as increasing bottom water temperature. Those conditions, in addition to low food availability, may explain why clam growth has slowed while other bivalve growth in the same areas has not.
We proposed to research the timing and cause of poor growth of cultured hard clams using condition index measurements, water quality data, and shell growth ring measurements. This information will provide empirical evidence on the rate and severity of the negative growth trends observed in cultured hard clams in the study areas. Results of the study will give farmers the tools to make important decisions on future farm use, provide important context to the future of hard clam aquaculture in the state, and what, if anything, might be done to reverse the trend.
We conducted a comparative study between two historically productive aquaculture sites in New Jersey to evaluate seasonal and long-term hard clam growth trends as well as water quality. One site is near Little Egg Harbor (LEH) Inlet in Barnegat Bay, New Jersey, where Dale Parsons grows clams, oysters, and scallops in aquaculture gear. Since 2015, farmers in this region have observed significant declines in hard clam growth and survivorship. Similar observations have been made by ReClam the Bay, a non-governmental organization operating hard clam upwellers in Barnegat Bay. We will also collect samples from Paul Felder’s operation in Great Sound (GS), a separate estuary in southern New Jersey that has maintained consistent productivity and growth in the same time period when LEH has witnessed declines. By assessing growth patterns and water quality between sites, we hope to gain a better understanding of how aquacultured hard clams are responding to environmental changes, and what conditions are most influential to their growth and survival.
Sources (including what is referenced in research section):
Calvo, L. (2017). New Jersey Shellfish Aquaculture Situation and Outlook Report 2015 Production Year. Rutgers, Agricultural Experiment Station.
Jones, D. S., Quitmyer, I. R., Arnold, W. S., & Marelli, D. C. 1990. Annual shell banding, age, and growth rate of hard clams (Mercenaria spp.) from Florida. J. Shellfish Res., 9(1), 215–225.
Lucas, A., & Beninger, P. G. (1985). The use of physiological condition indices in marine bivalve aquaculture. Aquaculture, 44(3), 187-200.
Peterson, C. H., Duncan, P. B., Summerson, H. C., & Beal, B. F. 1985. Annual band deposition within shells of the hard clam, Mercenaria mercenaria: consistency across habitat near Cape Lookout, North Carolina. Fish. Bull., 83(4), 671–677.
Peterson, C. H., Duncan, P. B., Summerson, H. C., & Safrit, Jr., G. W. 1983. A mark–recapture test of annual periodicity of internal growth band deposition in shells of hard clams, Mercenaria mercenaria, from a population along the southeastern United States. Fish. Bull., 81(4), 765–779.
Rainier, J. S., & Mann, R. L. (1992). A comparison of methods for calculating condition index in eastern oysters Crassostrea virginica (Gmelin, 1791). Journal of Shellfish Research, 11(1), 55.
Ridgway, I. D., Richardson, C. A., Enos, E., Ungvari, Z., Austad, S. N., Phillip, E. E. R., & Csiszar, A. 2011. New species longevity record for the Northern quahog (=Hard Clam), Mercenaria mercenaria. J. Shellfish Res., 30(1), 35-38.
Schneider, C. A., Rasband, W. S., & Eliceiri, K. W. 2012. NIH Image to ImageJ: 25 years of image analysis. Nat. Methods 9(7), 671–675.
Yang, H., Sturmer, L. N., & Baker, S. (2016). Molluscan Shellfish Aquaculture and Production: FA191/FA191, 1/2016. EDIS, 2016(3), 8-8.
Cooperators
- (Researcher)
- - Producer (Researcher)
- (Researcher)
- (Researcher)
- - Producer (Researcher)
- (Researcher)
Research
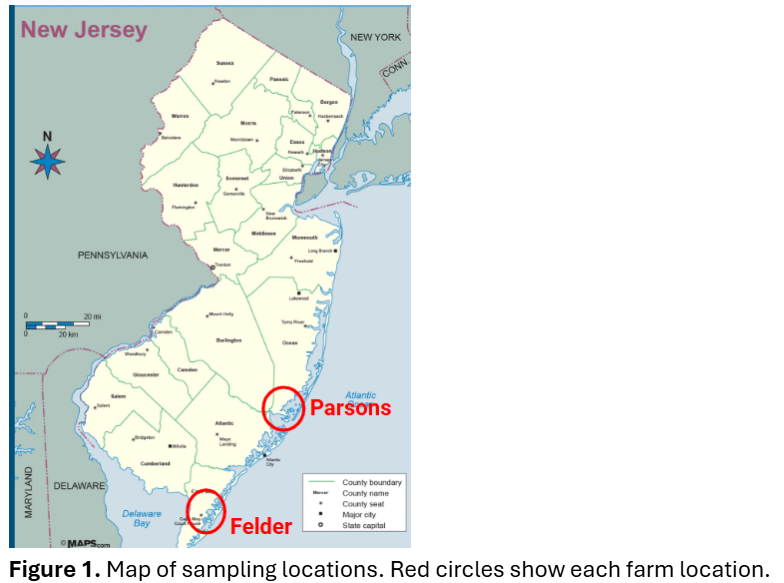
Clams were collected from Dale Parsons’ lease site in Little Egg Harbor, Barnegat Bay, NJ (LEH) and from Paul Felder’s site in Great Sound, NJ (GS) (Figure 1).
Objective 1:
To assess overall clam health throughout the production season, 30 clams were sampled from each site on a monthly basis between March and December. While the clams originated from different hatcheries, they were selected from the same 2022 hatchery year class at each farm. The clams were shipped on ice overnight by the partner farmers to the Milford lab for measurement of condition. Condition index (CI) is a useful and widely used indicator of bivalve nutritive status (Lucas and Beninger 1985). Clams were scrubbed and dried before collecting whole wet weight (g), in addition to shell length measurements (mm). The soft tissue and valves were separated and dehydrated independently in an oven at 60°C for 48 hours before collecting dry soft tissue and shell weights. Condition index was calculated using the formula (Rainer and Mann, 1992):
Soft tissue dry weight (g)
---------------------------------- x 1000
Dry shell weight (g)
To assess clam growth over the growing season and to control for stocking density, 3 groups of 35 clams were planted at each farm. These clams were placed in plastic boxes buried in the sediment at each farm. The clams were labelled with nail polish in three colors, which created 35 individual markings allowing the clams to be tracked individually. The boxes were protected from predators with mesh and taken care of in a similar manner to the rest of the clams on each farm. Shell growth and condition index was plotted over time.
Objective 2:
To assess long-term growth trends, we also collected sets of up to 50 large clams from both farms and from wild sites near each farm. These clams were greater than 10 cm shell length and estimated to be at least 10 years old. The soft tissue was shucked from the clams and the shells were cleaned and dried.
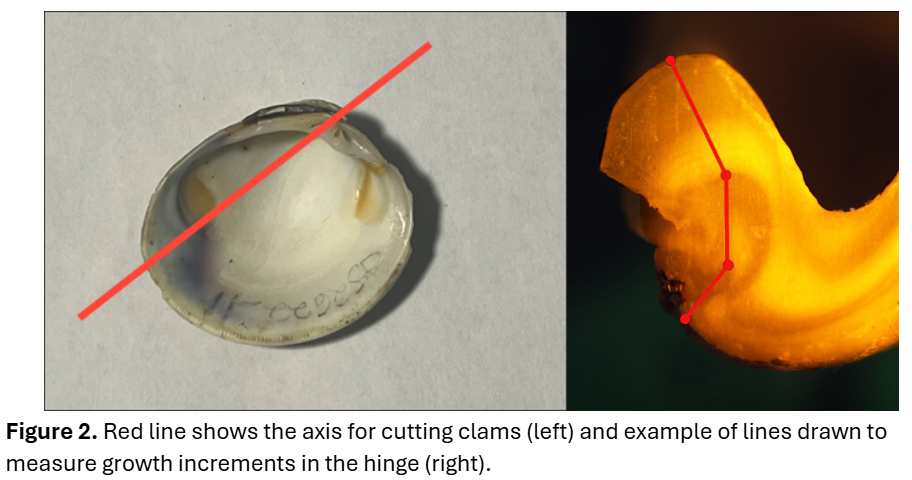
The clean, dry valves were shipped to the Woods Hole lab for age and growth estimation. Once there, the hinge of the left valve was cut in half (Figure 2), with the method varying by shell size (Table 1). The saw blade was positioned between the edge and the first set of teeth, and diagonally across the beak of the umbo. The resulting halves were polished with 320 grit sandpaper at 400 rpm.
| Shell width (mm) | Polishing method |
|
<30 |
Ground down; not cut |
|
30 to 60 |
Isomet saw |
|
>60 |
Tile saw |
Table 1. Cutting method, based on shell size.
The hinge area of each half was then digitally photographed at 7-30x magnification with an Olympus DP25 camera (Olympus Corp.), and Infinity Analyze software. These images were used to measure the distance between annuli using ImageJ (vers. 1.49v; Schneider et al., 2012) and the ObjectJ plugin (vers. 1.03s; University of Amsterdam, available from https://sils.fnwi.uva.nl/bcb/objectj).
Identification of annuli followed published protocols for age estimation (Peterson et al. 1983, Peterson et al. 1985, Jones et al. 1990, Ridgway et al. 2011). In ImageJ, a line segment was drawn from the origin to the first annulus, and another from the first to the second annulus, etc, up to the end of the hinge (Figure 2). This way, an age is determined (the number of line segments), as well as the distance (in mm) between each annulus.
Only the growth to the third annulus, calculated as the length of the first three line segments, was considered, because the first three years are what is most important for aquacultured clams. Similarly, two line segments were used to compare data for two-year-old samples collected in 2023. The data were grouped by sampling year and location for further analysis. A two-tailed t-test was used to test for differences between sets of samples.
Objective 3:
Continuous water quality monitoring data routinely collected by NJDEP at LEH was reviewed during the clam sampling period. Water quality variables included specific conductivity, salinity, temperature, dissolved oxygen concentration, dissolved oxygen percentage, turbidity, and chlorophyll concentration. Unfortunately, there were no NJDEP observations at a comparable distance to GS.
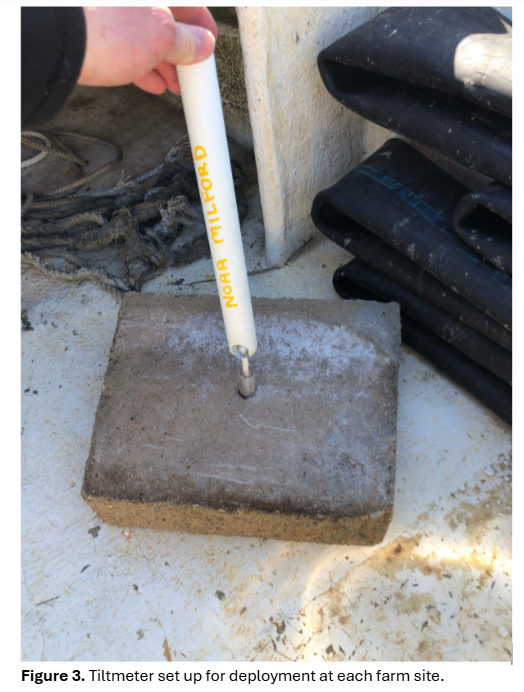
To make up for this, temperature data loggers (Onset HOBO water temp Pro v2) and tiltmeters (Lowell TCM-4 shallow water current tilt meters) were deployed at both aquaculture sites. The temperature loggers were placed just above the sediment surface, to capture temperatures surrounding the clam as well as being drawn into the mantle cavity. Tiltmeters were attached by rope to a cinderblock on site to monitor current speed continuously (Figure 3). Mean values were aggregated by month, and environmental data was used to assess the sensitivity of hard clam growth to each variable. The temperature and current speed loggers were deployed in March 2023 and remained on site until December 2023.
Objective 1:
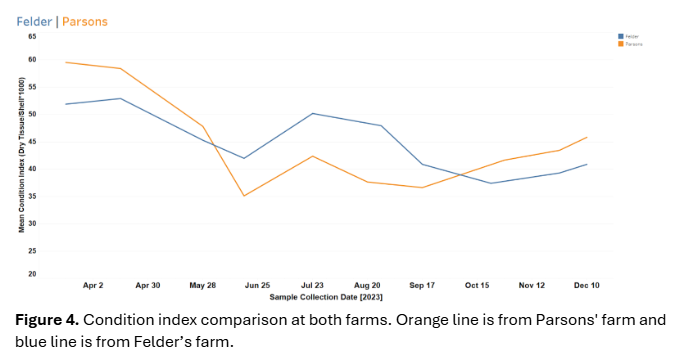
The condition index at both sites followed expected month-by-month trends and was not different between sites. Condition index peaked in the early spring months and dropped when animals normally spawn in the early summer. Condition index then recovered after spawning and continued to increase until the end of the study period (Figure 4).
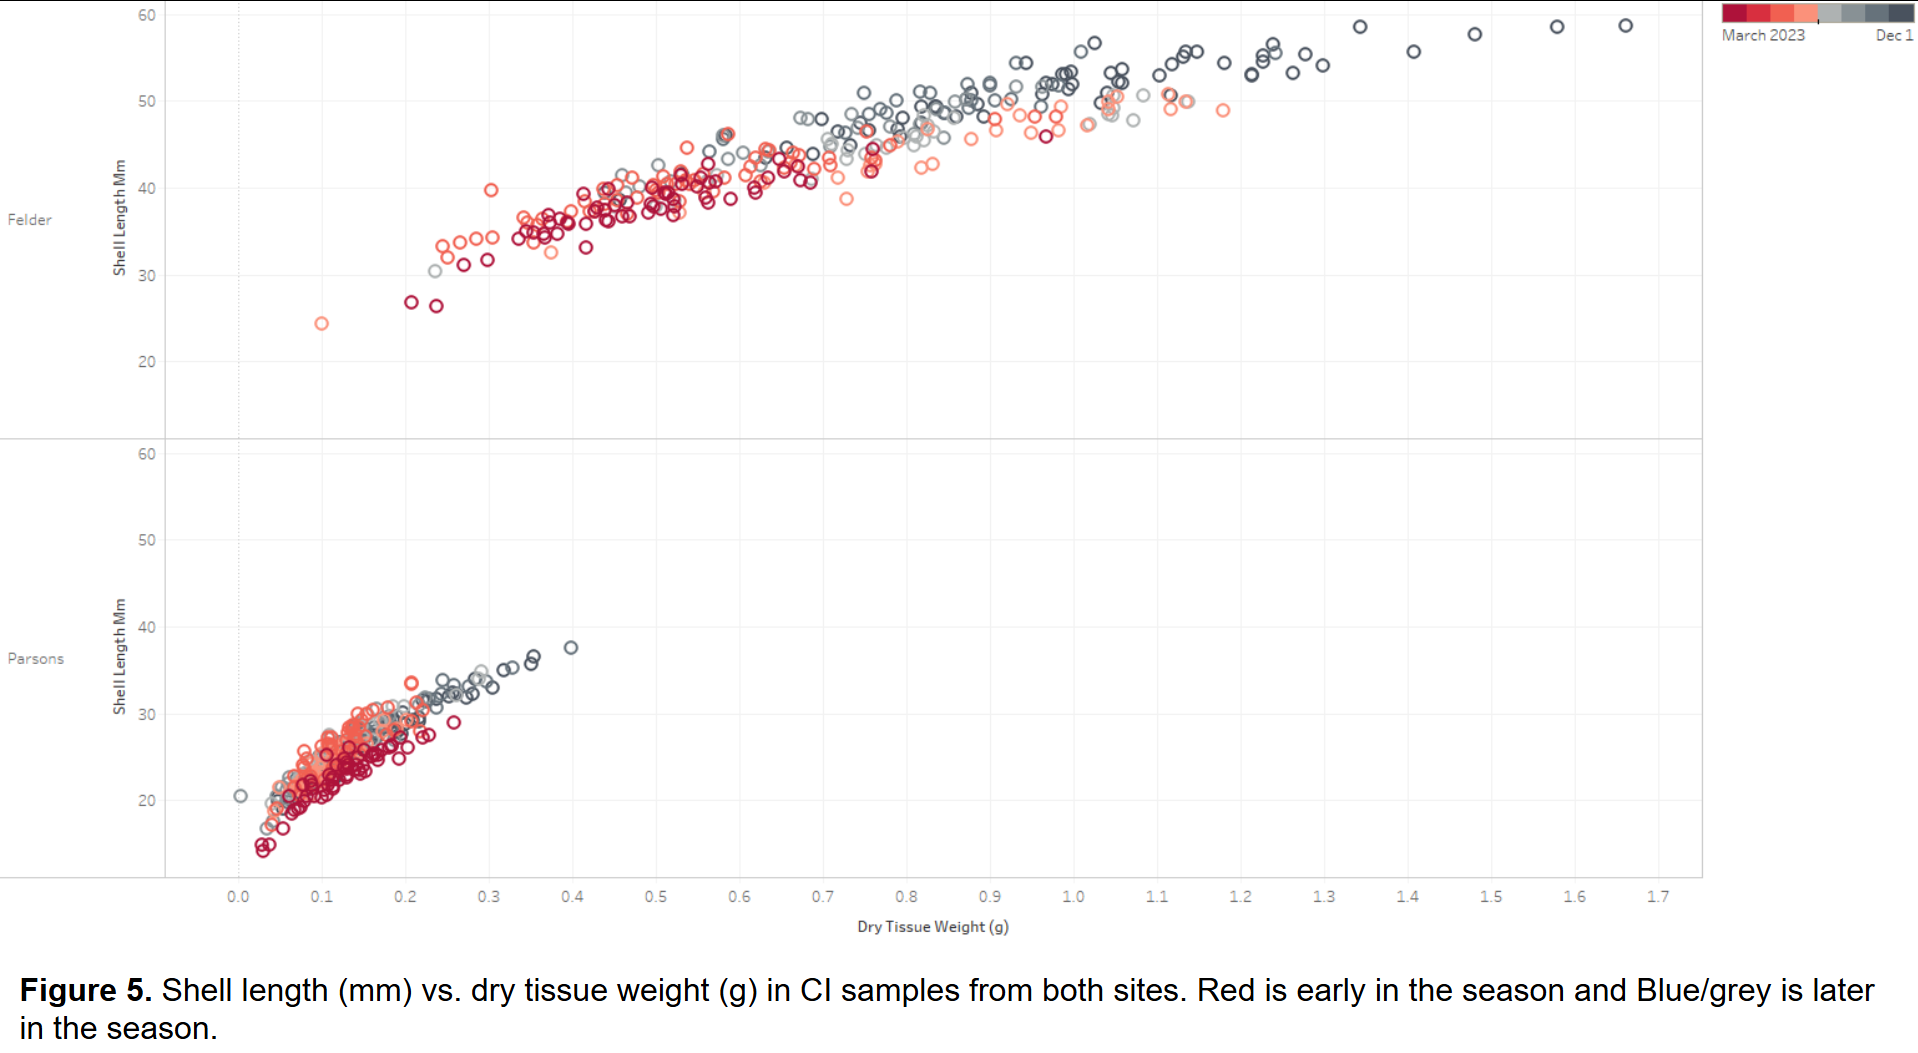
While CI remained similar between sites, dry tissue weights and shell length in monthly samples were different between sites (Figure 5). Dry tissue weight at Parsons’ farm ranged from 0.0 - 0.4 g, while at Felder’s farm it ranged from 0.1 - 1.6 g. Shell length at Felder’s farm increased by an average of 15 mm over the study period, while shell length at Parsons' farm only increased by 5 mm over the same period. This difference in tissue weight and shell length confirmed that there are differences in the way clams grow at each site over a single season.
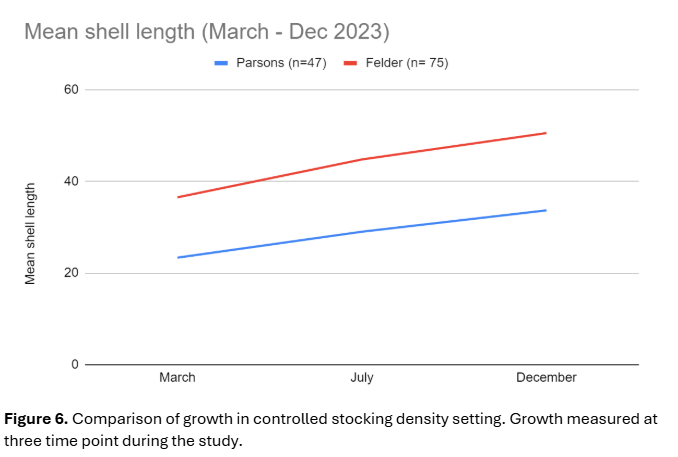
The planted, boxed clams (Figure 6) showed a difference in growth between the sites as well, but it was less pronounced. At Felder’s farm, these clams grew by an average of 14 mm over the season, which was similar to growth of the regular farmed clams there. Boxed clams at Parsons' farm grew by an average of 10 mm, which was higher than growth in his farmed clams (5 mm).
Objective 2:
Age and growth were measured on over 300 clam shells (Table 2). On samples where both sides of the valve were analyzed, the two cut faces from each clam did not reveal the same growth (t-test: P=0.007) and therefore these faces were not intermixed in later analyses.
Distance to the third annulus by month for Parsons' farm samples from 2022 averaged 4.54 mm (s.d. 0.74). This distance was higher in August, September, and October than in April, May, June, and July. This may be explained by continued growth at the edge during the year, but it was not a gradual increase as would be expected.
Comparisons between sample sets revealed that clams at Felder’s farm reached larger sizes in their first two years than clams at Parsons' farm or wild clams from near either farm (t-test: P<0.0001, Table 3). Furthermore, the two-year-old clams at Felder’s farm were similar in size to three-year-olds at Parsons' farm (Tables 3, 4).
The clams at Parsons' farm grew less in their first three years than older clam samples collected there in 2022 (t-test: P=0.033, Table 4), but they did not differ from old clam samples collected in 2023 (t-test: P=0.08).
|
Set |
Collection Location |
Collection Date |
Number Meas-ured |
Age (years) |
Mean Shell Width (mm) |
Comments |
|
Parsons – Age 3 |
Parsons |
April-Oct. 2022 |
116 |
3 |
42.1 |
8 collection dates combined |
|
Parsons – Age 2 |
Parsons |
April & June 2023 |
44 |
2 |
24.6 |
many broken |
|
Felder – Age 2 |
Felder |
April 2023 |
23 |
2 |
38.4 |
|
|
Parsons – 2023 |
Parsons |
Mar. 2023 |
36 |
6-21 |
89.9 |
Large Clams |
|
Parsons – Wild |
LEH - Sites 1 & 2 |
July 2023 |
25 |
9-21 |
89.8 |
Wild samples collected near Parsons' farm |
|
Felder – Wild |
GS |
Aug. 2023 |
51 |
9-21 |
85.8 |
Wild samples collected near Felder’s farm |
|
Parsons – 2022 |
Parsons |
June 2022 |
12 |
6-14 |
92.1 |
Large clams (were to be broodstock) |
Table 2. Samples analyzed for age and growth. Known-age samples are indicated in bold.
|
Group |
Mean Growth (mm) |
Significance |
|
Felder - Age 2 |
4.55 |
a,b,c |
|
Parsons - Age 2 |
2.49 |
a,d |
|
Felder - Wild |
2.05 |
c,d |
|
Parsons - Wild |
2.35 |
b |
Table 3. Mean growth to the second year for measured clams. Letters indicate significant differences between groups (a, b, c: P<0.0001, d: P=0.004).
|
Group |
Mean Growth (mm) |
Significance |
|
Parsons - Age 3 |
4.54 |
a |
|
Felder - Wild |
4.33 |
b |
|
Parsons - Wild |
4.68 |
|
|
Parsons - 2022 |
5.30 |
a,b,c |
|
Parsons - 2023 |
4.31 |
c |
Table 4. Mean growth to the third year for measured clams. Letters indicate significant differences between groups (a: P= 0.033, b: P=0.011, c: P=0.009).
This shows that the clams at Parsons’ farm are growing more slowly than at Felder’s farm and are not growing faster than wild clams nearby. This results in more than a year extra time to grow clams at Parsons’ farm out to market size. However, it is not clear whether growth has changed over a longer time-period at Parsons' farm.
Objective 3:
The continuous water sampling measurements by NJDEP near Parsons’ farm did not show any major natural event or change in condition that could be responsible for the slow growth observed there. Without direct comparisons to Felder’s farm, these parameters could not provide any further conclusions.
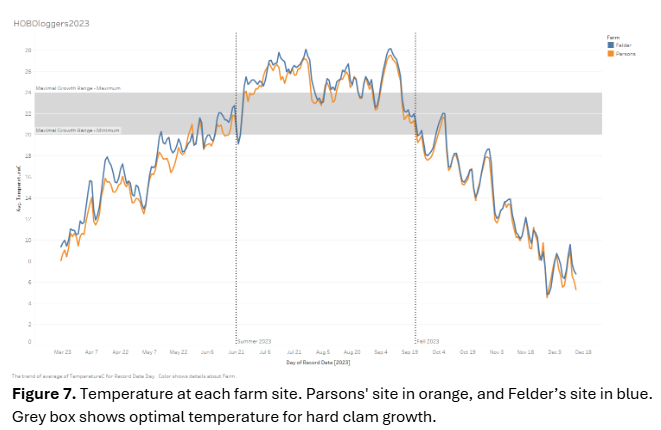
The temperatures at Parsons’ farm ranged from 5– 27°C while the temperatures at Felder’s farm were between 5 – 28°C. The largest difference in temperature between sites was circa 2°C during the spring months, when the temperatures at Felder’s were warmer than at Parsons' farm. From early summer to the end of the study period, the temperatures remained similar (Figure 7) between the two farms. Temperatures at both farms were in the ideal growth range for less than 6 weeks.
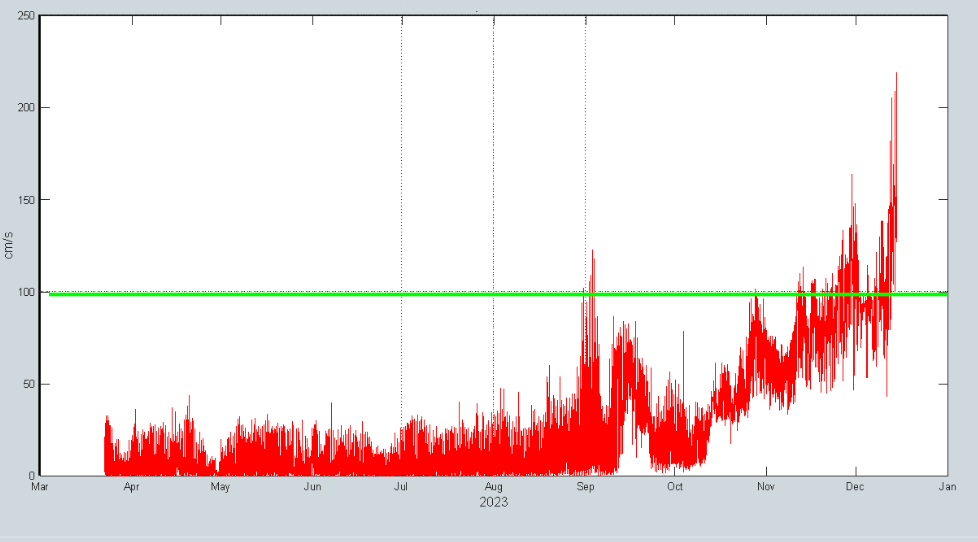
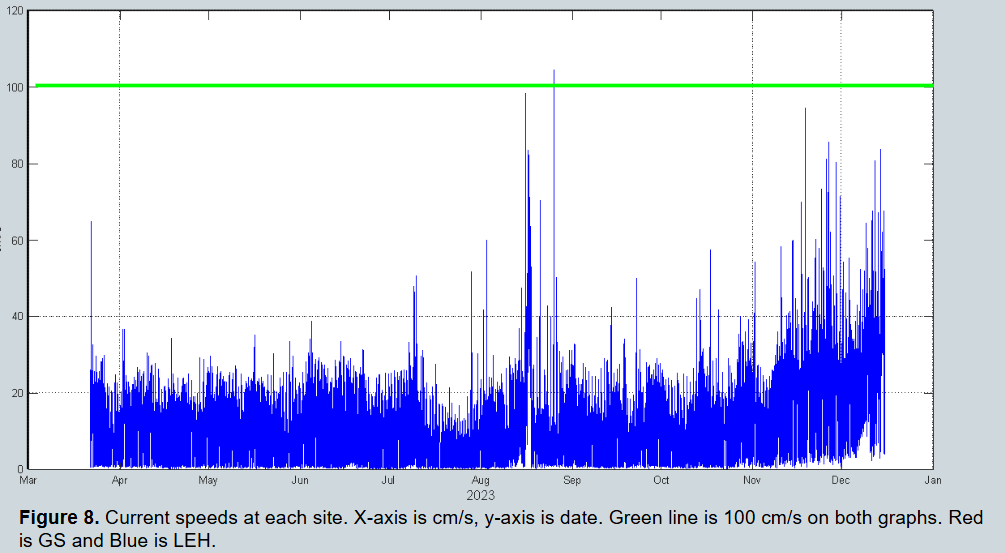
Current speed (Figure 8) at Parsons' site averaged below 30 cm/s for the majority of the season (March to November) and increased gradually in the winter, only exceeding 100 cm/s once during a late summer storm. Current at Felder’s site averaged a similar 30 cm/s during the majority of the season from March to October, but had much larger increases during fall and winter, increasing to above 100 cm/s regularly in late November and December.
Objective 1:
The condition index followed expected trends and was similar at both sites. Tissue and shell weight were different between sites, with Felder’s clams increasing in weight at a much higher rate than Parsons' clams.
Objective 2:
Growth measurements on the hinge area of the clam shells showed that clams are growing faster at Felder’s farm than at Parsons' farm or in the wild. However, it is not clear whether growth has changed over a long period of time at Parsons' farm.
Objective 3:
Temperature and current were the environmental parameters measured at both sites. Temperatures were very similar at both sites, and current speed was similar at both sites except for in the late fall and winter, when the current at Felder’s farm was much stronger than at Parsons' farm.
Overall conclusions:
We sought to investigate the reasons for poor growth on hard clam farms in one region of NJ. The goal was to compare growth and environmental conditions at two sites, as well as conduct ageing of clams at both sites to compare short- and long-term trends. We were able to show that there are differences in growth between the two sites, and that temperature does not appear to cause the difference, but current speeds may play a role. Also, we were able to show that similar stocking densities lead to similar growth rates, so husbandry practices may be important.
Education & outreach activities and participation summary
Participation summary:
The results of the study have been presented at various regional and local meetings, as well as a blog post published by one of the coauthors. We presented updates and results at the following meetings: NJ Shellfisheries Council Meeting, Milford Aquaculture Seminar (Jan 2023, and 2025), and the Interstate Shellfish Sanitation Conference. Our results have also led to further, more targeted studies by the farmer experiencing poor growth. While we did provide new information, we did not believe that the data was compelling enough to build larger outreach materials or provide a grower workshop. We conducted word of mouth communications with farmers in the area and provided the growers involved with the tools to investigate further.
Blog post by one of the researchers visiting the farmer partner's facility: https://www.fisheries.noaa.gov/science-blog/not-all-seeds-are-grown-land,
Not All Seeds Are Grown On Land (pdf)
Learning Outcomes
The farmers involved in the study gained a better understanding of the environmental conditions and historical growth patterns on their farm. Specifically, the farmer who was seeing slow growth issues learned that current speeds are playing a role. The farmer also learned that stocking densities may need to be adjusted to ensure adequate food availability to accommodate the growth of aquaculture in the area.
Project Outcomes
The farmer was able to fund a SARE farmer grant to look specifically at the phytoplankton concentration and species in his area, which can be used with current speeds to determine a food flux for his farm. Food flux is a calculated value that can help determine if the clams are receiving enough food. The farmer also now understands he needs to carefully consider different stocking densities to become more efficient when looking at overall clam growth vs. farm productivity. This project was an early step in a process that will lead to improved productivity on the farm. While we were unable to give the farmer a concrete answer, this study has provided needed evidence to secure further funding to investigate the problem.
I believe the approach of the study was successful in investigating the cause of poor clam growth in LEH with the resources we had available to us. The overall goal was to provide new information that the farmer could use to narrow his focus on the specific causes of growth issues in his area. We faced several challenges during the project period, but we were able to overcome them. The farmer gained knowledge, which he was able to leverage to receive more money to investigate the problem, as well as rethink what he can grow in his area.
While we did provide new information, we did not believe that the data was compelling enough to build larger outreach materials or provide a grower workshop. We conducted and supported local presentations and word of mouth communications with farmers in the area. The stocking density growth experiment showed that husbandry practices did play a role in the difference in growth between the two sites. Parsons has been farming for a long time and, while his husbandry practices are generally good, this study showed that there may be benefits in reexamining stocking density as a factor in the poor growth he is seeing. We did not host a workshop partly because we were concerned that the grower may feel our results imply poor husbandry practices at his farm, and we don’t want to damage the market attitude of his farm.
Having federal staff as partners in the project made it difficult to use a large portion of the money we had set aside for scientific writing and communications on the project, travel, and publication fees. The scientific communications funds were initially budgeted to cover salary for the research lab communications contractor, but we later discovered that the money could not be transferred from USDA to NOAA in a timely manner. While this prevented use of these funds, we were still able to develop a blog on the NOAA website about the farmer and study (https://www.fisheries.noaa.gov/science-blog/not-all-seeds-are-grown-land).
Another challenge we faced is that the lead scientist, Meghana Parikh, left her position at the lab before the conclusion of the study. Her expertise was in data analysis, including statistical analysis. This left a gap in our ability to run sophisticated statistical analysis on the data. We were not able to spend travel funds that were dedicated for Meghana, and we were not able to publish a paper in the time scale of this project to use the budget set aside for the open access publication fee.
Further Research Needed:
As stated earlier, we believe there is a need to look at stocking densities and husbandry practices in NJ further, along with chlorophyll concentrations across study sites, to provide even more information to the growers in NJ. Also, hard clam populations have dramatically changed in other Northeast states. There have been funded efforts in RI, NY, and CT to investigate declines in both farmed and wild harvested clams. We hope that the lessons learned from this project can be applied to studying hard clams throughout the Northeast. Dale Parsons, one of the grower partners on this project, has received a SARE Farmer Grant to investigate the problem further, focusing on phytoplankton communities in his area compared to the Felder’s farmed area.