Progress report for ONE24-462
Project Information
This project seeks to:
- Promote the adoption of FLUPSYs to enhance marine ecosystems and combat nonpoint source pollution.
- Cultivate and supply larger seed stock to nearby farms to support the long-term sustainability and economic growth of the aquaculture industry.
Shellfish farming in the United States faces numerous challenges, including limited seed stock availability and crop protection, water quality concerns, lack of equipment, and limited waterfront access. Limited seed production and availability in many parts of the northeast, especially on Long Island is of growing concern for it will likely hinder the aquaculture industry's potential to continue to grow. Additionally, many stakeholders, such as marinas and shoreline homeowners may not fully understand the economic and ecological benefits of a FLUPSY system. This project aims to address the challenge of obtaining healthy seed and demonstrate to stakeholders the ecological benefits shellfish aquaculture nursery systems by deploying a 24-barrel FLUPSY. The FLUPSY will be used to collect data on seed stock resilience and water quality enhancement. The intention of this project to establish best practices that can be used as a model for other growers to follow to help increase their productivity as a farm while mitigating negative environmental impact and improving stakeholder relationships.
The purpose of our proposed project is to assess the viability and benefits of FLUPSY technology in enhancing oyster farming in the Peconic Bay Estuary System and greater Northeast region. By conducting this research, we seek to advance current knowledge in aquaculture practices, providing evidence-based insights to promote sustainable aquaculture.
The industry's need for this project is evident in the increasing demand for sustainable seafood and the urgent necessity to mitigate environmental impacts. Quantifying the potential economic, social, and environmental impacts, our project anticipates positive outcomes for farmers and coastal communities such as improved water quality, cultivation of more resilient seed stock, and enhanced farm productivity. If the aquaculture industry is expected to grow to its greatest potential, farmers must be able to obtain healthy seed and know how to handle their seed in the nursery phase. For many farmers in the northeast, investing in a FLUPSY is large expense. Understanding the economic benefits of a FLUPSY due to increased survival and growth rates of seed housed within would create more incentive for farmers to invest. Furthermore, demonstrating the ecological benefits could help foster better reception of FLUPSYs with landbased stakeholders, allowing for better access to waterfront space.
The expected impact of our solution aligns with Northeast SARE’s outcome statement and several aspects of sustainable aquaculture. By enhancing farm productivity, FLUPSYs can increase farm profitability be increasing growth rates and survival of juvenile oysters and help create new employment opportunities in coastal communities. Additionally, by optimizing growth conditions, farms that run FLUPSYs can provide neighboring oyster farms with viable seed stock, thereby advancing increased production and economic opportunities for the broader aquaculture community. Rigorous data collection methods will be established to monitor both water quality and the mortality rates of the seed stock. This data will serve as crucial evidence to encourage the adoption of FLUPSYs by other farmers and marinas as well as support the expansion of the USDA's Shellfish Pilot Crop Insurance Program, providing financial stability for other shellfish growers. Ultimately, our project aims to address multiple barriers the aquaculture industry faces as a means to improve the quality of life for shellfish farmers, their families, and the farming community.
Cooperators
Research
Study sites
This study was conducted at three sites in eastern Long Island, New York. The primary experimental site was the floating upweller system (FLUPSY), located at the corner boat slip in Safe Harbor Marina, Greenport, NY (Figure 1). An adjacent dock within the same marina served as the control site (Figure 1). Both the FLUPSY and control dock sites were located in close proximity and remained fixed throughout the duration of the study. The third field site where oyster growth continued was Oyster Ponds, located in Orient, NY (Figure 1).
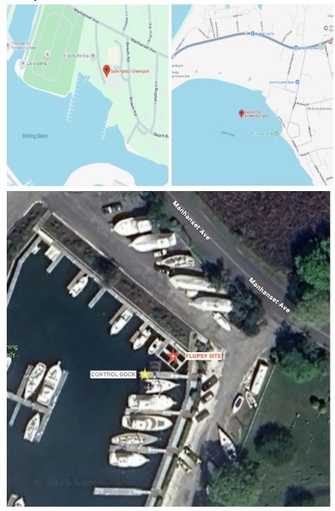
Figure 1. Study sites
Safe Harbor Marina in Greenport, NY (top left panel); Oyster Ponds in Orient, NY (top right panel); and Safe Harbor Marina control dock and FLUPSY site (bottom panel). The control dock is designated by the yellow star, and the FLUPSY site is designated by the red star.
Organism Collection and FLUPSY Deployment
Eastern oyster (Crassostrea virginica) seed consisted of triploid oysters sourced from Mook Sea Farm (Maine, USA). A total of one million seed oysters were ordered and deployed incrementally into the FLUPSY barrels over the course of the summer growing season. Seed density varied temporally as oysters were processed, sorted, and redistributed weekly.
The FLUPSY system consisted of multiple, vertical silos connected to a trunkline pipe that supplied continuous flow through seawater (Figure 2). Each of the three experimental silos were labeled with ribbon to distinguish them from other silos on the trunkline that were not being sampled from (Figure 2). Silos remained attached to fixed positions on the trunkline to ensure consistency in water flow exposure across sampling periods.
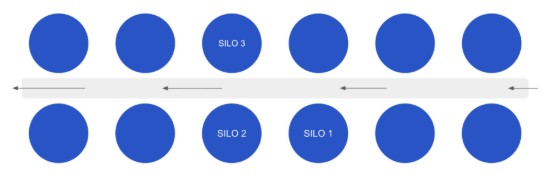
Figure 2. Floating upweller system (FLUPSY) schematic
Schematic of the floating upweller system. The FLUPSY system consisted of multiple, vertical silos connected to a trunkline pipe that supplied continuous flow through seawater. Experimental silos were labeled with ribbon to be distinguished from other non-experimental silos. Silos remained attached to fixed positions on the trunkline to ensure consistency in water flow exposure across sampling periods.
FLUPSY Maintenance and Processing
FLUPSY silos were typically processed on a weekly basis. During processing, silos were removed from the trunkline pipe, loaded onto a flatbed truck, and transported to Alice’s Fish Market in Greenport, NY. Oysters were then sieved by hand or processed using a mechanical tumbler, depending on size. Following processing, oysters were measured and redistributed into clean, power-washed silos before being returned to their original positions on the FLUPSY trunkline. If silos were not sorted during a given week, they were still removed from the trunkline and agitated in the water to resuspend sediment. Brushes were used to remove fouling and debris from the interior of the barrels and piping to maintain adequate water flow through the system.
Water Quality Data Collection
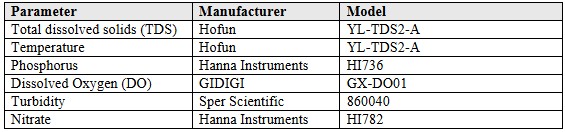
Water quality data was collected from the three experimental silos within the FLUPSY. These silos were marked with ribbon to distinguish them from non-sampled barrels and remained in the same position on the trunkline throughout the study. Water samples were collected near the internal filter of each silo, where outflowing water was present. The following parameters were measured in each silo: temperature (°C), nitrate (ppm), phosphorus (ppb), turbidity (NTU), dissolved oxygen (% saturation), and total dissolved solids (ppm). Measurements were obtained using handheld water quality instruments (models and manufacturers listed in Table 1).
Table 1. Water quality parameter sampling equipment manufacturers and models.
Volume Measurements
Total oyster volume (L) was measured prior to sieving and size sorting. For smaller oysters, volume was estimated using volumetric sampling methods. A known volume of oysters was collected using graduated beakers; individual oysters were counted, and an average number of oysters per milliliter was calculated. This value was then extrapolated to estimate total volume in liters (L).
When oysters were processed using the mechanical sorting machine, volume was measured using four-liter plastic buckets, since collection totes beneath the sorter lacked volume markings. Buckets were filled sequentially and emptied into a clean tote until the total volume was recorded.
The average total volume for the experiment was calculated as the mean volume across the three experimental silos, using initial density counts for each silo. Average total volume data was separated into two trials: Trial 1 (project initiation through July 11th) and Trial 2 (July 21st through August 7th).
Sieving and Size Sorting Procedures
Oysters were sieved weekly to assess growth and manage density. Early in the study, sieving was conducted manually using size-specific mesh sieves. As oysters increased in size, a mechanical tumbler was used to sort oysters into three size classes, each collected into separate totes.
During trial 1 (June 19 – July 11), oysters that were retained on the sieve were returned to the experimental silos. Oysters that did not retain (DNR) were removed from the experimental silos but returned to the FLUPSY system by being redistributed into non-experimental barrels on the trunkline.
During trial 2 (July 11 – August 7), oysters were only processed using the tumbler machine and not hand sieved. Initially, only oysters from the smallest size class (Tote 1) were returned to the experimental silos to maintain higher densities in the experimental silos. However, as oysters grew larger and fewer individuals fell into Tote 1, oysters from Tote 2 were returned to the experimental silos. Oysters that were not returned to experimental silos were either redistributed into non-experimental FLUPSY barrels or transported to an off-site creek facility for subsequent grow-out phases, where they were bagged and placed on racks.
Calculations
Environmental Parameters
All environmental parameter data was calculated as the mean of the three experimental silos. Data is presented as average ± standard error.
Average Total Volume
The total volume of oysters (L) was measured in each silo before the sampling period. The average total volume (L) of oysters before was calculated as the mean of the three experimental silos. The total volume of oysters (L) was measured in each silo after the sampling period but before they were sieved for size grading. The average total volume (L) of oysters after was calculated as the mean of the three experimental silos. Data is presented as average ± standard error.
Yield
Average yield was calculated using volumetric counts from each silo. Each yield metric was determined by quantifying the number of oysters that started in the silo and the number that remained when they were pulled up and sieved for redistribution. All count estimates were calculated by multiplying the count per unit volume by the volume of the sample. The count per unit volume was measured by counting the number of oysters in a fixed volume. Next, the total volume was measured. Initial counts were determined using the count per volume and the volume that entered the silo. The initial counts for subsequent samplings were determined using the count per unit volume of the group returned to the silos and the volume of oysters returned to the silos. We calculated estimates of final oyster counts after sieving. Once sieving was completed, there were several different-sized groups. For each group, volumetric counts were taken. The estimates for each size group were then summed together to get a total count of oysters that remained. This remaining count was then divided by the initial count in the silo.
Environmental Parameters
Temperature
Temperatures at the control dock and the experimental silos ranged from 20.4°C – 27.77°C and 17.94°C – 27.7°C (Table 2; Fig 3). The temperatures at the control dock and the average temperature within the experimental silos were similar over time (Table 2; Fig 3). Temperature increased at the control dock and in the three experimental silos as the experiment continued, corresponding with the continuation of the summer months (Table 2; Fig 3).
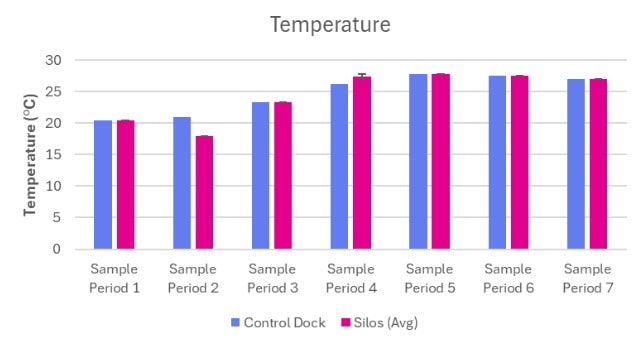
Figure 3. Temperature (°C) measured at Oyster Ponds Control Dock and Silos
Temperature (°C) was measured at a Control Dock (n=1) and Silos (n=3) over seven sampling periods (June 13, 2025 – July 25, 2025). Blue bars represent the control dock measurement. Pink bars represent the average of three silo measurements. Data is presented as average + standard error (SE).
Nitrate
Nitrate concentrations at the control dock and experimental silos were 0 ppm throughout the duration of the study (Table 2). The nitrate concentration at the control dock did not differ from the nitrate concentration of the experimental silos (Table 2).
Phosphorous
Phosphorous concentrations at the control dock and experimental silos ranged from 9 ppb – 43 ppb and 4 – 50 ppb respectively (Table 2; Fig 4). The phosphorous concentration of the experimental silos during sampling period one was based on one reading from one silo. (Table 2; Fig 4). The average phosphorous concentration of the three experimental silos was higher than the concentration of phosphorus at the control dock, except for sampling period 3 where the control dock had a higher concentration (Table 2; Fig 4).
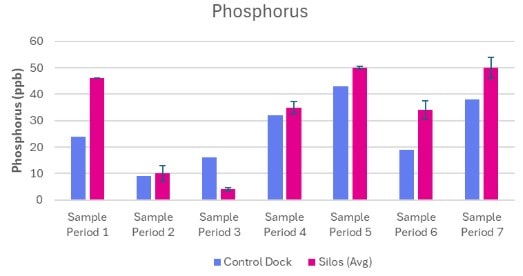
Figure 4. Phosphorous (ppb) measured at Oyster Ponds Control Dock and Silos
Phosphorus concentration (ppb) was measured at a Control Dock (n=1) and Silos (n=3) over seven sampling periods (June 13, 2025 – July 25, 2025). Blue bars represent the control dock measurement. Pink bars represent the average of three silo measurements. Data is presented as average + standard error (SE).
Turbidity
Turbidity levels at the control dock and experimental silos ranged from 1.5 NTU – 7.99 NTU and 2.41 NTU – 9.44 NTU respectively (Table 2; Fig 5). Turbidity levels at the control dock showed a decreasing trend until sampling period seven (Table 2; Fig 5). The average turbidity of the experimental silos showed a relatively stable trend until sampling period seven (Table 2; Fig 5) The average turbidity of the three experimental silos was relatively higher than the turbidity at the control dock, except for the initial and third sampling periods (Table 2; Fig 5).
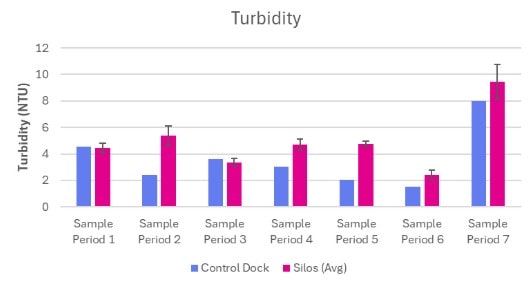
Figure 5. Turbidity (NTU) measured at Oyster Ponds Control Dock and Silos
Turbidity (NTU) was measured at Control Dock (n=1) and Silos (n=3) over seven sampling periods (June 13, 2025 – July 25, 2025). Blue bars represent the control dock measurement. Pink bars represent the average of three silo measurements. Data is presented as average + standard error (SE).
Dissolved Oxygen
Dissolved oxygen levels at the control dock and experimental silos ranged from 76.9% - 89.3% and 82.8% – 87.7% respectively (Table 2; Fig 6). The levels of dissolved oxygen at the control dock did not differ from the dissolved oxygen levels between the three experimental silos across all sampling periods (Table 2; Fig 6).
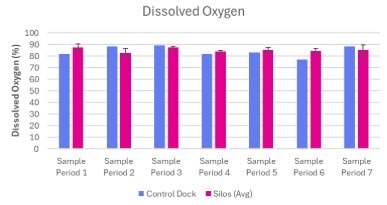
Figure 6. Dissolved Oxygen (%) measured at Oyster Ponds Control Dock and Silos
Dissolved oxygen concentration (%) was measured at a Control Dock (n=1) and Silos (n=3) over seven sampling periods (June 13, 2025 – July 25, 2025). Blue bars represent the control dock measurement. Pink bars represent the average of three silo measurements. Data is presented as average + standard error (SE).
Total Dissolved Solids (TDS)
TDS concentrations at the control dock and experimental silos ranged from 4506 ppm – 8966 ppm and 4371 ppm – 8968 ppm respectively (Table 2; Fig 7). Sample period 2 (June 19, 2025) did not have a control dock measurement comparison because a reading was not able to be obtained. The experimental silo measurement during sampling period 2 was based on a measurement from one silo; measurements from the other silos could not be obtained.
The concentration of TDS at the control dock did not differ from the levels of TDS between the three experimental silos across all sampling periods (Table 2; Fig 7). The levels of TDS at the control dock and between the experimental silos were higher in the first three sampling periods and decreased by about 50% by the fourth sampling period (Table 2; Fig 7).
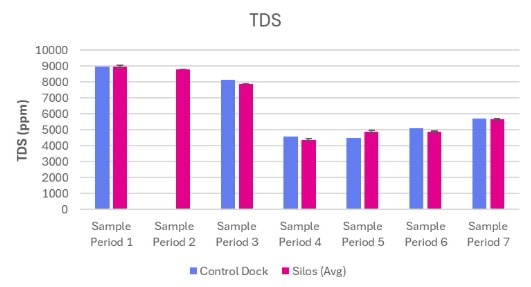
Figure 7. TDS (ppm) measured at Oyster Ponds Control Dock and Silos
TDS concentration (ppm) was measured at a Control Dock (n=1) and Silos (n=3) over seven sampling periods (June 13, 2025 – July 25, 2025). Blue bars represent the control dock measurement. Pink bars represent the average of three silo measurements. Data is presented as average + standard error (SE).
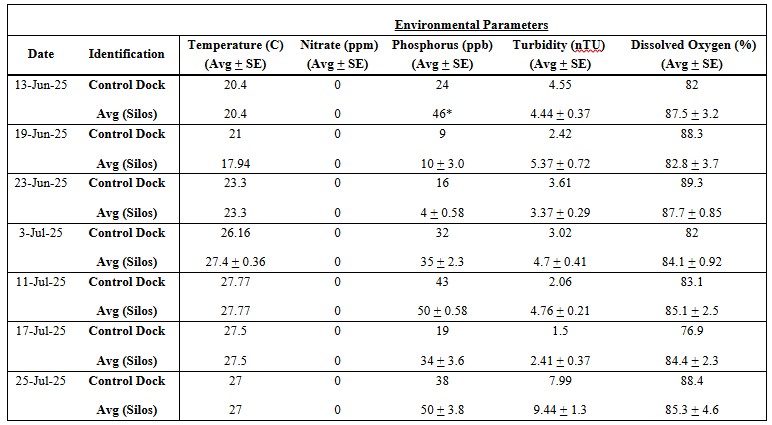
Table 2. Environmental parameters measured from the Control dock and Silos at Oyster Ponds (June 13, 2025 – July 25, 2025). Data with an asterisk (*) represents data that had limited sample readings. Control dock measurements were based on one sample, while silo measurements were based on the average of three samples.
Average Total Volume
Trial 1
The Average total volume of oysters before and after sampling period one was 1.83 ± 0.17 L and 3.42 ± 0.08 L respectively (Table 3; Fig 8). The average total volume of oysters before and after sampling period two was 2.3 ± 0 L and 12.1 ± 1.6 L respectively (Table 3; Fig 8). The average total volume of oysters before and after sampling period three was 2 ± 0 L and 5.25 ± 0 L respectively (Table 3; Fig 8). The average total volume of oysters after each sample period (before sieving oysters for size) was larger in comparison to before the respective sampling period (Table 3; Fig 8)
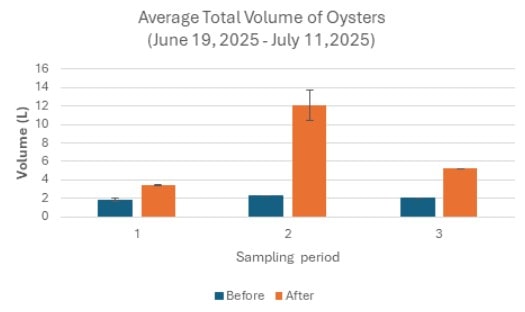
Figure 8. Average Total Volume of Oysters (June 19, 2025 – July 11, 2025)
The average total volume of oysters measured across three sampling periods. Navy bars represent the average total volume of oysters before the sampling period. Orange bars represent the average total volume of oysters after the sampling period (before sieving). Data is presented as average + standard error (SE).
Trial 2
The average total volume of oysters before and after sampling period four was 2 ± 0 L and 9.42 ± 1.80 L respectively (Table 3; Fig 9). The average total volume of oysters before and after sampling period two was 2 ± 0 L and 4.33 ± 0.22 L respectively (Table 3; Fig 9). The average total volume of oysters before and after sampling period three was 1 ± 0 L and 1.38 ± 0.13 L respectively (Table 3; Fig 9). The average total volume of oysters after each sample period (before sieving oysters for size) was larger in comparison to before the respective sampling period (Table 3; Fig 9)
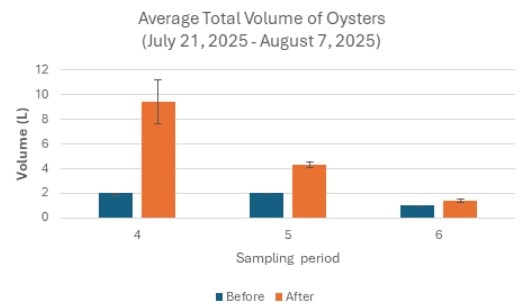
Figure 9. Average Total Volume of Oysters (July 21, 2025 – August 7, 2025)
The average total volume of oysters measured across three sampling periods. Navy bars represent the average total volume of oysters before the sampling period. Orange bars represent the average total volume of oysters after the sampling period (before sieving). Data is presented as average + standard error (SE).
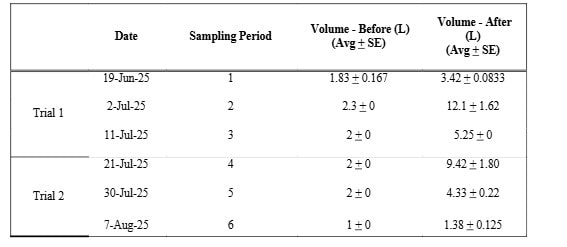
Table 3. Average total volume (L) of oysters measured from experimental silos at Oyster Ponds (June 19, 2025 – August 7, 2025). Both before and after volume (L) measurements are based on the average of three experimental silos. Sampling periods one through three indicate one experimental trial. Sampling periods four through six indicate one experimental trial.
Average Percent Yield
Trial 1 ranged from June 11th to July 2nd, and Trial 2 ranged from July 11th to July 30th. Trial 2 was a new cohort of oysters because oysters that were grown during Trial 1 had sized out of the FLUPSY system. The table below depicts the volumes and counts per volume of each sample. Data is presented as average ± standard error.
Trial 1
The average yield of the oysters in the experimental silos from June 11 to June 19 was 0.880 ± 0.009 (Table 4; Fig 10). The average yield of the oysters in the experimental silos from June 19 to July 2 was 0.917 ± 0.065 (Table 4; Fig 10).
Trial 2
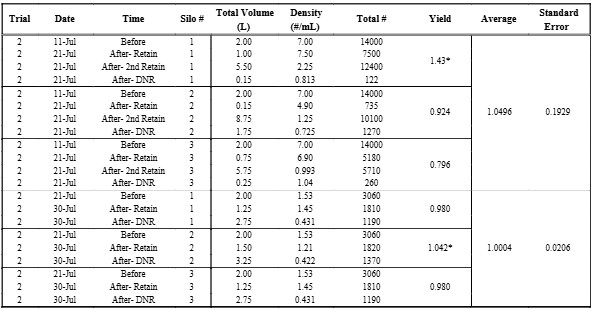
The average yield of the oysters in the experimental silos from July 11th to July 21st was 1.0496 ± 0.1929 (Table 5; Fig 10). The average yield of the oysters in the experimental silos from July 21st to July 30th was 1.0004 ± 0.0206 (Table 5; Fig 10). It is not valid to generate yield averages that exceed 1.0. The likely reason we observed over 100% yield was that for the later sampling dates, the initial counts of small-sized oysters were slightly underestimated.
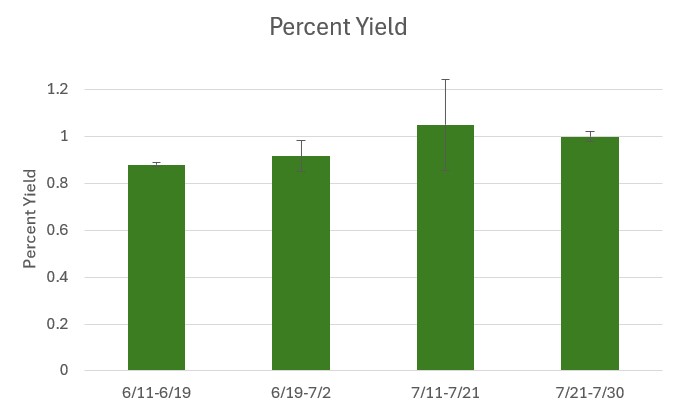
Figure 10. Percent Yield (June 11, 2025 - July 30, 2025)
The average percent yield across three experimental silos. Data is presented as average ± standard error (SE).
Table 4. Average percent yield of oysters in experimental silos during Trial 1 (June 11, 2025 – July 2, 2025)
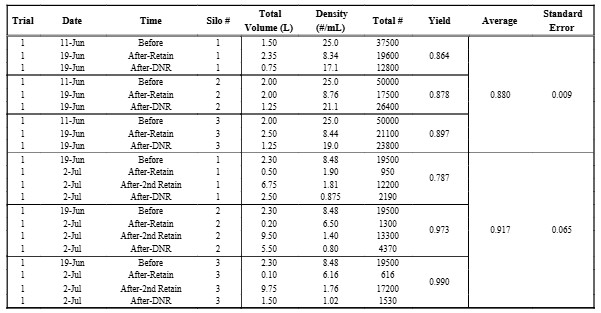
Table 5. Average yield of oysters in experimental silos during Trial 2 (July 11, 2025 – July 30, 2025). Data with an asterisk (*) represent invalid results
The main objective of the project was to assess and quantify the impact of FLUPSY technology on marina water quality. Measuring water quality parameters such as Temperature, Nitrate, Phosphorous, Turbidity, DO, and TDS showed a negligible impact on the water quality when comparing the control dock to the experimental site. This shows that FLUPSY systems do not have negative impacts on water quality.
One of our other objectives was to promote the adoption of FLUPSYs to enhance marine ecosystems and combat nonpoint source pollution. Oyster benefits on marine ecosystems are well documented, and we continue to promote FLUPSY adoption through outreach for their benefits on ecosystem health and the local farming community. But our study findings, primarily the water quality data, did not support that FLUPSYs combat nonpoint source pollution.
Additional conclusions are still under review by the CCE team.
Education & outreach activities and participation summary
Participation summary:
Project outcomes will be shared with industry stakeholders through upcoming extension activities, workshops, and educational materials. The results of the research findings will be used as a basis to encourage other marinas to adopt similar systems utilizing FLUPSY technology and for the USDA to have access to data that can help expand the Shellfish Pilot Crop Insurance Program. Additionally, the seed stock we cultivate in the FLUPSY, once it reaches 16mm, was directly distributed to neighboring shellfish farms in the area.
Learning Outcomes
The project created opportunities for professional growth and engagement among farm staff. One seasonal employee who assisted Kate Gerstner with data collection has an academic background in marine biology and was especially passionate about contributing to the research. Her involvement highlighted how on-farm research can be both educational and motivating for employees.
Project Outcomes
This project was highly rewarding for the participating farmers, who served as the primary data collectors throughout the process. Being directly involved in data collection gave us a deeper appreciation for research institutions and the critical work they do. Participating in a project aimed at demonstrating measurable improvements in water quality was especially meaningful, as it reinforced our belief in the environmental benefits oysters have. One employee in particular with a marine biology background, was very excited to come into work and to contribute to the project.
The project made us farmers slow down and be more intentional in some regular farm practices. While we regularly observe oyster growth during routine work, tracking shell height and volume made that growth more tangible and impactful. Returning each week to document measurable progress reinforced the success of our practices and deepened our appreciation for the work we do.
Looking back, if we were to redo this project, we would like to follow the growth of all the oysters from the original cohort of oysters in the three experimental silos of the FLUPSY system. However, we ran into challenges with this because everything grows at different rates, and in order to maximize space in the system, we had to spread out oysters beyond the 3 experimental silos, limiting the amount of oysters we could monitor. Also, when it neared the end of the first trial, we could not have a large volume of large oysters in each experimental silo because it risked overcrowding the smaller oysters in the system, so we needed to remove them from the system and adjust our methods for trial 2.
There are a few data collection processes that we would alter if we were to replicate the study. Consistency in methodology and measurements was a theme with challenges that impacted our study. Keeping consistent amounts of measurements between the control and experiment sites is important. When the farmers were on site collected data, they collected data from each experimental silo, of which there were three, and then took just one measurement from the control dock. The control dock needed to have three measurements to accurately compare them to the experimental site. After running into problems with oysters growing too fast and needing to be removed from the system, the process from trial 1 to trial 2 had to be changed. Ideally, if there are multiple trials of this type of experiment, each trial should have the same standard operating procedures.
Marinas and shellfish farmers would benefit the most from understanding our results.