Final Report for OS11-058
Project Information
We initiated an on-farm project to generate local soil quality information comparing soil quality of sustainable and non-sustainable systems, and develop soil quality assessment index and online tool. We collected soil physical, chemical and biological properties in spring and summer 2011 from 63 farms. In about 65% of the fields we sampled, the owners participated in sampling and person-to-person discussion of the results we found. Overall, growers were optimistic and showed interest to use on-site soil quality measurements. We conducted two in-service trainings in 2011 and provided three presentations and demonstrations as part of a series of composting and rainwater harvesting workshops took place in May 2012.
Introduction
There are documented reports that showed conventional farming systems are associated with a decline in soil quality (Pang and Letey, 2000; Logsdon et al., 1993; McGarry et al., 2000). According to Logsdon et al. (1993) and McGarry et al. (2000) conventional soil management practices such as use of inorganic fertilizers with monocropping resulted in poor soil structure and aggregation, and an increase in soil bulk density, soil salinity, nitrogen leaching and ground water contamination. A research conducted in California that compared 13 pairs of organic (utilize ecological based soil management) and conventional strawberry agroecosystems confirmed that soil quality in organic strawberry was way better than conventional agroecosystems (Reganold et al., 2010). According to these authors, total carbon and nitrogen were 21.6 and 30.2% more in organically managed surface soils compared to their conventional counterparts. In Oklahoma, neglect of indigenous knowledge systems and farming culture has resulted in reduction of farm crop diversity and soil degradation since the 1940s. In 1945, there were 4.6 crop commodities per farm. These were reduced to 1.2 by 2002 (McDermott et al., 2006). Along this, monocropping, erosion, residue removal and excess fertilizer use for the limited commodities grown in the state resulted in poor soil quality. Soil pH in Oklahoma soils was reduced due to application of ammonia based fertilizers with poor efficiency of use (Raun and Johnson, 1999), and continuous mining of basic cations with harvested yield. Fertilizer use efficiency, particularly nitrogen in cereals is estimated to be 33 to 45% despite increased yield obtained due to fertilization (Raun and Johnson, 1999). This suggests that more than 50% of applied fertilizer could either leach into the ground, drain to water bodies or go back to the atmosphere as greenhouse gases causing environmental pollution. Oklahoma soils are very low in soil organic matter partly attributed to conventional soil and crop production practices. It was documented that Oklahoma lost 62,752,791 tons of organic carbon to agriculture (OCC, 2003) since the 1940s. In fact studies showed that organic matter was reduced to <1.1% from its original 4.0% due to continuous cropping and conventional tillage following the conversion of grassland to continuous crop production (Boman et al., 1996; Girma et al., 2007). Given the fact that soil quality is the basis for sustainable production system (Wander et al., 2002), due emphasis must be given for improving and monitoring soil quality. But locally documented information, technical skill and practical models (Middendorf, 2007) are lacking. Also, the shift to a more sustainable soil management system remained slow because of lack of data and education in Oklahoma. To address these problems, it is necessary to integrate the different soil components together to evaluate changes in soil quality in time and space. This can be achieved with the use of indices (Granatstein and Bezdicek, 1992; Doran and Parkin, 1994). An index must be adaptable to local or regional conditions. Suitable reference points and optimum ranges are needed for soil quality components (Girma, 2009).
(1) Generate local soil quality information comparing soil quality of sustainable and non-sustainable systems ,
(2) develop soil quality assessment index that can be used to quantify overall soil quality status of a farm , and
(3) develop an online soil quality assessment decision aide program.
Cooperators
Research
Farm Selection
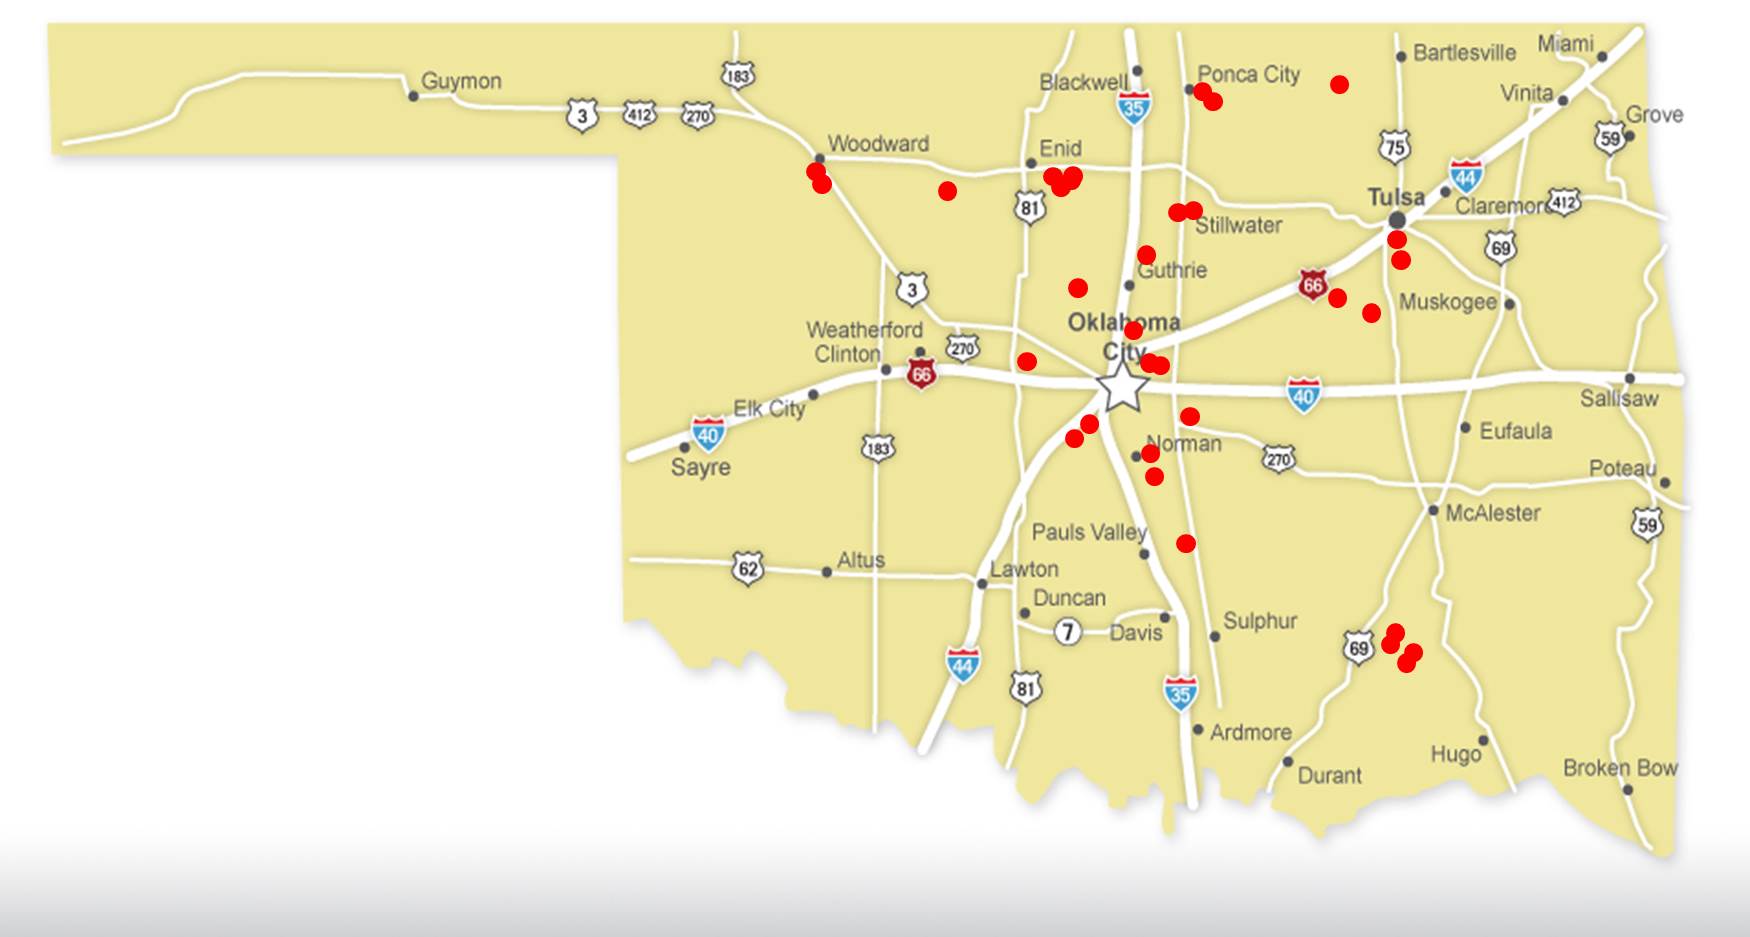
With the help of county extension educators and Oklahoma Department of Agriculture’s list of organic operations, samples were collected from 63 unique farms from 32 organic, low input or conventional operations across central Oklahoma (Figure 1). Farms were well distributed across Central Oklahoma but most of organic farms were concentrated near urban areas (Figure 1). Site description including slope, cropping history, geographical coordinates, soil classification and long-term weather data from closest weather stations were documented.
Soil Sampling and Processing
Each farm was divided into different grids/zones (up to 5) based on prior soil survey data. For surface soil (0-30 cm) laboratory analysis, 12 cores were randomly collected from each grid/zone and composited into a sample from a depth of 0-30 cm for each farm. These samples were analyzed for soil chemical and physical properties. Samples were collected in spring and fall 2011 from each field when crop was not growing in the field. We assessed soil quality using two methods: laboratory and field based analysis. It was not possible to measure accurately some of the chemical properties in the field thus the comparison of the two methods was limited to pH, EC and nitrate. We used selected properties measured in both laboratory and field as indicators of soil quality to determine the level of soil quality of each farm. Soil samples were air-dried and passed through a 2 mm sieve. In the lab, Mehlich-3 P, and extractable K, Ca, and Mg were quantified using established extraction and quantification procedures at Soil, Water, and Forage Analytical Laboratory (SWFAL) in the department of Plant and Soil Sciences, Oklahoma State University. Soil pH (1:1 soil: water paste) and electrical conductivity (EC) were measured by a handheld pH and EC meters, respectively. Nitrate-N in the lab was determined using the cadmium reduction method (Maynard and Kalra 1993). In the field, nitrate was determined using nitrate strips.
In the field, we measured soil bulk density, infiltration rate, soil structure (aggregate stability), salinity (EC), soil nitrate, soil pH, soil respiration and earth worm. Bulk density was determined from the volume of soil in three core samples, the dry weight of soil, and the water content measurements (Blake and Hartge, 1986). Soil pH and electrical conductivity (EC) were measured using 1:1 soil: water paste by a handheld pH and EC meters, respectively as shown above. All field measurements were performed using the method described by USDA-NRCS soil assessment kit (USDA-NRCS/SQI, 1999). For example, soil respiration was documented by measuring the percent %CO2 using Dräager tube CO2 gas detector (Lab Safety Supply, Inc., Janesville WI).
Soil Quality Assessment Index
A soil quality index was developed following four steps.
- Identified indicators: We identified soil quality indicators based on ease of measurement, analysis and interpretation.
- Generated reference or standard values of indicators: We gathered the best values for each soil quality indicator from different published sources.
- Developed a scoring system framework: We developed a scoring system framework using the identified indictors and reference values. Indicators were weighted according to the relative importance of a given indicator within a component (soil property groups include soil biological, physical, chemical and organic matter), and its relationship with other indicators. The weighted value for component was then assigned to three categories in reference to soil quality (best, good and poor).
- Applied the scoring system to assess soil quality level of a field: Following the development of the assessment index, the data gathered from 63 unique farms were tested for quality using the index.
Online Soil Quality Assessment Tool
The development of online soil quality assessment tool was initiated in the summer of 2011 and terminated due to the cost of algorithm development and the separation of the original PI of this project from Oklahoma State University as of August 2011. The tool would have served as a monitoring tool of soil quality for all farms regardless of size and geographical location.
Analysis and Interpretation of Results
The soil quality assessment index developed was applied to the on-farm data generated from the project. Total and component soil quality indices for the three operations were subjected to ANOVA using GLM procedures of SAS 9.3 in SAS (SAS institute, Cary, NC). Then means were compared using Fisher’s protected Least Significant Difference (LSD) test at P ≤ 0.05. We also evaluated the relationship of soil test kit based soil pH, EC and surface depth nitrate with lab analysis results using correlation procedure in SAS.
Soil Quality Index
A soil quality index was developed. We identified microbial respiration, earth worm, bulk density, water infiltration rate, aggregate stability, pH, fertility, EC, and organic matter as soil quality indicators. We generated reference or standard values for each of the identified indicator. We gathered the best values for each soil quality indicator from different published sources (values summarized in Table 1).
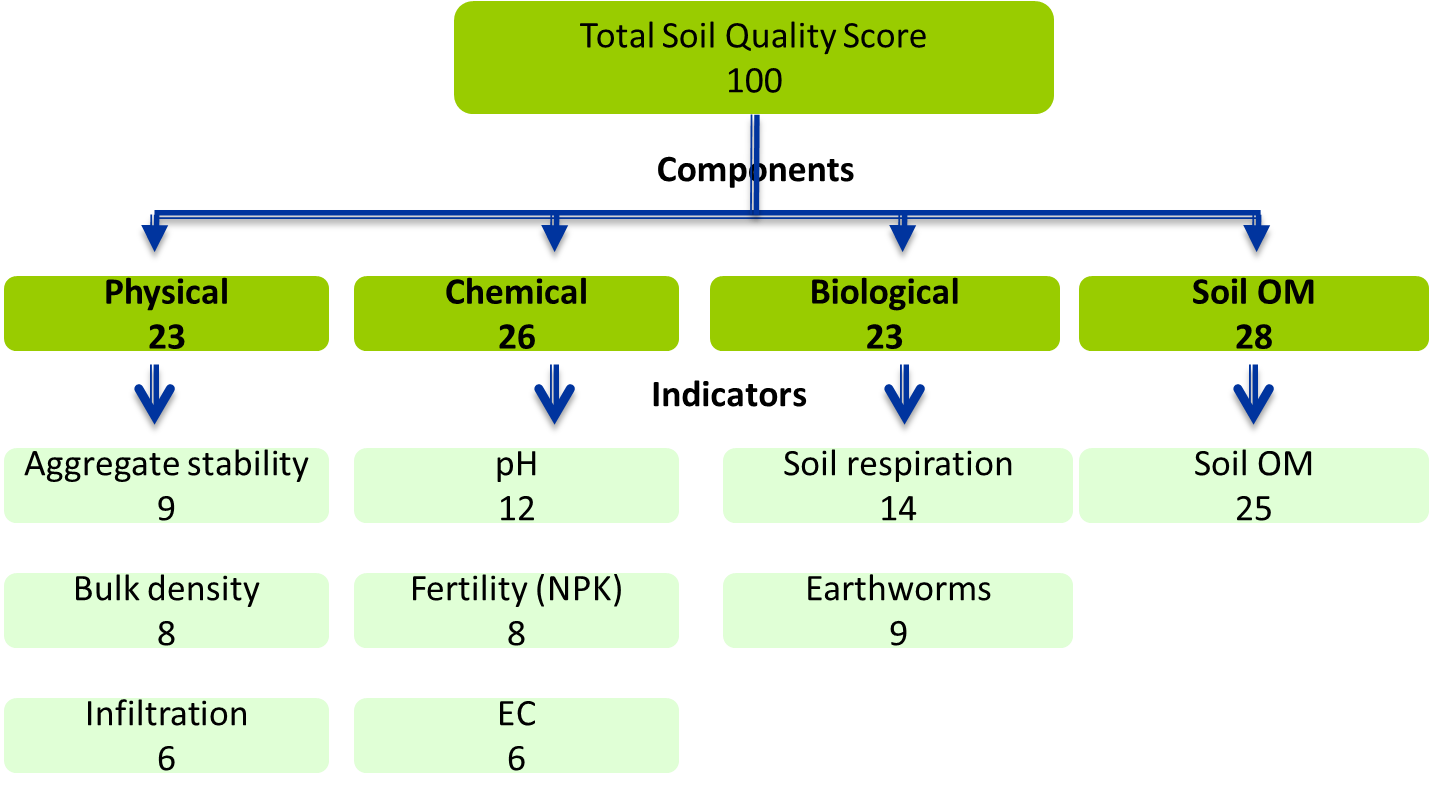
We developed a scoring system in which we assign a cumulative total score of 100 when all indicators are most suitable for plant growth and the score decreases from the total as values depart from the most suitable scenario or acceptable value (Figure 2).
Indicators were weighted according to the relative importance of a given indicator within a soil property category and its relationship with other indicators. The weighted value for component was then assigned to three categories in reference to soil quality (best, good and poor, Table 1).
Finally, a general intervention matrix was developed (Table 2) to guide a farm to improve soil quality. The matrix combines the quantitative score and corresponding intervention remarks.
Employing the Scoring System to Field Data
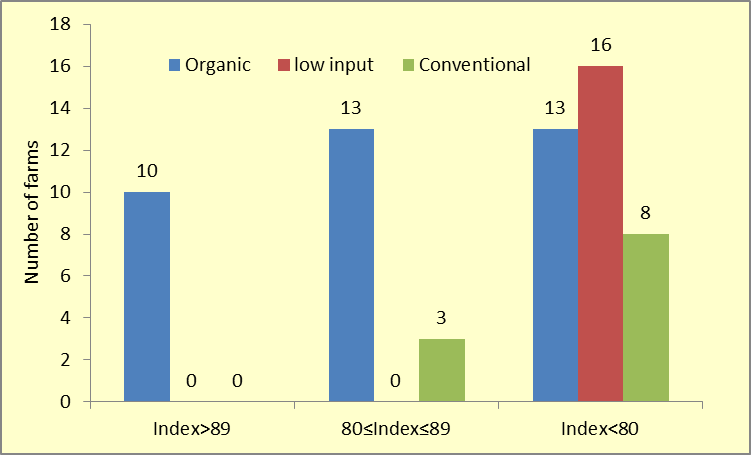
The scoring frame work was applied to 63 unique farms (Figure 3). Of these 11 were conventionally managed farms, 16 were low input farms, and the remaining 36 were largely certified organic with a few transitioning and non-organic but organically growing farms. Of the total 63 unique farms, 15.9% (10 farms) achieved a score of 90 or above. These farms require minor new interventions for the indicator with the lowest score. Another 16 (about 25.3%) achieved a moderate soil quality level (score of 80 to 90). These farms need to launch an effective soil quality improvement program for the indicators with low scores in each component and intervene with appropriate management practice. The remaining 37 farms had a soil quality score of
As expected, of the 24 conventional and low input farms, only 3 had a soil quality index that lie in the 80 to 90 soil health category. All of the 10 farms that scored in the soil quality score range of 80 to 90. Overall, 23 (36.5%) of the organic farms had soil quality index score above 80. Thirteen (20.6%) of organic farms had score between 64 and 77. Most of the organic farms sampled had a soil improvement program that includes cover crops, crop rotations and organic amendment use. In light of this, even if about thirteen farms (36.5%) had low score (<80), the situation would improve as they implement the long-term soil quality program. It is important to note that the scoring we used here is very conservative in favor of a highly sustainable system. In most of Oklahoma and most of the Southwest, it is very difficult to build organic matter due to the warm weather conditions that hastens decomposition and mineralization of organic matter. In some cases, the warm weather is confounded by lack of moisture which makes it very difficult to build soil organic matter. In this situation, it is imperative to integrate different soil improvement programs in a persistent manner. Therefore, a small change in organic matter content of soils in the region is acceptable. The lowest soil quality scores were tied to low input farms that neither practice crop rotation and apply organic amendments nor apply synthetic fertilizers. Conversation with the operators revealed that if weather conditions are ideal those farms can produce good economic yield. Furthermore, they indicted that such farms have poor resilience compared to organically or even conventionally managed farms.
Comparison of individual soil quality components with exception of the farms that had score greater than 89, revealed that both conventional and low input farms had low score for organic matter (Table 3). The soil biology component we measured using soil respiration and earth worm data did not differ among the three types of operations. Conventional and organic farms had higher physical score compared with low input farms. Overall, all farms in this category require improving physical, biological soil properties as well as raise organic matter level to get to the score of at least 90.
The correlation analysis revealed that soil test kit based pH was highly correlated with laboratory based analysis (r=0.84, p<0.001). Soil test kit and laboratory based surface depth (30 cm) soil nitrate had also positive and strong correlation (r=0.77, p<0.005). Furthermore, the electrical conductivity determined using lab and soil test kit was even more strong (r=0.93, p<0.001) than pH or nitrate. This entails that some of the on-site soil test kits would indeed produce reliable and reproducible information that can be used to make soil quality management decision without waiting for laboratory reports.
Educational & Outreach Activities
Participation summary:
- An in-service training workshop was held in two districts of Oklahoma in Spring 2011 to educate Extension Educators and other agricultural consultants and mentor producers about soil quality and soil fertility. The training was divided into presentation and hands on practice soil quality assessment. At least 36 extension educators and 12 mentor producers attended the training. Six continued education units were offered. Presentations from the workshop were posted for wider audience at OSU Sustainable agriculture website in 2011 (currently off).
- Two extension educators offered training to 28 growers (ranchers and producers) in 2012.
- An online Soil Quality Analyzer decision support development was in initiated but terminated due staff transfer and budget shortage.
- Practical soil quality assessment techniques were provided to 7 farm operators in 2011.
- Three soil quality assessment presentations and demonstrations were provided to 165 farmers and gardeners in May 2012 as part of a series of composting and rain water harvesting workshops.
Project Outcomes
About 70% of the operators or managers directly involved in the sampling and on-site testing process. They gained the skill and knowledge of assessing soil quality. At least 60% operators plan to use on-site soil quality testing as part of their routine soil management. This project also allowed farmers and extension educators to communicate about soil quality rather than soil fertility.
Farmer Adoption
The project activities and different outreach efforts increased producer and educator awareness of soil quality. Traditionally both educators and producers are interested in soil fertility and did not differentiate soil quality from fertility. At the beginning of the project, 65% of the operations did not know the difference of soil health and fertility. Following the on-farm sampling and trainings, 80% of organic growers are communicating with educators to seek help in soil health analysis.
Areas needing additional study
The third objective of the project was not completed due to the cost of algorithm development that required significant additional budget. It is imperative to develop the online decision support tool as soil health is becoming a topic of discussion in many commodity and soil management meetings and on-farm outreach activities. Thus getting a customizable online soil quality assessment decision support tool need to be completed. Additionally, reliable and simple on-site soil quality evaluation kits need to be developed.