Final report for OS20-136
Project Information
There is a need for technologies that will enhance or increase the efficacy of alternative methods to control SWD as a means to reduce or eliminate pesticide usage. We propose to employ a modified Growing Degree Day Model to counter the growing threat of SWD in the Southeast Growing degree days (GDD). Based on the amount of heat units accumulated in a specific area, this model will allow growers to predict the occurrence of the various life cycle stages of plants and animal species. Specifically, the GDD model allows growers to know when the first appearance of an insect pest is in fruit their production systems, when egg laying activities occur, the emergence of new adults, and peaks in population growth. Being able to predict when a particular life stage of an insect will occur will enable growers to apply sprays targeted for a specific life stage. Additionally, spraying with such specificity will enhance the overall efficacy of softer chemistries or other non-chemical control options such as ‘catch and kill’ or mass trapping.
Researchers in the Pacific Northwest have developed a GDD model for SWD. Validation of this GDD model must be conducted for the climate of the Southeast given the vast differences in climate between the two regions. The proposed objectives of this study are to:
1) Validate the SWD GDD model developed for the Pacific Northwest for accuracy in the southeastern climate of Alabama, and
2) Provide supporting data for larger studies that will result in more effective control of SWD using more sustainable practices such as softer chemistries or ‘catch and kill’ or mass trapping strategies.
Meeting these two objectives will assist us in applying for the SARE Research and Education funding opportunity to further our research efforts to increase sustainable practices in blueberry production.
This study will be conducted at an on-farm blueberry orchard in Chilton County in Central Alabama (32.097°N 86.683°W), which is a major fruit producing region of the state. An additional study will be conducted on a blueberry orchard (32.532° N 85.431° W) near Auburn, AL, which fully adopts organic production practices.
Trap Construction and Bait Preparation. Spotted wing drosophila traps will be constructed from red, 12 oz Solo cups. Restaurant grade plastic tops will cover the opening to prevent escape of captured fruit flies. A black strip border will be painted around the circumference of each trap 2.5 cm below the lip. Corresponding to the black border strip, 0.9 cm holes spaced 0.15 cm apart will be drilled over the entire circumference of the cup, 1 cm below the lip to allow SWD to gain entrance. To construct hanging supports, additional opposing holes will be drilled in the traps. One end of a 20-gauge copper wire or material providing a similar function will be inserted in the hole and bound to prevent slippage of the wire. The same will be done with the other end of the wire, which will enable the trap to be hung. Each trap will receive 250 ml of a prescribed bait consisting 14 g active dry yeast, 118 cm3 granulated sugar, and 1.5 L water. Yeast/sugar baits were previously found more effective in trapping SWD than leading bait and is a cheaper alternative to manufactured baits (Burrack et al., 2015). Contents will be thoroughly mixed prior to placement in the traps.
Trap Placement and Data Collection. Traps containing yeast and sugar bait will be deployed in the field on February 1, 2020. Two traps spaced 25 m apart will be placed on opposing border rows of the blueberry orchard. Additionally, three traps will be placed along the border of a wooded area located near the blueberry orchard with the anticipation that wooded areas are where overwintered SWD are first detected. In order to determine GDD for each phenology stage, both monitoring of SWD traps and calculation of GDD will occur weekly. Phenology stages will include first flight (these will be overwintered SWD), initial presence of SWD in the blueberry orchard, peak population, egg laying, presence first generation SWD. Traps set along the wooded area will likely have the initial captures though all traps will be monitored. In addition to SWD phenology, the phenology traits of blueberry such as, date of first flower, fruit set, veraison of berries and harvest periods will also be recorded.
Environmental Monitoring. Ambient temperatures will be collected hourly using WatchDog A- 125 datalogger (Spectrum Technologies, Aurora, IL). Temperature data from dataloggers will be retrieved weekly using Specware Pro 9 software (Spectrum Technologies, Aurora, IL). Two dataloggers will be placed at the borders of wooded areas surrounding the blueberry orchards at each location and within the blueberry orchard. In blueberry orchards, a datalogger will be placed in the center of two opposing border rows as well as in the center of the orchard. At all locations, dataloggers will be placed 1.5 m above the ground. Monitoring of traps will continue until the end of blueberry season in mid-July.
Calculation of GDD. Calculation of GDD will begin on February 1, 2020 according to the GDD model developed in the Pacific Northwest. Calculation of GDD will be executed using the following equation as prescribed by Felber et al., 2018:
aGDD (k) = ∑ kd=1 ∑ ∞24h=1 max (O,Th (d)-Tb)
Where k is the upper limit summation, Th is the temperature recorded at each hour of the day, which is represented by d. Tb represents the base temperature, which is 10 °C.
Cooperators
- (Educator and Researcher)
- (Educator and Researcher)
- (Educator and Researcher)
Research
This study was conducted at two on-farm locations in Alabama. The first location was an on-farm operation that produces both blueberries and caneberries in Jemison, AL (32.097°N 86.683°W), which is located in Chilton, County - a major fruit producing region of the state. An additional study was conducted on an organic blueberry farm (32.651° N 85.758° W) in Camp Hill, AL.
Trap Construction and Bait Preparation. Spotted wing drosophila traps were constructed from red, 12 oz. Solo cups. This option was selected because of the expense and lack of availability of commercially supplied traps. Restaurant grade plastic tops were purchased to cover the opening to prevent escape of capture fruit flies as well as to minimize additional water due to rainfall. The literature suggests that SWD are attractive to black and red contrast; therefore, a black strip border was be painted around the circumference of each trap 2.5 cm below the lip. Corresponding to the black border strip, 0.9 cm holes spaced 0.15 cm apart were drilled around the circumference of the cup, 1 cm below the lip to allow SWD to gain entrance. Each trap receive 250 ml of a prescribed bait consisting 14 g active dry yeast, 118 cm3 granulated sugar, and 1.5 L water. Yeast/sugar baits were previously found more effective in trapping SWD than leading bait and is a cheaper alternative to manufactured baits.
Trap Placement and Data Collection. Traps containing yeast and sugar bait were scheduled to be deployed in the field on February 1, 2020; however, due to COVID-19 regulations, traps were deployed in April. Traps were spaced at a minimum of 25 m apart. Three traps were placed along the border of a wooded area around the blueberry orchard in Camp Hill and three in Jemison. The remainder of the traps were spaced within the blueberry planting in Camp Hill and among blueberry and blackberry plantings in Jemison. Wooded areas are where overwintered SWD are first detected and usually have the most abundant trap captures. Traps were monitored weekly during the most active season of the year and bi-weekly to monthly during winter months. Corresponding GDD to first flight will be recorded. Thereafter, traps will be monitored twice weekly and number of SWD per trap and accumulated GDD recorded. Determination of GDD for other phenology events in SWD consisted of peak population, male: female ratio and egg laying. Photographs of a section of blueberries at both locations were taken such to determine veraison (when berries begin to develop characteristic color) of the berries. This was done to determine when in relation to blueberry phenology do SWD move from the wooded areas to the orchard.
Ambient temperatures were collected hourly using WatchDog A- 125 datalogger (Spectrum Technologies, Aurora, IL). Temperature data from dataloggers were retrieved weekly using Specware Pro 9 software (Spectrum Technologies, Aurora, IL). Two dataloggers were placed at the borders of wooded areas surrounding the blueberry orchards at each location and within the blueberry orchard. In blueberry orchards, a datalogger was placed in the center of two opposing border rows as well as in the center of the orchard. At all locations, dataloggers were placed 1.5 m above the ground. Monitoring of traps continued through the end of the year.
Calculation of GDD. Calculation of GDD were executed using the following equation as prescribed by Felber et al.
Previous findings from our studies found that the dominant peak SWD population occurred at 2,000 to 3,000 degree days in two locations in Alabama, which vary significantly in latitude and elevation. This corresponds to an early to mid-July range (Fig. 1 & 2). At both locations, the actual trap captures (bold line) tracked closely to the predicted trap captures (dotted line). Additionally, trap captures at 50% was approximately at 2,400 degree days at both locations, which, corresponded to mid-July (Fig. 3 & 4).
The model to determine the SWD phenology was developed in the Pacific Northwest. Since the climate of the Pacific Northwest is drastically different from the climate of the Southeast, the model must be validated to determine its effectiveness in predicting SWD phenology in the southeastern United States. To validate the model using our findings, trapping of SWD was initiated in a fig crop in Central Alabama beginning in March 2023. Our trapping showed that the first female SWD was captured on April 14 at 879.1 degree days (Fig 5 & 6). Additionally, the peak trap capture occurred on July 7 at 2,717 degree days. There was over 48% increase in population from June 30 to the peak population on July 7. This may be due to the presence of ripening fruit. Over 70% of the season population was captured after June 30. This means that the insect populations were high during the latter part of the season as more fruit continued to ripen, which supports our knowledge that SWD prefers ripened fruit and that SWD populations endure throughout the late season.
Our findings show that the growing degree day model developed in the Pacific Northwest has been validated successfully and demonstrates applicability for Central Alabama. These findings provide valuable insight for sustainably managing SWD for this region. With this information, each phenology stage of SWD can be deduced. Our finding concerning the occurrence of SWD phenology stages will provide the grower with the ability to make targeted pesticide applications reducing inputs and production costs while effectively controlling SWD and protecting beneficial insects and the environment.
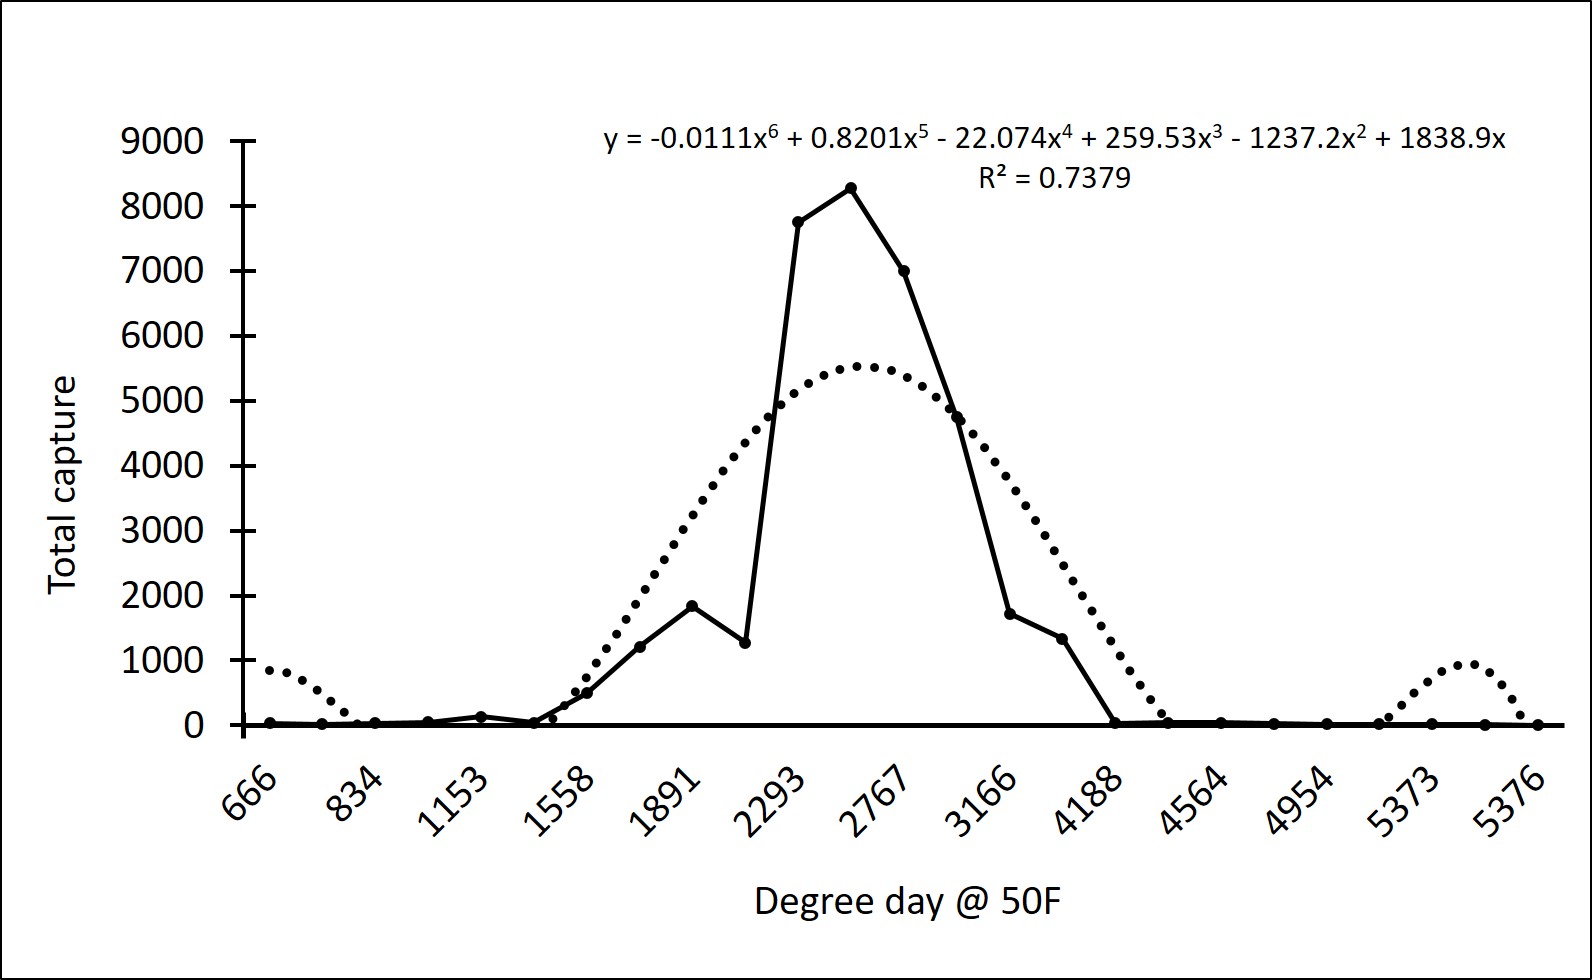
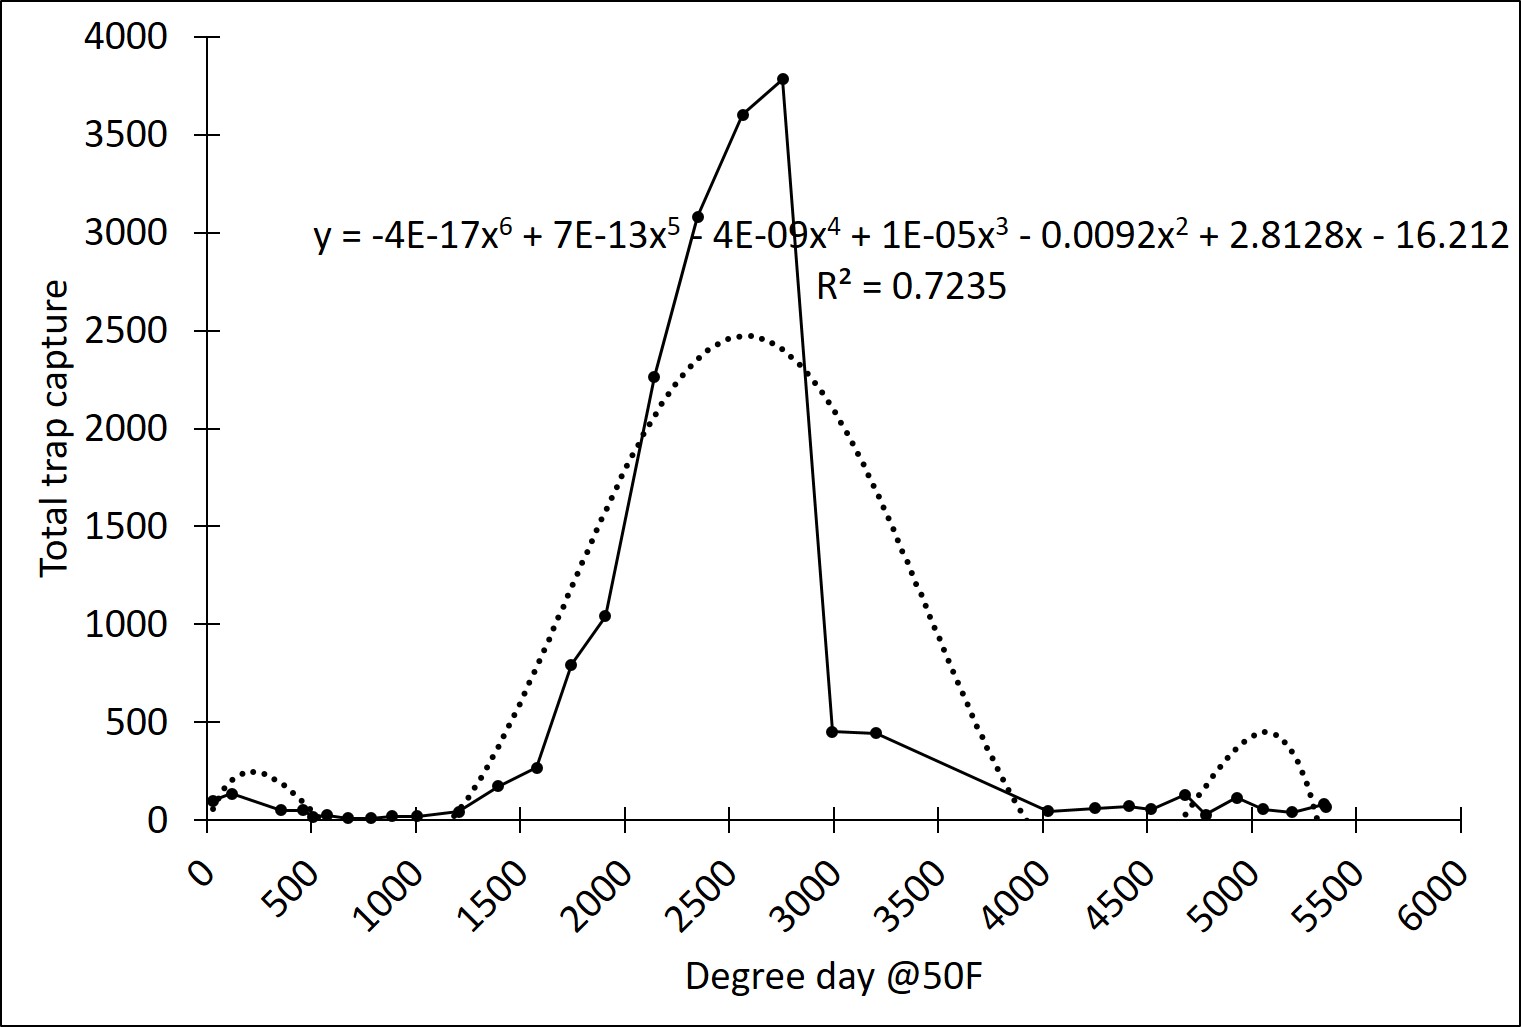


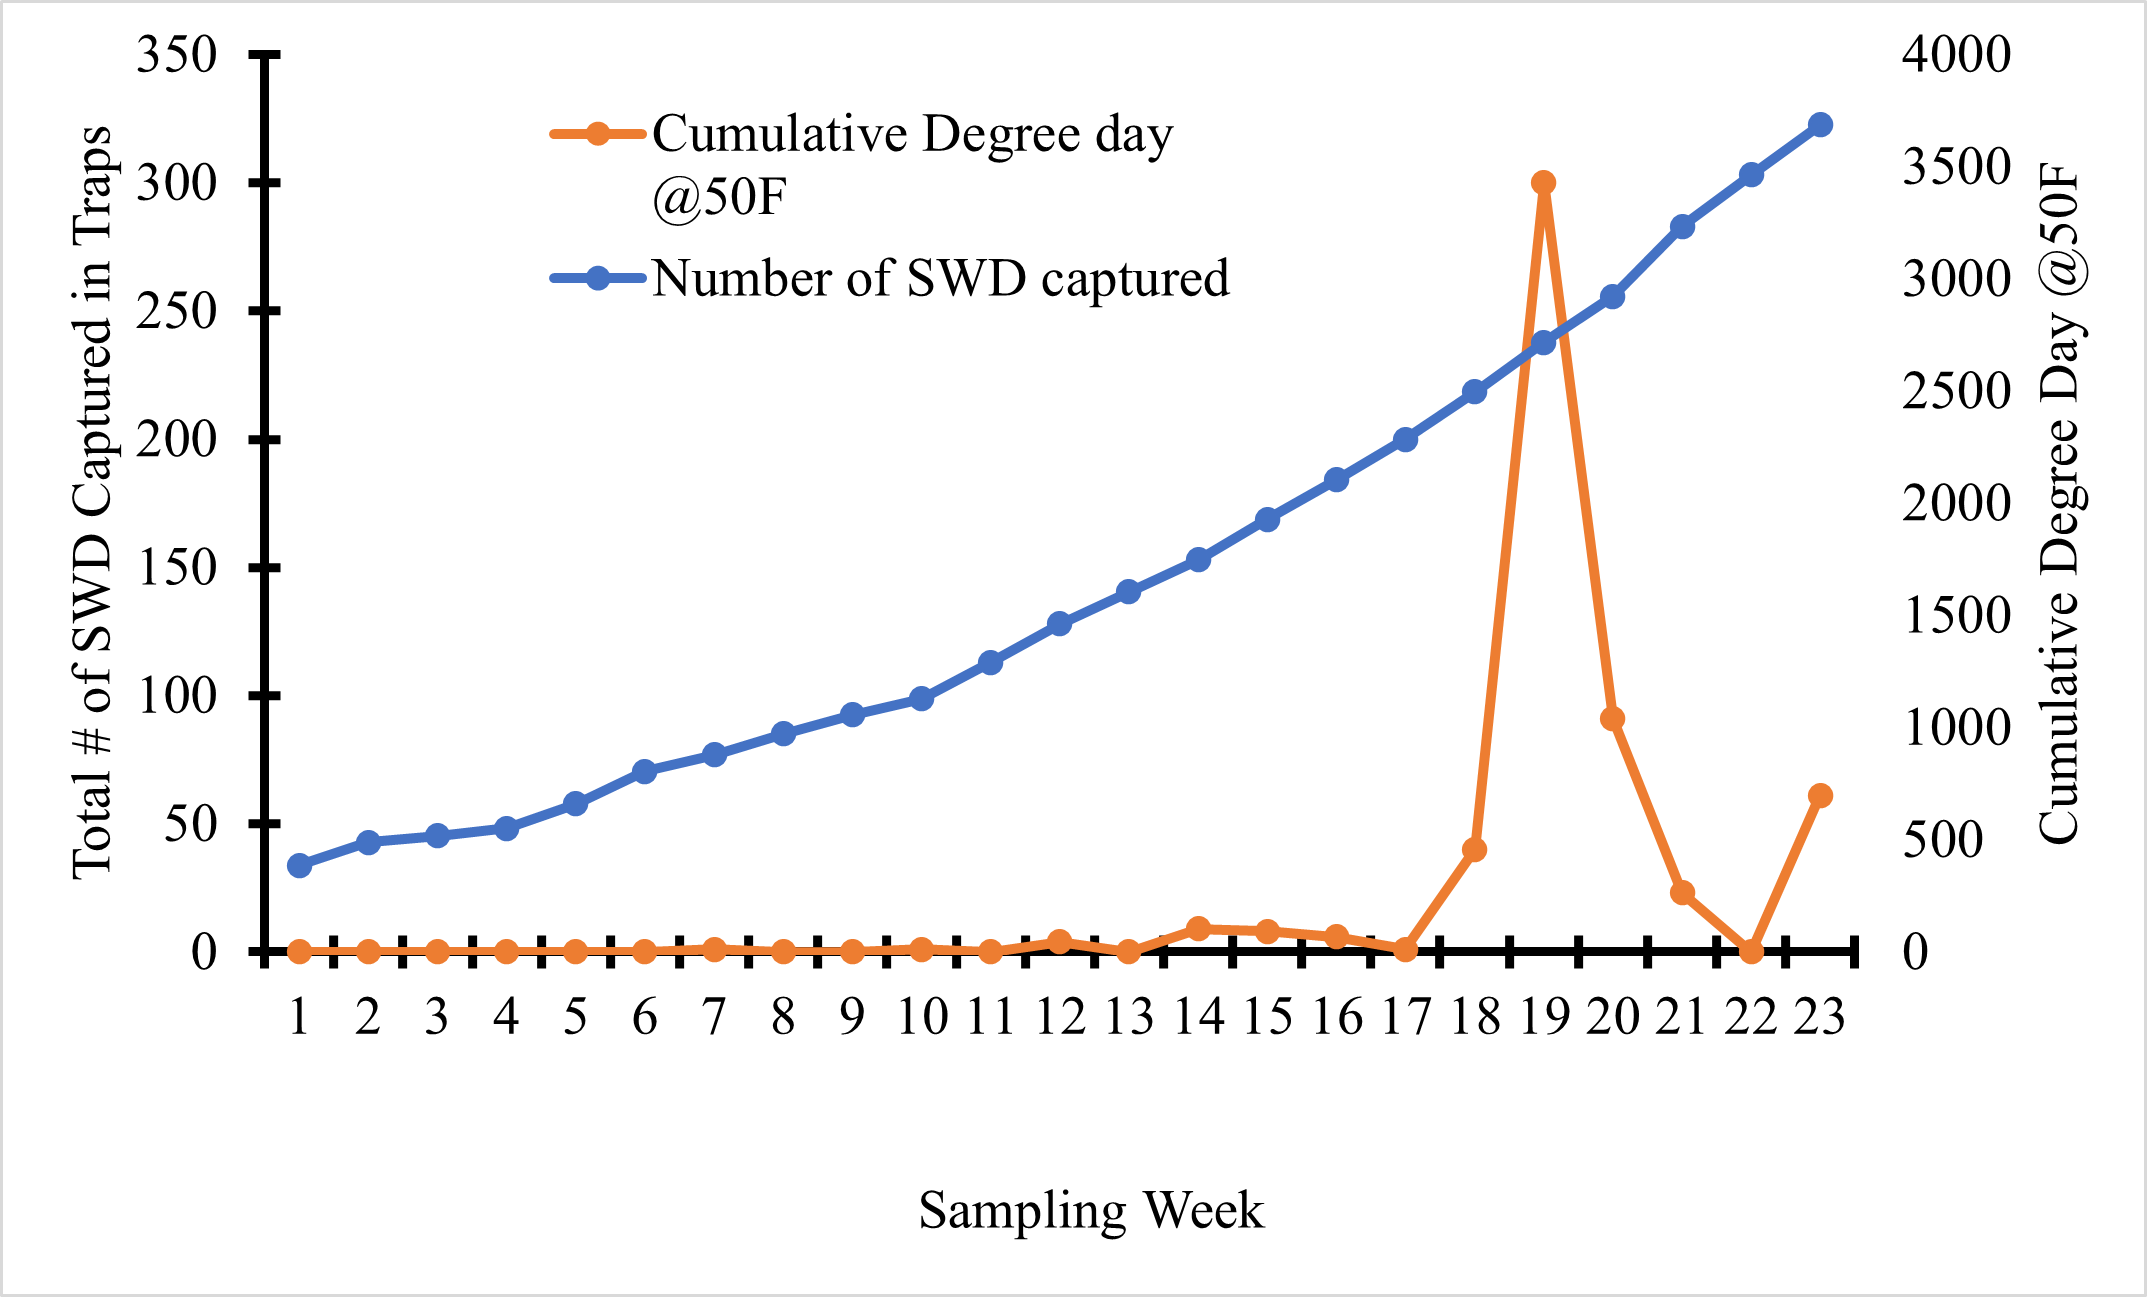
Figure 5. Total number of SWD captures peaks in early July in 2023.
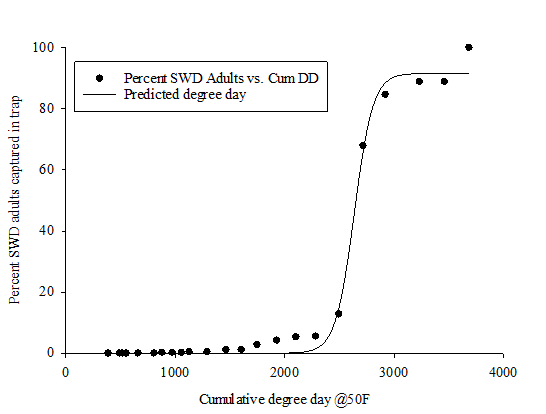
Figure 6. Three parameter Sigmoidal curve predicts populations of SWD in Central Alabama based on degree days.
Educational & Outreach Activities
Participation summary:
Consultations- Two farmer ranchers, who are participating in the project were provided periodic updates to the number of spotted wing drosophila (SWD) trap captures. This information was key to determining the effectiveness of their current method of SWD control.
Webinars - Q&A Fridays. This virtual venue was developed in response to COVID regulations. Attendees were informed about the basic phenology of the SWD, host plants, and current research developed to mitigate damage caused by SWD. Approximately, 16 agricultural professionals and two farmer ranchers were provided instruction.
Master Gardener Updates. As part of their curriculum, Master Gardeners will be taught about the life cycle of the SWD, vulnerable crops, and current research dedicated to SWD. This training will take place on July 26, 2021.
Learning Outcomes
Project Outcomes
Spotted wing drosophila remains a significant threat to the small fruit industries such as the caneberry and blueberry industries. Means to control this invasive pest must be balanced with regard to natural insect predators. Moreover, minimizing or eliminating insecticide sprays will improve both environmental and economic sustainability of a farming operation. This project will provide the farmer with information concerning the occurrence of peak population of SWD so that targeted applications can be applied during key phenological stages of the insect. With growing social media and increasing consumer interest in how and where food is grown, growers will be able to provide their clientele produce, which received little pesticide sprays creating perception of consumer safety.