Final report for OS21-149
Project Information
Current N fertilizer recommendation for corn in TN does not account for potentially mineralizable N; hence, there is a possibility for either over or under application of N fertilizer. A two-year field trial was conducted to assess the adequacy of alkaline mineralizable-N (AH-N), Haney's Soil Health Tool's plant available N, and Haney Soil Health Tool's estimated biological N (EB-N) to predict corn N needs. Two small plot on-farm trials were conducted at two locations in west TN in 2021-2023. Plots were four rows wide x 30 feet long and each treatment combinations were replicated four times in a randomized complete block design. The nitrogen fertilizer treatments included: 0, 60, 120, 180, 210, and 240 lb N ac-1. Before N fertilizer application, soil samples were collected from the 0 lb N ac-1 plots at different depths for soil health parameters using the Haney Soil Health Tool. In addition, soils were analyzed for alkaline mineralizable N. The specific objectives of the on-farm trials are to: (i) investigate the relationship between HSHT’s H3A-4 to Mehlich 3 extractable nutrient elements and (ii) evaluate the relationships of alkaline mineralizable N, HSHT plant available N, (iii) estimate the N rate required to attain the relative maximum grain yield at each location using the quadratic-plateau regression, (iv) evaluate the relationship between HSHT’s estimated biological N, HSHT’s Plant available N, and alkaline-hydrolyzable N to check plot grain yield, (v) develop N fertilizer rate calibration using alkaline-hydrolyzable N, and (vi) compare nitrogen fertilizer recommendations for optimum N rate to achieve 100% RGY, current University of Tennessee, Haney Soil Health Test, and alkaline-hydrolyzable mineralizable N. In 2021, a significant linear regression model was observed between the yield of check plots and AH-N at all depth, with the best predictive relationship at the 6-12-inch depth (R2 = 0.57). With the exception of the 0-6 and 0-24-inch depths, a strong relationship was observed between the yield of check plots and AH-N for the other depths in 2023. In contrast, a strong relationship was not observed between grain yield from the check plots and HSHT’s Plant available N or HSHT’s estimated biological N regardless of year. A calibration of AH-N for the 0-6, 6-12, 12-18-inch depth to predict the N rate required to achieve 100% relative grain yield was generated. The recommended N rate from AHN was similar to the optimum N rate, which were both lower than current recommendations from HSHT and the current recommendations by University of Tennessee. However, caution must be exercised considering the limited number of data points used to generate this model. Continuing research on a correlation and calibration curve to generate additional data points are required to make this model robust.
A replicated small plot on-farm trial will be conducted at two locations in west TN to address the adequacy of alkaline mineralizable-N and HSHT -N to predict corn N needs”. The specific objectives of the on-farm trials are to: (i) investigate the relationship between HSHT’s H3A-4 to Mehlich 3 extractable nutrient elements and (ii) evaluate the relationships of alkaline mineralizable N, HSHT plant available N, (iii) estimate the N rate required to attain the relative maximum grain yield at each location using the quadratic-plateau regression, (iv) evaluate the relationship between HSHT’s estimated biological N, HSHT’s Plant available N, and alkaline-hydrolyzable N to check plot grain yield, (v) develop N fertilizer rate calibration using alkaline-hydrolyzable N, and (vi) compare nitrogen fertilizer recommendations for optimum N rate to achieve 100% RGY, current University of Tennessee, Haney Soil Health Test, and alkaline-hydrolyzable mineralizable N
Cooperators
- - Producer
Research
2021
Two replicated on-farm trials were conducted at Jackson, TN and Milan, TN on a Calloway Silt Loam (35.733665, -88.856636) and a Lexington Silt Loam (35.799411, -88.762815), respectively to address the adequacy of alkaline mineralizable-N and HSHT-N to predict corn N needs. The Jackson location was managed in a no-till corn-soybean rotation system and was planted to soybeans the previous year. On the other hand, the Milan location was managed in a no-till continuous cotton system. Prior to fertilizer application, six core samples were collected from each plot at 0-6 and 6-12-inch depths on 04/2/2021 and 04/06/2021 at the Jackson and Milan location, respectively (Table 1). After the soil sample was air dried, ground to pass through a 2-mm sieve, and thoroughly mixed, it was analyzed for routine chemical properties and soil ammonium and nitrate by the Brookside Laboratories Inc. Prior to planting, the Jackson location received P and K, which was applied with a commercial spreader truck while P and K fertilizer were hand applied at the Milan location during planting. Before N fertilizer application, six core samples were collected from the 0 lb N ac-1 plots at four depths 0-6, 6-12, 12-18, 0-18, and 0-24 inches on 04/2/2021 and 04/06/2021 at the Jackson and Milan location, respectively. However, sidedress N samples were not collected at the Milan location due weather conditions. The soil health was characterized using the Haney Soil Health Tool at three depths: 0-6, 6-12, and 12-18 inches. Soil health parameters measured include soil pH (1:1), buffer pH, soluble salts (1:1); organic matter (LOI); H3A-4 extractable Ca, Mg, K, Na, S, P, Mn, Zn, B, Fe, and Al; H3A-4 extractable phosphate; H3A-4 extractable available nitrogen (NH4+-N and NO3--N); water extractable organic carbon, water extractable total nitrogen; soil respiration (IR Gas Analyzer), and overall soil health score. All samples were analyzed by Brookside Laboratories Inc. The alkaline-hydrolyzable N was evaluated at 5 soil depths 0-6, 6-12, 12-18, 0-18, and 0-24 inches using the method by Roberts et al., (2011). All samples were analyzed by the N-Star Soil Testing Laboratory. Data was used to (i) investigate the relationship between HSHT’s H3A-4 to Mehlich 3 extractable nutrient elements and (ii) evaluate the relationships of alkaline mineralizable N, HSHT's estimated biological N, and HSHT plant available N.
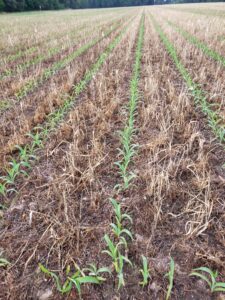
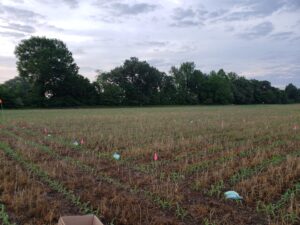
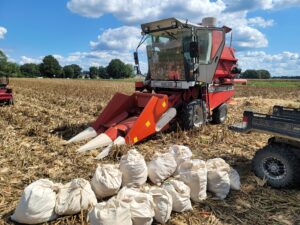
Corn was planted on 04/19/2021 and 04/28/2021 at the Jackson and Milan location, respectively, to achieve a final stand of approximately 32,000 - 33,000 plants per acre. Field was then partitioned into plots with 10-ft alleyways. Plots were four rows wide x 30 feet long and each treatment combinations were replicated four times in a randomized complete block design. The nitrogen fertilizer treatments included: 0, 60, 120, 180, 210, and 240 lb N ac-1. Nitrogen was applied as a two-way split (at planting + sidedress). At planting, 60 lb N/acre was hand applied as ANVOL®-treated urea. Side-dress N was hand broadcast at the V6 stage corn at respective application rates. At tassel, a composite leaf sample consisting of 15 youngest fully matured leaves were collected for tissue N. At maturity, the two center rows of corn in each plot were harvested by hand and then threshed using a small plot combine harvester with an automatic weighing scale and a moisture meter. Yield and soil data was used to (iii) estimate the N rate required to attain the relative maximum grain yield at each location using the quadratic-plateau regression, (iv) evaluate the relationship between HSHT’s estimated biological N, HSHT’s Plant available N, and alkaline-hydrolyzable N to check plot grain yield.
Table 1. Mean preplant chemical properties of soil at 0-6 and 6-12-inch depths collected from the Jackson and Milan locations. Nutrient concentrations are based on Mehlich III extraction (n =24) in 2021.
| Location | Depth | TEC | pH | OM | ENR | P | K | Ca | Mg | S | Na | B | Fe | Mn | Cu | Zn |
| inches | meq/100 g | % | N/A | ------------------------------------------------ppm----------------------------------------------- | ||||||||||||
| Jackson | 0-6 | 8.5 | 6.1 | 2 | 61 | 24 | 108 | 1148 | 98 | 10 | 10 | 0.4 | 206 | 320 | 1.7 | 2.7 |
| 6-12 | 12.2 | 6 | 1.4 | 49 | 12 | 94 | 1588 | 132 | 21 | 15 | 0.3 | 151 | 141 | 1.3 | 0.8 | |
| Milan | 0-6 | 11.7 | 6.1 | 2.4 | 69 | 16 | 99 | 1573 | 118 | 10 | 11 | 0.7 | 157 | 166 | 1.2 | 1.4 |
| 6-12 | 12.5 | 6.2 | 1.8 | 55 | 5 | 88 | 1710 | 179 | 15 | 16 | 0.6 | 129 | 125 | 1.1 | 0.6 | |
TEC, Total Exchangeable Cation; OM, Organic Matter; ENR, Estimated Nitrogen Release
2022
Two replicated on-farm trials were conducted at Jackson, TN and Milan, TN on a Calloway Silt Loam (35.735001, -88.869202) and a Lexington Silt Loam (35.799500, -88.762833), respectively to address the adequacy of alkaline mineralizable-N and HSHT-N to predict corn N needs. The Jackson location was managed in a no-till corn-soybean rotation system and was planted to soybeans the previous year. On the other hand, the Milan location was managed in a no-till continuous cotton system until 2021. Prior to fertilizer application, six core samples were collected from each plot at 0-6 and 6-12-inch depths on 05/9/2022 and 04/06/2022 at the Jackson and Milan location, respectively (Table 2). After the soil sample was air dried, ground to pass through a 2-mm sieve, and thoroughly mixed. Prior to planting, the Jackson location received P and K, which was applied with a commercial spreader truck while P and K fertilizer were hand applied at the Milan location during planting. Before N fertilizer application, six core samples were collected from the 0 lb N ac-1 plots at four depths 0-6, 6-12, 12-18, 0-18, and 0-24 inches on 05/09/2022 and 04/06/2022 at the Jackson and Milan location, respectively. However, sidedress N samples were not collected at the Milan location due weather conditions.
The goal was to characterize soil health of soils using the Haney Soil Health Tool at three depths: 0-6, 6-12, and 12-18 inches. Soil health parameters measured include soil pH (1:1), buffer pH, soluble salts (1:1); organic matter (LOI); H3A-4 extractable Ca, Mg, K, Na, S, P, Mn, Zn, B, Fe, and Al; H3A-4 extractable phosphate; H3A-4 extractable available nitrogen (NH4+-N and NO3--N); water extractable organic carbon, water extractable total nitrogen; soil respiration (IR Gas Analyzer), and overall soil health score. The alkaline-hydrolyzable N was to be evaluated at 5 soil depths 0-6, 6-12, 12-18, 0-18, and 0-24 inches using the method by Roberts et al., (2011).
Corn was planted on 04/19/2022 and 04/28/2022 at the Jackson and Milan location, respectively, to achieve a final stand of approximately 32,000 - 33,000 plants per acre. Field was then partitioned into plots with 10-ft alleyways. Plots were four rows wide x 30 feet long and each treatment combinations were replicated four times in a randomized complete block design. The nitrogen fertilizer treatments included: 0, 60, 120, 180, 210, and 240 lb N ac-1. Nitrogen was applied as a two-way split (at planting + sidedress). At planting, 60 lb N/acre was hand applied as ANVOL®-treated urea. Side-dress N was hand broadcast at the V6 stage corn at respective application rates. At tassel, a composite leaf sample consisting of 15 youngest fully matured leaves were collected for tissue N. At maturity, the two center rows of corn in each plot were harvested by hand and then threshed using a small plot combine harvester with an automatic weighing scale and a moisture meter. Standard agronomic and pest management practices were based on University of Tennessee recommendations.
Table 2. Mean preplant chemical properties of soil at 0-6 and 6-12-inch depths collected from the Jackson and Milan locations. Nutrient concentrations are based on Mehlich III extraction (n =24) in 2022.
| Location | Depth | TEC | pH | OM | ENR | P | K | Ca | Mg | S | Na | B | Fe | Mn | Cu | Zn |
| inches | meq/100 g | % | N/A | --------------------------------------------------ppm----------------------------------------------- | ||||||||||||
| Jackson | 0-6 | 10.6 | 6.4 | 2.4 | 69 | 25 | 116 | 1558 | 116 | 7.3 | 16 | 0.6 | 109 | 91 | 0.9 | 2.8 |
| 12-Jun | 11.2 | 6.5 | 1.9 | 59 | 12 | 159 | 1634 | 159 | 10.3 | 17 | 0.5 | 98 | 70 | 0.7 | 0.9 | |
| Milan | 0-6 | 10 | 5 | 2.1 | 63 | 46 | 150 | 831 | 42 | 10 | 11 | 0.2 | 150 | 173 | 1.1 | 2.2 |
| 12-Jun | 9 | 5.5 | 1.6 | 52.5 | 22 | 96 | 977 | 49 | 8.9 | 15 | 0.5 | 117 | 116 | 0.9 | 1.1 | |
TEC, Total Exchangeable Cation; OM, Organic Matter; ENR, Estimated Nitrogen Release
2023
Two replicated small plot trials were conducted at Jackson, TN and Milan, TN on a Collins Silt Loam (35.623808, -88.842144) and a Routon Silt Loam (35.931082, -88.713269), respectively to address the adequacy of alkaline mineralizable-N and HSHT-N to predict corn N needs. Both locations were managed in a no-till corn-soybean rotation system. Prior to fertilizer application, six core samples were collected from each plot at 0-6, 6-12, 12-18, 18-24, 0-18, and 0-24-inch depths at trial locations, respectively (Table 3). After the soil sample was air dried, ground to pass through a 2-mm sieve, and analyzed for soil pH, total exchangeable cations, soil organic matter, Mehlich 3 extractable nutrients. Prior to planting, the Jackson location received P and K, which was applied with a commercial spreader truck. Before sidedress N fertilizer application, six core samples were collected from the 0 lb N ac-1 plots at four depths 0-6, 6-12, 12-18, 0-18, and 0-24 inches at the Jackson and Milan location, respectively. Soils samples were analyzed for soil pH (1:1), buffer pH, soluble salts (1:1); organic matter (LOI); H3A-4 extractable Ca, Mg, K, Na, S, P, Mn, Zn, B, Fe, and Al; H3A-4 extractable phosphate; H3A-4 extractable available nitrogen (NH4+-N and NO3--N); water extractable organic carbon, water extractable total nitrogen; soil respiration (IR Gas Analyzer), overall soil health score and alkaline-hydrolyzable. Data was used to (i) investigate the relationship between HSHT’s H3A-4 to Mehlich 3 extractable nutrient elements and (ii) evaluate the relationships of alkaline mineralizable N, HSHT's estimated biological N, and HSHT plant available N.
Corn was planted at the Jackson and Milan location, respectively, to achieve a final stand of approximately 32,000 - 33,000 plants per acre. Plots were four rows wide x 30 feet long with four replications in a randomized complete block design. The nitrogen fertilizer treatments included: 0, 60, 120, 180, 210, and 240 lb N ac-1. At the Jackson location, the 210 rate was not evaluated in the trial due to smaller land space. Nitrogen was applied as a two-way split (at planting + sidedress). At planting, 60 lb N/acre was hand applied as ANVOL®-treated urea. Side-dress N was hand broadcast at the V6 stage corn at respective application rates. At tassel, a composite leaf sample consisting of 15 youngest fully matured leaves were collected for tissue N. At maturity, the two center rows of corn in each plot were harvested by hand and then threshed using a small plot combine harvester with an automatic weighing scale and a moisture meter. Standard agronomic and pest management practices were based on University of Tennessee recommendations. Yield and soil data was used to (iii) estimate the N rate required to attain the relative maximum grain yield at each location using the quadratic-plateau regression, (iv) evaluate the relationship between HSHT’s estimated biological N, HSHT’s Plant available N, and alkaline-hydrolyzable N to check plot grain yield, (v) develop N fertilizer rate calibration using alkaline-hydrolyzable N, and (vi) compare nitrogen fertilizer recommendations for optimum N rate, current University of Tennessee, Haney Soil Health Test, and alkaline-hydrolyzable mineralizable N.
Table 3. Mean preplant chemical properties of soil at 0-6, 6-12, 12-18, 18-24, 0-18, and 0-24-inch depths collected from the Jackson and Milan locations. Nutrient concentrations are based on Mehlich III extraction (n =24) in 2023.
| Location | Depth | TEC | pH | OM | ENR | P | K | Ca | Mg | S | Na | B | Fe | Mn | Cu | Zn |
| inches | meq/100 g | % | lb/a | ---------------------------------------------ppm-------------------------------------------- | ||||||||||||
| Jackson | 0-6 | 12.9 | 5.9 | 2.3 | 66 | 25 | 131 | 1604 | 170 | 17 | 20 | 0.4 | 142 | 190 | 1.1 | 1.5 |
| 12-Jun | 13.9 | 6.7 | 1.8 | 55 | 9 | 112 | 2121 | 197 | 5 | 23 | 0.4 | 110 | 114 | 0.9 | 0.5 | |
| 18-Dec | 15.9 | 6.6 | 1.7 | 54 | 6 | 131 | 2343 | 247 | 6 | 26 | 0.4 | 109 | 30 | 0.6 | <0.4 | |
| 18-24 | 17.2 | 5.6 | 1.6 | 53 | 9 | 119 | 1607 | 294 | 43 | 25 | 0.4 | 110 | 24 | 0.6 | <0.4 | |
| 0-18 | 14.1 | 6.3 | 1.9 | 58 | 12 | 118 | 1942 | 205 | 11 | 23 | 0.7 | 127 | 95 | 0.8 | 0.7 | |
| 0-24 | 15.6 | 6.1 | 1.9 | 57 | 11 | 118 | 2011 | 225 | 20 | 23 | 0.4 | 116 | 77 | 0.7 | 0.6 | |
| Milan | 0-6 | 10.5 | 6.5 | 2.4 | 69 | 49 | 124 | 1671 | 51 | 11 | 11 | 0.3 | 128 | 192 | 1.1 | 0.8 |
| 12-Jun | 8.7 | 6.1 | 1.7 | 54 | 16 | 76 | 1278 | 48 | 8 | 13 | 0.2 | 120 | 213 | 1.2 | 0.7 | |
| 18-Dec | 8.6 | 6 | 1.6 | 52 | 17 | 64 | 1187 | 54 | 9 | 13 | <0.2 | 119 | 142 | 1 | 0.4 | |
| 18-24 | 8.7 | 5.8 | 1.5 | 50 | 23 | 71 | 1109 | 62 | 13 | 14 | <0.2 | 114 | 71 | 0.7 | 0.5 | |
| 0-18 | 9.2 | 6.2 | 1.9 | 58 | 28 | 85 | 1354 | 51 | 10 | 12 | 0.2 | 122 | 174 | 1.1 | 0.6 | |
| 0-24 | 8.9 | 6.1 | 1.7 | 54 | 26 | 79 | 1247 | 52 | 11 | 12 | 0.2 | 123 | 146 | 1 | 0.6 | |
TEC, Total Exchangeable Cation; OM, Organic Matter; ENR, Estimated Nitrogen Release
2021
(i) Relationship between HSHT’s H3A-4 to Mehlich 3 extractable nutrient elements
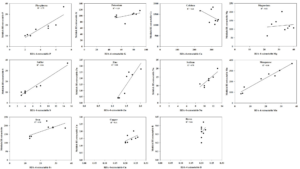
The relationship between Mehlich-III and H3A-4 extractable nutrients at depths (0-6 and 6-12-inch) locations (Jackson and Milan) in 2021 is presented in Figure 1. Mehlich III and H3A-4 extractable nutrients were significantly correlated and showed a positive linear relationship with the combined data across soil depths and locations except Ca. On average, Mehlich-III extracted approximately 75% more P, 36% more K, 78% more Ca, 73% more Mg, 61% more S, 17% more Na, 43% more B, 86% more Fe, 44% more Zn, 93% more Mn, and 83% more Cu than H3A-4 extractable nutrients. The H3A-4 extracting solution consists of a dilute mixture of four weak acids with a weakly buffered pH of approximately 3.75, that may account for the lower concentration of H3A-4 extractable nutrients. Phosphorus, sulfur, boron, and manganese correlated well (R2 = 0.75 - 0.95) while potassium, zinc, copper, iron, and sodium correlated moderately (R2 = 0.39 – 0.61). Although the relationships between some nutrients appear highly correlated, existing calibration and correlation data relating conventional soil test to relative yield may not be appropriate for current mineral fertilizer recommendations.
Figure 1. Relationship between Mehlich III extractable and H3A-4 extractable nutrients (ppm) at 0-6 and 6-12-inch depths from the Jackson and Milan locations
(ii) Relationships between HSHT’s Estimated biological N, alkaline mineralizable N, and HSHT’s plant available N
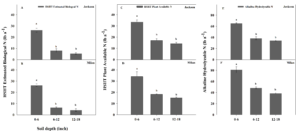
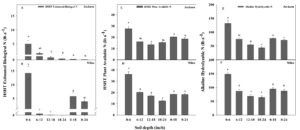
Data on the parameters used to compute HSHT’s EB-N and HSHT’s PA-N are presented in Tables S1, S2, & S3. HSHT’s EB-N and HSHT’s PA-N was assessed at preplant for both locations; however, at sidedress (V6 growth stage), HSHT’s EB-N and HSHT’s PA-N was evaluated at only the Jackson location. In this study, the preplant HSHT’s estimated biological N, HSHT’s plant available N, alkaline mineralizable N, in 2023 at both locations ranged from 4.2-26.2, 9.2-34.0, and 33-81, lb N a-1, respectively (Figure 2a-f; Figure 3). Among these three N parameters evaluated in this study, the N content in the AH-N was higher followed by HSHT’s PA-N and then HSHT’s EB-N. At both locations, AH-N, HSHT’s EB-N, and HSHT’s PA-N decreased significantly with depth, where the N content at the 0-6-inch depth was significantly higher than the other depths, but there was no significant difference beyond the 0-6-inch depth (Figure 2a-f). Estimated N contents for AH-N, HSHT’s EB-N, and HSHT’s PA-N at sidedress was lower when compared to the N contents at preplant (Figure 2 and 3). Similar to preplant, the AH-N and HSHT’s PA-N were greatest at the o-6-inch depth. However, there was no significant difference beyond this depth regardless of location (Figure 3).
Supplementary Table S1. Preplant Haney soil health test and alkaline-hydrolyzable nitrogen at 0-6, 6-12, 12-18, 0-18, 0-24-inch depths collected from the Jackson location.
| Soil Depth | Location | IR Gas Analyzer | *WEOC | *WEON | Soil health Score | Nitrate-N | Ammonium-N | Estimated Biological N | Plant available N | Alkaline hydrolyzable N |
| in | ppm | ppm | ppm | ppm | lb/a | lb/a | lb/a | |||
| 0-6 | Jackson | 92 | 148 | 15 | 14 | 3 | 4.1 | 29 | 44 | 72 |
| Jackson | 94 | 121 | 12 | 13 | 1.9 | 2 | 25 | 33 | 71 | |
| Jackson | - | - | - | - | 1.5 | 4.4 | 11 | 23 | 92 | |
| Jackson | 91 | 169 | 13 | 14 | 1.9 | 3.2 | 25 | 36 | 89 | |
| 6-12 | Jackson | 30 | 85 | 3.6 | 5.1 | 0.5 | 5.3 | 7.2 | 19 | 46 |
| Jackson | 35 | 87 | 2.6 | 5.5 | 0.7 | 5.8 | 5.2 | 18 | 49 | |
| Jackson | 26 | 83 | 3.5 | 4.6 | 0.7 | 5 | 7 | 18 | 53 | |
| Jackson | 18 | 124 | 0.2 | - | - | - | 0.2 | 18 | 46 | |
| 12-18 | Jackson | 18 | 81 | 4.5 | 3.8 | < 0.5 | 3.8 | 7.8 | 16 | 39 |
| Jackson | 11 | 70 | 2.1 | 2.7 | 0.6 | 5.5 | 2.6 | 15 | 41 | |
| Jackson | 11 | 93 | 2.9 | 3.3 | 0.6 | 5.9 | 2.8 | 16 | 36 | |
| Jackson | 10 | 94 | 4.4 | 3.3 | 0.7 | 3.9 | 3.7 | 13 | - | |
| 12-18 | Jackson | - | - | - | - | - | - | - | - | - |
| Jackson | - | - | - | - | - | - | - | - | 56 | |
| Jackson | - | - | - | - | - | - | - | - | 50 | |
| Jackson | - | - | - | - | - | - | - | - | 57 | |
| 0-24 | Jackson | - | - | - | - | - | - | - | - | 49 |
| Jackson | - | - | - | - | - | - | - | - | 58 | |
| Jackson | - | - | - | - | - | - | - | - | 51 | |
| Jackson | - | - | - | - | - | - | - | - | - |
Supplementary Table S2. Preplant Haney soil health test and alkaline-hydrolyzable nitrogen at 0-6, 6-12, 12-18, 0-18, 0-24-inch depths collected from the Milan location.
| Soil Depth | Location | IR Gas Analyzer | *WEOC | *WEON | Soil health Score | Nitrate-N | Ammonium-N | Estimated Biological N | Plant available N | Alkaline hydrolyzable N |
| in | ppm | ppm | ppm | ppm | lb/a | lb/a | lb/a | |||
| 0-6 | Milan | 92 | 148 | 15 | 14 | 3 | 4.1 | 29 | 44 | 72 |
| Milan | 94 | 121 | 12 | 13 | 1.9 | 2 | 25 | 33 | 71 | |
| Milan | - | - | - | - | 1.5 | 4.4 | 11 | 23 | 92 | |
| Milan | 91 | 169 | 13 | 14 | 1.9 | 3.2 | 25 | 36 | 89 | |
| 6-12 | Milan | 30 | 85 | 3.6 | 5.1 | 0.5 | 5.3 | 7.2 | 19 | 46 |
| Milan | 35 | 87 | 2.6 | 5.5 | 0.7 | 5.8 | 5.2 | 18 | 49 | |
| Milan | 26 | 83 | 3.5 | 4.6 | 0.7 | 5 | 7 | 18 | 53 | |
| Milan | 18 | 124 | 0.2 | - | - | - | 0.2 | 18 | 46 | |
| 12-18 | Milan | 18 | 81 | 4.5 | 3.8 | < 0.5 | 3.8 | 7.8 | 16 | 39 |
| Milan | 11 | 70 | 2.1 | 2.7 | 0.6 | 5.5 | 2.6 | 15 | 41 | |
| Milan | 11 | 93 | 2.9 | 3.3 | 0.6 | 5.9 | 2.8 | 16 | 36 | |
| Milan | 10 | 94 | 4.4 | 3.3 | 0.7 | 3.9 | 3.7 | 13 | - | |
| 12-18 | Milan | - | - | - | - | - | - | - | - | - |
| Milan | - | - | - | - | - | - | - | - | 56 | |
| Milan | - | - | - | - | - | - | - | - | 50 | |
| Milan | - | - | - | - | - | - | - | - | 57 | |
| 0-24 | Milan | - | - | - | - | - | - | - | - | 49 |
| Milan | - | - | - | - | - | - | - | - | 58 | |
| Milan | - | - | - | - | - | - | - | - | 51 | |
| Milan | - | - | - | - | - | - | - | - | - |
Supplementary Table S3. Sidedress Haney soil health test and alkaline-hydrolyzable nitrogen at 0-6, 6-12, 12-18, 0-18, 0-24-inch depths collected from the Jackson location.
| Soil Depth | Location | IR Gas Analyzer | *WEOC | *WEON | Soil health Score | Nitrate-N | Ammonium-N | Estimated Biological N | Plant available N | Alkaline hydrolyzable N |
| in | ppm | ppm | ppm | ppm | lb/a | lb/a | lb/a | |||
| 0-6 | Jackson | - | - | - | - | - | - | - | - | - |
| Jackson | 34 | 214 | 7 | 8.4 | < 0.5 | 1.3 | 3.6 | 13 | 66 | |
| Jackson | 43 | 213 | 4 | 8.9 | 1.9 | 3.5 | 10.8 | 16 | 68 | |
| Jackson | 19 | 234 | 7 | 7.2 | 1.7 | 2.9 | 9.2 | 13 | 72 | |
| 6-12 | Jackson | 9 | 170 | 5 | 4.9 | < 0.5 | 4.3 | 9.6 | 12 | 35 |
| Jackson | 10 | 157 | 3 | 4.4 | 0.7 | 2.3 | 6 | 7 | 43 | |
| Jackson | 7 | 169 | 4 | 4.4 | < 0.5 | 2.3 | 5.6 | 7 | 38 | |
| Jackson | 12 | 187 | 3 | 5.2 | < 0.5 | 2.8 | 6.6 | 8 | 46 | |
| 12-18 | Jackson | 8 | 165 | 3 | 4.5 | < 0.5 | 4.1 | 9.2 | 11 | 30 |
| Jackson | 7 | 147 | 2 | 3.8 | 0.6 | 3.4 | 8 | 9 | 32 | |
| Jackson | 9 | 145 | 3 | 4.1 | < 0.5 | 2.9 | 6.8 | 8 | 36 | |
| Jackson | 9 | 172 | 2 | 4.6 | 0.7 | 4.1 | 9.6 | 10 | 34 | |
| 12-18 | Jackson | 17 | 166 | 4 | 5.4 | 0.7 | 3.8 | 9 | 12 | 34 |
| Jackson | 13 | 162 | 2 | 4.7 | 0.7 | 2.6 | 6.6 | 8 | 44 | |
| Jackson | 10 | 251 | 6 | 6.6 | < 0.5 | 2.4 | 5.8 | 8 | 46 | |
| Jackson | 13 | 186 | 7 | 5.7 | 0.6 | 2 | 5.2 | 9 | 44 | |
| 0-24 | Jackson | 18 | 171 | 2 | 5.4 | 0.7 | 3 | 7.4 | 9 | 36 |
| Jackson | 23 | 166 | 3 | 5.9 | < 0.5 | 2.6 | 6.2 | 9 | 44 | |
| Jackson | 14 | 201 | 5 | 5.9 | < 0.5 | 1.6 | 4.2 | 7 | 40 | |
| Jackson | 12 | 194 | 8 | 5.9 | 0.7 | 3.5 | 8.4 | 12 | 43 |
Figure 2. Mean Preplant HSHT’s estimated biological N at (A) Jackson and (B) Milan, HSHT plant available N at the (C) Jackson and (D) Milan locations, and alkaline hydrolyzable N at (E) Jackson and (F) Milan location at different sampling depths in 2021. Bar graph with same letters within each graph are not significantly different.
Figure 3. Mean Sidedress (A) HSHT’s estimated biological N, (B) HSHT plant available N and (C) alkaline hydrolyzable N at Jackson location at different sampling depths in 2021. Bar graph with same letters within each graph are not significantly different.
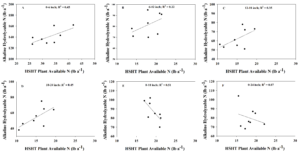
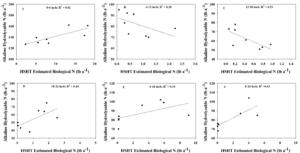
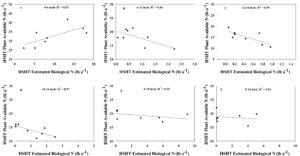
A significant negative relationship (R2 = 0.20) was observed between AH-N and HSHT’s PA-N at only the 6-12 depth (Figure 4). There was no significant relationship between AH-N and HSHT’s EB-N at all depth (Figure 5). A significant positive relationship was observed between HSHT’s PA-N and HSHT’s EB-N at 0-6 and 6-12 (Figure 6).
Figure 4. Relationship between AH-N and HSHT’s PA-N at (A) 0-6, (B) 6-12, (C) 12-18-inch depth
Figure 5. Relationship between AH-N and HSHT’s EB-N at (A) 0-6, (B) 6-12, (C) 12-18-inch depth
Figure 6. Relationship between HSHT’s EB-N and HSHT’s PA-N at (A) 0-6, (B) 6-12, (C) 12-18-inch depth
(iii) Estimate the N rate required to attain the relative maximum grain yield at each location using the quadratic-plateau regression
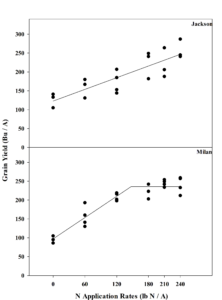
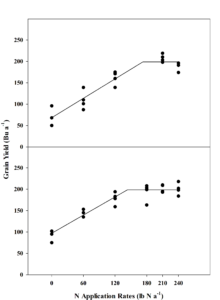
Application of N significantly increased corn yields at both locations (Figure 7). The Jackson and Milan locations exhibited a significant and a positive response to fertilizer N. Corn response to N at the Jackson location did not plateau. In contrast, grain yield increased with N rate until a plateau was reached where yield stabilized at the Milan location. The predicted fertilizer N rate required to maximize yield at the Milan location was 162 lb N a-1.
Figure 7. Corn response to N fertilizer application at the Jackson and Milan locations
(iv) Relationship between HSHT’s Plant available N, HSHT’s estimated biological N, and alkaline-hydrolyzable N to check plot grain yield
Correlation of check plots with AH-N resulted in a significant linear regression model for 0-6-, 6-12- and 12-18-inch depths at preplant (Figure 8). At preplant, the best predictive relationship between the check plots and AH-N was found at the 6-12-inch depth (R2 = 0.57). In contrast, the correlation between the check plots and EB-N was not significant at all depths (Figure 8).
Figure 8. Relationship between grain yield and (A) alkaline-Hydrolyzable N, (B) HSHT plant available N (C) HSHT estimated biological N at preplant from the both locations at 0-6, 6-12, and 12-18-inch depths
2022
The soil samples collected for the alkaline mineralizable-N and Haney Soil Health Test were not analyzed because of in-season drought. The concern was the possibility of crop failure, which would render any soil information less useful. The drought severely affected corn yields in most counties in West TN. The fields that we set up our experiments were no exception. We were unable to harvest one location and for the harvested field, yields were very poor. As a result, we requested for a no-cost extension to repeat the trial for another year.
2023
(i) Relationship between HSHT’s H3A-4 to Mehlich 3 extractable nutrient elements
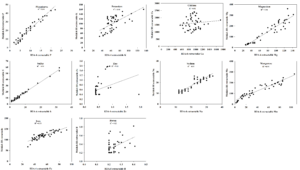
The relationship between Mehlich-III and H3A-4 extractable nutrients at six depths (0-6, 6-12, 12-18, 18-24, 0-18, 0-24-inch) for all the trial locations is shown in Figure 9. Mehlich III and H3A-4 extractable nutrients were significantly correlated (R2 = 0.22 - 0.99) and showed a positive linear relationship with the combined data across soil depths and locations except Ca (R2 = <0.01). Phosphorus, magnesium, sulfur, sodium, iron, and manganese correlated well (R2 = 0.75 - 0.99) while potassium correlated moderately (R2 = 0.44). Although the relationships between some nutrients appear highly correlated, existing calibration and correlation data relating conventional soil tests to relative yield may not be appropriate for current mineral fertilizer recommendations.
On average, Mehlich-III extracted approximately 49% more P, 66% more K, 61% more Ca, 71% more Mg, 44% more S, 100% more Na, 46% more Fe, 28% more Mn, and 79% more Cu than H3A-4 extractable nutrients. The H3A-4 extracting solution consists of a dilute mixture of four weak acids with a weakly buffered pH of approximately 3.75, which may account for the lower concentration of H3A-4 extractable nutrients. In contrast, Mehlich 3 extraction has a lower pH of 2.5.
Figure 9. Relationship between Mehlich III extractable and H3A-4 extractable nutrients (ppm) at 0-6, 6-12, 12-18, 18-24, 0-18, and 0-24-inch depths from both locations in 2023.
(ii) Relationships between HSHT’s Estimated biological N, alkaline mineralizable N, and HSHT’s plant available N
Data on the parameters used to compute HSHT’s EB-N and HSHT’s PA-N are presented in Tables S4, & S5. In this study, the HSHT’s Estimated biological N, HSHT’s plant available N, alkaline mineralizable N, in 2023 at both locations ranged from 0.1-14.3, 13.0-36.2, and 55-148, lb N a-1, respectively (Figure 10a-f). Among these three N parameters evaluated in this study, the N content in the AH-N was higher followed by HSHT’s PA-N and then HSHT’s EB-N. At both locations, HSHT’s EB-N and HSHT’s PA-N decreased significantly with depth, where the N content at the 0-6-inch depth was significantly higher than the other depths, but there was no significant difference beyond the 0-6-inch depth (Figure 10a-d). Similarly, the highest N content for AH-N at both locations was observed at the 0–6-inch depth. In contrast to HSHT EB-N and HSHT PA-N, significant differences in N contents were observed among depths beyond the 0–6-inch depth (Figure 10e and f). There was no significant difference in N content for all the parameters between 0-18- and 0-24-inch depths, except for the AH-N at the Jackson location.
Supplementary Table S4. Haney soil health test and alkaline-hydrolyzable nitrogen at different depths from the Jackson location
| Soil Depth | Location | IR Gas Analyzer | *WEOC | *WEON | Soil health Score | Nitrate-N | Ammonium-N | Estimated Biological N | Plant available N | Alkaline hydrolyzable N |
| in | ppm | ppm | ppm | ppm | lb/a | lb/a | lb/a | |||
| 0-6 | Jackson | 48 | 304 | 11 | 12 | 2.8 | 3.5 | 14 | 26 | 139 |
| Jackson | 23 | 284 | 12 | 9 | < 0.5 | 3.3 | 8 | 15 | 136 | |
| Jackson | 35 | 278 | 2 | 9 | 1.4 | 10.5 | 2 | 26 | 127 | |
| Jackson | 28 | 364 | 9 | 11 | 4.1 | 10.4 | 5 | 34 | 130 | |
| 6-12 | Jackson | 8 | 191 | 7 | 5 | 0.8 | 5 | 2 | 14 | 78 |
| Jackson | 5 | 155 | 0 | 4 | 2.4 | 6.6 | 0 | 18 | 70 | |
| Jackson | 7 | 237 | 1 | 6 | < 0.5 | 8.3 | 0 | 18 | 83 | |
| Jackson | 7 | 175 | 3 | 5 | 0.6 | 5.9 | 1 | 14 | 71 | |
| 12-18 | Jackson | 5 | 160 | 2 | 4 | 0.5 | 6.5 | 0 | 14 | 61 |
| Jackson | 5 | 159 | 3 | 4 | < 0.5 | 4.9 | 1 | 12 | 53 | |
| Jackson | 5 | 171 | 4 | 4 | 2.2 | 2.6 | 1 | 11 | 56 | |
| Jackson | 5 | 184 | 1 | 4 | < 0.5 | 7.9 | 0 | 17 | 51 | |
| 18-24 | Jackson | 5 | 125 | 0 | 3 | 2.3 | 5.7 | 0 | 16 | 50 |
| Jackson | 5 | 136 | 0 | 3 | 4.4 | 6.3 | 0 | 21 | 46 | |
| Jackson | 5 | 112 | 2 | 3 | 3.5 | 3 | 1 | 14 | 38 | |
| Jackson | 5 | 101 | 1 | 3 | < 0.5 | 7.4 | 0 | 16 | 43 | |
| 0-18 | Jackson | 15 | 206 | 0 | 6 | 1.8 | 8.6 | 0 | 21 | 84 |
| Jackson | 16 | 157 | 0 | 5 | 1.4 | 9.1 | 0 | 21 | 80 | |
| Jackson | 16 | 194 | 0 | 5 | < 0.5 | 8.5 | 0 | 18 | 81 | |
| Jackson | 11 | 197 | 0 | 5 | 0.8 | 9.6 | 0 | 21 | 70 | |
| 0-24 | Jackson | 18 | 166 | 7 | 6 | 1.9 | 1.3 | 6 | 13 | 75 |
| Jackson | 14 | 152 | 0 | 4 | 1.4 | 9.6 | 0 | 22 | 73 | |
| Jackson | 9 | 134 | 0 | 4 | < 0.5 | 8.1 | 0 | 17 | 68 | |
| Jackson | 13 | 143 | 0 | 4 | < 0.5 | 7.5 | 0 | 16 | 71 |
Supplementary Table S5. Haney soil health test and alkaline-hydrolyzable nitrogen at different depths from the Milan location
| Soil Depth | Location | IR Gas Analyzer | *WEOC | *WEON | Soil health Score | Nitrate-N | Ammonium-N | Estimated Biological N | Plant available N | Alkaline hydrolyzable N |
| in | ppm | ppm | ppm | ppm | lb/a | lb/a | lb/a | |||
| 0-6 | Milan | 80 | 271 | 9 | 14 | 4.7 | 3.4 | 18 | 34 | 161 |
| Milan | 75 | 296 | 7 | 14 | 5.6 | 8.6 | 13 | 42 | 162 | |
| Milan | 48 | 224 | 5 | 10 | 4.3 | 7.4 | 8 | 32 | 129 | |
| Milan | 68 | 235 | 9 | 12 | 4 | 5.7 | 17 | 37 | 143 | |
| 6-12 | Milan | 14 | 165 | 0 | 5 | < 0.5 | 8.4 | 0 | 18 | 95 |
| Milan | 12 | 180 | 1 | 5 | 1.8 | 8.6 | 1 | 21 | 91 | |
| Milan | 27 | 177 | 5 | 7 | 0.9 | 6.3 | 7 | 21 | 92 | |
| Milan | 11 | 183 | 1 | 5 | < 0.5 | 9.5 | 0 | 20 | 73 | |
| 12-18 | Milan | 5 | 102 | 1 | 3 | < 0.5 | 7.6 | 0 | 16 | 78 |
| Milan | 5 | 145 | 1 | 8 | < 0.5 | 7.9 | 0 | 17 | 72 | |
| Milan | 8 | 374 | 0 | 4 | 1.3 | 8.4 | 0 | 19 | 73 | |
| Milan | 7 | 161 | 0 | 4 | < 0.5 | 7 | 0 | 15 | 55 | |
| 18-24 | Milan | 9 | 157 | 0 | 4 | 0.7 | 6.6 | 0 | 15 | 75 |
| Milan | 9 | 150 | 3 | 4 | < 0.5 | 4.3 | 1 | 11 | 65 | |
| Milan | 14 | 159 | 3 | 5 | < 0.5 | 5 | 2 | 13 | 64 | |
| Milan | 16 | 152 | 3 | 5 | < 0.5 | 4 | 3 | 12 | 56 | |
| 0-18 | Milan | 18 | 181 | 1 | 6 | 1 | 7.3 | 0 | 17 | 99 |
| Milan | 25 | 193 | 5 | 7 | 1.3 | 5.2 | 6 | 19 | 102 | |
| Milan | 38 | 242 | 3 | 9 | 3.1 | 9.6 | 3 | 29 | 96 | |
| Milan | 31 | 182 | 7 | 7 | 2.5 | 2.8 | 9 | 20 | 85 | |
| 0-24 | Milan | 16 | 162 | 0 | 5 | 2.3 | 7.2 | 0 | 19 | 87 |
| Milan | 20 | 189 | 4 | 6 | 0.6 | 5.7 | 3 | 16 | 104 | |
| Milan | 21 | 154 | 0 | 5 | 1.2 | 8.5 | 0 | 20 | 85 | |
| Milan | 22 | 178 | 5 | 6 | 1.6 | 4.9 | 5 | 18 | 76 |
Figure 10. Mean HSHT’s estimated biological N at (A) Jackson and (B) Milan, HSHT plant available N at the (C) Jackson and (D) Milan locations, and alkaline hydrolyzable N at (E) Jackson and (F) Milan location at 6 different sampling depths. Bar graph with same letters within each graph are not significantly different.
A significant positive relationship was observed between AH-N and HSHT’s PA-N at all depth (R2 = 0.22 - 0.45), with the exception of 0-18- and 0-24-inch depth, which showed a significant negative relationship (R2 = 0.07 – 0.51) (Figure 11). A significant positive relationship was observed between AH-N and HSHT’s EB-N at all depth, with the exception of 6-12- and 12-18-inch depth, which showed a significant negative relationship (Figure 12). A significant relationship was observed between HSHT’s PA-N and HSHT’s EB-N at 0-6, 6-12, 12-18, and 18-24. A positive relationship was observed only at the 0-6 while a negative relationship was observed at the other three depths (Figure 13).
Figure 11. Relationship between AH-N and HSHT’s PA-N at (A) 0-6, (B) 6-12, (C) 12-18, (D) 18-24, (E) 0-18, (F) 0-24-inch depth.
Figure 12. Relationship between AH-N and HSHT’s EB-N at (A) 0-6, (B) 6-12, (C) 12-18, (D) 18-24, (E) 0-18, (F) 0-24-inch depth
Figure 13. Relationship between HSHT’s PA-N and HSHT’s EB-N at (A) 0-6, (B) 6-12, (C) 12-18, (D) 18-24, (E) 0-18, (F) 0-24-inch depth
(iii) Estimate the N rate required to attain the relative maximum grain yield at each location using the quadratic-plateau regression
The linear-plateau regression model indicated a significant and a positive response to fertilizer N and then leveled off at both locations (Figure 14a & b). The predicted optimum N fertilizer rate required to maximize yield at the Jackson location (173 lb N a-1) was higher than the Milan location 146 lb N a-1. The mineralizable soil N based on HSHT’s EB-N, HSHT’s PA-N, and AH-N was higher in the soils collected from Milan compared to Jackson (Figure 10) and may partly explain the lower N recommendations at the Milan location.
Figure 14. Corn response to N fertilizer application at the Jackson and Milan locations.
(iv) Relationship between HSHT’s Plant available N, HSHT’s estimated biological N, and alkaline-hydrolyzable N to check plot grain yield
Correlation of grain yield of the check plots with AH-N resulted in a significant and positive linear regression model (R2 = 0.38 - 0.83) for all depths (Figure 15a), with the best predictive relationship at the 0-18-inch depth (R2 = 0.83). With the exception of the 0-6 and 0-24-inch depths, a strong correlation was observed for the other depth. In contrast, a strong relationship was not observed between grain yield from the check plots and HSHT’s Plant available N or HSHT’s estimated biological N (Figure 15a & b).
Figure 15. Relationship between grain yield and (A) alkaline-Hydrolyzable N, (B) HSHT plant available N (C) HSHT estimated biological N at preplant from the both locations at 0-6, 6-12, 12-18, 18-24, 0-18, and 0-24-inch depths
(v) Nitrogen fertilizer rate calibration using alkaline-hydrolyzable N
The calibration of AH-N for the 0-6, 6-12, 12-18-inch depth which predicts the N rate required to achieve 100% relative grain yield for corn is shown in Figure 16. Based on a linear regression model, the recommended N rate at 0-6, 6-12, 12-18-inch depth were y = 175.36 - 0.1243x, y = 175.36 - 0.1243x, and y = 175.36 - 0.1243x, respectively, where y is the recommended N rate and x is the AH-N at the respective depth.
Figure 16. Calibration of AH-N for the 0-6, 6-12, 12-18 in. depth which predicts the N rate required to achieve 100% relative grain yield for corn on silt loam soils
(vi) Comparison between, optimum N rate, current UT fertilizer recommendation (UTR), HSHT N fertilizer recommendation (HSHT), and alkaline-hydrolyzable fertilizer (AH-N) recommendation.
The optimum N rate, current UT fertilizer recommendation, HSHT N fertilizer recommendation, and alkaline-hydrolyzable fertilizer recommendation is shown in Table 2. Among the recommendation method evaluated, the highest N recommendation was from UTR (210 lb N a-1), followed by HSHT (200 lb N a-1), AHN (153 - 169 lb N a-1), and OR (146 - 173 lb N a-1) regardless of trial location and year. The recommended N rate from AHN was similar to the optimum N rate, however caution must be exercised considering the limited number of data points used to generate this model. Continuing research on a correlation and calibration curve to generate additional data points are required to make this model robust.
Table 4. Nitrogen fertilizer recommendations for optimum N rate to achieve 100% RGY (OR), current University of Tennessee (UTR), Haney Soil Health Test (HSHT), and alkaline-hydrolyzable mineralizable N (AHN)
| Location | 2021 | 2023 | ||||||
| OR | AHN | UTR | HSHT | OR | AHN | UTR | HSHT | |
| lb N a-1 | ||||||||
| Jackson | - | 169 | 210 | 200 | 173 | 160 | 210 | 200 |
| Milan | 162 | 168 | 210 | 200 | 146 | 153 | 210 | 200 |
OR, optimum N rate; UT, current University of Tennessee; HSHT, Haney Soil Health Test; and AHN, alkaline-hydrolyzable mineralizable N
Educational & Outreach Activities
Participation Summary:
Results gathered from trials were communicated through traditional and new avenues, including in-service training, grain conferences, county row crop producer meetings, UT’s Soil and Nutrient Management website https://utcrops.com/soil/.
- Results from trials were communicated to UT/TSU agents at the Row Crop In-service Trainings on 12/15/2021 and 12/16/2021.
- Findings were shared at the 2022 East/Middle Tennessee Grain Conference, Tullahoma, TN on 2/1/2022 and 2022 West Tennessee Grain Conferences and Soybean Producers Conference, Dyersburg, TN on 2/3/2022.
- In addition, information on this project was also presented at 12 county row crop production meetings from 2022 -2023.
- Some of the findings was presented at the Milan No-Till field day on 7/28/2022, Tobacco, Beef and more Field Day on 6/25/24 and the also at the upcoming Milan No-Till field day on 7/25/24, 2024.
- Two factsheets have been generated and are under review for publication as UT Extension publications.
Learning Outcomes
Optimizing nitrogen use efficiency by using the appropriate N rate
Project Outcomes
The intent of this project is to influence and promote the three pillars of sustainability: (i) profitability over the long term, (ii) stewardship of our nation’s land, air & water, and (ii) quality of life for farmers, ranchers, and their communities.
Profitability over the long term
The research and extension components of this project activity will bring in-depth information on N fertilizer recommendations to the front door of the agricultural stakeholders to increase the success of farmers, ranchers and small/rural businesses. There is a possibility for over or under application of N fertilizer based on the current N management recommendations. However, a reliable crop response based on mineralizable N may eliminate such concerns by recommending the appropriate amount of N. Appropriate amounts may save significant amounts of fertilizer use, which reduce production cost and increase profitability. In addition, right amount of N fertilizer may eliminate under application, ensuring enough N for optimum plant growth, development, and yield. Increased crop yield can contribute to improve profitability.
Stewardship of our nation’s land, air & water
Nitrogen, unlike most nutrients, is unstable and hence susceptible to several loss pathways including ammonia volatilization, denitrification, run offs, and leaching. Thus, a major challenge is to minimize N loss and maintain optimum productivity with minimal adverse impact on the environment and other ecosystem services. Based on 4Rs nutrient stewardship program, applying the right amount of fertilizer is one of the strategies to optimize efficiency of N fertilizer use and minimize nitrous oxide emissions, ammonia volatilization, and contamination of surface and ground water by nitrate. At the core of this proposal is to determine if mineralizable N component of the soil can predict crop response. Identifying the above relationship will assist to generate site-specific N fertilizer recommendations or recommend the right amount of N fertilizer. More importantly, this project offers an important opportunity for specialist and scientist on the project to interact with producers on relevant topics that protect natural resources including 4Rs nutrient stewardship, nutrient management, N loss, etc.
Quality of life for farmers, ranchers, and their communities
The primary rural occupation in the US is agriculture and its incumbent to adopt management practices preserves the natural resources to meet the increasing demand for food production. This project seeks to improve crop productivity, increase income, and maintain/increase the success of farmers, ranchers, and small/rural businesses.
