Final report for OS22-156
Project Information
Scientific irrigation scheduling (SIS) can increase water use efficiency and support on-farm water conservation efforts to achieve sustainability in irrigated agriculture. A recent study in the Rio Grande Basin (Berthold et al., 2021) revealed that one of the adoption barriers to SIS was the lack of availability of irrigation scheduling tools. We propose the use of freely available and low-cost sensing technologies for optimizing the use of irrigation water for vegetable farming. This approach includes remote sensing-based vegetation indices (VIs) and soil moisture sensors. VIs can help growers detect the water stress in their cropped area under multiple pixels, and by employing soil moisture sensors, farmers can have access to data showing the water availability in the root zone. The combination of VIs and soil moisture sensors would provide growers confidence regarding their irrigation scheduling decisions. Using two different techniques to decide about irrigation would also help overcome any potential uncertainties and limitations associated with the data and estimates. Such practices would develop growers’ capacity to follow a data-driven approach for effectively managing the irrigation water that can support and strengthen sustainable farming in the region. The proposed solution has been discussed with numerous vegetable farmers (including farmer cooperator) in the Lower Rio Grande region during extension meetings and field visits in the past. Along with the shift from field crops to vegetables, the vegetable farming community in the region is adopting drip irrigation and realizing the need for SIS for improving on-farm water management. The proposed solution would also establish the grounds for the adoption of SIS under increasing pressure on agricultural water supplies due to competition with the municipal sector. The soil moisture sensor proposed under this study is CropX that is a cloud-based sensor and does not require any manual data retrieval. CropX sensors are being used globally and have reasonable accuracy under various soil types. CropX’s web-based user dashboard (graphic user interface) and mobile app are user-friendly. Also, CropX has active partnerships with organizations such as NASA Harvest, PEPSICO, and Reinke Irrigation to promote soil moisture analytics in precision farming.
Performance indicators
Performance indicators for the proposed research will be irrigation water applied, yield, and water use efficiency (WUE). The yield data will be collected at the end of each growing season and county extension office staff will collect the data both from experimental and control plots. Data of irrigation water applied will be collected from the irrigation logbook maintained by the farmer (irrigation time for each drip-irrigated zone and flow meter readings are recorded) and it will also be tallied with the change in soil moisture level via the in-situ sensor data. WUE will be estimated following equation 1 as suggested by Howell (2001).
WUE = Yield / (Pe + I + SW) (1)
Where Pe is effective rainfall, I is irrigation applied and SW is soil water depletion from the root zone during the growing season. SW can be calculated using the soil moisture data.
Data security/data privacy
Soil moisture data is only available to the person with an access code provided by the sensor manufacturer. The access code will be shared with the farmer. Soil moisture data from the experimental farm will be included in the factsheet and will be added to the presentations during webinars. The data will be stored for the long-term in Texas A&M AgriLife cloud storage under the agency’s data storage policies and will be accessible to the public at request.
Approach:
The study will be conducted for vegetables (e.g., broccoli, cabbage, beetroot, etc.) at Tenaza farms in the Lower Rio Grande Valley, Texas. Two drip-irrigated adjacent plots of 25 acres will be selected: one for the field trial and one will be the control plot. Same planting date, crop variety, seeding rate, and row spacing will be selected for both plots. A two-step approach will be followed to develop growers’ capacity for using a combination of two sensing technologies in irrigation-related decisions: data from in-situ soil moisture sensors and VIs. In the first growing season, two auto-calibration and cloud-powered soil moisture sensors will be installed in two locations representative of major soil types in the experimental plot. The grower will have access to an online dashboard of the sensors that show in-situ soil moisture along with precipitation and potential evapotranspiration (ETo) data from the nearest weather station (Figure 1). Grower will be walked through the dashboard and will be sent detailed advisories regarding irrigation on a weekly/bi-weekly basis based on soil moisture data. Furthermore, the grower will be introduced to VIs in the first growing season and will be provided with VI imagery of the farm once a month. Grower feedback will also be requested regarding the level of agreement with the recommendations related to irrigation timing.
After the end of the first growing season, a comparison of the VIs and soil moisture timelines will be shared with the grower. Also, grower will receive a report on crop water use efficiency for both experimental and control plots to understand the water saving potential and yield improvement potential of SIS. Possibilities of further improving the irrigation scheduling will be discussed based on the data from first year, and the grower’s experience with the soil moisture sensors will be inquired. From the beginning of the second year, the grower will start receiving weekly/bi-weekly recommendations for scheduling irrigation based on both soil moisture and VIs. Also, the grower will be taught about ways to analyze the two data sources and make decisions. Grower will also be asked for feedback on his experience and any possible issues related to the provided recommendations. This will allow the grower to combine the benefits of these two technologies to elevate ag water stewardship on the farm. Eventually, at the end of the cropping season, the grower will be updated regarding the overall performance of the irrigation practice at the experimental field.
Methods
CropX soil moisture sensor (CropX Ltd., Tel Aviv, Israel) is proposed for this study. There are three main reasons to select this sensor. First is its helical wing that ensures minimum root zone soil disruption and avoids preferential flow; second is its built-in data logger with telemetry and cloud-based data storage that allows remote data collection; and third is its ability to sense soil moisture from multiple depths. The accuracy of CropX soil moisture sensors is +/-2%. The sensor measures the soil moisture at every 150ms that are averaged for a 30-minute interval, and the information is stored to the cloud after every 12 hours. The measurement depths of the sensor are 8” (≈ 20 cm) and 18” (≈ 46 cm). CropX sensor mechanism works on the amplitude domain reflectometry at 100MHz and the moisture in soil is estimated based on the difference in amplitude of an electrical signal moving towards and backward from the soil due to change in impedance between the electrodes and soil. The sensor provides soil moisture data in volumetric water content (VWC) and in terms of water depth (mm) for the root zone within the soil profile. Furthermore, rainfall data and potential evapotranspiration (ETo) data from the nearest weather station is provided under the online dashboard (Figure 1).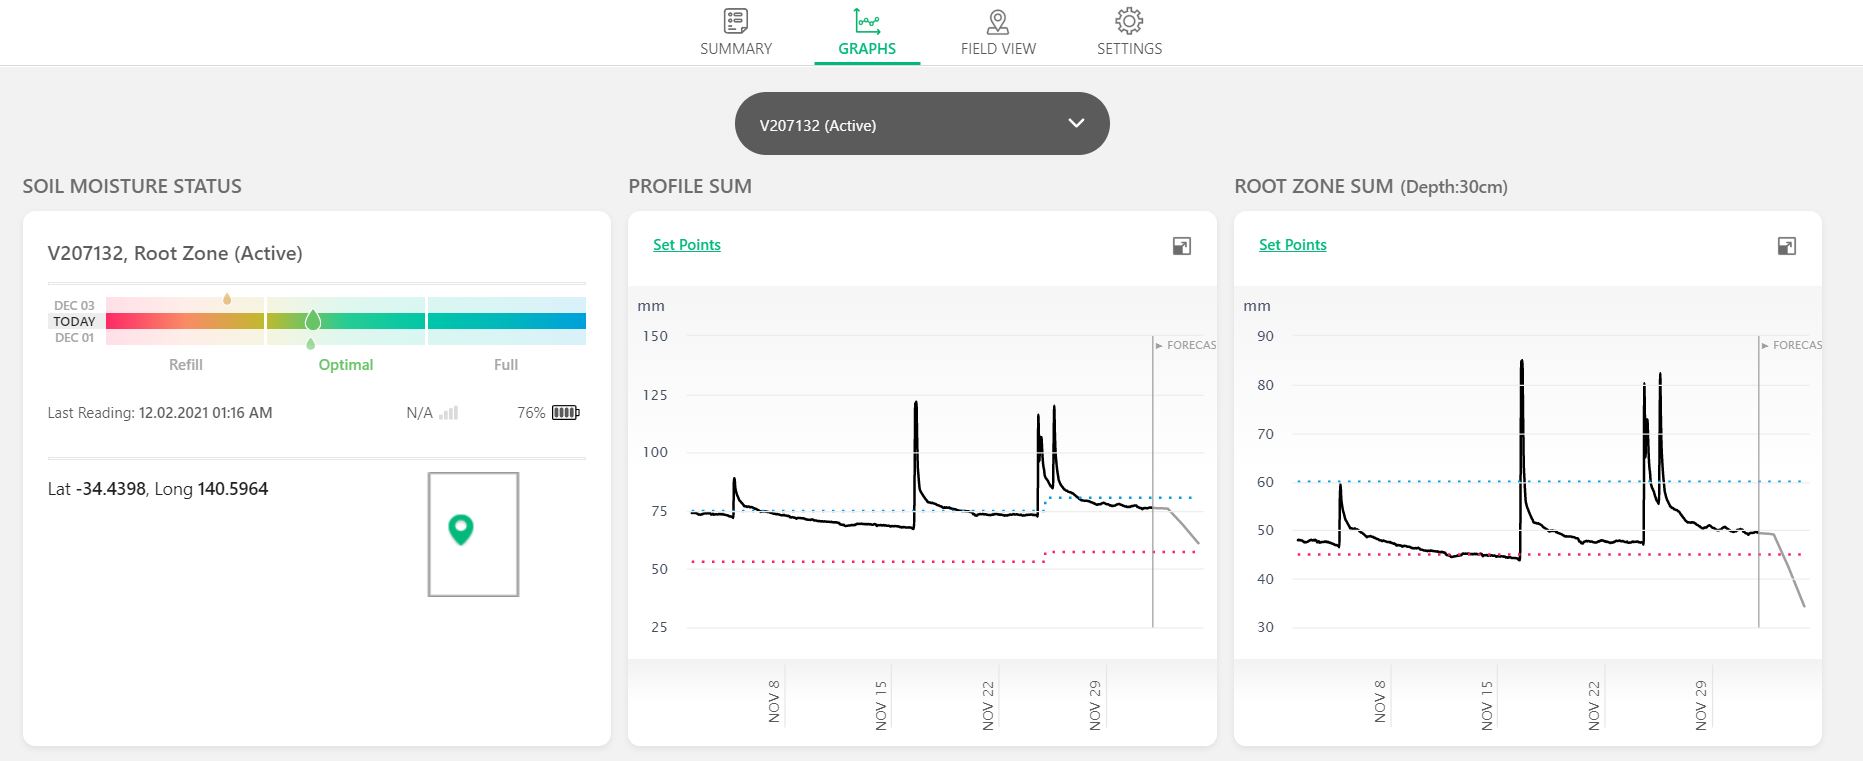
Freely available Landsat-8 and Sentinel imagery will be obtained. The former imagery source has spatial resolution of 30 m and temporal resolution of 16 days, and the latter source has spatial resolution of 10 m and temporal resolution of 5 days (Skakun et al., 2017). The imagery will be processed to estimate the normalized difference vegetation index (NDVI) and normalized difference water index (NDWI). These indices will be estimated following equation 2 and 3.
NDVI = (NIR - R) / (NIR + R) (2)
where NIR is near infrared band and R is the red band.
NDWI = (NIR - SWIR) / (NIR + SWIR) (3)
where NIR is near-infrared band and SWIR is short wave infrared band.
The combination of these reflectance bands in NDVI enhances the vegetation properties and photosynthetic activity in crop whereas NDWI allows for detection of the moisture content in the crop canopy. Values for both indices vary between -1.0 and 1.0, where high value shows green and dense vegetation, lower values show water-stressed plants, and values near or below zero represent low biomass and exposed soil (Gessesse & Melesse, 2019). NDVI is widely used for monitoring drought and NDWI has shown high correlations with leaf water content (Alvino et al., 2020). Therefore, these indices can be considered useful for strengthening irrigation related decision making as early water stress can be detected in crop (Katsoulas et al., 2016). The impact of past events can be analyzed both at temporal and spatial scale, and adjustments in the future irrigation applications can be suggested to growers based on the trends shown by indices. These indices will be shared with the grower every 5 to 16 days, depending on the availability of imagery and cloud cover. The irrigation requirement of the crop will be estimated using the FAO-56 approach (Allen et al., 1998) using equation 4.
ETc = ETo x Kc (4)
where ETc is the crop water requirement, ETo is the potential evapotranspiration, and Kc is the crop coefficient. ETo will be estimated using the data from the nearest weather station, and Kc for initial, middle, and late stages. Soil hydraulic properties (i.e., field capacity and wilting point) will be retrieved from a recently conducted analysis of multiple soil samples collected from the farm.Response to reviewers comments (previous submission)
Cooperators
Research
A helpful performance indicator of the optimum use of water in irrigated agriculture is water use efficiency (WUE), which is the amount of profitable produce obtained per unit of water used by the crop. Considering the regional water limitations, substantial improvements in WUE can be achieved by reducing both crop water consumption and field water losses without compromising yield productivity. Hence, irrigation management strategies were formulated to increase WUE and conserve water.
Irrigation management strategies may involve reducing water losses such as deep percolation and runoff, reducing the number of irrigation events, adapting irrigation to rainfall received, and improving the irrigation system's uniformity. These strategies are carried out by monitoring the soil and crop water status to deliberately stress the crop to a certain profitable level (deficit irrigation).
Crop water status can be monitored by using soil water sensors and diverse imagery data (satellite or drones). The choice of sensor would depend on the size of the field, the type of crop, the soil water range to be measured, cost-effectiveness, ease of maintenance, and the sensor's performance reliability. A problem observed with soil-water sensors is that they measure a small portion of the field, so establishing several sensors to capture soil moisture variability is necessary. The use of drones and satellites are weather dependent. Satellites cannot be used in cloudy days and drones in windy days. The soil water sensors area better choice to monitor soil water content.
This study was conducted in two locations: one at a local farm (Site 1) located in Edinburg, TX and the second located at the Texas A&M AgriLife Research Center (Site 2) located in Weslaco TX during the winter season of 2022-2023 on the Lower Rio Grande Valley of Texas.
The soil in Site 1 is a fine sandy loam, while in Site 2 is a sandy clay loam. The research sites exhibit a semiarid climate with an average annual temperature of 23.7°C and an average annual rainfall of 601 mm. The primary water source is the Rio Grande, but long-term water availability is affected by drought, international treaty issues, and increasing demand. In both sites, a cabbage variety was planted at 1 ft spacing between plants and 40 inches between rows. Irrigation water was delivered through a subsurface drip irrigation system.
The sum of soil water depletion (SW) from the root zone, irrigation water applied (I), and precipitation (P) during the growing season determined the total crop water used (CWU) per season. Daily CWU was summed to obtain the cumulative CWU in the growing season. Cabbage plots were irrigated using a subsurface drip irrigation system connected to flowmeters to measure the irrigation water applied. Soil moisture is critical for understanding how much water the crops receive versus how much they need. Commercial soil moisture sensors were installed at both sites to evaluate the efficacy of water irrigation applications. For Site 1, a cloud-based soil-water sensor, CropX (CropX Ltd., Tel Aviv, Israel), was installed and does not require manual data retrieval. Soil-water data from the CropX sensor was recorded using volumetric percentage (%). For Site 2, commercial 200SS WATERMARK soil moisture sensors were installed to evaluate the efficacy of water irrigation applications. They are electrical sensing devices buried in the active root zone to measure soil water tension. The watermark sensors read soil moisture conditions as matric water potential in centibar (cb) units. The water tension range in watermark sensors ranges from 0 to 200 cb, with 0 cb denoting saturated soil and 200 cb signifying relatively dry soil. The soil-water sensors and dataloggers were strategically installed in the center of the bed of each irrigation treatment at 8 and 18 inches (20 and 46 cm) depth in both experiments. Soil water status was monitored and recorded continuously using the soil moisture sensors and a data logger. These sensors were selected because some farmers use them extensively to monitor soil moisture conditions in their fields.
Performance indicators for this study were yield (Y) and water use efficiency (WUE). The yield data from both sites were collected at the end of each growing season. Four destructive samples were randomly collected from a 1.2 m2 area from the study plots at every site. The material was weighed to determine the yield. WUE was estimated using the equation: WUE = Y/(CWU), where CWU is the sum of the daily crop water use during the growing season. SW was estimated using the soil moisture data.
Satellite imagery acquisition
The Sentinel-2 comprises a constellation of two polar-orbiting satellites. Each satellite has a temporal resolution of ten days, and the combined constellation is five days and a spatial resolution ranging from 10 to 30 m, depending on every band. Sentinel-2 satellite imagery was obtained for Site 1. The Semi-Automatic Classification Plugin (SCP) tool in the QGIS software converted the bands used for this study into 10 m spatial resolution. The acquisition of useful Sentinel-2 images is limited to free-cloud days. The imagery data was used to calculate only the normalized difference vegetation index (NDVI) and the normalized difference water index (NDWI). These indices were calculated as follows: NDVI = (NIR - R)/(NR + R), and , NDWI = (NIR - SWIR)/(NIR + SWIR), where NIR, R, and SWIR are the near-infrared band, red band, and short-wave infrared band, respectively. The combination of these reflected bands in NDVI enhances the vegetation properties and photosynthetic activity in crops, while NDWI allows for detecting the moisture content in the crop canopy. After calculating both indices for different image acquisition dates, crop response under conventional irrigation was evaluated. Values for both indices range from -1.0 to 1.0, where high values show green, dense, and free water-stressed vegetation, near zero values show low biomass and exposed soil, and lower values show water-stressed plants.
Monitoring soil water content is essential to help growers optimize production, conserve water, and save money. For this study, soil-water content was monitored to evaluate the irrigation practices employed in the study sites. The recorded volumetric water content at 8 and 18 inches below the soil profile in Site 1 revealed a critical finding regarding the irrigation practices employed. The soil water percentage at 45 cm consistently exceeded that at 20 cm depth throughout the growing season. Since the crop's root zone extends only to 20 cm, this discrepancy indicates an excessive application of irrigation water exceeding the crop needs. Volumetric water content (VWC) at 45 cm exceeded field capacity (FC) during the growing season, while VWC at 20 cm exceeded the limit of FC during the last 15 days of the growing season. Consequently, the excess water percolated beyond the root zone to the deeper soil layers, reducing the efficiency of the irrigation strategy.
On the other hand, the recorded soil matric tension at 15 and 45 cm below the soil profile in Site 2 showed that the soil water tension at 45 cm kept less soil water than at 15 cm during the growing season. This result indicates that the crop was irrigated adequately by keeping moisture only at the active root zone, avoiding deeper percolation. Irrigation was triggered before the sensor, located at a depth of 15 cm, reached 65 cb. Most of the time, irrigation was triggered before the sensor reached 50 cb and, on only one occasion, reached 60 cb.
The average yield in Site 1 was 57.013 Mg/ha (47,297.09 lb/ac), while in Site 2, it was 59.333 Mg/ha (52,935.66 lb/ac). A t-test analysis showed no significant difference (p-value > 0.05) in yield between both sites. This result implies that the yield in Site 1 is not statistically different from that of Site 2. Yields were similar in both sites because all crop demands, such as nutrients and water, were satisfied. These results indicate that conventional irrigation can obtain higher yields as an irrigation management strategy if the crop water demands are satisfied.
During the season, irrigation was applied to meet crop water demand in both sites. However, irrigation water applied in Site 1 consisted of 15 irrigation applications during the growing season, giving a total irrigation water applied of 304 mm (12 inches); while in Site 2, water irrigation applications comprised eight irrigation applications during the season, giving a total of 203 mm (8 inches). According to these results, approximately 67% of the water applied in Site 2 was applied in Site 1. WUE was estimated as the ratio between the yield of each sample and the cumulative CWU. The average WUE in Site 1 was 16.7 Kg/m3, while in Site 2 was 24.9 kg/m3. A t-test analysis showed a strong significance difference (p-value < 0.01) in WUE between both sites. This result implies that the WUE in Site 1 is statistically different from that of Site 2.
Differences in WUE occurred between sites due to the type of irrigation strategy used. In Site 1, conventional irrigation was applied to the field, while in Site 2, irrigation was applied to the field using an irrigation management strategy based on monitoring soil-water content. This irrigation strategy involved monitoring soil moisture at the active root zone to keep it at field capacity to avoid deeper percolation beyond lower soil layers. Using irrigation scheduling strategies with soil moisture sensors helped to conserve 4 inches of the water used in conventional irrigation.
ET calculations
Reference and crop evapotranspiration (ET) were estimated using the Penman-Monteith method and the FAO-56 crop coefficients (Kc) for a length growing season of 94 days. The cumulative reference ET was 330 mm, while the crop ET was 310 mm. Calculated crop ET was similar to the total irrigation water applied at Site 1 (304 mm), where the field was over-irrigated during the season, and much of the water was lost due to deep percolation. Therefore, developing irrigation strategies based on the estimation of crop ET with conventional Kc values would be inadequate for water conservation purposes in the Lower Rio Grande Valley.
Vegetation indices for irrigated cabbage monitoring
NDVI and NDWI indices calculated from the Sentinel-2 imagery were used to evaluate the crop response to conventional irrigation during the growing season in Site 1. These indices tried to depict the phenological stages of cabbage development from germination to senescence. Because of the lack of free-cloud images, it was possible to obtain imagery data only for a few dates of the growing season.
The results of NDVI ranged between 0.09 and 0.63, and the lower values were observed in the early stages. The lower values (0 – 0.2) on the first date indicate the absence of canopy cover and the predominance of exposed soil, meaning the plants were in the emergency or germination stage. Values observed on the second and third dates (0.2 – 0.4) indicate low canopy cover. The observed values on the following dates (0.4 – 0.6) indicate an average canopy cover and healthy plants. NDVI results were more sensitive in the early crop stages, showing an increased capacity for differentiating low vegetation, while a more extensive dispersion of data was observed in the following stages. The periods with more data dispersed are between the vegetative development and maturity stages. Therefore, due to the observable data dispersed in most of the season (due to the spatial resolution of 10 m), the Sentinel-2 imagery could not be considered sufficiently effective in discriminating differences in NDVI data at the different crop development stages of the growing season.
The results of NDWI ranged between -0.16 and 0.41, and the lower values were observed in the early stages. The lower values (-0.2 - 0) in the early stages indicated low water stress and lower canopy due mainly to the predominance of exposed soil, meaning the plants were in the emergency germination or early vegetative stage. Most NDWI values observed in the vegetative stage (0 – 0.2) indicated low water stress and canopy cover. The observed NDWI values (0.2 – 0.4) in the following stages indicated low water stress and an average canopy cover. NDWI was more sensitive in early crop stages, showing an increased capacity for differentiating water stress conditions and low vegetation, while a more extensive dispersion of data is observable in the following stages, mainly in the vegetative and maturity stages. Therefore, due to the observable data dispersed in most of the season (due to the spatial resolution of 10 m), the Sentinel-2 imagery could not be considered sufficiently effective in discriminating differences in NDWI data at the different crop development stages.
The recorded daily soil moisture data from the soil water sensor differs from the NDWI data obtained from the satellite imagery. According to the soil moisture records, the crop water demand was satisfied for the growing season; however, NDWI values indicate the crop was under low water stress for most of the season. This inconsistency of results could be attributed to the spatial resolution of the imagery data since its spatial resolution is inadequate for this type of analysis. The information from the satellite cannot be used to differentiate the level of water stress in the crop. Additionally, due to the spatial resolution of Sentinel-2 and the available free-cloud imagery, it is not easy to monitor the water status of the crop when the crop cover is expanding.
Conclusions
Using soil-water sensors helps evaluate irrigation strategies, monitor irrigation performance, and adapt the irrigation management strategies. In the commercial field (Site 1), the soil water status was maintained at field capacity and almost saturated during most of the growing season. In contrast, the strategy followed in Site 2 of irrigating the field before the soil water depletion reached the maximum allowable depletion allowed to conserve more than 33% of water and sustain similar yields to Site 1. Commercial fields can conserve additional water by allowing some deficit in the soil. It is common to have diseases and problems with cabbage during rainy years. The most common disease in cabbage is black rot. Some farmers have moved their cabbage production to more sandy soil. However, some of them over-irrigate even if they use drip irrigation systems. The present research proves that using soil moisture sensors improves drip irrigation practices and ensures water applications meet the crop's requirements. Both CropX and Watermark sensors can be valuable instruments in agricultural irrigation management to increase efficiency and conserve water because they provide accurate information about the moisture conditions of the soil. However, using CropX involves knowing basic soil properties to determine the field capacity, management allowable depletion, and wilting point thresholds.
Satellite imagery with Sentinel-2 is affected by cloud conditions and spatial resolution. These restrictions could make it challenging to monitor the crop's water condition.
Educational & Outreach Activities
Participation summary:
Consultations were given to 15 farmers interested in learning about soil water sensors. One on-farm demonstration was held at Texas A&M related to the use of soil water sensors. Two water levels were applied, and different cabbage varieties were tested. Fifteen farers attended the demonstration. One field day was co-organized with the Texas Water Development Board, a Changing the Odds of Success for Socially Disadvantaged Farmers and Ranchers in Texas (USDA-Office of Partnerships and Public). Around 70 farmers attended the workshop and learned about using soil water sensors and the limitations of using satellites for irrigation management.
A journal article is being written on the selection of cabbage varieties for drought tolerance that resulted from these experiments. We are also writing and analyzing data.
Learning Outcomes
Soil water balance
Irrigation scheduling
Irrigation system management
Project Outcomes
Ten farmers adopted best management practices in irrigation. We wrote one proposal to build upon this program, but funding decisions have not been made yet. We have working collaborations with New Mexico State University and with the ag company Little Bear Produce.
With this project, we evaluated the use of satellites and remote sensors for irrigation scheduling. The satellites are challenging to use in irrigation scheduling due to their rough resolutions, and some days, the cloud and images cannot be collected. Vegetable crops need daily monitoring of soil and water conditions. Soil water sensors with remote capabilities can be used. However, they must be calibrated, and guidelines must be developed for each crop and sensor type. We gained knowledge with this project, which was shared with agricultural producers of the Lower Rio Grande Valley.
New products are being developed to monitor soil moisture. The accuracy and reliability of these new products need to be evaluated consistently with more specialty crops. Soil moisture sensors can conserve water, reduce production costs, and help farmers be more profitable. They enhance the sustainability of irrigated agriculture. More experiments are needed with the use of unmanned aerial systems, deficit irrigation levels, and soil water sensors to optimize irrigation. Several varieties need to be evaluated for drought tolerance.