Final report for OS23-163
Project Information
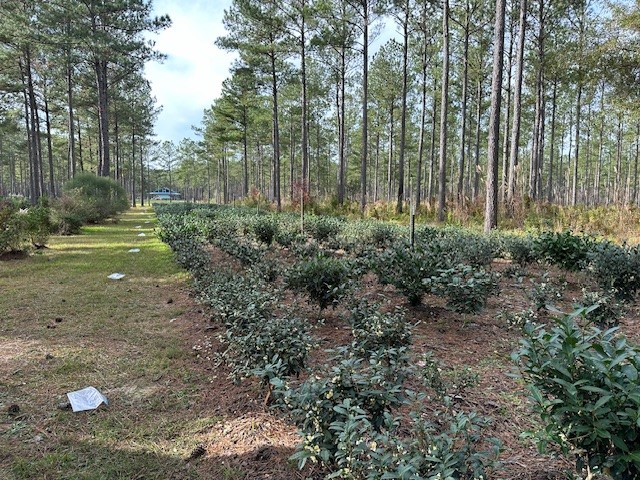
In this project, we propose to use a newly established tea field (2-month-old in the field) and an established tea field (5-year-old) at Fleur de Lis Tea Co., a commercial tea farm in Amite, LA, to study the effects of adding a locally available soil amendment composted with horse manure and parish unitality trimmings over a year, in combination with three supplemental N fertilizer types (blood meal, Black-Kaw cow manure, and ammonium sulfate, on soil microbial activity, young plant establishment, and leaf quality (key chemical compounds) of mature plants. Fertilizer treatment rates were determined according to plant age, soil type, soil fertility testing results, and the goal of these fields (Figure 1 Tea fields at the farm).
Since 2017, PI and a tea research team at LSU AgCenter have received supports from the Specialty Crop Block Grant program in Louisiana to study the suitability of growing tea as a new specialty crop for the state. As researchers conducted germplasm evaluation and field trials with different production systems in southeastern Louisiana, several tea farms and research tea fields have been established, including the Amite tea farm and two plantings in New Iberia, LA. A research tea field with ‘Georgian (the Republic) Tea’ seedlings was established at the LSU AgCenter Hammond Research Station in 2016, and three more fields were added in 2019 and 2020 for the evaluations of cutting propagated ‘Brew-Tea-Ful’ and seedling collected from various sources. All tea fields at the station are under full sun. In addition to variety evaluations, research studies such as weed management using organic mulches and weed barriers, responses of young tea plants (2-year-old) to organic and synthetic N fertilizers, and changes in leaf chemical compounds in response to temporary shading onto mature tea plants have been conducted in these fields.
Since 2016, project PI and several other LSU AgCenter tea researchers have worked with the Fleur de Lis Tea Co. along every steps of their development, and provided technical support to issues they have encountered through this tea-farming adventure, for example, soil testing result interpretation, field design (with drainage issues), and pest and weed issues. The tea fields at this farm are under loblolly pine trees, an indicator species of acidic soil and low fertility in southeastern LA and representative to several large areas along the Gulf States. So far, the farm has four long rectangular raised beds built on top of native soil with the addition of pine bark, for a total of ~1 acre (Figure 1 Tea fields at the farm). After planting, during the first year (and if needed, in later years), the grower liked to add a compost material made onsite by mixing horse manure (free of charge from neighboring farms) and parish utility trim (free of charge) then composting (rotating once a month) for one year. This composting practice is also representative among orchard growers in the area and can be used by other prospective tea growers because utility trimmings are available free of charge in many Louisiana parishes.
The long-term relationship PI has built with the farm owner, Mr. David Barron and his farm manager Mr. Hans Marchese, and the field set-ups at this farm present a great opportunity for conducting on-farm research. From this project, we expect to test the hypothesis generated from previous research studies conducted at the research station and collect real-world data. Results from this project will be used to demonstrate the benefits, upon approval, of using locally available materials and composting, and using organic N sources vs. synthetic N for increased root and aboveground biomass and also leaf quality. Because the tea plants at this farm are grown under pine trees, we also expect that data collected from this study will complement those already collected from a N fertilizer type study conducted in 2021 in the tea fields under full sun at the research station, where different rates of blood meal, ammonium sulfate, and their combinations were tested.
In addition, the tea farm is 28 miles away from the Hammond Research Station and ~ 1 hour drive from Baton Rouge and New Orleans, two metropolitan areas where urban farming and agriculture tourism are very popular. The farm manager, Hans, has conducted many public tours as an important source of income for the farm, especially after the farm began commercially harvest, process and market the “Big Easy Black Tea”, an award-winning black tea debuted in May 2022 (https://www.facebook.com/Fleurdelisteaco/). Four tea workshops have been conducted by LSU AgCenter and an annual meeting of USLTG has been held at the farm and the research station tea fields, and we expect to hold similar workshops in 2023 and 2024, with additional information and experimental results from this project presented at the 2024 workshop.
Therefore, the objectives of this project are to:
(1) Evaluate the impact of a local compost material on soil microbial and soil property (organic matter, bulk density, pH, and nutrients availability) in new and established tea fields.
(2) Measure the effect of the same supplemental N treatments at a moderate rate on leaf quality (health benefiting chemical compounds as indicators) of established plants that are being trained into plucking tables.
(3) Determine potential benefits of using supplemental N (organic or synthetic) in establishing young tea transplants in a silty upland soil.
(4) Document and share project progress and results with other tea farmers and specialty crop growers interested in growing tea by presenting at tea workshops, grower association meetings, UC Davis Global Tea Initiative annual colloquium, and field days; and by posting to social media and developing factsheets on tea fertility management.
We expect to collect preliminary data that will enable us to provide basic information to tea farmers on plant nutrient management at early and more established growing stages, and help us design more complicated experiments in the future to study interactions among fertilization rate, timing, harvest schedule, and other production practices, and compare regional differences in fertility management.
The soil type at the tea farm is in the category of Subtropical Mississippi Valley Silty Upland soils with organic matter content from 2.5% to 5% (LSU AgCenter Soil and Plant Tissue Testing Lab, April 2021). To support our objectives, we will conduct two experiments each using a long tea field at the farm (Figure 2 Field layout of treatments). We will collect data from both experiments for Objective (1), and collect data from Expt. 1 (using Field #1) for Objective (2), and collect data from Expt. 2 (using Field #4) for Objective (3). All results will be used to support Objective (4).
Two factors, soil amendment with an aged compost as Factor A at two levels (with or without), and supplemental N sources as Factor B at three levels [blood meal (12-0-0), Black-Kaw cow manure (0.5-0.5-0.5), or ammonium sulfate (21-0-0)]. The soil amendment will be applied as a 4-inch thick layer over the top of existing mulch in Expt. 1 (Field #1) and on top of native soil in Expt. 2 (Field #4). Fertilization rates for Expt.1 will be at 450 pounds of N per acre per year for Expt. 1 with all three N sources, and at 150 pounds of N for Expt. 2. These rates were selected based on a discussion with Hans and David, considering soil type, organic matter contents, plant age, and the goal of these fields. Phosphorus has been high at this farm and will not be added but monitored with soil testing. Potassium will be applied at the same rate to all fields. For both experiments, fertilizers will be applied as four split applications every two months starting from March of each year.
A split-plot design is used for both experiments. Each field, running east to west, is divided into 3 sections, with 3 plots nested in each section. Then each plot is divided into two smaller plots, running north to south (Figure 2). The 3 sections serve as whole-plots, and the smaller plots serve as sub-plots. Treatment factor A, with or without compost amendment is randomly applied to sub-plots, and treatment factor B, three N sources will be randomly applied to the nested plots within each section(serving as replications, and blocked along drainage direction from east to west). Treatment units for factor A are the small plots, and treatment units for factor B are the total of 9 larger plots.
All plants were planted at 3-foot spacing, and there are a total of 72 plants in each of the 9 plots, and a total of 36 plants in each of the smaller plots to receive Factor A. We will use the middle row along the field from east to west, the plants next to the dividing line between the 9 plots, and the plants located at the perimeter (the north and south rows) as “Buffer plants” that, they will be treated but no data will be collected from these plants.
Data collection and sample analysis. From both fields, we will collect the following data. In addition, temperature, humidity, and PAR sensors will be installed in the middle of the fields to record environmental conditions.
- Soil samples for microbial activity analysis will be collected by sampling the top 4-inch of the actual soil (remove top composting material when sampling, then putting them back) using a sampling tube. Samples will be stored in Ziploc bags, placed on dry ice, and stored in freezer until sample analysis. Soil microbial activities will be evaluated by FAME in the soil microbial lab. Student working on this project will be trained by lab staff and conduct the analysis. Soil samples for routing soil fertility analysis will be collected from top 6-inch soil using a sampling tube and placed in paper bags and dried for analysis. We will also test soil pH and bulk density with this sample.
- From the established field (Field #1), we will collect 10 grams of fresh weight as leaf tissue analysis samples for nutrient analysis (total N, P, and agricultural metals). These samples will be collected from three randomly selected plants in the middle area of each sub-plots. The LSU AgCenter Soil and Plant Tissue Testing Lab will perform the analysis. Because this field is being harvested for making black tea, we will also sample the final products at three harvests in the summer between two commercial harvesting, and only use leaves collected from each sub-plot. Although regular harvesting and processing are done by machines for this field, the harvesting for research samples will be hand plucking, and then these leaves will be processed into a black tea following the same method used by the grower to process small batches by hand. A total of 15 grams dry weight of the processed black tea will be used for the analyses of caffeine, EGCG, total polyphenol, and theaflavin. These compounds are key health benefiting compounds that have been studied in a previous research conducted at the Hammond Research Station tea field. Dry black tea samples will be analyzed by a staff at the Chemistry Department with the student assisting sample preparation and loading.
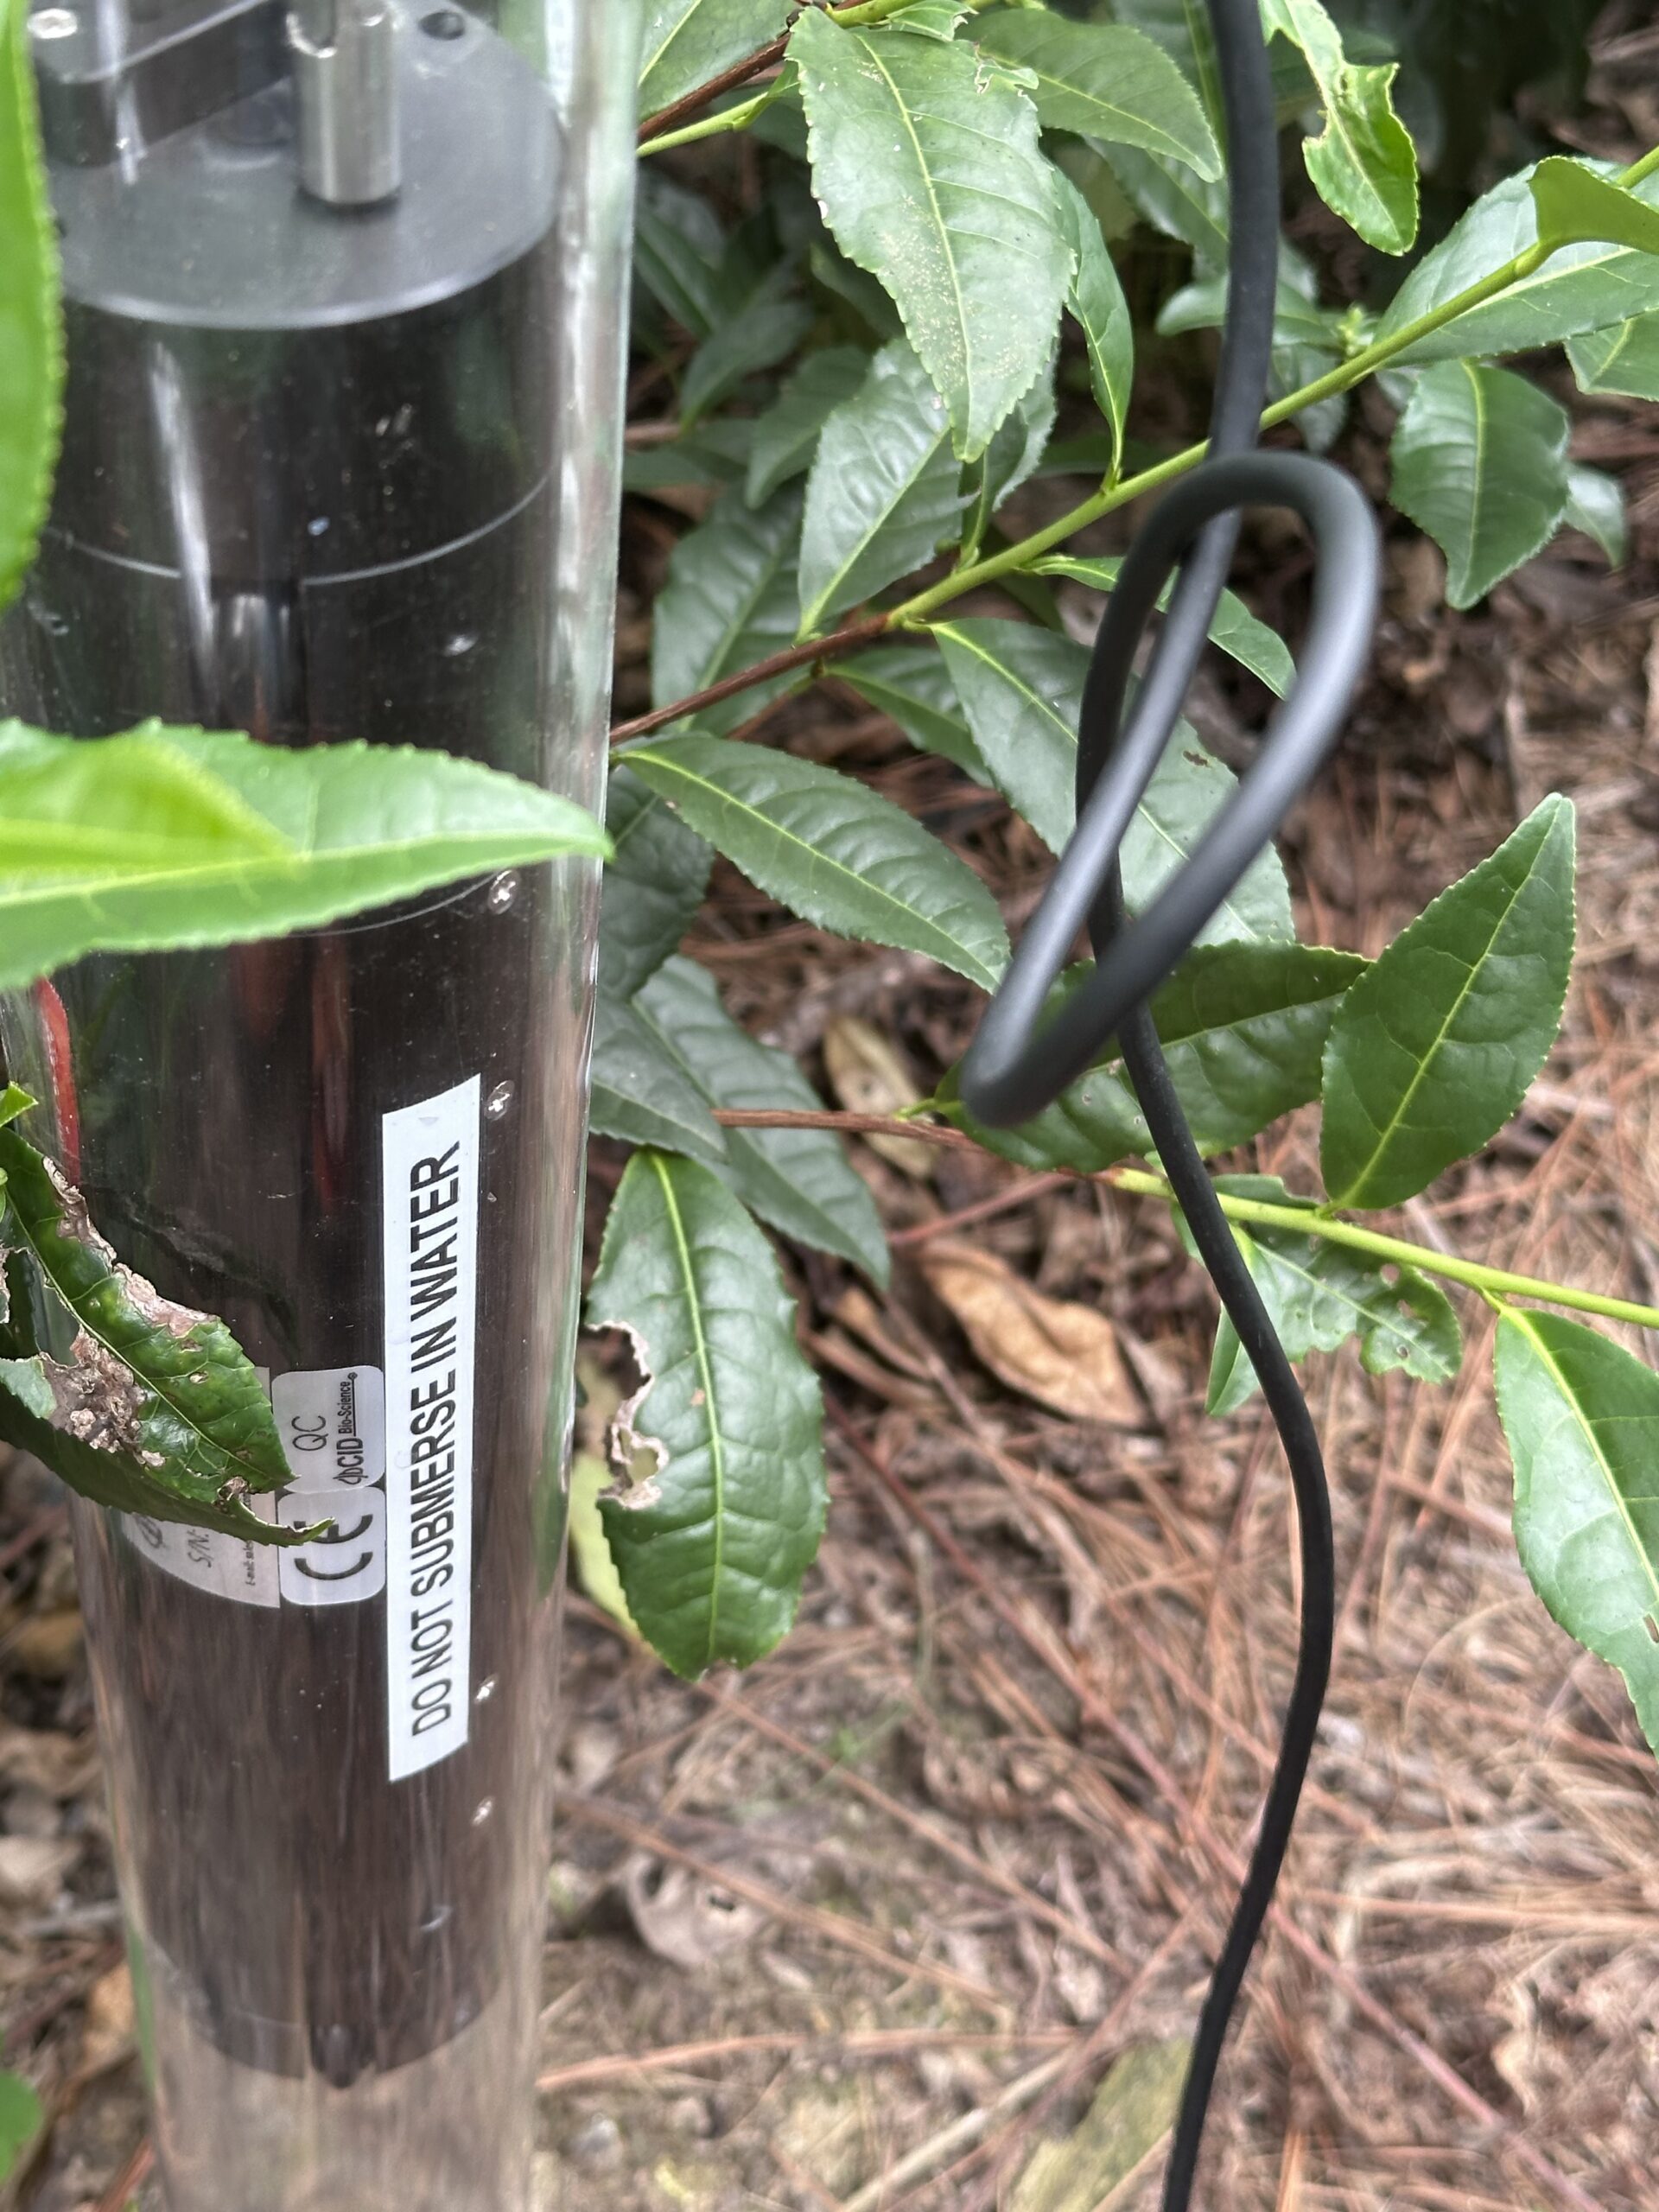
- A root imaging system, CI-600 In-situ Root Imager (CID BioScience) will be used to obtain 360 degree root scan images from the young transplants in Expt. 2 (Field #4). The system has been used with other plant species before but we expect successful application with establishing tea plants. A total of 18 observation clear tubes will be installed next to 18 selected plants, each from one sub-plot, and used to collect root images. Images will be collected every two months starting from the summer of 2023. Images will then be analyzed by WinRhizo software for presenting root length, diameter, number of internode, etc. Although the set up and use of this technology is not new, these images will provide large number of measurements on root structure, growth, and architecture traits. This will be the first ever collection and analysis of such images for developing tea plants.
Cooperators
- - Producer
- - Producer
Research
On-farm research fields: There are four fields at the tea farm, each are 0.25 acre. Field #1 was planted with a variety named ‘Georgian Tea’, which was sourced from Georgia, the Republic, and were about 7-year-old by 2024. These plants were actively harvested since 2022 for commercially processing and selling two loose leaf black tea brands, the 'Big Easy' and the 'Friendship' tea, both available through the farm's online shop (https://www.fleurdelisteaco.com/shop?Category=Loose%2520Leaf%2520Tea) with 'Big Easy' also offered through Harney & Sons Fine Tea. This field has been maintained under higher nitrogen (N) fertilization rates (700 to 800 lb. N/A/year) by a mixed application of ammonium sulfate and urea, with occasional supplemental application of zinc (Zn) to ensure high supplies of N to meet the demand of the growing (and harvesting/removing) young shoots. Three additional fields, Field #2 to #4 were used for the fertility studies under this project from May 2023 to August 2025. Field #2 was planted with a tea variety named ‘Brew-Tea-Ful’, which was cutting propagated and demonstrated high uniformity among individual plants in growth habit, leaf size and shape, and potential response to production practices. Plants were 3 years old at the time of treatment initiation in May 2023 (Fig 1).
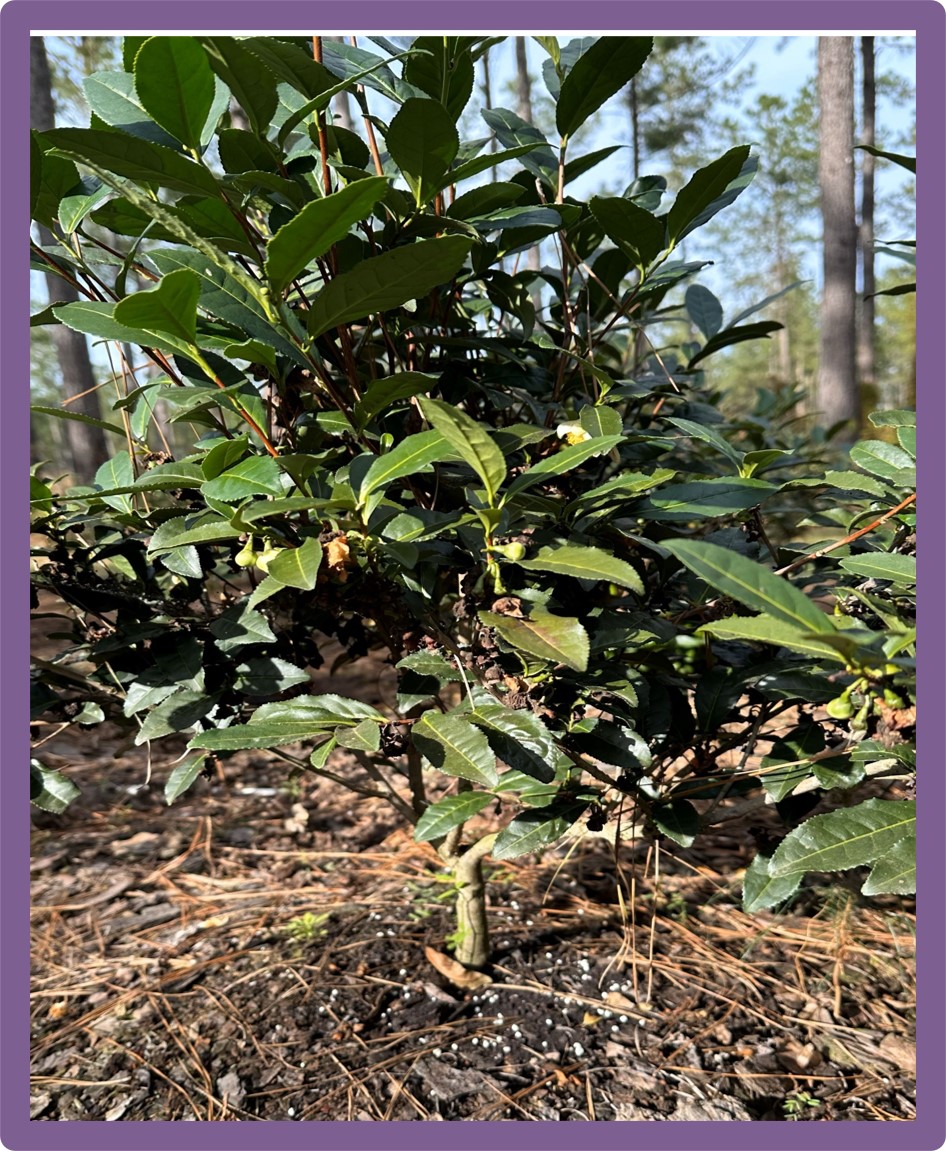
Field #3 was planted with 'Georgian Tea', and plants were expected to be less uniform in growth habit, leaf size and shape, and response to treatments compared with Field #2, thus more replications were used in this field. Plants were 2 years old at the time of fertilizer treatments. Previous fertilization history was provided by farm manager, which included (1) a blanket application of a local organic compost consisted of horse manure and utility tree trims with available organic N at 0.5%, and the mixed material had been composted for at least two years; and (2) applications of ammonium sulfate at 350 lb. N per acre per year (1 A = 43,560 ft2), applied as 7 split-applications every 40 days from March to November.
The original fertilizer treatments proposed included 'with' or 'without' the organic compost as a whole plot treatment for a split-plot design with additional synthetic or organic fertilizer treatment nested within whole plots. However, because there had been some drainage issues in Field #2 and adding a layer of organic compost can increase water holding potential in the root zone, out of a caution not to cause water logging, we revised the fertilizer treatment structure to only compare synthetic and organic fertilization programs, removing the compost treatment factor. In the early spring of 2025, the farmer decided to replace all ‘Brew-Tea-Ful’ plants in Field #2 with ‘Georgian Tea’ because they are more satisfied with how fast the later grows. Plant measurements and foliage and soil sampling in this field stopped in February 2025. Measurements in Field #3 continued into August 2025. Field #4 was planted with ‘Georgian Tea’ in October 2024 and was used for monitoring root growth under the same treatments as Field #2. We only used the root scanner method for this field because it is almost impossible to track root growth in mature plants with numerous find roots in each captured image, but it is more efficient to begin with newly planted plants.
Experiment 1 (N replacement study) was conducted in Field #2 and included five treatments. The objective of the experimental design was to compare fertilization programs using 0, 25%, 50%, 75%, or 100% organic nitrogen (N) fertilizer (blood meal, N-P-K 13-0-0) to replace a synthetic N fertilizer [UAS, N-P-K 33-0-0, (50% urea + 50% ammonium sulfate + Anchor (NBPT)] (Table 1). The field (32 ft. wide X 380 ft long) with tea plants planted at 3 ft center-to-center, was divided into three large blocks each having 5 sub-plots (replications) for a total of 15 treatment units (plots). Each treatment unit has 8 plants (south to north across the field) and 7 rows (east-to-west) for a total of 56 plants. The plants on the perimeter of each plot were considered buffer plants, and plant growth responses measurements and leaf tissue samples were collected from randomly selected plants within the 6 x 5 (= 30) plants inside the perimeter. Soil samples were collected from the northern and southern side of selected plants (3 plants) within the perimeter. Total nitrogen targeted 500 lb. N/A/year which was 86.4669 lbs. N/field/year, and this amount was applied following the same practice at the farm as 7 split applications at 40 days apart (Table 1). Fertilizers were weighed and mixed well before applications. A small hand-held applicator was made for each treatment to apply the exact amount of fertilizer needed for a plant, and fertilizer was scooped up using this tool, leveled, and broadcasted around the base of each plant.
Table 1. Fertilizer application calculation for Experiment 1 (Field #2).
|
Treatment |
Fertilizer |
Applica. Rate (grams of product/unit/application) |
|
1 |
100% synthetic [urea ammonium sulfate (UAS), N-P-K 33-0-0) |
948 grams of UAS |
|
2 |
75% synthetic + 25% organic |
711 g UAS + 601 g BM |
|
3 |
50% synthetic + 50% organic |
474 g UAS + 1203 g BM |
|
4 |
25% synthetic + 75% organic |
237 g UAS + 1804 g BM |
|
5 |
100% organic [blood meal (BM), N-P-K 13-0-0] |
2406 grams of BM |
The above treatments were applied to Field #4 in November 2024, and throughout the 2025 growing season. Measurements on plant growth, leaf greenness and tissue concentrations were collected in August 2025. A CI-600 root scanner was installed on April 3rd, 2025 (6 months after planting) and scans were conducted every two months to compare root growth among fertilization treatments.
Experiment 2 (N rate study) was conducted using Field #3. Treatments included either blood meal or UAS applied at 3 rates: 150, 250, or 350 lb N/A/yr (Table 2). The application rates for this study were lower than Field #2 because plants were 1-year younger in Field #3. The 32 ft wide x 280 ft long field was along its length into two large plots, and then each were divided into 9 smaller plots for a total of 18 plots and housed a total of 18 treatment units [3 rate x 2 type x 3 blocks (replications)]. Each treatment unit has 6 (east to west) x 4 (north to south) = 24 plants, and is about 180 ft2 (24 x 3’ x 2.5’). Same as in Expt. 1, plants on the perimeter of each plot were used as guardian (buffer) plants, and only the plants inside the perimeter (5 x 3 = 15) were randomly selected for taking measurements or collecting tissue or soil samples (Fig 2).
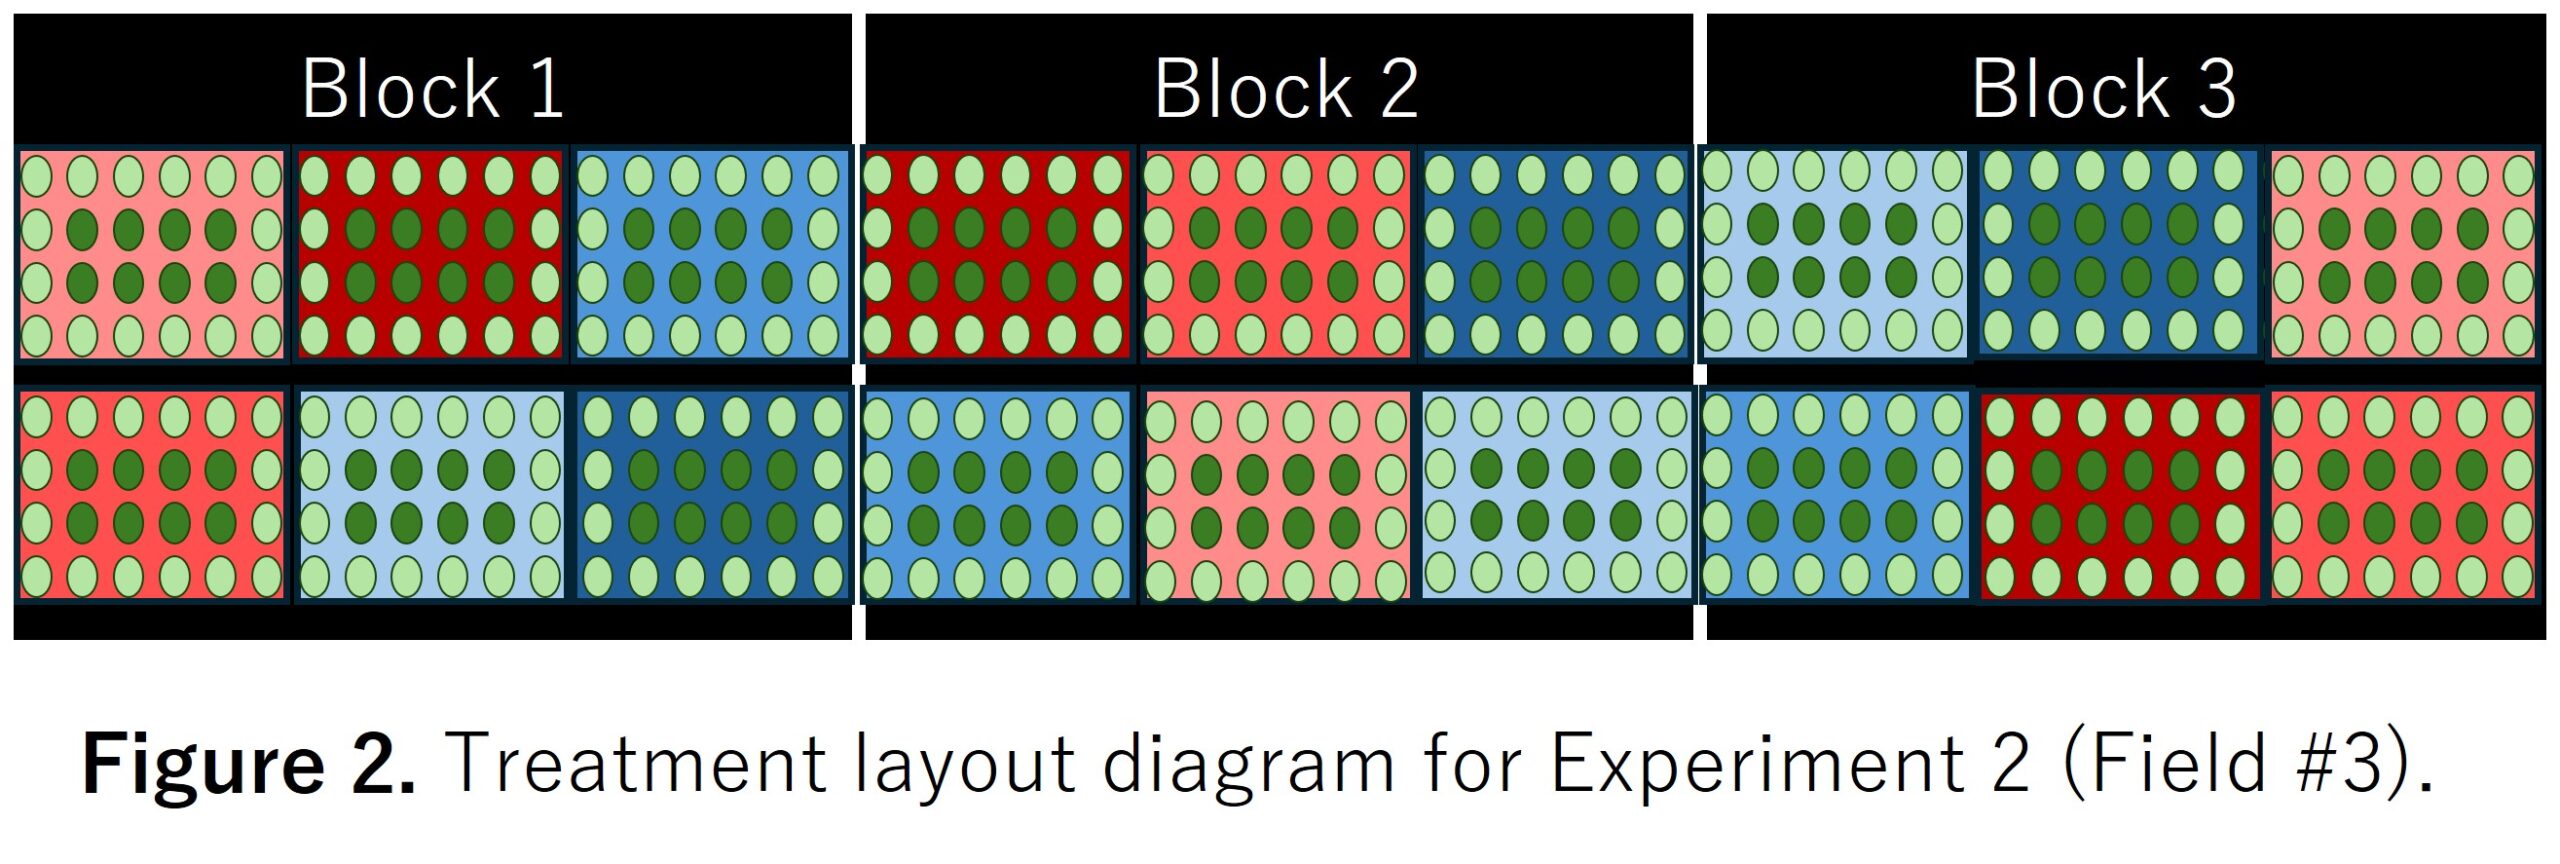
Table 2. Treatment calculations for each treatment unit for Experiment 2.
|
Treatment |
150 lb N/A/yr |
250 lb N/A/yr |
350 lb N/A/yr |
|
UAS (N-P-K 33-0-0) |
121.8 g |
203 g |
284.2 g |
|
Blood meal (N-P-K 13-0-0) |
309.2 g |
515.5 g |
721.5 g |
Fertilizer application dates: For both experiments, fertilizers are applied every 40 days, starting from March 2023.
2023 Applications (7):
1st application, March 19, 2023 (d1)
2nd application, April 28, 2023 (d40)
3rd application, June 1st, 2023 (d74)
4th application, July 20, 2023 (d123)
5th application, August 30, 2023 (d164)
6th application, October 8, 2023 (d203)
7th application, November 17, 2023 (d243)
2024 applications (6): The 1st application was started late due to cold spring temperatures.
1st application: April 24, 2024 (day1). Half rate was applied to field #2 due to high tissue content of S from October 2023 tissue analysis.
2nd application: June 4, 2024 (d41). Half rate was applied to field #2.
3rd application: July 16, 2024 (d84).
4th application: August 27, 2024 (d126).
5th application: October 8, 2024 (d168).
6th application: November 19, 2024 (d210).
2025 Applications (5): plants in Field #2 were removed by the farmer in April thus no data were collected from this field. The same treatments were applied to Field #4.
February 19, 2025 – a blanket application of UAS at 350 lbs. N/A/year to all fields (by farm manager).
1st application: March 24, 2025 (d1)
2nd application: May 6, 2025 (d45).
3rd application: June 19, 2025 (d86).
4th application: July 29, 2025 (d129).
5th application: September 10, 2025 (d172).
Data collection:
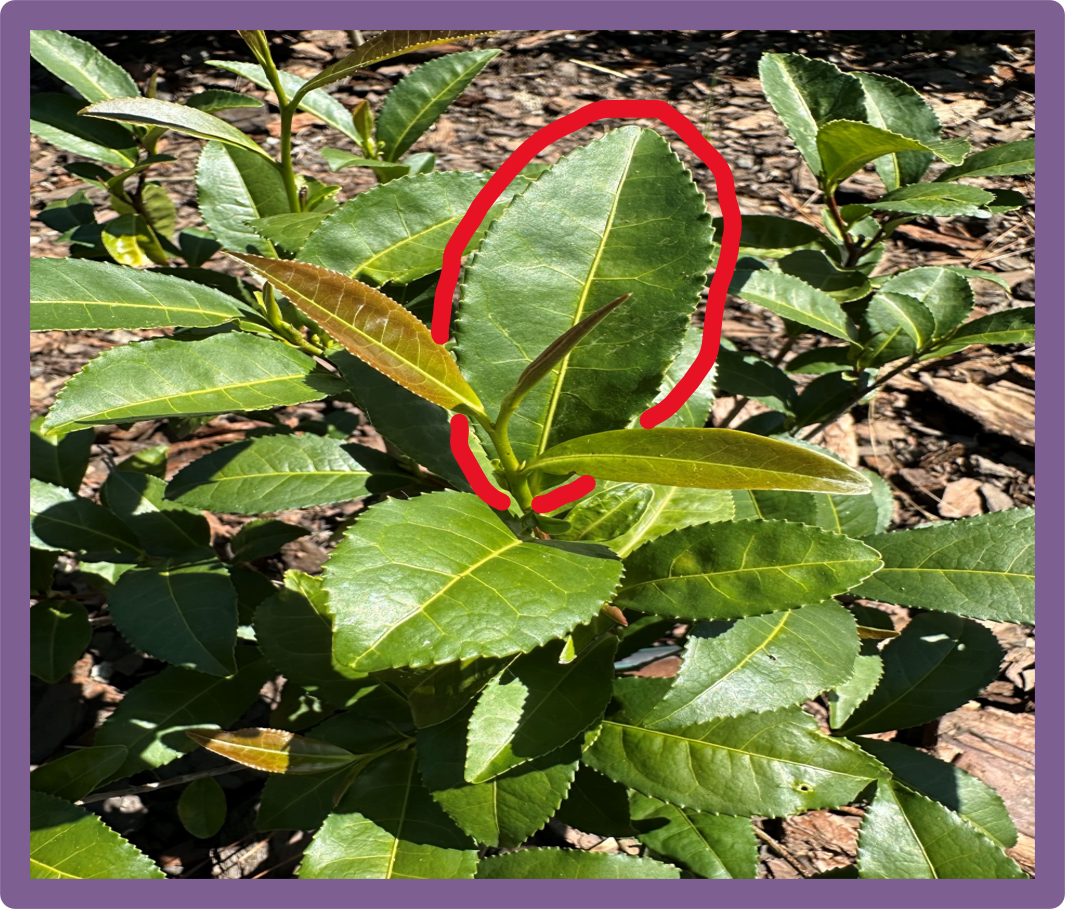
For both experiments, before, during, and by the end of each growing season (February, June, and October, respectively), the youngest fully expanded leaves (YFE, Fig. 3) were plucked from randomly selected plants (8 leaves per plant), and SPAD meter readings were taken right after sampling with one average data collected from eight leaves for each plant.
Leaves were then dried in an oven at 75F until constant weight and ground through 40-mesh sieve for tissue analysis, conducted by the LSU Soil and Plant Tissue Testing Lab. Total N% and C% were determined by LECO CN828. Phosphorus (P), potassium (K), and other essential elements were digested using a Seal Analytics `SmartBlock` then analyzed using SPECTRO ARCOS 3 ICP-OES. About 40 grams of fresh weight of one-bud-one-leaf tender tips were collected from each treatment unit as a mixture of at least 8 plants in August 2025. These samples were withered under 68F for 4 hours and then oven dried at 163F to be processed into a white tea. A small portion of the white tea samples (0.5 g) was used for HPLC analysis to determine caffeine and EGCG concentrations. These two compounds are commonly used health benefiting indicators in tea.
A plant size index (ht x widest width x perpendicular width) was calculated from measurements collected from 4 (Field #2) or 8 (Field #3 and #4) randomly selected sampling plants (Fig 4).
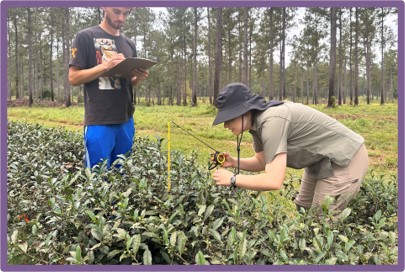
Fig. 4 Plant height and widths were measured to calculate a size index as a measurement for plant growth response to fertilizer treatments.
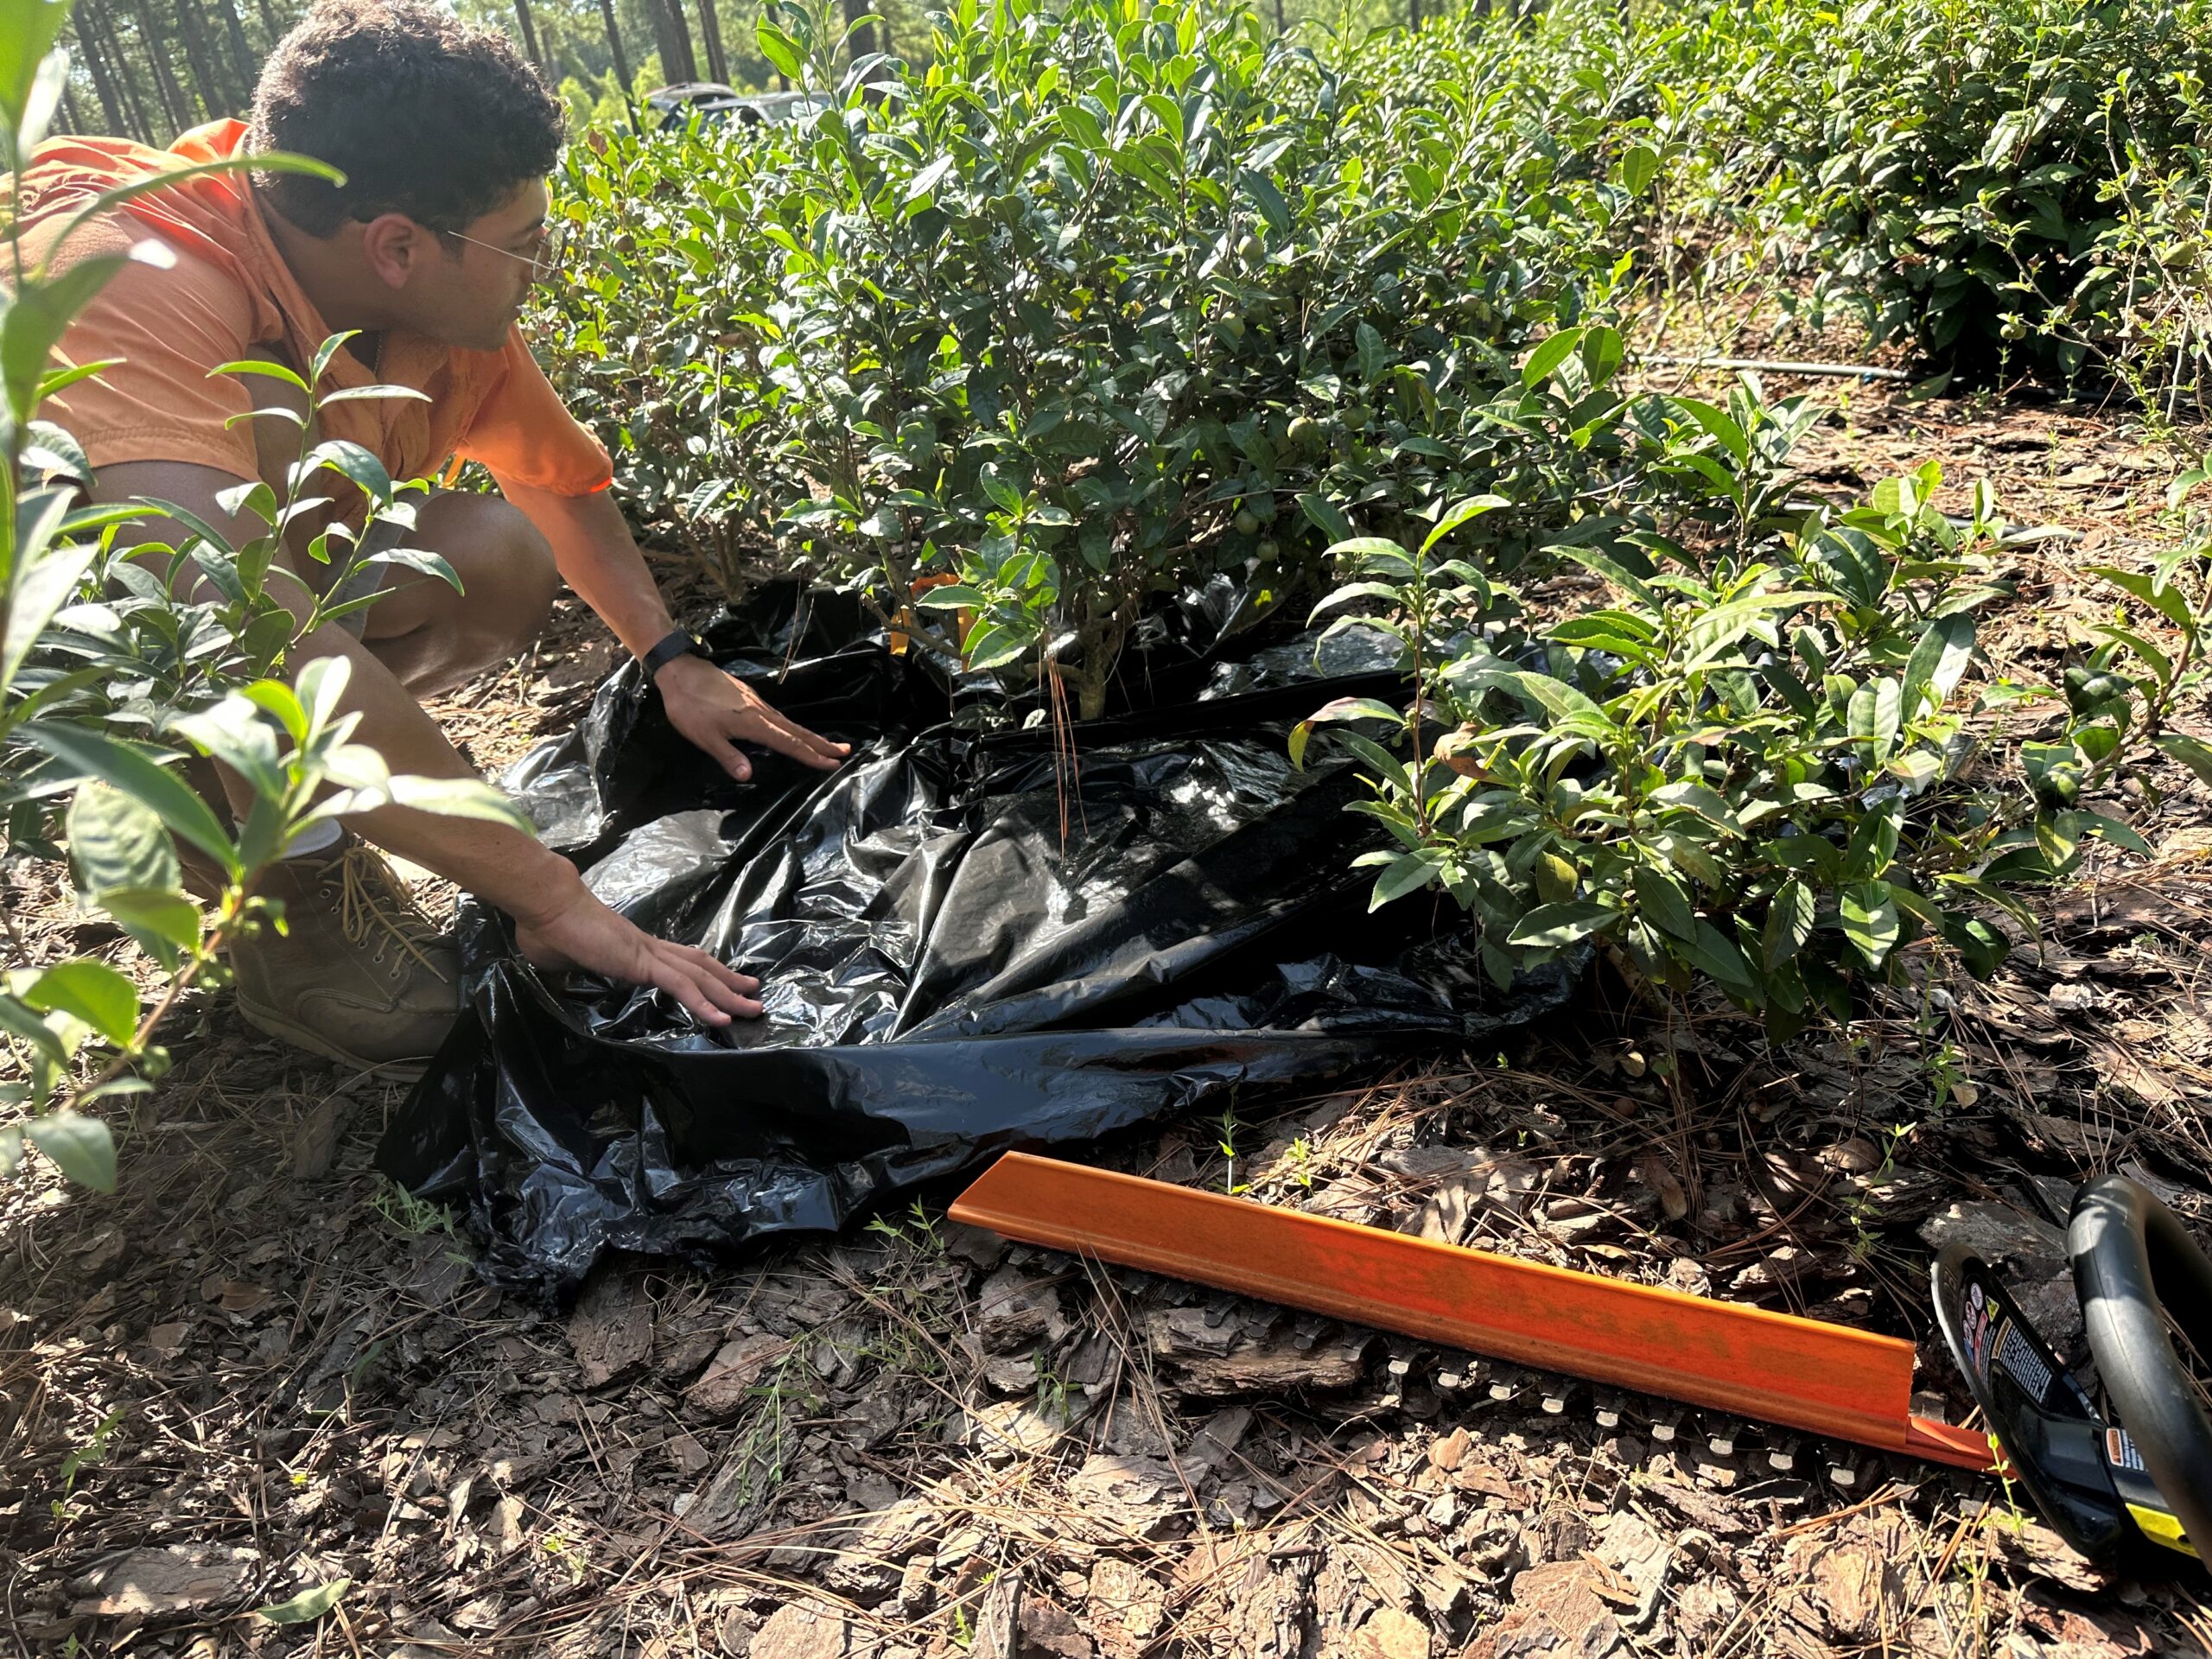
Soil samples were collected at two depth, a 6-inch deep soil core was collected for soil pH and EC analysis, and a 3-inch soil core was collected next to the 6-inch sampling location for the FAME (fatty acid methyl ester) analysis. Three soil samples were collected from each plot and each of these samples contained a soil core from the northern side and another from the southern side of a selected plant. A combined soil sample for each experimental unit contained six soil cores and was homogenized in the lab before further analysis. The 6-inch depth samples were used for pH analysis, which was carried out by the 1:1 soil:water (v/v) methos using a hand-held pH and EC meter. The 3-inch soil samples were prepared for FAME analysis, which helps determine microbial community composition.
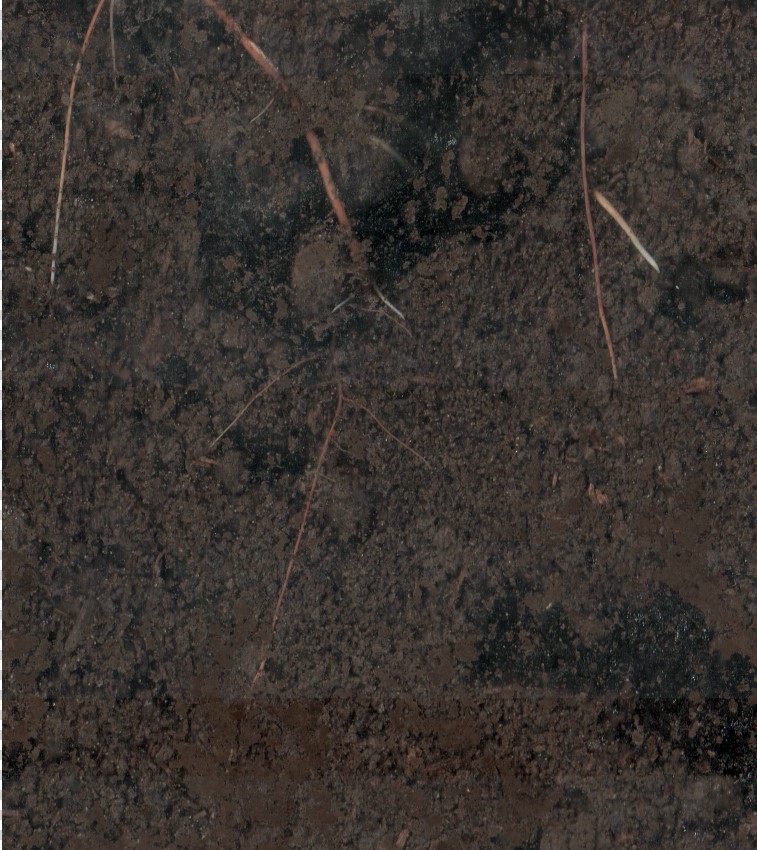
Images obtained by the root scanner from young plants in Field #4 (Fig 5) were compared for number of hair roots (tips) and their total length using WinRhizo software.
All data were analyzed using PROC MIXED for ANOVA (SAS 9.4) and LSMEANS were compared by standard errors.
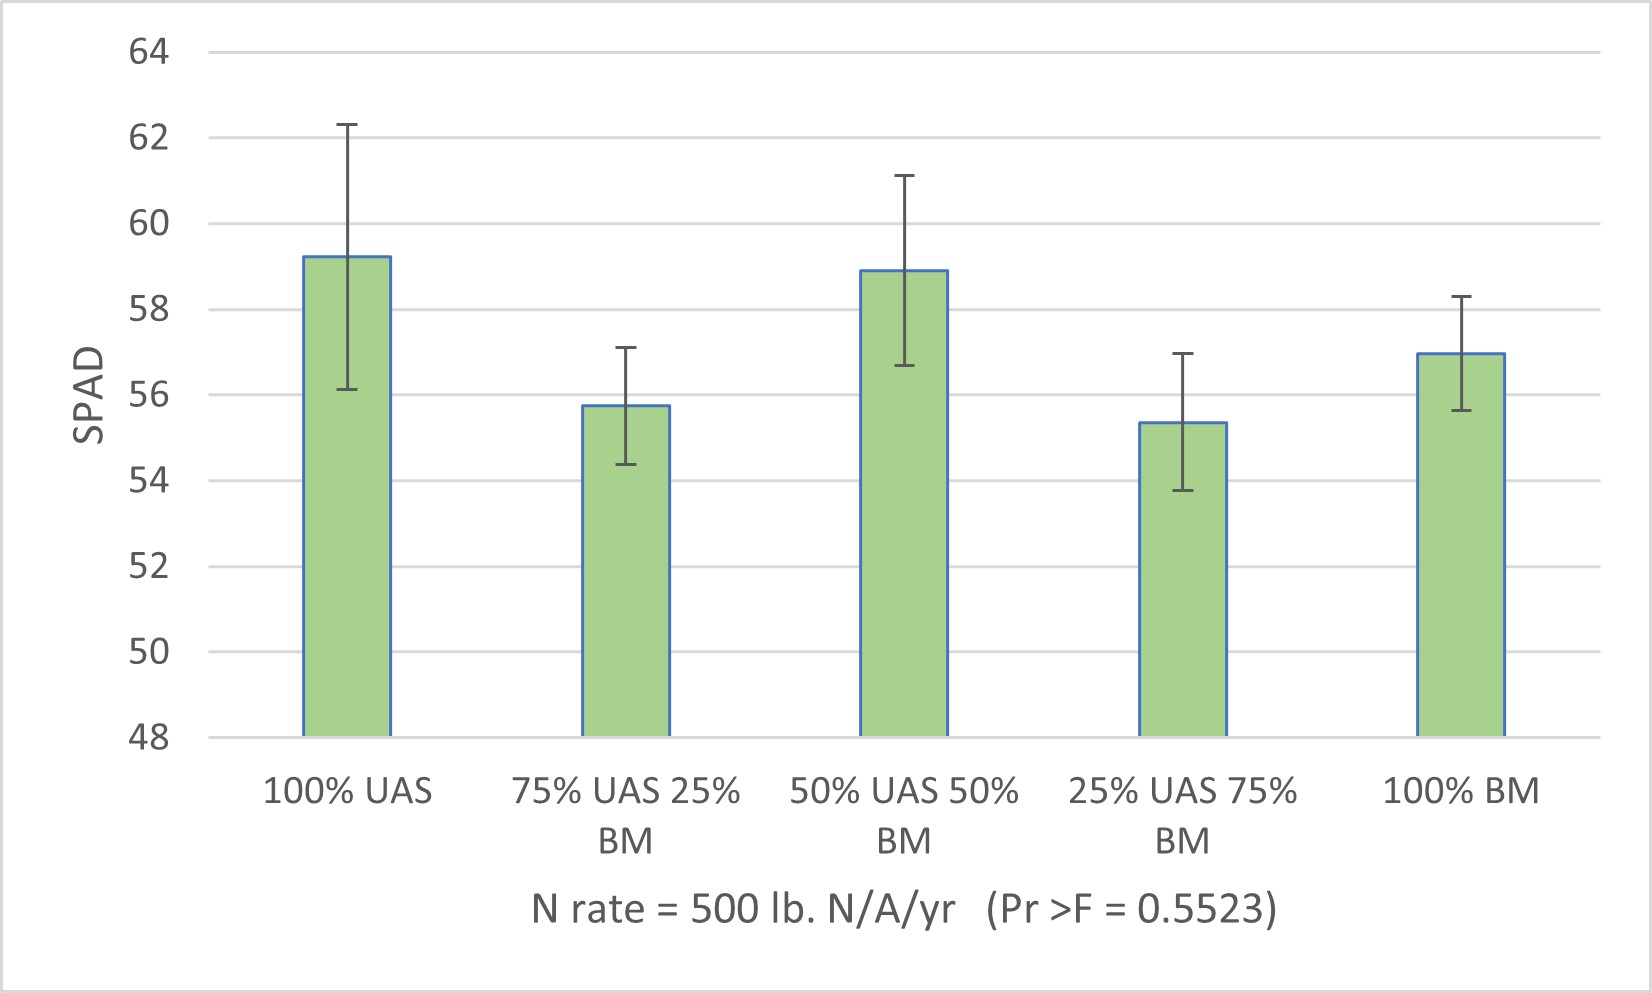
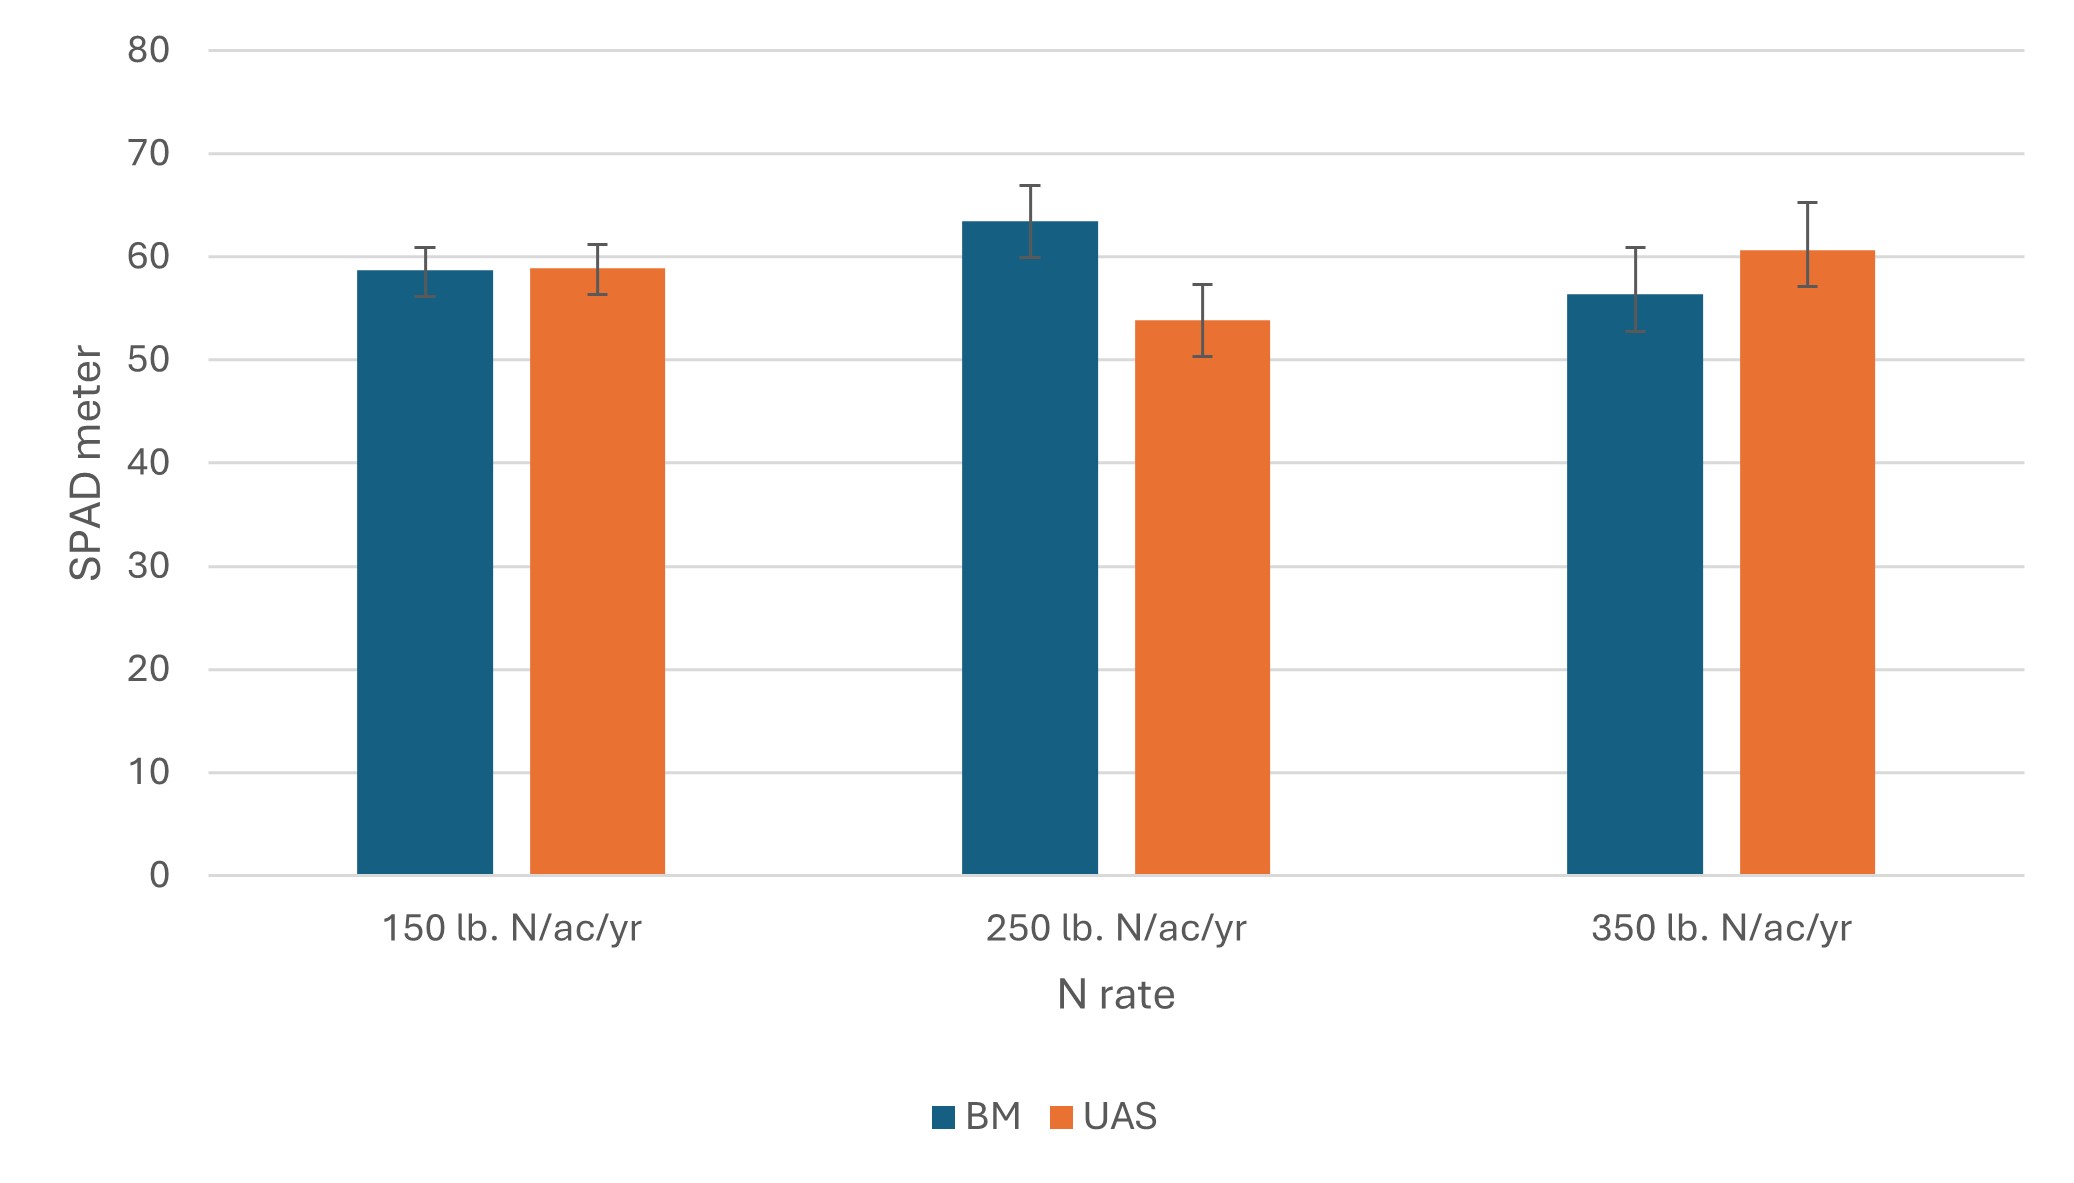
SPAD meter readings and leaf N status: Leaf greenness, as measured by SPAD meter readings, may correlate to leaf tissue N status and be used as an indicator to guide fertilization practices on farm. The SPAD meter readings collected from Expt. 1 (N replacement study) did not show significant treatment effect during the 2023 growing season and showed a marginal treatment effect in June 2024 (Fig 6), which was after nine cumulative applications of the fertilizer treatments since March 2023. All SPAD readings across treatments were above 50 and no N deficiency was observed in any treatment plots. Because all plants in Field #2 were removed in spring 2025, we did not collect more data in 2025 growing season. For Expt. 2 (the N rate study), plants fertilized with blood meal (the organic N source) generally resulted in similar SPAD readings across all three N rates in 2023 and 2024 growing seasons. In one case with measurements taken in August 2025, the SPAD readings of the plants treated with blood meal at 250 lb. N/A/year resulted in higher SPAD readings than plants treated with UAS at the same rate, where the two fertilizers resulted in similar SPAD readings at lower (150 lb. N/A/year) and higher (350 lb. N/A/year) rates (Fig 7). Comparing pooled data for all SPAD measurements throughout the three growing seasons, results indicated that all fertilizer treatments resulted in sufficient N supplies and there were no deficiencies with any of the treatments.
Plant leaf tissue nutrients analyses were conducted at the end of each growing season to compare treatment effects on plant nutrient status and guide the fertilization program in the following growing season. Although we received results for all essential nutrient elements, it is more important to focus the discussion on tissue N%, P, K, Ca, and Mg that are critical for plant health, and on S, Al, Zn, and Cu which were reported as elements that impact tea sensory quality (tastes). For Expt. 1, tissue analysis results indicated that, among the five fertilizer programs, in an increasing percentage of blood meals (as a replacement of synthetic UAS while providing the same total amount of N), N, S, and Zn were significantly different by end of 2023 growing season, with tissue N% levels in all treatments provided sufficient N fertilizer, while plants treated with 100% blood meal had higher tissue N% compared with 100% UAS (Table 3). A similar trend was observed with N and P at the end of 2024 growing season. The results on K, Ca, and Mg were mixed and there were no significant trends from year to year. Sulfur content in leaves affect the taste of tea and often give the tea liquor a ‘sulfurous’ taste that is undesirable. A more ‘balanced’ taste requires S to be less than 2000 ppm in un-processed leaves. Therefore, the ranges observed in our samples were too high and application rate for 2024 were adjusted (half rates) for the first two applications of that season. Zinc (Zn) also significantly affects how a tea tastes and higher zinc levels are positively correlated with increased levels of total amino acids (which contribute to a savory/umami taste), caffeine, and certain catechins (such as trihydroxycatechins) that improve the overall quality and taste of the tea. Preferred leaf tissue Zn content is in the range of 20 to 25 ppm, and as shown in Table 3, plants fertilized with blood meal resulted in higher zinc content than the 100% UAS. Therefore, although blood meal does not contain more Zn than UAS, it may have enhanced the bioavailability of Zn in soil to plant uptake.
Table 3. Plant leaf tissue N concentration (%), and sulfur and zinc concentrations (ppm) were significantly impacted by treatments in Expt. 1 (N replacement study).
|
Treatment |
N (%) |
S (ppm) |
Zn (ppm) |
|
100% UAS |
3.82 b |
2477.9 b |
14.6 b |
|
75% UAS + 25% BM |
4.15 ab |
2710.6 ab |
18.3 a |
|
50% UAS + 50% BM |
4.15 ab |
2592.7 b |
18.5 a |
|
25% UAS + 75% BM |
4.20 a |
2641.0 b |
19.9 a |
|
100% Blood Meal |
4.38 a |
2866.7 a |
18.1 a |
For experiment 2, although we observed some difference in leaf greenness (SPAD) measurement which often indicates different tissue N contents, surprisingly, there is no significant difference in tissue N% among the three N rates and comparing the blood meal to UAS. All treatments resulted in tissue N% ranging from 3.4% to 3.7% at the end of 2023 growing season, from 3.3% to 3.6% at the end of 2024, and 2.8% to 3.1% in August 2025, indicating a significant difference from year to year. Results from other essential elements indicate that leaf tissue sulfur (S, %) and iron (Fe, ppm) were significantly higher in plants treated with UAS than those treated with blood meal across treatment rates (Table 4 and 5).
Table 4. Leaf tissue sulfur (S) content (%) in samples collected in August 2024 from Expt. 2 (N rate study).
|
Rate (lb. N ac-1 yr-1 |
150 |
250 |
350 |
|
Blood Meal |
0.19 b |
0.18 b |
0.18 b |
|
UAS |
0.21 a |
0.21 a |
0.20 a |
Table 5. Leaf tissue iron (Fe) content (ppm) in samples collected in August 2025 from Expt. 2 (N rate study).
|
Rate (lb. N ac-1 yr-1 |
150 |
250 |
350 |
|
Blood Meal |
335.7 b |
610.3 b |
480.9 b |
|
UAS |
847.9 a |
776.9 a |
1214.8 a |
Plant growth responses were measured as plant size index during the year 2023 and 2024, and an additional measurement – weight of trimmings from 8 plants were collected for all treatments in Field #3 and #4 at the end of the 2025 growing season. We conducted this additional measurement because tea plants are trimmed at least three times during each of the first four years after being transplanted into the field. The purpose of these frequent trimmings is to encourage branching. Each trimming results in 3 or more stems from each of the original stems, resulting in exponentially a greater number of stems. The establishment of fuller and more productive plant architecture by year five is often call “tea plant training” by growers and the resulting plant canopy for commercial harvest is called a “plucking table”. Because of this trimming practice, we were only able to measure a field of plants that are constantly being trimmed to the same heights, thus our plant size measurements did not reflect the actual growth of the plant, and we switched to measure the weight of trimmings in August 2025 to see if we could find any treatment effects on plant growth (Fig 8). However, for both Field #3 (Expt. 2, N rate study) and Field #4 (Expt. 1 N replacement study), we did not find any differences in the weights of trimmings.
White tea sample HPLC analysis. We evaluated caffeine and EGCG content in white tea samples processed from tender tips harvested from Field #3 and #4 in August 2025. No significant effect was found from Field #4. This field was established in fall 2024 and used to repeat Expt. 1 (N replacement study) because the Field #2 ‘Brew-Tea-Ful’ plants treated under the original Expt. 1 were removed from the field. The newly established ‘Georgian Tea’ plants were about 6-month-old when treatments began in March 2025 and received five treatment applications by the time of sampling. The non-significant results may be due to the similar total N received by the plants, or, if the N source does influence these compounds regardless of rate, the treatment period may not have been long enough to reflect any impact.
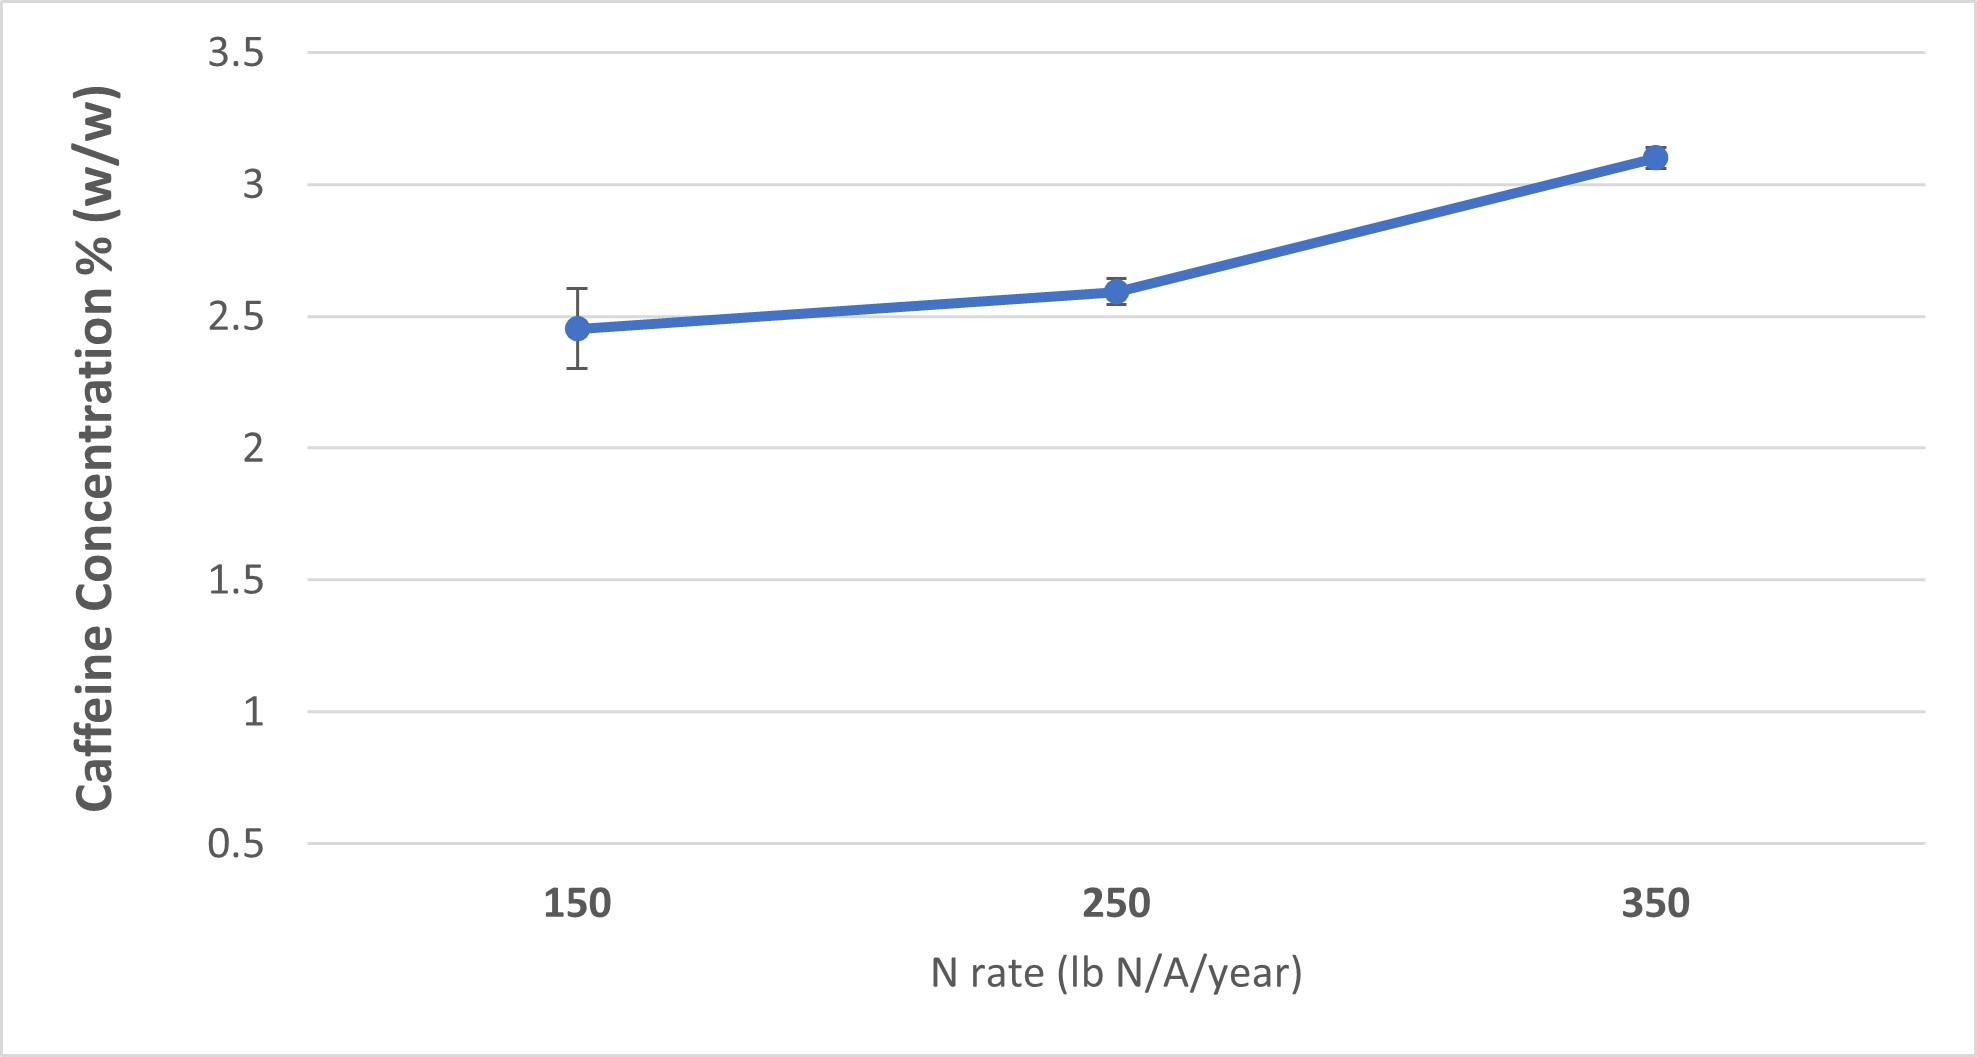
Effects of N rate on caffeine content was significant in Expt. 2 across N sources. The plants treated with 350 lbs. N/A/year results in higher N than those fertilized with 150 and 250 lbs. N/A/year treatment, while there was no difference between the two lower rates (Fig. 9). This result was consistent across N source. This was expected since N rate has been reported to significantly affect caffeine contents in previous research reports.
Results from EGCG analysis were inconsistent with caffeine, and there were no significant differences among treatments in both experiments except that, interaction between N source (UAS or blood meal) and rate was significant for Expt. 2. However, no meaningful interpretations can be made from this interaction.
How N source and rate affect soil pH and EC. We measured soil pH and EC at the end of each growing season for all three years, with the exception for Field #2 in 2025. No significant results were found from 2023 data for Field #2 and #3, and from 2025 data from Field #4 samples. We did find that blood meal elevated soil pH in the N replacement study (Expt. 1) in June 2024 in Field #2 (Table 6). This field had an initial pH of 5.3 at the beginning of the study in February 2023. Compared to any treatments containing UAS, the sole blood meal treatment resulted in a pH of 5.4, higher than all others. This indicates that blood meal does not have the adverse effect urea or ammonium sulfate would impose on soil acidification, both of which will gradually reduce soil pH over time and can eventually result in soil degradation due to significant loss in soil physical structure and microbial community. Similar results were found in Expt. 2 in May 2025 where soil pH in plots fertilized with blood meal at 150 lbs. N/A/year was higher than the plots fertilized with UAS (Table 7). The seeming was a similar trend at higher rates.
Electrical conductivity (EC) represents fertilizer residual in the soil and is highly inconsistent among sample years, indicating its wide range of fluctuations affected by rainfall and temperatures. The data collected in May 2025 from Expt. 2 indicated that EC were higher in plots fertilized with the blood meal, while no such results were found from Expt. 1 in 2024, both 100% UAS and blood meal had EC in the 230 to 240 µS/cm range.
Table 6. Soil pH and EC values of soil samples collected in June 2024 from Expt. 1 (N replacement study).
|
Expt. 1. N replacement study |
pH |
EC (µS/cm) |
|
100% Urea Ammonium Sulfate (UAS) |
4.5 b |
241 |
|
75% UAS + 25% BM |
4.5 b |
220 |
|
50% UAS + 50% BM |
4.5 b |
237 |
|
25% UAS + 75% BM |
4.7 b |
298 |
|
100% blood meal (BM) |
5.4 a |
230 |
Table 7. Soil pH and EC values of soil samples collected in May 2025 from Expt. 2 (N rate study).
|
Expt. 2. N rate study |
pH |
EC (µS/cm) |
||||
|
Rate (lb. N/A/year) |
150 |
250 |
350 |
150 |
250 |
350 |
|
Blood Meal |
5.27 a |
4.76 |
4.95 |
195.7 a |
185.7 a |
203.1 a |
|
UAS |
4.73 b |
4.64 |
4.71 |
141.0 b |
160.4 b |
169.7 b |
FAME (fatty acid methyl ester analysis) results. FAME was conducted with 3-inch-deep soil cores collected in June 2025 for soil microbial community composition analysis. Results for most of the samples indicated a heavy domination of bacterial fatty acids, especially gram-negative bacteria [16:1ω7c (FAME wt 240.4) and 18:1ω7c (FAME wt 296.5). A characteristic of this group, Cyclopropane fatty acids (cy17:0) were present in 85% of the samples. Gram-positive bacteria were present but less dominant [i15:0 (228.3) and a15:0 (228.3)]. In addition, actinobacteria indicated by the presence of 10-methyl branched fatty acids [10-methyl 17:0 (299.5) and 10-methyl 18:0 (312.5)] were also noted in many samples. Relatively low and few fungal biomarkers [i.e., 18:2ω6,9c (FAME wt 294.4)] were found thus fungal presence was low compared to the major bacterial peaks. A specific analysis of treatment effects was not performed due to the largely similar qualitative results. It appears that most treatment units contain healthy diverse microbial communities. Although treatment effects on soil pH were significant, their effects on microbial species abundance were insignificant within the time of this project.
Root Imager scanned image observations. Towards later half of 2024, when Field #4 was in the planning stage, we obtained the root imager and installed it into the field in spring 2025 at 6 months after transplanting. Over the 2025 growing season, we collected root images from 5 selected plants, each from one of the five N treatments (from 100% UAS, changing to 100% blood meal). Scanned images (Fig 9) were analyzed using the WinRhizo software. Because of the limited number of observations, although number of root tips increased over time, we did not observe any visual differences among the five plants, and the data collected did not support a statistical analysis. This was the first use of the instrument, and we learned that it could collect clear and measurable images. However, meaningful data collection would require the installation of large number of clear tubes which may not be practical in a commercial production field where machinery (in this case, mowers and harvesters) are moving frequently.
Educational & Outreach Activities
Participation summary:
- Consultations: PI has been contacted by local tea growers (5 in Louisiana) and tea growers from the western and southeaster regions regarding field production practices, processing technologies and various topics related to commercial tea production. Information on sustainable soil health management generated from this project was delivered together with other interesting topics. Consultations were provided through farm visits, phone calls, and emails.
- Curricula, factsheets or educational tools: a series of factsheets on commercial tea production covering basic and advanced knowledge and updates are being developed by PI, two extension agents, and a communication specialist. In addition, two production guidelines, one for commercial tea production, and one for home and community tea projects are being developed. The guidelines and factsheets will be posted to the tea research website at https://www.lsuagcenter.com/portals/our_offices/departments/spess/medicinal-plants/tea-research-and-extension.
- Journal articles: one journal article on tea chemistry was published in 2024 because of a literature review study. Tea Quality: An Overview of the Analytical Methods and Sensory Analyses Used in the Most Recent Studies. (https://doi.org/10.3390/foods13223580)
- On-farm demonstrations: four demonstrations of production practices, especially fertility management, were conducted to visiting growers from TX, MS, GA, and CA during this project.
- Published press articles, newsletters: multiple news releases, associated press releases, and newsletters on Louisiana and US specialty tea industry were published during this project.
- Tours: multiple tours were conducted to professional conferences attendees and Master Gardener groups during this project.
- Webinars, talks and presentations: research results were shared with academia communities at the ASHS and southern region ASHS conferences, and at multiple growers meetings and webinars. Examples included the Southwest Louisiana Garden Expo, and the Les Reeves Series Lectures by SFA Gardens. A diverse audience was reached by these activities, including farmers, extension county agents, prospective tea growers, homeowners and the public.
- Workshop / field days: we presented findings from this project at two LSU AgCenter Hammond Research Station Field Day in 2024 and 2025, respectively, one on the fertility management, one on the use of a selective harvester.
Learning Outcomes
Economic considerations for long term soil health management
Soil pH and EC management and the circle of healthy plant, soil, and soil microbial community
Nutrient requirements of tea plants and the relationship between fertilization, yield, and quality of final products
Impact of synthetic fertilizer on soil health
Relationship between N fertilizer sources and soil health
Project Outcomes
We have not submitted additional proposals but are working with a regional research team in developing future submissions to the USDA specialty crop research initiative program.
Recommendations for sustainable agricultural production and future research:
Nitrogen fertilizer application rates ranging from 150 to 350 lbs. N/A/year resulted in similar plant growth as indicated by size index and trimming weights, and sufficient tissue N% and SPAD meter readings indicated that this range of N rate will not result in any nutrient deficiencies. However, however we would like to advise growers that total yield (weight of harvestable tender shoots) was not assessed in this project because the plants were still too young to be commercially harvested. The farm will continue the application of blood meal in one of the four fields and will be documenting commercial yield in 2027. A more conclusive statement on the long-term effects of these increasing N rates will be made by then.
Comparing the two N sources, organic (blood meal) vs. synthetic (UAS), the organic source provided the benefit of maintaining (not lowering) soil pH, with mixed results on soil EC, potentially longer lasting supplies of N (Table s), higher levels of Zn (desirable) but also higher levels of S (undesirable). Growers would need to monitor the undesirable elements in order to gain from the benefits of organic fertilizers. Cost considerations were communicated at outreach events, including price comparison of generally available synthetic and organic fertilizers, with the later in comparable or slightly more expensive range when purchased in bulk.
Because none of the deficient or excessive fertilizer rates were used in this on-farm research project, we were not able to generate results with extremes. However, we plan to conduct a similar research study at the Hammond Research Station to demonstrate adverse effects of accumulated P and S, and high EC levels from excessively high fertility values. We will likely use the root imaging system with adequate replications at the research station site to further study the effects of N source and rate on root development and growth.
In conclusion, proper N rate and source is a key factor in nutrient management for tea production and has long-term effects on soil health, yield, and tea quality. This study established that nitrogen rates from 150 to 350 lbs. N/A/year are sufficient to growth young tea plants, where applications of the lower rates can be the most economical by reducing input costs, but future changes in yield still need to be evaluated.
- We have used the on-farm research site to showcase tea research for several national and regional horticultural society groups, including the national America Society for Horticultural Science (ASHS) group (45 participants) and the state-wide leadership class comprised of rising extension agents and leading green industry stakeholders. Several participants from these groups contacted PI for additional information on tea production and potential collaborations in both research and agent training within the frame of sustainable specialty crop production. Two agents serving the St. Tammany and New Orleans areas have signed up for writing training materials and collaborating on research proposals.
- Multiple tea educational events designed for gardening clubs and Master Gardeners were held on site to promote Louisiana-grown tea. These educational events raised public awareness of tea production and research in Louisiana and increased research project exposure to general public and presented specialty growers that may benefit from increased agri-tourism opportunities in the near future.
- PI and students presented research updates and discussed findings from this project with participants at two annual horticultural field days (2024 and 2025) at the LSU AgCenter Hammond Research Station. These activities increased communications of research findings with specialty crop stakeholders, increased awareness on sustainable soil fertility management in general and provided training opportunities to undergraduate and graduate students.
- My research lab provided three tea tasting classes to LSU general horticulture classes in 2024 and 2025, reaching >100 college students in agricultural majors. Part of these classes focuses on the importance of long term soil health for a perennial crop such as tea.