Final Report for OW12-008
Project Information
Water conservation in Sonoma County grape production is especially important because threatened or endangered salmonids are found in the Russian River watershed and may be deemed vulnerable. Growers must use water wisely when frost protecting and irrigating vines in order to maintain grape production while minimizing impacts on the stream flows that are critical to salmonid survival. This project was designed to provide growers with information on alternatives to frost protection using overhead sprinklers, on irrigation managements strategies to reduce water use, and on Best Management Practices for water conservation when frost protecting and irrigating grape vines.
This project had three components: 1) An evaluation of spray products on grapevines to evaluate their effectiveness in protecting against frost damage; 2) irrigation demonstrations in different soil types where irrigation scheduling and duration were determined based upon soil and plant water status measurements; and 3) grower outreach to provide Best Management Practices (BMPs) for water conservation when frost protecting and irrigating grape vines.
We conducted a trial in 2013 to evaluate frost protection spray products. A site was selected in which spring frosts had occurred on one or more days each year for the previous 19 years. Materials were provided by agricultural product retailers that are commonly requested by growers or which had been recently introduced to the market for this purpose. Unfortunately, in 2013 post bud break temperatures at the trial site remained above the critical temperature (32 °F), therefore green tissue damage of leaf blades, shoots and flower clusters did not occur. No data were collected and the efficacy of the products could not be evaluated.
We demonstrated a water management technique for drip irrigation that relies on measurements, both of soil moisture and plant moisture status. The above and below ground measurements provide an excellent picture of the moisture dynamics of the vineyard. This gives us the confidence to push our vines further into levels of controlled stress that have benefits well beyond that of water conservation. It also allows us to produce riper fruit at lower brix (data not collected but observed at many sites in the North Coast), while preventing excessive stress that could lead to reduced vineyard productivity and lower yields.
The irrigation management procedure is thus:
Observe shoot tips and plant water status measurements to delay the first irrigation events for the growing season.
Attain the target leaf water potential and stomatal conductance at or before two weeks prior to veraison and maintain those through veraison.
Use soil moisture profile data to determine active root uptake zones and depth of irrigation percolation.
Use average soil moisture in the profile to determine the duration for which moisture is returned to levels prior to each irrigation – this is the proper irrigation interval for non-deficit or surplus irrigation.
Mild water stress levels will reduce the need for irrigation, and we typically find irrigating at 18-24% of crop evapotranspiration (ET) is sufficient to maintain the canopy and crop (under mild stress conditions). Irrigation may be increased closer to harvest without negative consequences, as long as irrigation is not excessive.
Introduction
Despite naturally high levels of winter rainfall in typical years, water is a scarce resource in Sonoma County, and competition from various interests (agricultural, municipal and environmental) has increasingly become contentious. The use of water for frost protection and seasonal irrigation specifically in vineyards has come under scrutiny by California's State Water Resources Control Board (SWRCB) and the National Marine Fisheries. Either or both of these agencies could limit the use of water for frost protection of grapes in the Russian River watershed during the critical frost season.
There are almost 60,000 acres of vineyards in Sonoma County. Coho salmon in the county are listed as "endangered" under the federal Endangered Species Act (ESA). Chinook salmon and steelhead also found in the county are listed as "threatened" under the ESA. The use of water to protect grapevines from spring frosts poses risks to these species due to the instantaneous demand for water during frost events, and alleged fish takes due to stranding have occurred in association with frost events. Low flows in surface waterways pose additional risk to salmonids during summer months when there is no rainfall, yet the vines require water to irrigate.
In order to preserve grape growing in Sonoma County and protect threatened and endangered salmonids, growers need to improve water use efficiency for both frost protection and irrigation. Currently, many growers measure only ambient temperature to determine when to activate frost protection; however, knowledge of the dew point is also required to accurately determine the risk of frost damage. Growers typically use an elevated temperature threshold (35-36 degrees, for example) to trigger frost protection as a conservative approach to timing frost protection. Unfortunately, that approach often leads to unneeded or premature activation of overhead sprinkler systems and unnecessary use of water. This Western SARE funded project conducted outreach to growers via multiple methods and provided guidance for optimal decision-making for frost protection operation.
Frost protection by applications of agricultural crop sprays has been suggested as alternatives to frost water application by the SWRCB. Antibacterial sprays, often containing copper, have been shown in some crops (not grapes) to reduce the population of ice nucleating bacteria on plant surfaces, thus reducing intercellular ice formation inside the plant and subsequent tissue damage. This project attempted to conduct an objective evaluation of selected materials in a producer's vineyard that does not use overhead sprinklers for frost protection. The goal was to determine the efficacy of these materials, especially materials that do not contain copper, in order to reduce copper use in the watershed. Salmonid species are very sensitive to copper in streams and, thus, reductions in copper use can benefit salmonids. Although materials were applied each spring, there were no frost events in the project’s vineyards. This is an area for future research.
Irrigation is another major use of water by the wine grape growers of the region. It is believed that growers, though intending to be good stewards, continue to irrigate prematurely each year and may irrigate in an inefficient manner. New technologies for measuring soil and plant moisture status are available to guide more efficient irrigation. We believed, from previously executed surveys and field demonstrations, that many growers could collectively conserve 30% or more of the applied irrigation water and maintain economic yields, all the while improving wine quality.
For this project, we measured soil and plant moisture status at vineyard sites to enable grower exposure to these technologies. The project worked with a grower to fine-tune irrigation based on soil and plant water status data, vine observations and overall strategies for winegrape production. The sites were selected to represent variations of soil characteristics. Results from the demonstrations were communicated to growers through workshops and field days, newsletter articles and on the Commission website www.sonomawinegrape.org.
Sonoma County grape growers have traditionally, and enthusiastically, participated in grower educational events and programs to improve their production practices. Changes in practices have been documented for pesticide use, for example. Thus, improved management practices identified in these demonstrations are likely to result in improved efficiencies in water use for both frost protection and irrigation. The results from this project have been especially timely given the severe 2014 drought conditions in Sonoma County.
Frost Protection:
- Explore alternative methods to overhead sprinkler frost protection: demonstrate the efficacy, if any, of applied frost protection materials such as antitranspirants and copper fungicides/bactericides in a Sonoma County vineyard. Spring 2013.
- Improve the utilization of a relatively new network of weather stations to measure temperature and dew point at key locations across the county. Real-time weather data from a nearby weather station can be accessed by growers at no charge to determine when frost protection systems are needed. The system provides email or text message alarms to be set to alert growers of frost risk. In this manner, frost risks and frost water application initiation and termination can be improved and water saved. Spring 2012 and 2013. (In spring 2014, a minor Western SARE project budget revision was approved, which allowed for the purchase of a new datalogger for the Kenwood area weather station. This weather station is located in the coldest area of Kenwood, which is located in northern Sonoma Valley. This new datalogger replaced an outdated piece of equipment, which provided system information every fifteen minutes and with questionable accuracy. The new datalogger reports weather data in real-time to accurately predict frost event temperatures critical to the timing of turning on and turning off water for frost protection. This new technology also has the ability to accomodate the utilization of soil moisture probes.)
- In addition, this project looked to provide education to reduce or avoid false or early triggering of overhead sprinklers and share best management practices for the proper triggering of overhead sprinklers for frost protection to alleviate overuse during frost episodes. Spring 2012 and 2013.
Irrigation Management:
- Avoid premature applications of irrigation to vineyards by taking advantage of soil moisture storage from winter and spring precipitation. Delay the initiation of irrigation applications until soil moisture diminishes to the point where irrigation is necessary. Monitor soil moisture, plant moisture status and visual (shoot length and shoot tip) indicators of impending moisture stress to determine the decisions for initiating irrigation. Summer 2012 and 2013.
- Avoid deep percolation of irrigation, water which wastes water and has the potential for groundwater contamination. Demonstrate how to use soil moisture monitoring equipment in Sonoma County vineyards and/or vineyard blocks to determine proper volume of applied to avoid excessively deep water movement. Summer 2012 and 2013.
- Avoid excessive use of irrigation water by adjusting intervals based on need. Demonstrate the use of soil moisture monitoring equipment in Sonoma County vineyards and/or blocks and how it may be used to determine proper intervals between irrigation applications. Summer 2012 and 2013.
- Determine proper site-specific irrigation regimes. Demonstrate different irrigation practices appropriate for representative soil types and conditions in Sonoma County vineyards and/or blocks. Summer 2012 and 2013.
- Demonstrate the benefits and limitations of plant water status measurements under different climatic and soil conditions in Sonoma County vineyards. Summer 2012 through 2013.
- Demonstrate the differences in wine styles arising from different irrigation regimes applied to similar and adjacent vineyard blocks using a collaborator's commercial winery to process fruit from demonstration blocks. Fall 2012 through 2013.
Cooperators
Research
Frost Protection:
The spray trial to evaluate efficacy of chemical frost protectants was located in a Chardonnay vineyard at about 1,600 feet elevation in the Mayacamas Mountains, which form the eastern border of the Sonoma Valley in Sonoma County. The block selected was the site of spring frost damage in previous years, and the rows selected for the trial were located near the bottom of a slope. Four replications of seven treatments were installed in a randomized complete block design. A datalogger was placed inside the trial footprint and recorded temperature at 15 minute intervals. Five products were evaluated, one at two rates. Products consisted of a copper based fungicide and the balance were products that reportedly reduced plant stress (Table 1). Applications were made on five dates by backpack sprayer using label rates at the equivalent of 50 gallons per acre (Table 2).
The first application was made on March 28, 2013, within one week of bud break. Minimum daily temperatures for the week prior to the first application ranged from 33.5 °F to 41.6 °F (Figure 1). The trial was terminated May 9, two weeks after the last application on April 26. Minimum daily temperatures for the two week period prior to May 9 ranged from 42.9 °F to 58.6 °F (Figure 1).
Irrigation Management:
The irrigation demonstration plots included two sites with very different soils: Red Fan vineyard off of Red Winery Road and Landslide Vineyard between Chalk Hill Road and Highway 128. Both sites are in Alexander Valley. The Red Fan site has a heavier, deeper soil, classified as Clear Lake Clay Loam and Cibo Clay. The Landslide vineyard has very gravelly and shallow soils and is classified as a Clough Gravelly Loam. In both sites, we chose two side-by-side blocks, each having the similar characteristics and all with variety Cabernet Sauvignon (see documents 9 and 12 under Results and Discussion/Milestones section). Our plan was to apply different irrigation regimes to each block and to make commercial-scale wines from each block to compare to one another in tastings.
We outfitted each of the four demonstration blocks with soil moisture profile monitors attached to telemetry units for continuous feedback of soil moisture data. We also installed a pressure switch in each irrigation line to monitor when irrigation events occurred. All of that information was available to the public online in real-time. We also made weekly measurements of vine water status (using the pressure chamber and porometer).
Frost Protection:
We conducted a trial in 2013 to evaluate frost protection spray products. A site was selected in which spring frosts had occurred on one or more days each year for the previous 19 years. Materials were provided by agricultural product retailers that are commonly requested by growers or which had been recently introduced to the market for this purpose. Unfortunately, in 2013 post-bud break temperatures at the trial site remained above the critical temperature (32 °F), therefore green tissue damage of leaf blades, shoots and flower clusters did not occur. No data were collected and the efficacy of the products could not be evaluated.
Irrigation Management:
Two very different vineyard sites were selected for the irrigation management demonstrations. The Red Fan Vineyard features fine-textured soils that are fairly uniform in depth. That soil type allows irrigation to percolate deeply because there are no impediments to water movement, such as stratified layers that create dramatic discontinuities in pore size. Contrary to what is commonly believed, water penetrates deeply in these soils, aided by strong matric forces both downward and laterally. Even small irrigations of about four hours will percolate to the bottom of the monitored root system (Fig. 1, bottom). Hence, large irrigation applications would have the negative effect of driving moisture below the root zone. This will not be beneficial because the majority or the root system is above 3’ depth, and it is not necessarily possible to encourage deeper rooting in this location due to the fact that the soil profile is fully moistened by winter rainfall in essentially all years. So, the nominal irrigation chosen for Red Fan was four hours, though we found that the rain-fed moisture was able to sustain the vineyard without irrigation well into the summer.
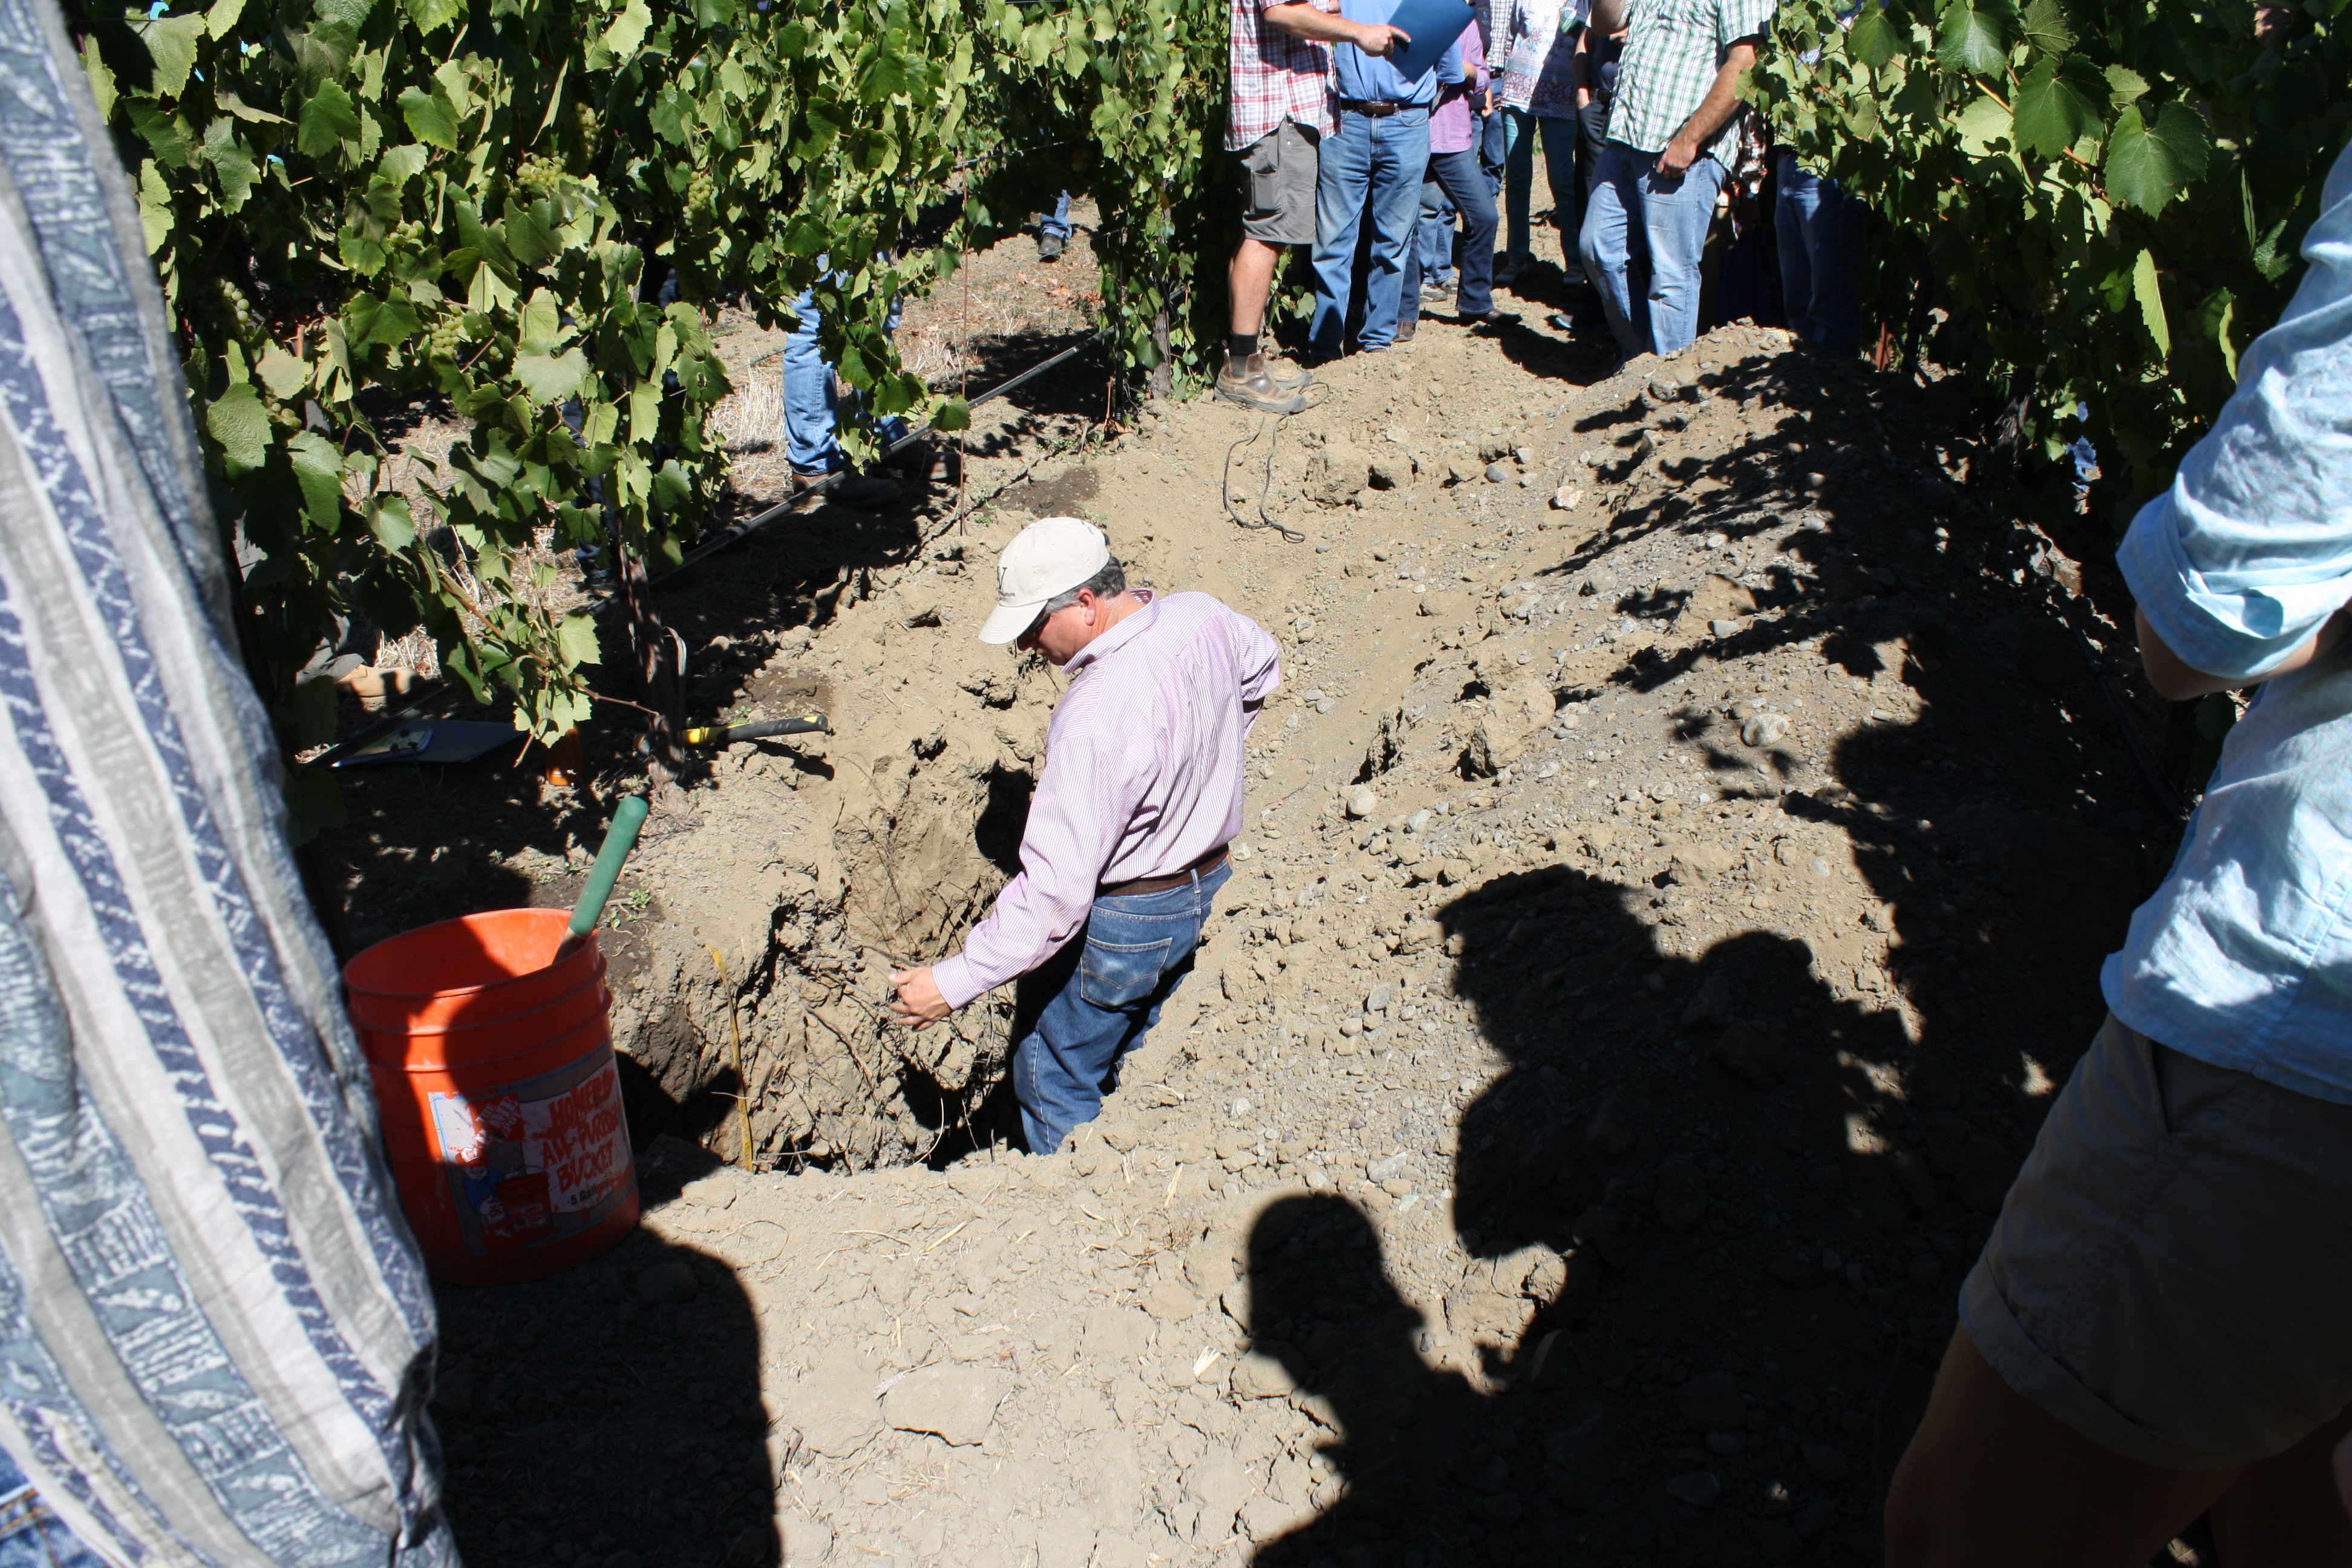
On the contrary, the soils at the Landslide Vineyard feature clay loam soils with high rock content comprised of fractured sandstone and some river cobbles (see Photo 4). Water cannot move through rocks so the drip-irrigated water tends to spread laterally more quickly than it does vertically. Some attempts were made to irrigate with longer irrigations, but we found that the longer irrigations (up to six hours or six gallons/vine) tended to move the wetted zone out laterally and even into the wheel track. We did not sense moisture increases below 16”, and this was confirmed in 2013 by backhoe pits made after an irrigation. So, the irrigation regime chosen for Landslide was short: 2-3 gallon per vine irrigations with 2-3 irrigations made per week. The rain-fed moisture depleted sooner at Landslide than at Red Fan so irrigation commenced earlier.
The general water management strategy was to wait until the vines slowed down their growth and reached desired levels of plant moisture status. The target level of stress was fairly conservative in 2012 (-12 bars), though in 2013 we had one year of experience and modified the targets. For Red Fan, we used -12 bars for Block 830 and -14 bars at Block 860 as a trigger for irrigation. For Landslide, we used -12 to -13 bars in Block 14 and -14 to -15 bars as a trigger for Block 15.
Waiting to irrigate until absolutely necessary is beneficial in many ways: 1) it is the single most effective way to reduce water application to the vineyard, 2) the stress developed in the vine stimulates the fruit ripening processes, which is especially beneficial for red wine grape varieties, 3) the moderate stress on the vine partially closes leaf pores (stomata), which put the vine into a very water-use-efficient state. This reduces the amount of irrigation needed during the remainder of the season. It may be desirable or necessary to increase the irrigation level late in the season to reduce vine stress, but it is not necessarily essential as long as the vine water stress does not become excessive. For that reason, continuous vine and soil moisture status measurements need to be made up until harvest.
The vine water management strategy attempted in this project was to impose irrigation delays and limited water applications such that the vines reached a moderate level of stress before veraison was observed. From past experience, we would like to see stomatal conductance levels of 110 to 150 mmol m-2 s-1. Achieving levels of stress in this zone, the levels of Abscisic Acid (ABA) become elevated and trigger production of ripening enzymes in the fruit. This helps the fruit to reach phenolic maturity at a lower brix level than if not stressed, which provides more flexibility in wine styles concerning the ability to achieve different flavor profiles with a lower risk of berry collapse or excessive sugar (and thereby excessive alcohol) content. It is essential that this stress level be reached about two weeks prior to veraison and carried though the rest of veraison.
Wines were made from each block and kept separate at the winery. No formal tasting was made of the wines in 2012, and the block treatments were not that different from one another. Wines from 2013 were also kept separate but have not been tested for comparison to date.
Red Fan Vineyard Location:
Irrigation (Fig. R1): Block 830 began its irrigation on July 22 in 2012, partially due to uneasiness from the grower (which was later alleviated, thus allowing for later irrigations in 2013). Block 860 began irrigations on August 9 that year and both blocks began their irrigation weeks after the vineyard manager would have normally begun had he not had the information provided to him by this demonstration project. Block 830 continued with weekly irrigations after August 9 through harvest, and Block 860 was irrigated for only four times before the vineyard manager was convinced that the vines were “too happy.” Total amount applied to Block 830 was 2.22 inches (about 42 gallons/vine) while the total amount applied to Block 860 was only 0.95 inches (about 18 gallons per vine). This represents 19% and 8% of crop ET for blocks 830 and 860, respectively, from July 18 through October 10. The small amount of irrigation was possible because the vines were in a high water-use-efficiency range of stress. Note that vines did not become overly stressed or show signs of leaf abscission.
In 2013, irrigation did not commence until September 3 in Block 830, aided by a significant rainfall in late June. Block 860 did not receive irrigation until September 9, and it received only three irrigation applications. Total amount applied to Block 830 was 1.55 inches (about 29 gallons/vine) while the total amount applied to Block 860 was only 0.74 inches (about 14 gallons per vine). This represents 32% and 15% of crop ET for blocks 830 and 860, respectively, from September 3 through October 10. Note again that vines did not become overly stressed or show signs of leaf abscission through harvest.
The amount of irrigation applied to the vines is far less than the standard practice in Alexander Valley, which is 4 to 6 inches. Again, this is possible because of delayed irrigation and imposition of mild vine stress.
Water Status (Figs. R2, R3): In 2012, leaf water potential did not reach the desired level of -14 bars in Block 830 and only briefly fell into the desired stress level in Block 860 (for about two weeks). Furthermore, the stress was achieved after veraison so the maximum benefit on ripening was not realized. Likewise, neither block reached the target level of stress in 2013, and 830 was at a lower stress level than 860 after irrigation commenced and continued through harvest. The very mild weather and the heavy soils made it difficult to impose stress at this site.
This is also seen in the stomatal conductance charts. The desired stomatal conductance range was experienced only briefly in both blocks, with 860 getting into the range in late September while Block 830 did not remain in that range for long due to the irrigation activity. In 2013, Block 830 did not enter in the desired range, and Block 830 barely made it into the range during September. It may be that this vineyard is not able to reach those target stress levels due to the high water holding capacity of the soils there.
Soil moisture charts appear in Fig. R4 and R5. The upper graph in each shows the average soil moisture which we use to determine proper intervals between irrigations trying to keep the soil moisture from falling or rising and staying within the band determined through iteration. Note that we usually found that the target band determined in Year 1 was valid in Year 2 as well, indicating that the procedure we went through in Year 1 sets up a site calibration, in essence, for the soil moisture.
The multicolored bands in the middle chart shows the water content of each of the levels. This provides a visualization of the water percolation during irrigation events. Here we see that our irrigation applications (about four hours each) reached down to at least 48 inches.
The bottom lines indicate irrigation activity as sensed by the pressure switch. Note that the pressure switch devices performed irregularly and did not work for periods of time, though they tended to work all year long when they did work. For any missing irrigation information, the grower provided the missing data points.
Figs. R6 through R9 show plots of leaf water potential (LWP) and stomatal conductance versus the average profile water content (relative) for each of the days of measurement. Correlations were seen in some, but not all, of the blocks and years. R-squared values of at least 0.2 indicate significant correlations (P<0.05), so while some of the correlations look weak, they may be significant. Leaf water potential correlated to soil moisture in 2012 for Block 830 (irrigated more) but did not correlate in Block 860 (irrigated less). Stomatal conductance, however, showed a good correlation in 2012 in both blocks. We see that in both blocks, the desired stomatal conductance levels correspond to relative soil moisture levels of about 60% in Block 830 and 64% in Block 860.
In 2013, Block 830 plant water status did not correlate as well as in 2012, but the leaf water potential was significantly correlated. In Block 860, both leaf water potential and stomatal conductance were significantly and highly correlated to average relative soil moisture. The target soil moisture content was consistent in 860 between the two years, suggesting that the soil moisture may be used as an indicator of target vine water status once it has been confirmed using the vine water status measurements. It is not clear why the vine and soil moisture measurements did not always correlate, but it could be due to rootstock behavior and/or its interaction with odd weather patterns.
Landslide Vineyard Location:
Irrigation (Fig. L1): Both blocks began irrigating in 2012 on July 23. After some trial and error it was decided to irrigate Block 14 twice per week for three gallons/vine each irrigation and to irrigate Block 15 three times per week for two gallons/vine each irrigation. Total amount applied to each block was very similar by the end of the season. Total amount applied to Block 14 was 3.62 inches (about 90 gallons/vine) while the total amount applied to Block 15 was 3.55 inches (about 88 gallons per vine). This represents 24% of crop ET for both blocks from July 23 through October 10. The small amount of irrigation was possible because the vines were in a high water-use-efficiency range of stress. Note that vines did not become overly stressed or show signs of leaf abscission.
In 2013, irrigation did not commence until August 7 in Block 14, aided by a significant rainfall in late June. Block 15, which had a higher stress target, did not receive irrigation until August 28. Total amount applied to Block 14 was 1.65 inches (about 42 gallons/vine) while the total amount applied to Block 15 was only 0.72 inches (about 16 gallons per vine). This represents 24% and 11% of crop ET for blocks 14 and 15, respectively, from August 7 through October 10. Note again that vines did not become overly stressed or show signs of leaf abscission through harvest.
The amount of irrigation applied to the vines is far less than the standard practice in Alexander Valley which is 4 to 6 inches. Again, this is possible because of delayed irrigation and imposition of mild vine stress.
Water Status (Figs. L2, L3): In 2012, leaf water potential targets were reached in late July, which was before veraison started. Stomatal conductance also got into the desired range just prior to veraison and it was held through veraison and into the early stages of ripening. This occurred in both blocks. In 2013, leaf water potential reached the ideal zone in early August, around the time of veraison. The late June rainfall essentially delayed the attainment of the desired stress level. However, the leaf water potential level was held close to ideal for the rest of the ripening period. Stomatal conductance levels were slightly higher than ideal in 2013, though Block 15 was closer to the ideal level than Block 14.
Soil moisture charts appear in Fig. L4. The upper graph in each shows the average soil moisture, which we use to determine proper intervals between irrigations, trying to keep the soil moisture from falling or rising and staying within the band determined through iteration. Note that we usually found that the target band determined in Year 1 was valid in Year 2 as well, indicating that the procedure we went through in Year 1 sets up a site calibration, in essence, for the soil moisture. Block 14’s soil moisture patterns were not as distinct in 2013 as they were in 2012. Block 15’s did not exhibit this degradation in signal quality. It is believed that the reduced sensitivity was due to the emitter shifting from one year to the other. This is not a common occurrence seen in these sensors, and it was recognized too late to make any changes. However, because we were still sensing some soil moisture dynamics, we were able to use the information to maintain a relatively constant soil moisture level over time.
The multicolored bands in the middle chart show the water content of each of the levels. This provides a visualization of the water percolation during irrigation events. Here we see that our irrigation applications (about 2-3 hours each) reached down to only 16 inches as this was as far as we could push moisture in these rocky soils. This is counter to common belief that rocky soils allow moisture to percolate deeply. While rain will percolate deeply in these well-drained soils, drip irrigation does not do so because of the slow application of water at a point source at the soil surface.
The bottom lines indicate irrigation activity as sensed by the pressure switch. The pressure switches performed better at this site than at Red Fan, though there were a few false readings early in the 2012 season in Block 15.
Figs. L6 through L9 show plots of leaf water potential and stomatal conductance versus the average profile water content (relative) for each of the days of measurement. Correlations were seen in some, but not all, of the blocks and years. R-squared values of at least 0.2 indicate significant correlations (P<0.05), so while some of the correlations look weak, they may be significant. Leaf water potential did not correlate to soil moisture in 2012 for either block. Stomatal conductance, on the other hand, showed a good correlation in 2012 in both blocks. We see that in both blocks, the desired stomatal conductance levels correspond to relative soil moisture levels of about 49-50% in Block 14 and 51% in Block 15. Target water content is lower at Landslide than at Red Fan because of the high rock content.
In 2013, leaf water potential was more correlated to soil water content than in 2012. Block 14 was especially well-correlated. However, stomatal conductance was highly correlated in Block 14 but not correlated in Block 15. Both blocks have the same rootstock, so it is not known why correlations are sometimes high and sometimes low. It may be because Block 14 was irrigated more than Block 15 in 2013 providing a greater variety of soil moisture late in the season. We have found that stomatal conductance can be highly variable early in the growing season but tends to stabilize later in the season, when shoot growth ceases.
Research outcomes
Education and Outreach
Participation summary:
Reports of the Western SARE funded project were communicated through the Sonoma County Winegrape Commission’s Vine Times newsletter. A hard copy of each newsletter is mailed to 2,500 growers, vintners and industry personnel. Overall, there were four total hard copy newsletters with an approximate imprint of 10,000 views. These newsletters are also found on our website, http://www.sonomawinegrape.org/newsletters.
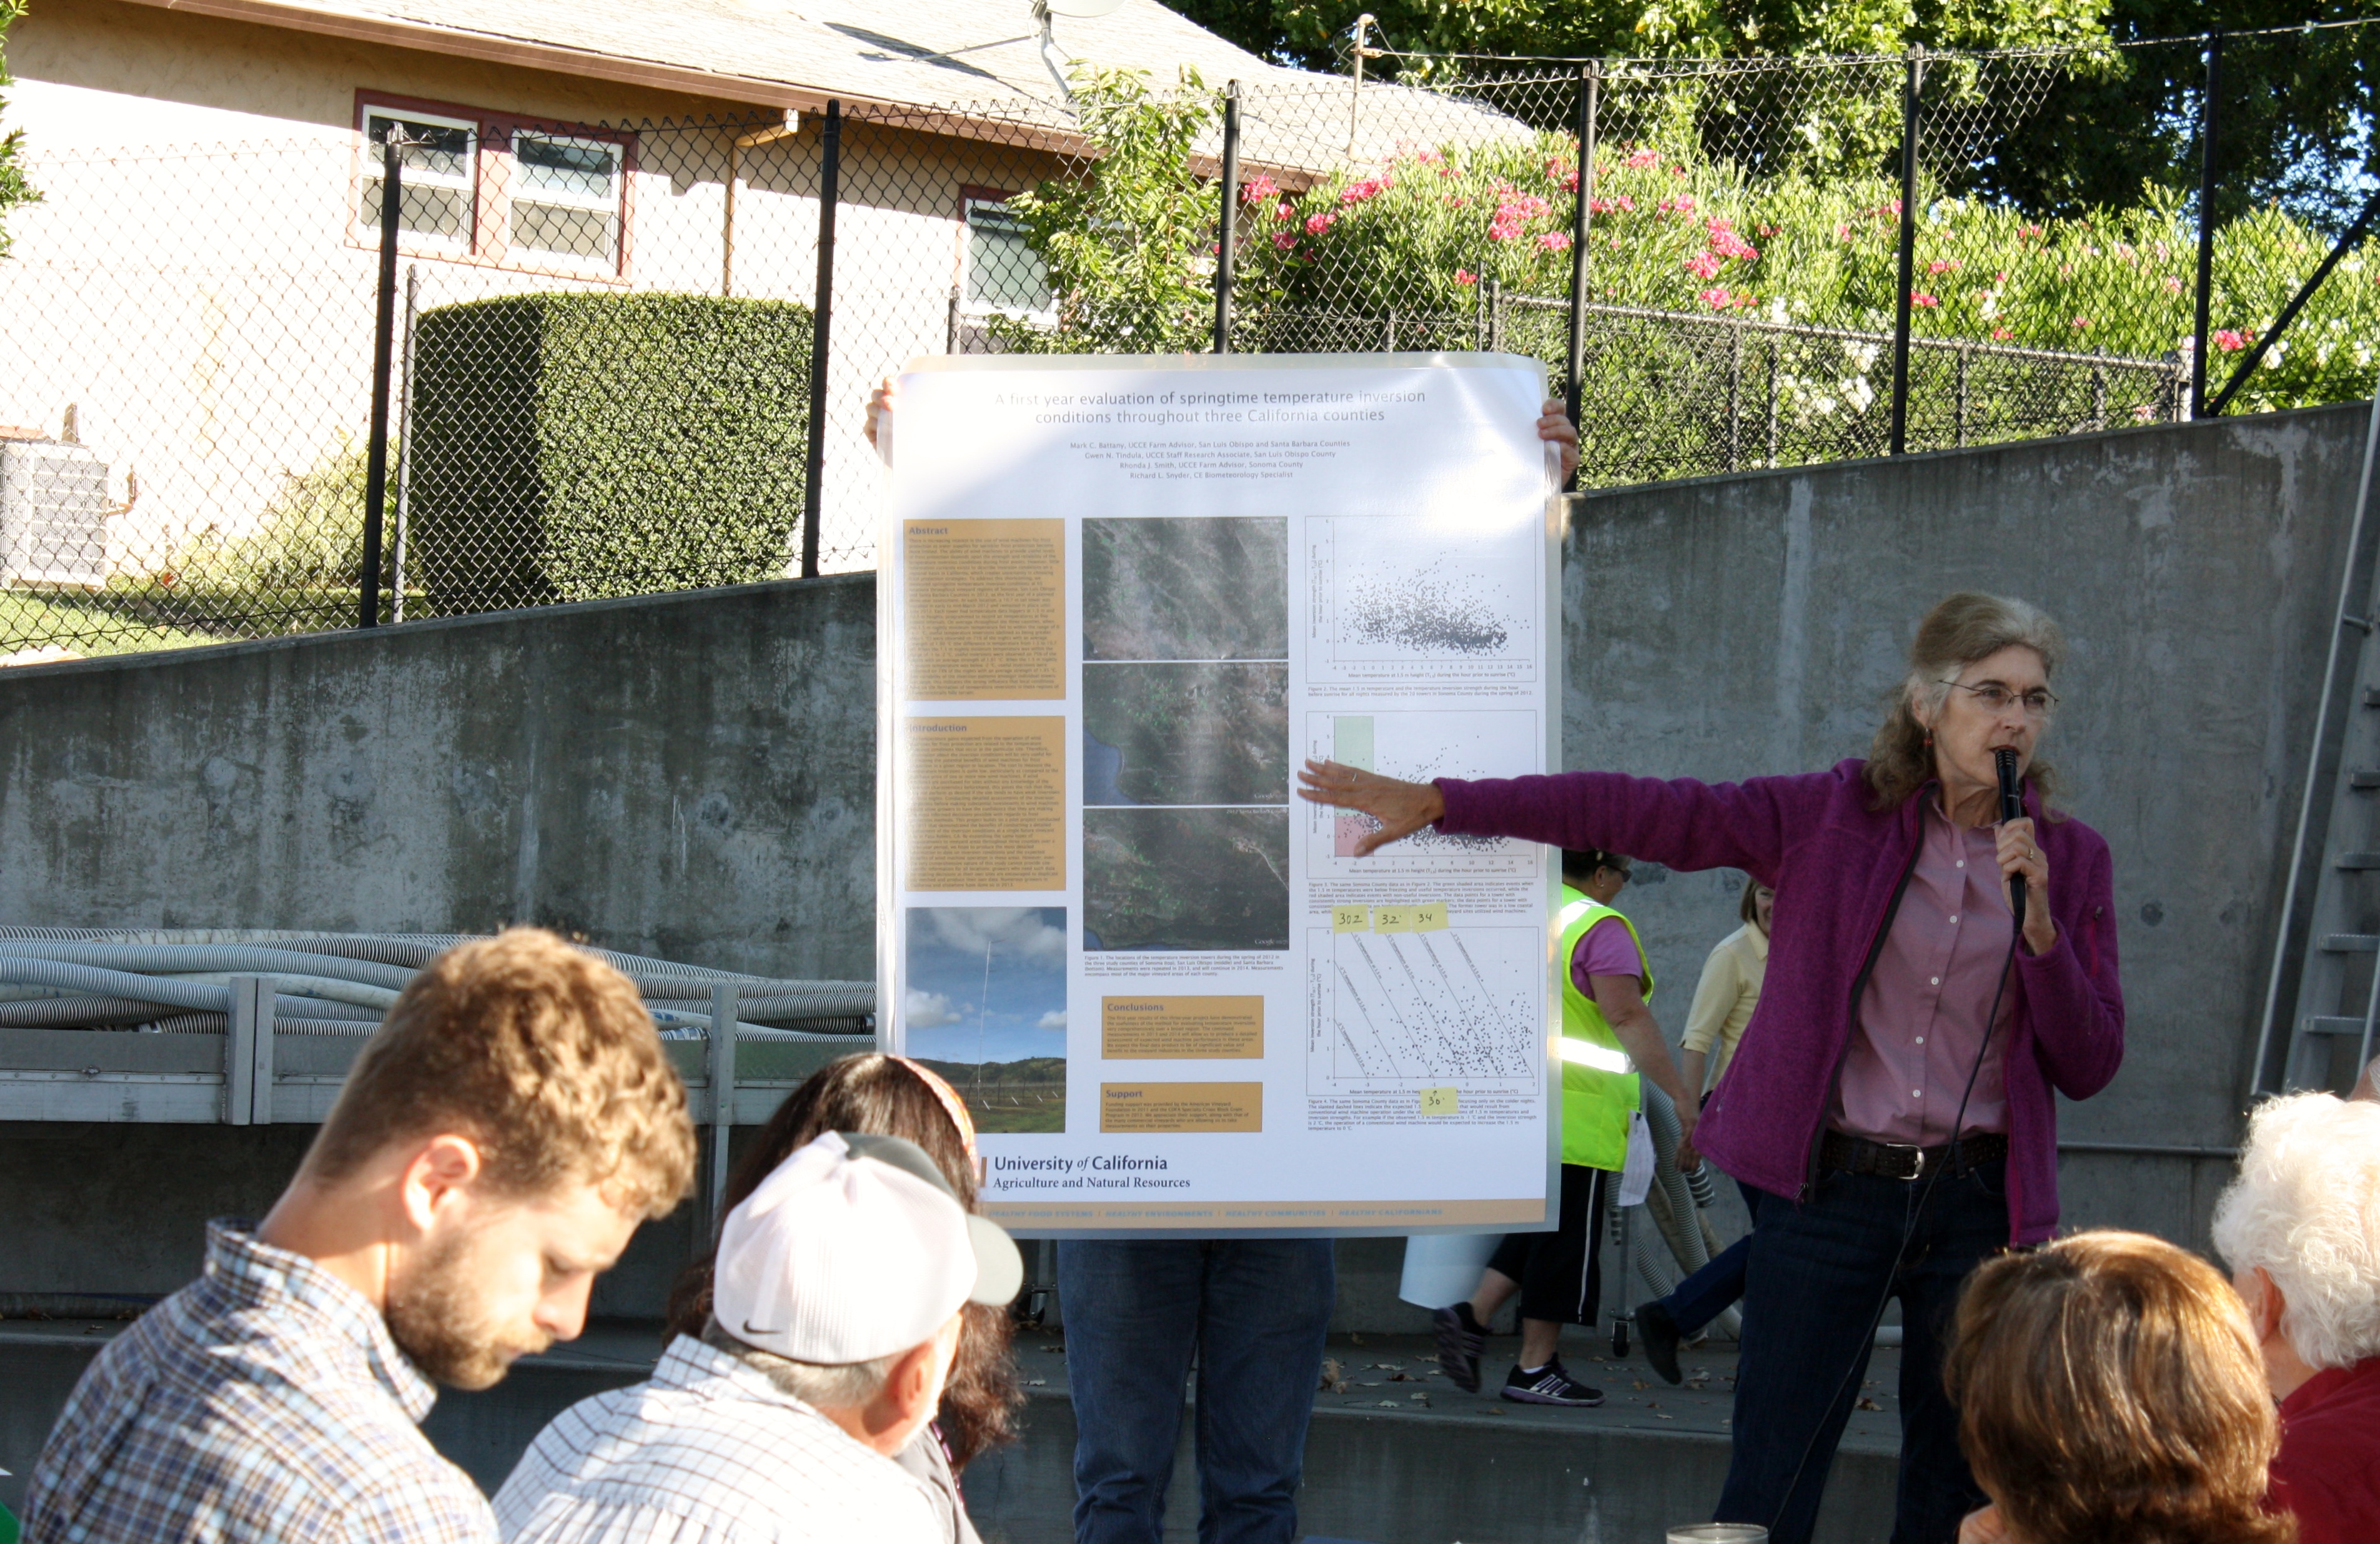
Grape grower introduction to the Western SARE grant was made in summer 2012 issue of Vine Times. In the fall 2012 issue, project partner Dr. Mark Greenspan provided an update of the project’s field evaluations and measurements of irrigation levels. Greenspan provided readers with the log-in information to access technical information. In the spring 2013 newsletter, project partner Rhonda Smith, UC Cooperative Extension Viticulture Advisor, provided a timely update to growers on efficient use of frost water through proper timing of frost protection sprinkler use and properly determining the critical temperature of the ambient air temperature for frost damage. The summer 2013 edition was used to promote the Water Conservation Field Day, which showcased both the irrigation water conservation and frost protection findings. The report of the Field Day was provided in the fall 2013 newsletter.
A final Western SARE funded project wrap-up will take place in the upcoming summer 2014 newsletter. A short summary will be provided with a link to the entire final report found on our website.
Grower Outreach
Workshops and demonstrations, newsletter articles, and website information, including Best Management Practices (BMP) for frost protection and irrigation management, were used, and will continue to be used, to inform growers of the need to conserve water in frost protection and irrigation. The Sonoma County Winegrape Commission weather station network provides growers with real-time weather data, including temperature alerts on cell phones and dew point information, which is critical in deciding the temperature for frost protection initiation. BMPs were provided to help growers understand how water could be conserved for both frost protection and irrigation.
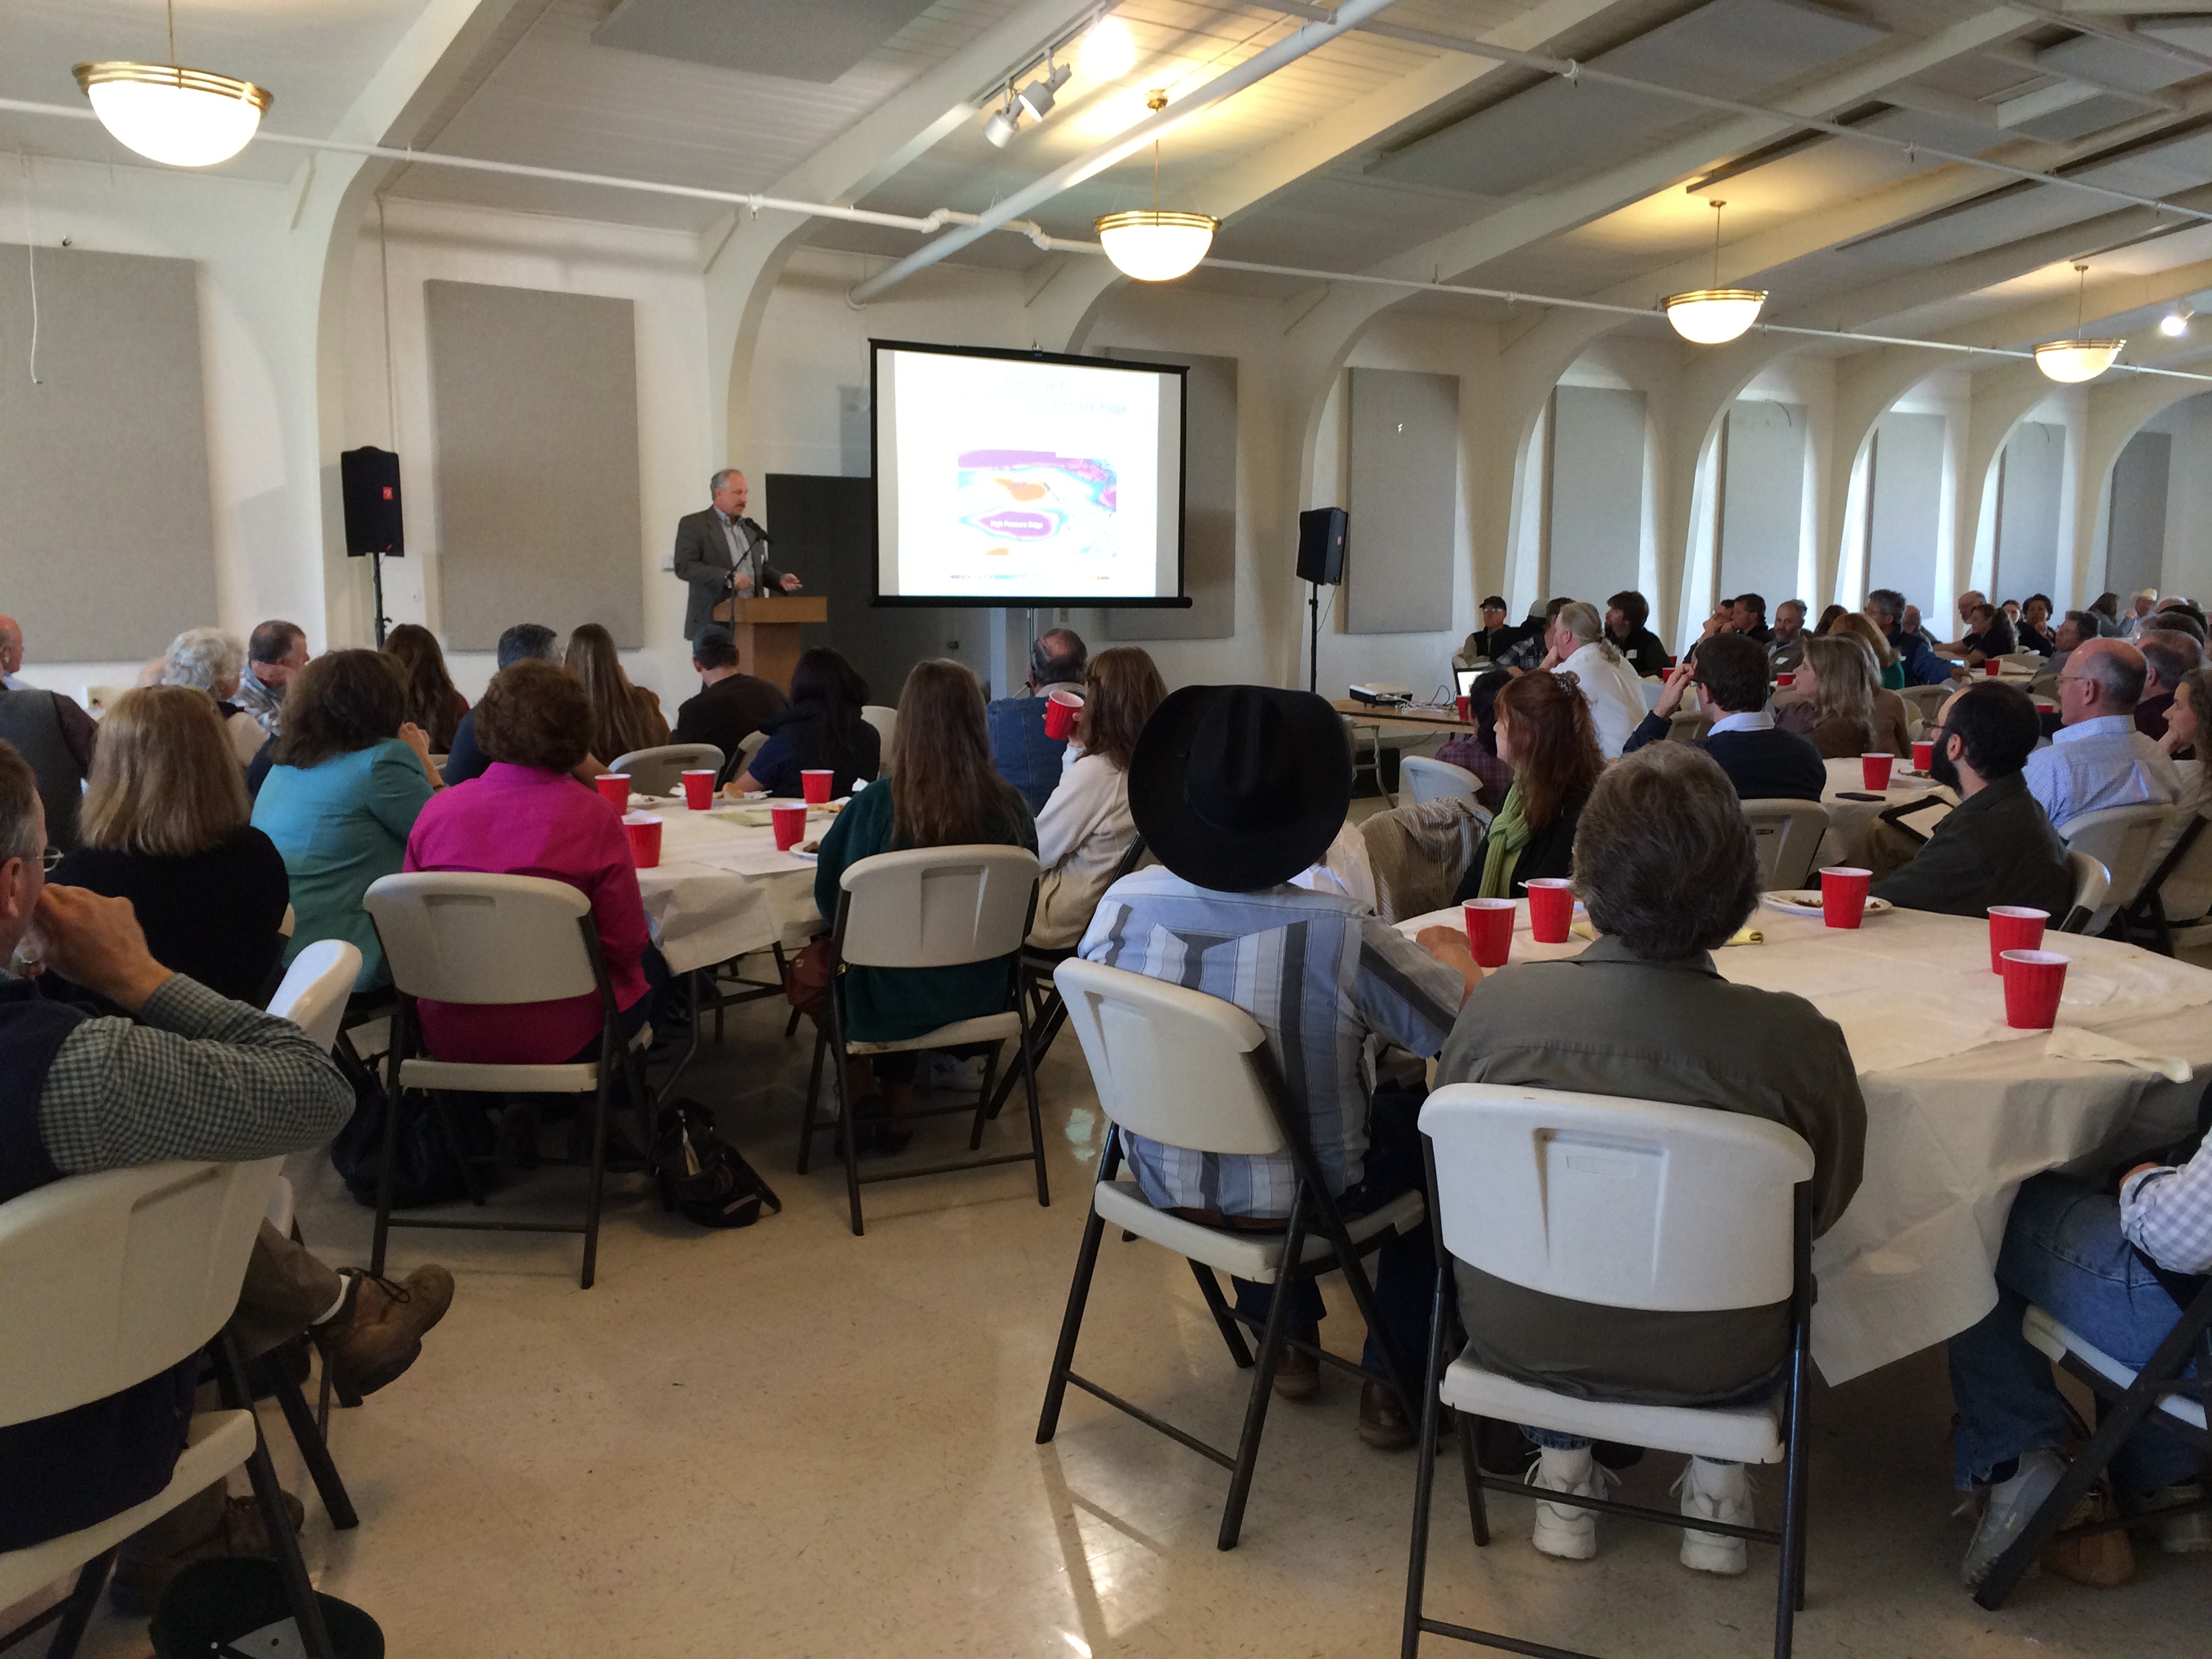
During the two year Western SARE funded project, three frost/drought workshops were held and the one Water Conservation Field Day event. In all, 477 growers and partners attended these outreach meetings.
A survey following the Water Field Day was completed by 16 growers, with 73-75% feeling the frost protection and irrigation management presentations were very useful. Several respondents already used the BMPs to guide their frost protection initiation and duration. Others indicated they will change practices or investigate wind machines as an alternative frost protection method. All respondents indicated they would change practices based upon the irrigation management presentation.
There is ongoing need for grower education on methods to conserve water in grape production while maintaining crop yields and quality. The irrigation demonstrations were particularly valuable because they showed that there were further irrigation savings that could be achieved without sacrificing quality by one of the county’s top growers when soil and plant water status measurements were used to manage irrigation initiation, frequency and duration.
![]() Drought & Frost Meeting, Feb. 28, 2013
Drought & Frost Meeting, Feb. 28, 2013
![]() Drought & Frost Meeting, Feb. 4, 2014
Drought & Frost Meeting, Feb. 4, 2014
Education and Outreach Outcomes
Areas needing additional study
We conducted a trial in 2013 to evaluate frost protection spray products. A site was selected in which spring frosts had occurred on one or more days each year for the previous 19 years. Materials were provided by agricultural product retailers that are commonly requested by growers or which had been recently introduced to the market for this purpose. Unfortunately, in 2013 post bud break temperatures at the trial site remained above the critical temperature (32 °F), therefore green tissue damage of leaf blades, shoots and flower clusters did not occur. No data were collected and the efficacy of the products could not be evaluated. This trial to evaluate frost protection spray products should be reinstated in another frost season, as the results could demonstrate potential water savings during frost events. Or, it could show the products are not as advertised or beneficial only under certain circumstances. Either way, the results would be helpful going forward to growers without wind machine protection.
There is ongoing need for grower outreach and education on water conservation strategies for frost protection and irrigation management. This includes grower-to-grower education by those early adopters of new water conservation strategies developed through this Western SARE funded project.