Final report for OW17-051
Project Information
Dryland wheat-fallow producers have begun switching to a direct seed tillage system for soil health benefits such as reduced runoff, increased water infiltration, increased consistency of crop stands, more and longer period of surface cover from crop residue, better soil moisture, and fewer dust clouds at planting time. However, this practice often requires increased pesticide and herbicide use. Thus, many producers are interested in economically sustainable strategies for reducing pesticide use and further improving soil health. This project is working with five producers, who typically farm using a direct seed wheat-fallow rotation, to experiment with a more biologically intensive and sustainable management system. We hypothesized that integrating cover crops and livestock will improve soil health, suppress weeds, and reduce pesticide use.
Trials were completed in 2017 and 2018. Treatment (cover crops with livestock grazing) had little to no effect on soil parameters such as phosphorus, potassium, magnesium, boron, zinc, or organic matter. The treatment sites did show significant decreases in nitrate nitrogen and increased ammonium nitrate; this was likely due to the uptake of nitrogen by vegetative mass, and returns from livestock. We observed decreases in sulfur and a slight increase in soil pH in the cover crop treatment. Soil moisture was significantly lower in the grazed cover crop than the control at the time of soil sampling; however, there was no significant difference between plant stand establishment or plant height. Successive spring crop yield showed no significant differences between the wheat fallow control and the grazed cover crop. Producers thought that the animals had good body condition scores when coming off the cover crops. Since project completion, producers have continued to plant cover crops.
Long-term goals of the producers and the project as they relate to the WesternSARE Program include the following:
- Increase diversity in an agricultural system that has historically planted a single crop for 100 years.
- Reduce pesticide and synthetic herbicide use toward more socially responsible and environmentally sound agricultural production systems.
- Reduce long-term economic risk, protect soil resources, and increase farm viability through more holistic, sustainable, and biologically-based farming practices.
Cooperators
- (Researcher)
- (Researcher)
- (Researcher)
- (Educator and Researcher)
- (Educator and Researcher)
- (Educator and Researcher)
- (Educator and Researcher)
Research
Determine cover crop seed mix
Okanogan Conservation District (OCD) and producers developed a seed list for cover crops based on results of previous observations and trials. A seeding rate of 20 seeds / square foot was targeted to achieve coverage of field without reducing moisture excessively. Species were chosen based on diversity, palatability, and productivity. Starter fertilizer was placed with seed at time of planting.
Implement trials
Each of the three cooperator sites is considered a statistical block. Within each block, two treatments (grazed cover crop and fallow control) are implemented in a paired design with four replications. Producers drill planted the cover crop mix in June of 2017. Each producer planted 30 acres of cover crop leaving four “skips”. These skips, approximately 40’x100’, acted as control plots and were fenced off with T posts and electric wire. Immediately adjacent to the controls, we created paired plots in the cover crop measuring 40’ x 100’. All plots were marked with GPS points. Livestock had access to the grazed cover crops, but not the wheat-fallow control.
Above ground biomass, in one meter square quadrants, was recorded and samples collected at two sites before and after grazing. At the third site, no biomass data were collected because OCD was not notified when cattle were placed on the field. Fields were grazed with cattle at appropriate times for each field for between 3-10 days depending on the forage available and number of livestock used (Figure 2). Cow/calf pairs were used at four sites and stockers at two. Remaining cover crop biomass was recorded after grazing. Cover crops were not terminated post grazing. Each site was planted into a different spring crop depending on farmer preference .
Producers planted cash crops the following spring; cash crops included spring wheat, spring triticale, and spring barley depending on farmer preference. Harvested of cash crops took place in late August or September using producer’s harvesters, grain bags, and livestock scale to achieve correct weights. We collected grain samples from each treatment and analyzed at the local co-op for grain moisture, grain weight, and grain protein (Infratec 1241 Grain Analyzer).
Collect data
Soil samples were collected from each plot in August of 2017 using 4” diameter augers and in September of 2018 using Giddings. Samples were taken at depths of 0-6”, 6-12”, 12-24”, 24-36”. Soils were analyzed for moisture, OM, pH, available nutrient contents, and microbial activities by Soil Test Farm Consultants in Moses Lake, and by WSU. Above ground biomass was weighed and dried and then sent to WSU for nutrient analysis.
We collected plant samples to estimate stand establishment of the cash crop in the spring when the cash crop had reached 10 to 20 cm of growth. The number of plants along a one-meter stick was counted and recorded, and three randomly selected heights along the meter was recorded. We counted plant establishment five times per plot in both the control and treatment, in all four replications.
Grazing Livestock
004-2017: Producer hauled livestock to nearby truck scales. Hauled 6 cows, and 5 calves, then reweighed at end of 8 days. No change in calves. Cows combined gained 10lbs. Averaged 1.66 lbs/day gain. Maintained weight.
004-2018: Producer agreed to use livestock scale before and after grazing. 30 cow/calf pairs. Grazed for 9 days. Averaged 3.5lbs/day gain on calves; 2 lbs/day on cows.
006-2017: Producer/Rancher failed to notify Conservation District when cows where placed in field. Rancher was pleased with how livestock responded to cover crop and their body condition after grazing cover crop.
006-2018: Rancher ran 49 calves and 41 cows for pre-weight, after 3 days of grazing 32 calves and 16 cows were run for post weight. Calves were all bull calves. Cows maintained weight. Livestock was brought in off of dry rangeland forage.
008-2017: 80 cow/calf pairs were placed on the field, a percentage of 40 cow/calves were weighed prior to grazing. Cows were weighed 5 days after grazing, however no tag color was recorded pre-grazing, only number, and multiple animals had the same number. No sense could be made of the data. Assumed cows maintained.
024-2018: 4 steers and 4 open cows were weighed prior to grazing, 1 cow/calf pair broke in to join cows on luscious feed. Livestock reweighed after several weeks of grazing, then a third time at removal from cover crop. Livestock weights for this site are provided.
Lessons learned from grazing component:
Paired plot design and set up for fencing out livestock worked well and had limited impact of farmers production. This design will be used in future projects, for livestock and cropping systems in on-farm trials to achieve four random replications at a small scale.
Large number of livestock were difficult to weigh, and some livestock more difficult than others. Future trials should use smaller number of livestock for longer durations. Additionally, a third weigh out would help normalize the weights and potential of animals leaning against railings and offsetting weight. A third weigh out would only be practical for producers with less than 15-20 cow/calf pairs; this smaller number would allow livestock to be run across scales in less than 30 minutes.
Location of corrals, time of day, previous forage, availability of water, fencing, other forage should all be considered when choosing locations to graze cover crops.
Plots 004-2017/2018, 006-2017, 008-2017 have been managed according to the plan. The following two however, have had some major adjustments.
006-2018: 30 acres of cover crop were surrounded with cover crop of similar but different mix. Livestock were put out to graze and cowboys kept them in the 30-acre bowl grazing the BIOAg cover crop mix. Post weigh out livestock were fenced out of cover crop, however livestock continued to break into field. Eventually rancher left livestock in the field. Soil samples were collected, however 2018 yield is compromised.
024-2018: Site 008 was unable to plant cover crop in 2018, so 024 planted cover crop. Cover crop was planted in field that had been winter feed lot for previous 8-10 years. Cover crop was planted 2-4 weeks after other sites but achieved similar growth in 2 weeks. After 5 weeks of growth, areas of the field had reached 4 ft in height. Concern about nitrates was raised and leaf samples were sent for testing. Results of tissue samples were 5,398 mg/kg—too high to graze. It was decided to swath and bale cover crop and provide as winter feed under controlled environment. Plant biomass was sampled before swathing. Nitrate level in late August was 3,120 mg/kg. Cover crop was left to regrow for approximately 6 weeks before third testing, results were 1,272 mg/kg in grass species and 645 mg/kg broadleaf species. It was determined that these levels were safe enough for livestock; cover crop biomass was resampled and livestock were placed on the field.
Table 1. Cover crop seed mixture used in grazed cover crop trial used both 2017 and 2018.
|
Plant |
lb seed per acre |
Seeds per lb |
Seeds per Acre |
Seed per SF |
|
Everleaf Oats |
10 |
16,000 |
160,000 |
3.67 |
|
HoneySweet Forage Sorghum |
10 |
21,000 |
210,000 |
4.82 |
|
Purple Top Turnip |
1 |
220,000 |
220,000 |
5.05 |
|
Spring Forage Peas |
20 |
5,000 |
100,000 |
2.30 |
|
Sunflowers |
6 |
7,000 |
42,000 |
0.96 |
|
Proso Millet |
2 |
80,000 |
160,000 |
3.67 |
|
Total |
49 |
|
|
20.48 |
Table 2. Soil sampling and grazing at each site and year.
|
Farm ID |
Year |
Soil Sampled |
Animals |
Number of Animals |
Days of Grazing |
Livestock Weight Gain (lb/day) |
Crop following Cover Crop |
|
004 |
2017 |
August |
Cow/Calf |
49 pair |
8 |
calves: maintained cows: 1.7 |
DNS |
|
004 |
2018 |
September |
Cow/Calf |
30 pair |
9 |
Calves: 3.5 Cows: 2.0 |
DNS* |
|
006 |
2017 |
August |
Yearlings |
100 total |
9 |
Not available |
Spring Triticale |
|
006 |
2018 |
September |
Cow/Calf |
60 pair |
3 |
Calves: 0.8 Cows: maintained |
Spring Triticale* |
|
008 |
2017 |
August |
Cow/Calf |
40 pair |
5 |
Not available |
Spring Barley |
|
024 |
2018 |
- |
Steers/ Heifers |
10 total |
in progress |
Overall: 3.9 See Table 3 |
- |
Table 3. Detail of cattle weights at site 024
|
Tag # |
Animal |
------ Weight Gain (lb/day) ------ |
||
|
|
|
10/12-10/29 |
10/29-11/6 |
overall |
|
119 |
Heifer |
5.00 |
5.56 |
5.38 |
|
137 |
Heifer |
1.89 |
6.00 |
3.38 |
|
34 |
Heifer |
3.67 |
2.78 |
3.50 |
|
181 |
Heifer |
2.78 |
5.56 |
3.85 |
|
91 |
Heifer |
0.56 |
6.11 |
2.50 |
|
23 |
Steer |
3.61 |
6.67 |
4.81 |
|
44 |
Steer |
1.11 |
4.44 |
2.31 |
|
14 |
Steer |
3.61 |
7.78 |
5.19 |
|
|
Average |
2.78 |
5.61 |
3.87 |
Treatment had little to no effect on most soil parameters such as phosphorus, potassium, magnesium, boron, zinc, or organic matter. The control significantly decreased nitrate nitrogen in the 0-15 cm depth from an average of 22.5 mg/kg across all sites to 10 mg/kg in the treatment, and increased ammonium nitrate from 1.8 mg/kg to 3.4 mg/kg (Table 4). This was likely due to the uptake of nitrogen by vegetative mass, and returns from livestock. Sulfur in the cover crop area declined from 17 mg/kg to 10 mg/kg. Soil pH was slightly higher in cover crop areas, most notable in the top 15 cm. Increases in pH have been noted in other cover crop studies in the region and may be more prevalent after several years of cover crops. Iron decreased in the top 15 cm. Soil moisture was significantly lower in the grazed cover crop than the control at the time of soil sampling; however, there was no significant difference between plant stand establishment or plant height.
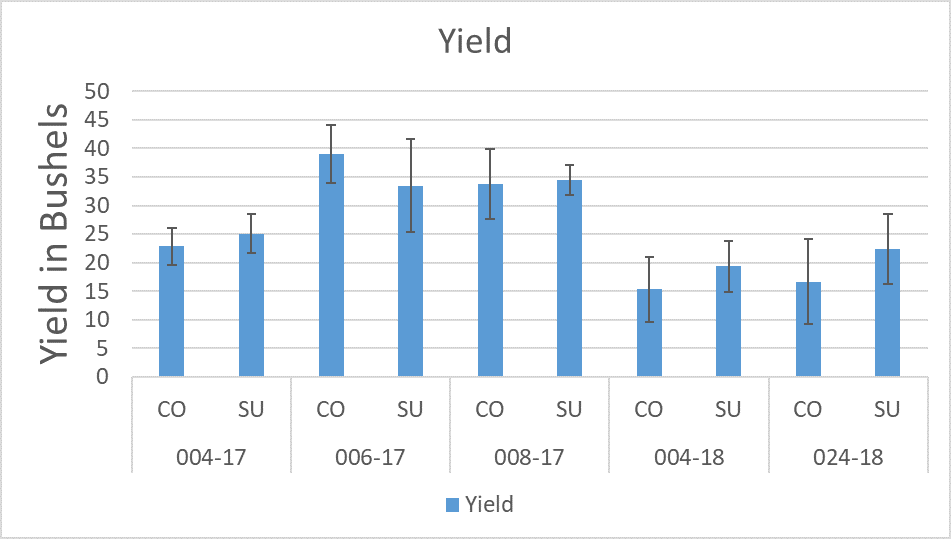
Successive spring crop yield showed no significant differences between the wheat fallow control and the grazed cover crop (Figure 1). Although cover crop would have used some soil water, a lack of significant difference in subsequent crop yield suggests that plant available water was similar. This may be due to increased water recharge during the winter in the treated plots with more plant roots and avenues for water to infiltrate into the soil.
Producers thought that the animals had good body condition scores when coming off the cover crops. Since project completion, producers have continued to plant cover crops. The focus for experimentation is winter stock piling and grazing cover crop/crop companion mix.
Table 4. Inorganic N at four soil depths in control (CO, bare fallow) and grazed summer cover crop (SU). No soil samples were taken for site 024.
| Year | Site | Depth
|
Nitrate N (mg/kg) |
Ammonium N (mg/kg) |
||
| CO | SU | CO | SU | |||
| 2017 | 004 |
0 to 15 cm |
17 |
14 |
1 |
3 |
| 15 to 30 cm |
5 |
4 |
0 |
1 |
||
| 30 to 60 cm |
4 |
4 |
0 |
0 |
||
| 60 to 90 cm |
3 |
6 |
0 |
0 |
||
| 006 |
0 to 15 cm |
37 |
21 |
4 |
10 |
|
| 15 to 30 cm |
7 |
4 |
1 |
1 |
||
| 30 to 60 cm |
6 |
3 |
0 |
0 |
||
| 60 to 90 cm |
5 |
3 |
0 |
0 |
||
| 008 |
0 to 15 cm |
42 |
12 |
2 |
2 |
|
| 15 to 30 cm |
9 |
6 |
1 |
0 |
||
| 30 to 60 cm |
8 |
4 |
0 |
0 |
||
| 60 to 90 cm |
9 |
10 |
0 |
0 |
||
| 2018 | 004 |
0 to 15 cm |
9 |
4 |
1 |
1 |
| 15 to 30 cm |
6 |
3 |
1 |
1 |
||
| 30 to 60 cm |
9 |
16 |
1 |
1 |
||
| 60 to 90 cm |
13 |
13 |
1 |
1 |
||
| 006 |
0 to 15 cm |
7 |
2 |
1 |
1 |
|
| 15 to 30 cm |
3 |
1 |
1 |
1 |
||
| 30 to 60 cm |
7 |
1 |
0 |
1 |
||
| 60 to 90 cm |
6 |
6 |
1 |
1 |
||
Figure 1. Crop yield (spring wheat, spring triticale, or spring barley) following control (CO, bare fallow) or grazed summer cover crop (SU).
Research outcomes
Education and Outreach
Participation summary:
- Publications, Handouts, Other Text & Web Products:
- 2 Facebook posts on Okanogan Conservation District’s page
- 19 Tweets with 18,686 impressions and 1,215 engagements
- February 2020 - Filmed interviews of producers involved in the project. Videos were submitted to W.SARE for upload to their YouTube channel.
- Outreach & Education Activities:
- Field tour on soil health (including cover crops and grazing) in dryland systems –20 attendees: May 2017 – Lincoln, Douglas, and Okanogan Co.
- Field tour for cover crops and grazing –55 attendees: June 2017 – Douglas Co.
- Field day with grant participants—13 participants: March 2018—Lazy R Ranch, Cheney, WA.
- Field tour on cover crops and grazing – 45 attendees: October 2018—Douglas & Okanogan Co.
- Presentation of Project—
- January 2018 – Doug Poole/Leslie Michel speak on cover crops and grazing at Pacific Northwest Direct Seed Association Conference
- January 2018—Poster; Pacific Northwest Direct Seed Association Conference
- February 2018 – Leslie Michel presented at Soil Health Workshop for Producers
- March 2018 – Poster presentation at Oregon Society of Soil Scientists Annual Meeting
- August 2018 - Poster presentation at Soil Health Institute meeting
- August 2018 - Poster presentation at the Soil and Water Conservation Society annual meeting
- October 9, 2018 – Leslie Michel presented Webinar for NRCS Science and Technology Training Library
- January 2019 - Leslie Michel presented at Palouse Rock Lake Conservation District Annual Meeting - 50 attendees
- February 2019 - Poster presentation at BIOAg Symposium
- March 2019 - Leslie Michel presented at Healthy Soil, Healthy Region Workshop - 60 attendees
- March 2019 - Poster presentation at Healthy Soil, Healthy Region Workshop
- March 2019 - Leslie Michel participated in panel at Roots of Resilience meeting - 120 attendees
- March 2019 - Poster presentation at Roots of Resilience meeting
- July 2019 - Leslie Michel presented at Northwest Artisan Grains Conference - 40 attendees
Education and Outreach Outcomes
Producers in dryland wheat remain interested in incorporating livestock into their rotation to improve soil health and diversify profitably. Further trials in low-cost multi-benefit options should be continued. For instance, winter stock piling a cover crop (grown during the summer and consumed by livestock during the winter) may prove profitable for producers interested in reducing feed costs while improving soil health. Producer 004 tested two of his stockpile mixtures in early December and found 17% protein. In another option, summer cover crop may be companion planted with the following crop. For instance, companion warm season cover crop mix and triticale by producer 004 provided grazing, winterkill, and a successive cash crop without replanting. Producer 004 experienced lower than normal triticale yields, however received grazing benefit from the field. Producer 004 will utilize this method again in the future.
Cover Crops in wheat fallow
Livestock grazing covers
Soil Health