Final report for OW19-347
Project Information
Sustaining Winter Wheat Production using Biochar Amendments in Northeast Oregon
Sustainability of winter wheat – summer fallow (WW-SF), the predominant cropping system in inland Pacific Northwest (iPNW) is under threat from soil health deterioration attributable to soil organic carbon (SOC) depletion (>60% of original SOC) and soil acidification (pH<5.5). Growing one crop in two years produces insufficient residues for SOC accretion in both conventional and no-till WW-SF systems. Lowering of soil pH is largely due to continuous use of ammonia-based fertilizer that produce acidity (H+) when converting to nitrate, the nutrient that plants readily absorb. However, WW-SF system remains popular and more reliable than annual cropping in low precipitation zones (<12 inches).
We propose to improve soil health and enhance sustainability of WW-SF systems using biochar, charcoal produced from pyrolysis (biomass combustion at low oxygen levels). Biochar is high in organic carbon that is resistant to decomposition and can increase SOC instantly while lowering soil acidity if it is alkaline.
Our objectives are to 1) evaluate the impact of biochar derived from wheat and Douglas Fir on soil physical, chemical, and biological properties including SOC and pH, 2) evaluate how these changes impact wheat productivity, 3) determine if biochar impacts last beyond one year, and 4) share results with growers, extension agents, and crop consultants to facilitate adoption of biochar practices.
Biochar will be applied only once on 5 farms within a 100 mile radius in 2019-20 crop-year and evaluated for at least two crop-years to fulfil above objectives. Results will be disseminated through grower-led field tours, extension publications, newspapers, radio, webinar, and journal articles. Based on our preliminary results, biochar increased grain yield by 12%, translating into gross profits of about $94 million. Biochar carryover effects can improve soil health and sustainability of WW-SF system.
Our preliminary studies [20], showing positive impacts of biochar on SOC and soil pH were obtained from very small experimental plots (5 x 20 ft) that farmers can hardly relate to. For growers to adopt biochar amendment practices, we plan to scale up and evaluate biochar amendments in commercial-sized and commercially managed plots. Five growers, namely Gary Betts, Eric Nelson, Kevin Melville, Virginia Blakelock, and Bob Johns have volunteered to use their land for biochar evaluation (see attached letters of support and cooperation). These growers are interested in improving soil health and sustainable crop production. The main objectives are:
1) To evaluate the impacts of biochar amendments on SOC, pH, active C, mineralizable C and N, bulk density, water holding capacity (WHC), electrical conductivity (EC), cation exchange capacity (CEC), base saturation, N, P, K, Ca, Mg, S, Na, Al, Fe, Mn, and Zn. Available literature indicates that biochar has potential to improve soil physical, chemical, or biological properties and thereby provide promising agronomic effects [14-18].
2) To investigate if soil improvements (Objective 1) due to biochar amendments increase wheat emergence, biomass accumulation, wheat N use efficiency, water use efficiency, and grain yield.
3) To determine if biochar impacts persist beyond the first year. Biochar carbon is resistant to decomposition and is known to last for hundreds of years. We are interested in knowing whether this is also true for associated changes in soil properties and grain yield.
4) To communicate the research and disseminate findings through an effective education and outreach plan.
- Timeline (200 words)
|
Objectives |
Project activities |
|
2019/20 Crop Year |
2020/21 Crop Year |
2021/22 Crop Year |
|||||||||||||||||||||||||||||
|
Apr to Jul |
Aug |
Sep |
Oct |
Nov |
Dec |
Jan |
Feb |
Mar |
Apr |
May |
Jun |
Jul |
Aug |
Sep |
Oct |
Nov |
Dec |
Jan |
Feb |
Mar |
Apr |
May |
Jun |
Jul |
Aug |
Sep |
Oct |
Nov |
Dec |
Jan |
Feb |
Mar |
||
|
Objectives 1-3 (Research) |
Biochar and supply procurement |
x |
|
|
|
|
|
|
|
|
|
|
x |
x |
|
|
|
|
|
|
|
|
|
|
|
|
|
|
|
|
|
|
|
|
|
Experimental layout |
|
x |
|
|
|
|
|
|
|
|
|
|
|
x |
|
|
|
|
|
|
|
|
|
|
|
|
|
|
|
|
|
|
|
|
|
Soil sampling and analyses |
|
x |
x |
x |
x |
|
|
|
|
|
|
|
|
x |
x |
x |
x |
x |
|
|
|
|
|
|
|
x |
x |
x |
x |
|
|
|
|
|
|
Biochar application |
|
|
x |
|
|
|
|
|
|
|
|
|
|
|
x |
|
|
|
|
|
|
|
|
|
|
|
|
|
|
|
|
|
|
|
|
N-application and wheat planting |
|
|
|
x |
|
|
|
|
|
|
|
|
|
|
|
x |
|
|
|
|
|
|
|
|
|
|
|
x |
|
|
|
|
|
|
|
Wheat emergence & pop count |
|
|
|
x |
|
|
|
|
|
|
|
|
|
|
|
x |
|
|
|
|
|
|
|
|
|
|
|
x |
|
|
|
|
|
|
|
Bundle harvest & plant analyses |
|
|
|
|
|
|
|
|
|
|
|
|
x |
x |
x |
|
|
|
|
|
|
|
|
|
x |
x |
x |
|
|
|
|
|
|
|
|
Combine harvest & yield determination |
|
|
|
|
|
|
|
|
|
|
|
|
x |
x |
x |
|
|
|
|
|
|
|
|
|
x |
x |
x |
|
|
|
|
|
|
|
|
Objective 4 (Outreach) |
Newsletters, extension articles, & website publications |
|
|
|
|
|
|
|
|
x |
x |
x |
|
|
|
|
|
|
|
|
|
x |
x |
x |
|
|
|
|
|
|
|
|
|
x |
|
Radio advertisement & interview |
|
|
|
|
|
|
|
|
|
x |
x |
|
|
|
|
|
|
|
|
|
|
x |
x |
|
|
|
|
|
|
|
|
|
|
|
|
Farm tours |
|
|
|
|
|
|
|
|
|
|
x |
x |
|
|
|
|
|
|
|
|
|
|
x |
x |
|
|
|
|
|
|
|
|
|
|
|
CBARC Field Day |
|
|
|
|
|
|
|
|
|
|
|
x |
|
|
|
|
|
|
|
|
|
|
|
x |
|
|
|
|
|
|
|
|
|
|
|
Webinar publication |
|
|
|
|
|
|
|
|
|
|
|
|
|
|
|
|
|
|
|
|
|
|
|
|
|
|
|
|
|
x |
|
|
|
|
|
PNDSA Growers’ Conference |
|
|
|
|
|
|
|
|
|
|
|
|
|
|
|
|
|
|
|
|
|
|
|
|
|
|
|
|
|
|
x |
|
|
|
|
Journal article publication |
|
|
|
|
|
|
|
|
|
|
|
|
|
|
|
|
|
|
|
|
|
|
|
|
|
|
|
x |
x |
x |
x |
x |
x |
|
|
Annual reports (WSARE) |
|
|
|
|
|
|
|
|
|
x |
|
|
|
|
|
|
|
|
|
|
|
x |
|
|
|
|
|
|
|
|
|
|
x |
|
Cooperators
- - Producer
- - Producer
- - Producer
- - Producer
- - Producer
Research
Biochar was evaluated in Winter Wheat-Summer Fallow (WW-SF) systems at five farms located within a 100-mile radius of CBARC in northeast Oregon. Soils are Walla-Walla silt-loam soils (coarse-silty, mixed, mesic Typic Haploxeroll) and precipitation ranges from 12 to 16 inches. Rogue Biochar, produced by Rogue Biochar Solutions (White City, OR), was applied (0 vs. 2.5 tons/a) on four farms, two in a 16-18 inch precipitation zone and 2 in a 10-12 inch precipitation zone during the 2019-20 crop year. The other cooperator still had hay in the field he had chosen for the experiment, and biochar was applied to his field in the spring of 2022 after the removal of the hay (2 years later). The biochar was produced from Douglas Fir, and its analysis shows that it had a pH of 9.48, a carbon content of 83.9%, and a liming value of 10 (Rogue Biochar IBI Biochar Report #2 2020). No more biochar was applied on the farms, but wheat yield and soil properties data were monitored for two years after application to determine biochar effects and how long those effects persist. We obtained yield data in the 2019-20 and 2021-22 crop years. The 2020-21 crop year was a fallow year. Soil was sampled and sent for analysis after the 2021-22 wheat harvest to determine how biochar had changed soil chemical properties.
Objective 1 (Agricultural professionals): To evaluate the impacts of biochar amendments on SOC, pH, active C, mineralizable C and N, bulk density, water holding capacity (WHC), electrical conductivity (EC), cation exchange capacity (CEC), base saturation, N, P, K, Ca, Mg, S, Na, Al, Fe, Mn, and Zn.
At the end of the experiment in 2022, 20 soil samples were collected from each control and biochar plots using a hand probe to a depth of 15 cm, air-dried and ground to pass a 2 mm sieve. The soil samples were sent to Best Test Analytical Services Labs LLC (Moses Lake, WA) for analysis. The samples were analyzed for moisture, Bulk Density, Electrical Conductivity (EC), Ammonium-nitrogen (NH4-N), Nitrate-nitrogen (NO3-N), Bray Phosphorus (P), Olson Potassium (K), Sulfate-sulfur (SO4-S), Chlorine (Cl), Boron (B), Zinc (Zn), Manganese (Mn), Copper (Cu), Iron (Fe), Molybdenum (Mo), Sodiun (Na), Potassium (K), Calcium (Ca), Magnesium (Mg), Total bases, pH, Aluminum (Al), Cation Exchange Capacity (CEC), Total Nitrogen (N), and Total Carbon (C). A statistical analysis (Anova) was conducted to determine if biochar changed the soil properties and if these changes influenced wheat grain yield (correlation analysis).
Objective 2 (Agricultural professionals & producers): To investigate if soil improvements (Objective 1) due to biochar amendments increase wheat emergence, biomass accumulation, wheat N use efficiency, water use efficiency, and grain yield.
Wheat was planted and managed by producers in in . Wheat emergence will be determined when 50% of wheat has emerged. Plant population will be determined by counting plants in 10 random 1-m long crop-rows within each plot about two weeks after emergence. At physiological maturity, wheat bundles will be taken from 6 random 1-m quadrats within each plot by cutting wheat at the crown level and weighing to obtain total aboveground dry-matter yield (TDM). Heads will be cut off and counted to determine heads m-2. Heads will then be thrashed and grain weighed to determine total grain weight (GM). Harvest index will be calculated by dividing GM by TDM. The rest of the wheat will be combine-harvested by the producer to obtain wheat grain yield per plot. Subsamples of wheat straw and grain will be ground to pass 0.5 mm sieve and analyzed for tissue-N by dry combustion method [8]. Total crop N uptake is calculated as the summation of grain-N and straw-N [35]. Crop water use efficiency is calculated as the ratio of grain yield and growing-season evapotranspiration [36]. Regression models will be computed to determine the biochar type that increased wheat N and water use efficiency and grain yield.
Objective 3 (Agricultural professionals & producers): To determine if biochar impacts persist beyond the first year. Biochar carbon is resistant to decomposition and is known to last for hundreds of years. We want to learn whether this is true for associated soil properties and grain yield changes.
Wheat grain harvested in the 2019-20 and 2021-22 crop-years to determine if the biochar effects, if any, lasted more than a season. The 2020-21 crop year was a fallow year. We will solicit more grant funding from other funding institutions to continue monitoring the yields after the end of this project. Biochar effects are supposed to last for more than two years based on our studies.
Objective 4 (Agricultural Professionals & producers [See Educational Outreach Plan and Materials section]. To communicate the research and disseminate findings through an effective education and outreach plan.
The plan was to encourage growers to tour each other's farms and discuss results. We had tours of the farms many times but could not get all the farmers together on a tour. So it was mostly researchers touring the sites and discussing with each farmer. I made two presentations at the Pendleton Field day (Columbia Basin Agricultural Research Center) and one at the Resource Advisory Councils Meeting in John D. The presentations encompassed all the biochar research we are doing including this present study. The results from this experiment alone were not yet certain and it made sense to present all the work on biochar. Here is the link to the presentation (Slide 43 and 44:Biochar A Win-Win for Agriculture, Forests, and Climate RAC and CBARC
Results and Discussion
2019-20 Crop Year
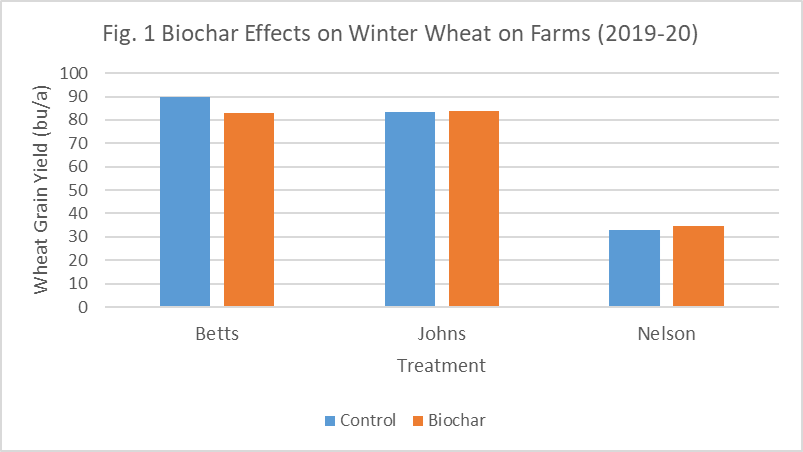
Wheat yields from the 2019-20 crop year are shown in Figure 1. Farms 1 and 2 are located in the 16-18 inch precipitation zone, and farm 3 is in the 10-12 inch precipitation zone. The results show that winter wheat yield was higher in farms in the higher precipitation zones than in the farm in the lower precipitation zone. However, there were no significant differences between control (0 biochar) and biochar (2.5 ton/a) treatments at all farms, suggesting that maybe the 2.5 tons/a of biochar was insufficient to influence grain yields. In previous work, we obtained significant yield increases when biochar was applied at 5 and 10 tons/a. In this study, we decided to apply the lower rate to reduce biochar costs but based on these preliminary results, 2.5 tons/a may not be enough to increase wheat yields. We may increase the rate to 5 tons/a depending on the availability of biochar in our next experiment. We did not have any results from the Hartley because the field we were supposed to apply biochar was still in alfalfa.
Fig. 1.
2021-22 Crop Year
The 2020-21 crop year was fallow, and no yields were obtained. In the 2021-22 crop year, we planted winter wheat at the Betts, Nelson, and Johns farms and spring wheat at the Hartley farm. Figure 2 shows the effects of biochar on spring wheat at the Hartley farm. Biochar increased wheat yields, but the increase was not significantly different from the yield obtained from the control plots. Figure 3 shows the effect of biochar on winter wheat yields at the Johns and Nelsons farms. There was no significant effect of biochar on winter wheat grain yields. However, biochar decreased grain yields at the Johns farm, a high rainfall site, and slightly increased yields at the Nelson farm, the drier site. No yields were obtained from Betts farm.
Fig. 2 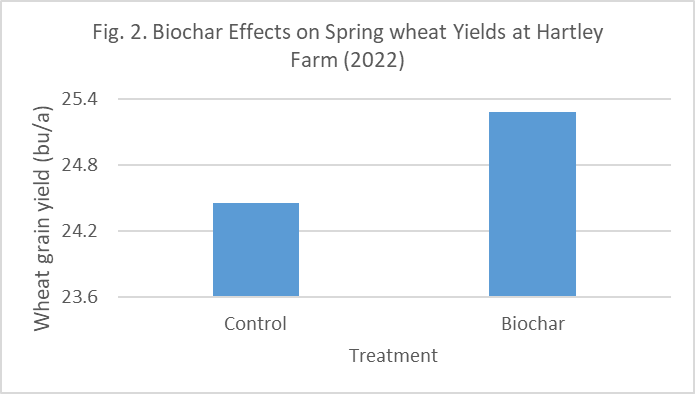
Fig 3. 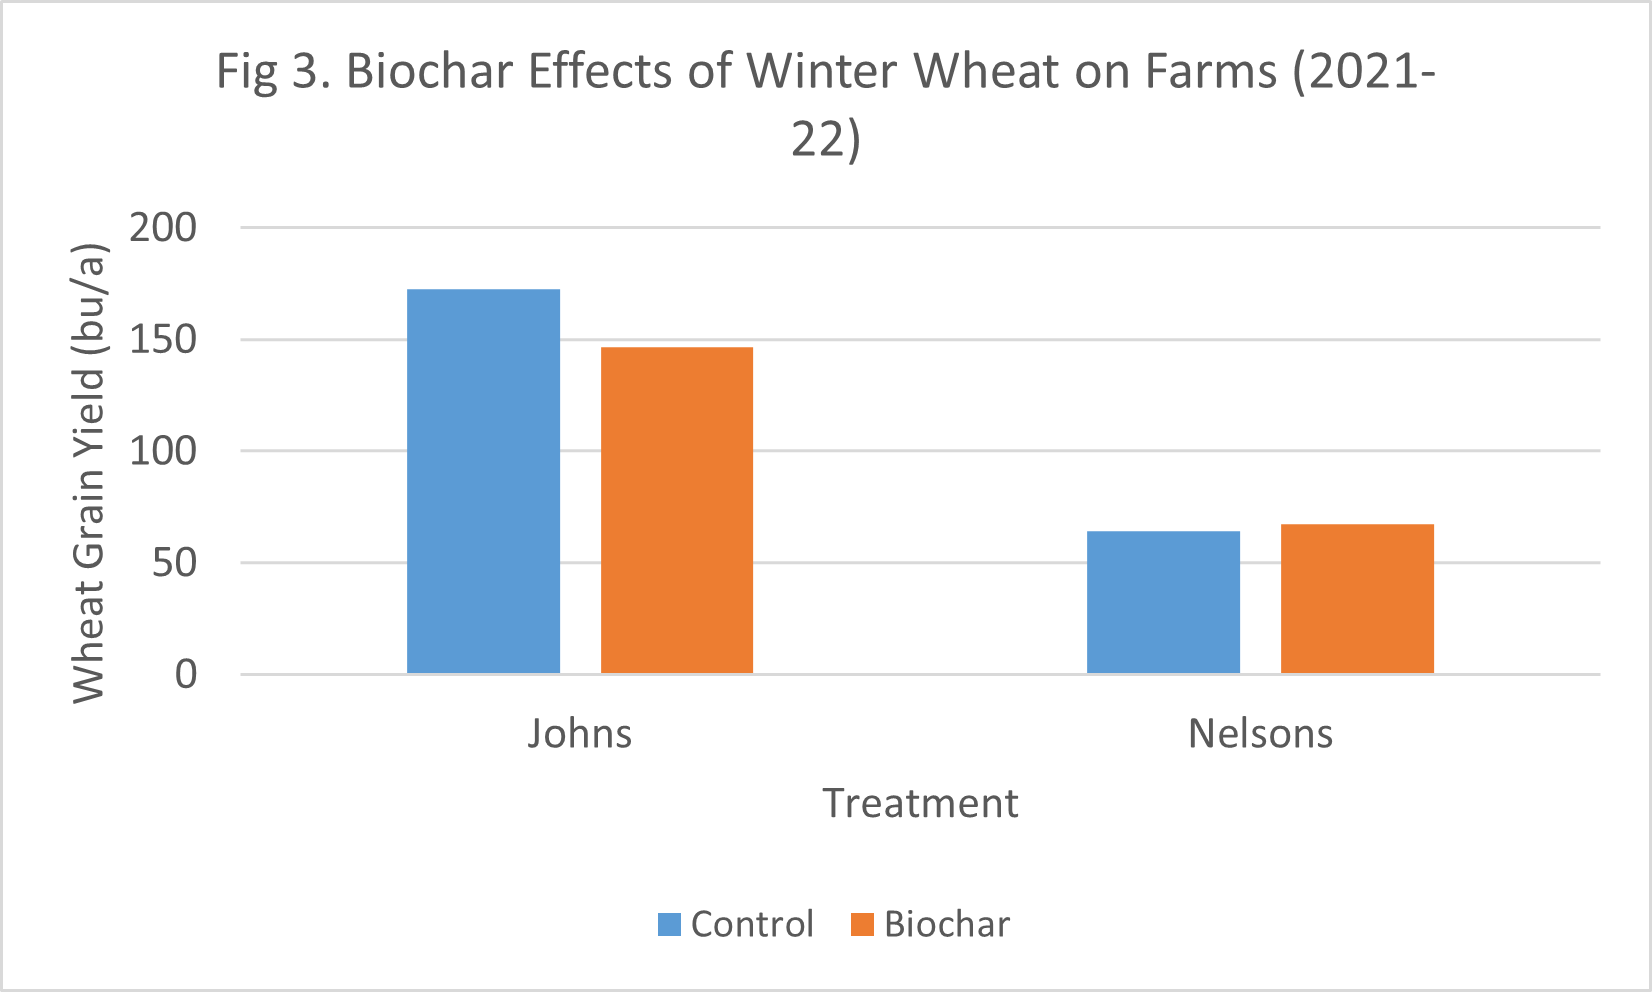
Fig 4. Yield map showing the biochar plot.
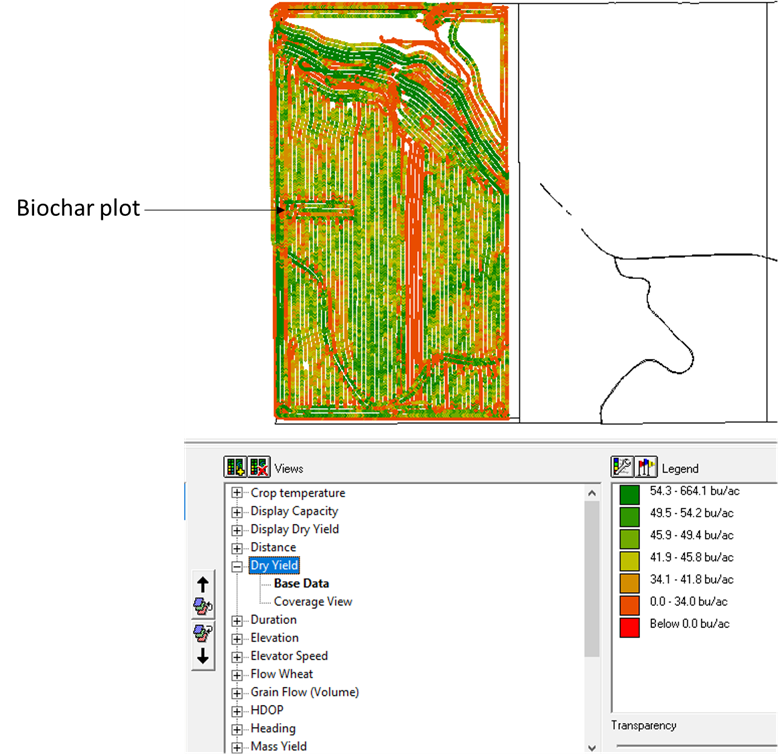
The yield map (Fig. 4) clearly shows slightly raised wheat grain yield on the biochar plot.
Biochar Effects on Soil Properties
Table 2 shows the effect of biochar on soil properties. Biochar was applied in 2019, and soil samples were analyzed in 2022. Data from all sites were analyzed together using the sites as reps. Overall, no significant differences existed between control and biochar plots on all the soil parameters measured.
Table 1. Biochar effects on soil properties.
|
Control |
Biochar |
Units |
|
|
Moisture |
0.5645 |
0.637 |
% |
|
Bulk Density |
1.3315 |
1.3615 |
g/ml |
|
EC |
0.2285 |
0.1695 |
dS/m |
|
OM |
2.25 |
2.32 |
% |
|
NH4-N |
1.31 |
1.14 |
ppm |
|
NO3-N |
10.9 |
9.2 |
ppm |
|
Bray P |
31.4 |
33.5 |
ppm |
|
Olson K |
460.4 |
454.2 |
ppm |
|
SO4-S |
4.85 |
3.95 |
ppm |
|
Cl |
6.3 |
4.3 |
ppm |
|
B |
0.33 |
0.29 |
ppm |
|
Zn |
0.57 |
0.58 |
ppm |
|
Mn |
6.97 |
7.01 |
ppm |
|
Cu |
1.13 |
1.13 |
ppm |
|
Fe |
40.3 |
42.1 |
ppm |
|
Mo |
0.01 |
0.01 |
ppm |
|
Na |
0.1 |
0.04 |
meq/100g |
|
K |
1.18 |
1.16 |
meq/100g |
|
Ca |
8.9 |
8.4 |
meq/100g |
|
Mg |
3.17 |
2.78 |
meq/100g |
|
Total Bases |
13.4 |
12.4 |
men/100g |
|
pH |
6.3 |
5.9 |
-log[H+] |
|
Al |
4.35 |
4.15 |
ppm |
|
CEC |
16.6 |
15.9 |
meq/100g |
|
Total N |
0.17 |
0.17 |
% |
|
Total C |
1.14 |
1.14 |
% |
Conclusions
We envisaged that applying biochar would increase some soil parameters, particularly total carbon, given that the biochar applied had about 84% C. We also expected using alkaline biochar (pH of 9.5) to increase soil pH, but no changes in soil pH were observed. The lack of response of all the measured soil parameters indicates that the 2.5 tons per acre biochar application rate was too low. As a result, the applied biochar rate did not influence grain yields. However, there was a slight increase in yield at Hartley farm in the spring of 2022 and at Nelson farm in both crop years. This slight increase is evident on the yield map. Maybe, biochar is more effective in a shorter growing season (spring) as at the Hartley farm or under a stressful environment (drier conditions) as at the Nelson farm. Our previous work shows that soil parameters improved and wheat and pea yield increased at 5 tons per acre biochar application rate. In trying to reduce costs, we decided to reduce the rate to 2.5 tons per acre for this experiment, but as the results show, this rate was probably too low to improve soil parameters and wheat grain yield. More experimentation with higher biochar rates is required to determine the optimum biochar rates for wheat on eastern Oregon wheat farms.
Link to full report: Biochar Final Report 2019-22
Research outcomes
Education and Outreach
Participation summary:
We did not conduct outreach as planned because the first year's results coincided with the COVID pandemic. Oregon State University had very strict COVID protocols that prohibited us from visiting the growers.
At the end of the 2021-2022 crop season we presented the results of the biochar work at the Pendleton Field Day in June 2022 and at a joint John Day/Snake Resource Advisory Councils Meeting and the SE Oregon Resource Advisory Councils Meeting, October 20, 2022. This presentation covered all the biochar work were were doing.
Link to presentation (page 43 and 44) : Biochar A Win-Win for Agriculture, Forests, and Climate RAC and CBARC
We did outreach via presentations at the results of the biochar work at the Pendleton and Moro Field Days in June 2022 and at a joint John Day/Snake Resource Advisory Councils Meeting and the SE Oregon Resource Advisory Councils Meeting, October 20, 2022. This presentation covered all the biochar work were were doing.
Link to presentation (page 43and 44): Biochar A Win-Win for Agriculture, Forests, and Climate RAC and CBARC
Education and Outreach Outcomes
No recommendations yet. Based on the results, the biochar rate of 2.5 tons per acre was not sufficient to change soil properties and increase wheat grain yields. We plan to increase the biochar rates to 5 tons per acre in our next experiments