Final report for OW21-368
Project Information
The biggest opportunity for Western Sugar Cooperative (WSC) growers to improve environmental outcomes and profitability is to reevaluate nutrient recommendations for sugarbeet. This project will create a new nitrogen model that does not impede yield but reduces reliance on exogenous fertilizers. This improves farm economics for the grower by improving beet quality and sugar extractability while reducing input costs. Environmental benefits from this project are reduced greenhouse gas (GHG) emissions and eutrophication, both of which are currently disproportionate for Western Sugar compared to less nitrogen-heavy beet production regions in the United States. Currently, nearly fifty percent of the total GHG emissions associated with WSC beet sugar production is a result of the manufacturing and application of nitrogenous fertilizers. This project partners WSC technical leadership with a diverse set of five farmers across Montana, Colorado and Nebraska. Farm-scale, side-by-side comparison of standard nitrogen rates versus scientifically-justified reduced rates will be conducted during the 2021 crop year. Impacts to the environment and crop productivity will be assessed using: 1) soil and water sampling/analysis, 2) petiole testing, 3) nutrient use efficiency and 4) root yield, sugar content and sugar loss to molasses at harvest. Significant evidence gathered from local, small-scale field research and comparison to other production regions suggest this project will be a success. Since WSC is wholly grower-owned, there is a direct educational pipeline from the trusted technical expert to the grower such that the results and benefits of this project will be shared and adopted Cooperative-wide.
- Create new and improved nutrient stewardship Best Management Practices (BMPs) for Western Sugar Cooperative sugarbeet growers.
- Reduce the environmental impacts of sugarbeet cultivation in the Rocky Mountain West, including reduced greenhouse gas emissions and eutrophication potential from beet sugar production.
- Improve farm economics by reducing input costs and increasing sugar yield/extractability
- Educate the broader Cooperative membership on the results of the project and facilitate the broad-spectrum adoption of the BMPs.
The timeline for project activities is outlined in the attached Gantt chart. All items that will be executed by Western Sugar Cooperative technical staff are highlighted in yellow. Those executed by a commercial services lab, American Agricultural Laboratory, are highlighted in green. Those executed by the farmer cooperator are highlighted in orange. Briefly, in early April, pre-planting soil and water sampling must be completed and analyzed so that the standard and reduced fertilizer rates can be applied prior to planting. Throughout the summer, petiole sampling will be conducted by the Western Sugar technical staff to monitor uptake of the fertilizer, at greater frequency in June and July and lower frequency in August through October. In October, the sugarbeets will be harvested and post harvest soil samples will be collected and analyzed. The farmer will be responsible for transmitting yield and quality data to the Western Sugar technical staff, such that data analysis can be initiated in the fall and completed in the winter. The data analysis will allow for grower communications to be developed and disseminated through electronic and personal communications during the winter. Early the following spring, Western Sugar technical staff will survey the grower base about their plans on adopting the reduced rate recommendations in 2022 or no later 2025 and to what percentage of acreage the new recommendation will be applied.
Cooperators
- - Producer
- - Producer
- - Producer
- - Technical Advisor
- - Producer
- - Producer
Research
The methods described below will allow the project to enable:
1. Creation of new and improved Best Management Practices (BMPs) for nutrient stewardship;
2. Education of the broader cooperative grower base and facilitation of broad-spectrum adoption of BMPs;
3. Reduction of environmental impacts of sugar beet production in the Rocky Mountain West;
4. Improvement of farm economics by reducing input costs and increasing sugar yield and extractability.
Farm selection
Farmer collaborators were selected from a variety of production regions with various irrigation methods, irrigation sources and soil types. This will help capture the diversity of production conditions across WSC. Growers will select a field from their rotational production that is most uniform. The selected field will be split in two equal halves, with each half of the field being independently contracted with the cooperative to ease downstream data tracking (yield and quality). One half of the field will be treatment Y, the other treatment YR. The minimum size acceptable for this study is 80 acres (e.g. 40 acres per treatment).
Soil sampling
Soil samples will be collected at one foot intervals down to four feet using a truck-mounted, gas-powered auger owned by WSC. One sample will be collected for every ten acres subjected to treatments Y and YR. Samples will be pooled, thoroughly mixed and sent to American Agricultural Laboratory (McCook, NE) for bulk analysis. Samples will be analyzed for the following: pH, nitrate, total nitrogen, ammonia, sulfur, zinc, calcium, magnesium, sodium, cation exchange capacity, copper, iron, manganese, boron, electrical conductivity, organic matter, phophosrus and potassium. A Haney test will also be performed for all samples submitted. Samples will be collected prior to planting/spring fertilizer application and again within one month of harvest to determine residual nitrogen levels.
Accounting for Outside Nitrogen Contributions
It is possible that plant-available nitrogen may be supplied to the crop through irrigation water applied during the season. To account for those contributions, water samples will be collected from all irrigation sources supplying the six locations no fewer than three occasions prior to the start of the production season. Samples will be collected using sterile bottles supplied by the laboratory conducting analysis. The tubes will be supplied with the required sulfuric acid contained within the collection vessel. Three samples per location per testing time will be collected and analyzed individually. All samples will be shipped to be received by the laboratory within 24 hours of collection. Nitrate concentrations will be determined by American Agricultural Laboratory (McCook, Nebraska).
Field Treatment
The design of this project needed to be thoughtful and flexible to allow for easy implementation by the farmer cooperator and adaptive to a wide-array of production conditions. Instead of developing a standard control application rate, growers will be allowed to use their own standard applications rates as the control (Y); for most that rate will be as follows:
Control (Y)
(8 lbs N*expected yield in tons)-[(30*OM%)-(residual N lbs/acre)]=application rate in lbs/acre
After careful consideration between reduced rate, linear models and static models, a modified static model was selected for evaluation. Growers in Minnesota and North Dakota have had great success with a static rate of 100-125 lbs/acre,(7) but they have substantially higher organic matter than in the Rocky Mountain West. Therefore WSC growers would have roughly 100 lbs less nitrogen available to the crop through an organic matter credit. Consequently, a reduced rate treatment (YR) will be calculated through the following static model starting with a 200 lb static rate minus appropriate credits:
Reduced Rate (YR)
200 lbs N-[(30*OM%)-(residual N lbs/acre)] = application rate in lbs/acre
If a farm selected for this comparative study is found to have significant nitrogen within their irrigation supply, additional direct credits will be subtracted from the 200 lb static rate alongside credits for organic matter and residual nitrogen. As an example, for a farmer with a 1.5% organic matter and 35 pounds of residual nitrogen expecting a 33 ton/acre yield, Y would be 184 lbs/acre and YR would be 120 lbs/acre. If said farmer had an additional 15 pounds of nitrogen delivered through irrigation, YR would be 105 lbs/acre. All soil analysis reports and application rates (Y and YR) will be archived and documented by the technical expert.
Documenting Crop Response to Fertilizer Treatments
At a minimum, for most widespread BMP adoption, it must be demonstrated that a reduction in nitrogen application does not impact resultant yield. Ideally, the project results would also demonstrate reduced fertilizer rate improves beet quality in terms of sugar (% sucrose) and impurity content [sugar loss to molasses (SLM): amino-nitrogen, sodium and potassium]. These data combined, allow for the calculation of land use efficiency [e.g. increased sugar yield per acre; tons/acre*(% sugar content-SLM)]. These measurements are routine to WSC and therefore will easily be applied to this project. None of the fields utilized in this study qualify for early harvest and must be dug during regular harvest.
Unlike combines, most beet harvesters do not have the capacity for real-time yield monitoring, therefore yield in tons per acre will need to be calculated at the point of delivery through careful truck segregation, accomplished by having the two halves of the selected field individually contracted with WSC. This will enable sugarbeets from treatment Y and YR to be loaded into separate trucks; each will be individually weighed upon delivery to the pile grounds (local beet receiving site with scale and load tracking capability) by measuring the weight of the incoming and outgoing trucks over a state-verified, calibrated scale, minus the weight of any non-beets (e.g. tare dirt) weighed by the sugarbeet piler. Yield will be determined by taking the weight of all trucks delivered divided by the acreage upon which the treatment was applied.
On roughly thirty-three percent of the loads delivered, subsamples of beet roots (approximately 25 lbs each) will be randomly collected off of the piler and sent to a WSC tare house (Gering, Nebraska or Billings, Montana) for quality analysis. Briefly, at the tare house, beets are washed, ground and subject to near infrared spectrophotometry using a bench-mounted Perten DA 7250 NIR Analysis System to determine sugar content and SLM.
Determining Nutrient Use Efficiency
Apparent nutrient use efficiency will be evaluated through a variety of means using industry accepted methodologies described in Dobermann, 2007. The base data necessary for the various calculations include the following:
- units of productivity (PY and PYR, e.g. LUE) for treatments Y and YR expressed in sugar yield/acre, respectively
- total amount of fertilizer applied (F)
- residual N concentration at the point of harvest (FR)
- total N uptake in above ground biomass (U)
Units of productivity will be collected as described above in "Documenting Crop Response to Fertilizer Treatments". Amount of fertilizer applied will be documented as described above in "Field Treatments". Residual nitrogen concentration at the point of harvest will be determined from the results of the soil analysis of the samples collected within one month of harvest as described above in "Soil Sampling". Nitrogen uptake in above ground biomass will be determined through petiole sampling and analysis for nitrate. Samples will be collected weekly June 1st through July 10th (July 10th represents the last date contractually growers are allowed to add fertilizer to their sugarbeets) then monthly (August through October) from treatments Y and YR according to protocols outlined by the analyzing lab (American Agricultural Laboratory, Inc., McCook, Nebraska, amaglab.com). Briefly, 25 random petioles from the most recent mature leaf will be collected from each treatment and each site. Those samples will be pooled by treatment and site into a paper bag, and staple sealed for overnight shipment for analysis.
To contextualize the standard (Control, Y) and reduced rate (YR) treatments, the data points collected will be subject to the following analyses using formulas from Dobermann 2007.(16)
Agronomic efficiency
agronomic efficiency = PY/F versus PYR/F
Agronomic efficiency will demonstrate sustainable intensification if the hypothesis is correct and there is improved land use efficiency when the reduced nitrogen rate leads to improved quality and maintained yield potential.
Apparent nutrient recovery efficiency
apparent nutrient recovery efficiency = U/F for Y and YR versus FR/F for Y and YR
The apparent nutrient recovery will demonstrate potential excess application that may contribute to detrimental environmental outcomes in the form of eutrophication and nitrification/denitrification potential.
Calculating Financial Benefits of Reduced Nitrogen Rates
Some fairly straightforward calculations will be applied to demonstrate the potential for improved profitability using reduced nitrogen fertilizer rates. A simple calculation of potential net returns would be a strong motivator for a grower to adopt the proposed modified static model. Briefly, for every percent increase in sugar content, a grower can expect three dollars more per ton in payment from WSC for his or her beets. Additionally, for every pound reduction in nitrogen application, the grower will save forty cents per acre. Therefore potential net returns will be calculated as follows:
Impact to net returns
net returns Y = [sugar content (Y)*tons (Y)*$5]-[$0.40*F(Y)] versus
net returns YR = [sugar content (YR)*tons(YR)*$5]-[$0.40*F(YR)]
Calculating Environmental Benefits of Reduced Nitrogen Rates
Having conducted a comprehensive life cycle and environmental impact assessment of WSC production practices in 2017,(14) WSC now has access to models for calculating reduction eutrophication potential and GHG emissions as a result of reduced nitrogen-based fertilizer application based on 2006 IPCC standards. This combined with the aforementioned calculations of improved land use efficiency, will allow WSC to determine if reduced application of nitrogen-based fertilizers leads to sustainable intensification of current production practices.
GHG emissions
tons of carbon dioxide equivalents emitted (Y) = manufacturing burden [(0.00314 tons CO2 eq*F(Y)] + application burden [(0.00318 tons CO2 eq*F(Y)]
versus
tons of carbon dioxide equivalents emitted (YR) = manufacturing burden [(0.00314 tons CO2 eq*F(YR)] + application burden [(0.00318 tons CO2 eq*F(YR)]
Eutrophication potential (impacts to water quality)
eutrophication potential (Y) = 0.0000235 *F(Y)
versus
eutrophication potential (YR) = 0.0000235 *F(YR)
Field selection and soil sampling
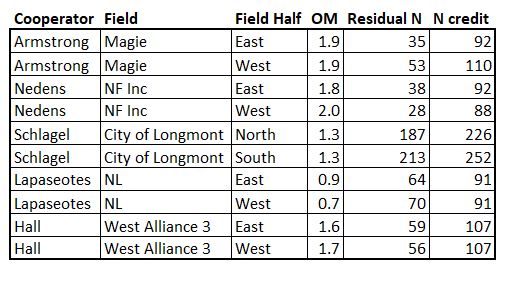
Working with five farmer cooperators, five fields were selected across three states: Nebraska (3), Montana (1) and Colorado (1). Soil was sampled to a depth of four feet in one-foot intervals from 25 unique sampling points on each half of the pivot (50 total samples per field). For each side, the samples were composited by depth and sent for analysis (four samples per half: 1 foot, 2 foot, 3 foot and 4 foot). The fields were relatively even in terms of residual nitrogen and organic matter (Table 1). All other macro- and micronutrients were analyzed and no significant differences were found (data not shown).
Table 1. results of spring soil analysis by site
There were two major take-aways from the spring soil sampling: 1) there are significant differences in soil sample results depending on the approach used during soil sampling and 2) contextualizing Haney test results (especially mineralization potential) will require additional time and investment. In two instances, the residual nitrogen levels obtained through the cooperators crop consultant varied substantially from the results obtained from internal sampling. Upon inquiry, it was discovered crop consultants may have only sampled from one or two spots within the field. Therefore one component of the educational materials prepared from this study included the importance of rigorous soil sampling; models are only as good as the data being fed into the system. As partnerships with customers interested in supporting carbon reduction efforts within the cooperative are developed, incentives to cover proper soil sampling will be identified as a potential route to removing barriers to adoption.
Fertilizer application
Using the soil sample data collected, the farmers were instructed to follow their standard methods for calculating fertilizer needs for their half of the field (designated "control" half of field). Reduced rates were calculated by the Chief Scientist and communicated out to the cooperators (designated "reduced rate" half of the field). In some instances, the farmer cooperators found the reduced rate to be too risky, so compromise was reached on a level all parties felt would be meaningful. Application rates and timing were recorded (Table 2).
Table 2. application rates and timings for each treatment and field
| Cooperator | Field | Field Half | Treatment | N applied (lbs) | N credits (lbs) | Total N (lbs) | Application method |
| Armstrong | Magie | East | Reduced Rate | 137 | 92 | 229 | 1 application-May |
| Armstrong | Magie | West | Control | 167 | 110 | 277 | 1 application-May |
| Nedens | NF Inc | East | Control | 186 | 92 | 278 | 2 applications-April & June |
| Nedens | NF Inc | West | Reduced Rate | 116 | 88 | 204 | 2 applications-April & June |
| Schlagel | City of Longmont | North | Control | 140 | 252 | 392 | 1 application-April |
| Schlagel | City of Longmont | South | Reduced Rate | 0 | 226 | 226 | 0 application |
| Lapaseotes | NL | East | Reduced Rate | 92 | 91 | 183 | 1 application-April |
| Lapaseotes | NL | West | Control | 152 | 91 | 243 | 2 applications-April & June |
| Hall | West Alliance 3 | East | Reduced Rate | 98 | 107 | 205 | 1 application-April |
| Hall | West Alliance 3 | West | Control | 170 | 107 | 277 | 2 applications-April & June |
The reduced application rates were close to the targeted application rates with the new model and averaged a 27% reduction in nitrogen application across all sites with the highest reduction at 62% and the lowest at 17%.
One facet of this project was to understand whether irrigation water was contributing any nitrogen during the growing season. In Montana and Colorado, the nitrate level was below the limit of detection (<0.33 mg/L) suggesting the surface waters used for irrigation contain little to no nitrogen (data not shown). In Nebraska, detectable levels were found for all irrigation samples, ranging from 2.6 mg/L to 17.10 mg/L. Irrigation rates ranged from 16-20 acre inches which would deliver anywhere from 0.9-77 lbs of additional nitrogen throughout the season.
In season nutrient use
In season petiole sampling tends to be very time intensive and expensive, therefore it is not widely used within Western Sugar Cooperative to determine nutrient availability in season. During this study, petiole samples were collected weekly from roughly 40 to 60 days post planting through to 100 days post planting, then sampled monthly until harvest. The first two petiole samples included all macronutrients to ensure the only difference in nutrient uptake was nitrogen. No differences in any other macronutrient was found (data not shown). Unfortunately, petiole sampling in season provided very little value in determining whether adequate nitrogen or too much nitrogen was present in the system, since the values varied widely field to field (Figure 1A-E).
Figure 1. Petiole sampling results taken from all five fields within the growing season. There was substantial variability between locations in terms of total nitrogen present. In comparison to final yield results, these data did little to indicate when an excess of nitrogen was applied, or when yield losses were eminent. The City of Longmont field belonging to Paul Schlagel ended up having the highest yield and quality, but petiole samples indicated it was nitrogen deficient all season (B) when results were assessed versus the sugarbeet standards developed by American Ag Lab. Alliance West 3 belonging to Kevin Hall was at or above normal all season (D) but incurred significant yield losses for the reduced rate treatment. NF Inc belonging to Brett Nedens also had significant yield losses, but the petiole results hovered at or near normal all season for both treatments (A).
It had been many years since petiole sampling had been evaluated within Western Sugar for any predictive measures. Historically it had only been used to predict sugar content in the final crop. Therefore, re-evaluating the process for determining nutrient use efficiency seemed like a valid component to this project. Unfortunately, based on cost, time, and lack of efficacy, this practice could not be recommended for use by the grower base.
Crop performance
Ideally, a reduction in nitrogen would result in yield maintenance and a boost in sugar beet quality and sugar extractability. That in combination with reduced fertilizer inputs should increase the growers net revenue. All growers saw increased quality (higher sugar content and/or lower SLM) with the reduced rate treatment. Unfortunately, the quality gains were not enough for Nedens and Hall to offset the two and three ton yield loss, respectively (Table 3). Although Armstrong and Lapaseotes both realized increase quality and revenue, both also had increased yields which would not be expected with a reduced nitrogen application. Unfortunately, there were outside variables impacting these two fields that confounded the results. Lapaseotes had varying rhizoctonia pressure and Armstrong had variable weed and volunteer corn pressure along with some disease. Therefore, even though the quality results fit the hypothesis of this study, the data was omitted from educational materials.
Table 3. yield, quality and revenue associated with reduced rate fertilizer applications
| Cooperator (treatment) | Yield (tons/acre) | Sugar Content (%) | SLM | Recoverable Sugar/Acre (lbs/acre) | Gross payment | Fertlizer cost (2021) | Fertilizer cost (2022) | Net Revenue (2021) | Net Revenue (2022) |
| Armstrong (control) | 30.7 | 18.8 | 1.31 | 10745 | $1,504 | $54.80 | $156.98 | $1,449.50 | $1,347.32 |
| Armstrong (reduced rate) | 31.9 | 19.2 | 1.31 | 11407 | $1,597 | $66.80 | $128.78 | $1,530.24 | $1,468.26 |
| Nedens (control) | 35.9 | 18.9 | 1.21 | 12701 | $1,778 | $74.40 | $174.84 | $1,703.80 | $1,603.36 |
| Nedens (reduced rate) | 33.5 | 18.9 | 1.20 | 11859 | $1,660 | $46.40 | $109.04 | $1,613.86 | $1,551.22 |
| Schlagel (control) | 37.1 | 17.7 | 1.15 | 12280 | $1,719 | $56.00 | $131.60 | $1,663.21 | $1,587.61 |
| Schlagel (reduced rate) | 37.1 | 18.8 | 0.93 | 13260 | $1,856 | $0.00 | $0.00 | $1,856.34 | $1,856.34 |
| Lapaseotes (control) | 26.4 | 16.8 | 1.34 | 8163 | $1,143 | $59.60 | $140.06 | $1,083.20 | $1,002.74 |
| Lapaseotes (reduced rate) | 28.4 | 16.9 | 1.28 | 8872 | $1,242 | $35.60 | $83.66 | $1,206.50 | $1,158.44 |
| Hall (control) | 33.2 | 18.2 | 1.13 | 11334 | $1,587 | $68.00 | $159.80 | $1,518.83 | $1,427.03 |
| Hall (reduced rate) | 30.0 | 18.2 | 1.00 | 10320 | $1,445 | $39.20 | $92.12 | $1,405.60 | $1,352.68 |
From the results, it appears the 200 pound maximum application rate was a bit too aggressive. Compared to the existing model, that rate would be a nearly 40% reduction in nitrogen application. The results from Schlagel suggest a slightly less aggressive static rate of 225 pounds could have merit. This would still be a roughly 25% reduction from current fertilizer recommendation models. After the fact, the timing of this project turned out to be opportune as fertilizer prices have more than doubled over the past calendar year. The results from this study in combination with the increased fertilizer price made the grower reception at educational outreach meetings very high for this concept. There will be a minimum of 44 growers participating in large-scale testing of the 225 pound rate during the crop year 2022.
Nutrient use efficiency
Following harvest, the sugar yield was analyzed against the total available nitrogen to determine agronomic efficiency. As the petiole sample results varied so widely, it was determined apparent nutrient recovery efficiency calculations would not be as valuable as initially planned, therefore that data is omitted. In all instances, the agronomic efficiency was improved at the lower rate as more pounds of sugar were produced per pound of available nitrogen. The fields averaged a 30% improvement in agronomic efficiency over the control with the exception of Paul Schlagel's which was an outlier at 87% improvement based on no exogenous application of nitrogen in this instance (Table 4).
Table 4. agronomic efficiency of nitrogen in terms of sugar production
| Cooperator (treatment) | Recoverable Sugar/Acre (lbs) | Total N available | Agronomic Efficiency |
| Armstrong (control) | 10745 | 277 | 39 |
| Armstrong (reduced rate) | 11407 | 229 | 50 |
| Nedens (control) | 12701 | 278 | 46 |
| Nedens (reduced rate) | 11859 | 204 | 58 |
| Schlagel (control) | 12280 | 392 | 31 |
| Schlagel (reduced rate) | 13260 | 226 | 59 |
| Lapaseotes (control) | 8163 | 243 | 34 |
| Lapaseotes (reduced rate) | 8872 | 183 | 48 |
| Hall (control) | 11334 | 277 | 41 |
| Hall (reduced rate) | 10320 | 205 | 50 |
Environmental impact assessment
As fertilizer comprises such a significant portion of the overall GHG emissions associated with beet sugar production for Western Sugar, it was a key target for continuous improvement goals. Using the date generated for the cooperative in a lifecycle assessment, the percent reduction in environmental burden associated with fertilizer application could be calculated (Table 5). Notably, in instances were sugar yield increased with reduced nitrogen application, the percent reduction was amplified.
Table 5. percent reduction in environmental burden associated with reduced fertilizer application
| Cooperator (treatment) | Recoverable Sugar/Acre (lbs) | N Applied (lbs) | GHG Emissions (lbs/lb of sugar produced) | Eutrophication Potential (per pound of sugar produced) | % Environmental burden reduction |
| Armstrong (control) | 10745 | 167 | 0.20 | 0.000727371 | |
| Armstrong (reduced rate) | 11407 | 137 | 0.15 | 0.000562054 | 22.72796982 |
| Nedens (control) | 12701 | 186 | 0.19 | 0.000685341 | |
| Nedens (reduced rate) | 11859 | 116 | 0.12 | 0.000457779 | 33.20418502 |
| Schlagel (control) | 12280 | 140 | 0.14 | 0.000533546 | |
| Schlagel (reduced rate) | 13260 | 0 | 0.00 | 0 | 100 |
| Lapaseotes (control) | 8163 | 152 | 0.24 | 0.000871457 | |
| Lapaseotes (reduced rate) | 8872 | 92 | 0.13 | 0.000485293 | 44.31242757 |
| Hall (control) | 11334 | 170 | 0.19 | 0.000701929 | |
| Hall (reduced rate) | 10320 | 98 | 0.12 | 0.000444419 | 36.68610123 |
Being able to show quantifiable reductions in carbon emissions has potential monetary value for the Western Sugar grower base. Future objectives include exploring USDA-COMET Planner models to quantify carbon reductions as sugar users have expressed interest in being able to track shifts in emissions throughout the supply chain.
One environmental impact unable to be quantified in this process was impact of nitrogen losses to groundwater quality. There were no suction lysimeters used in this study, so samples were not able to be collected. There were some vast differences in nitrogen application in certain fields (e.g. Schlagel 392 lbs versus 226 lbs), that interestingly did not result in higher residual nitrogen in the soil samples collected in the fall (74 pounds on both the control and reduced rate side of the field). No field showed significant differences (data not shown). Based on the quality differences in all samples, it is possible the sugarbeet is using all of the nitrogen present, however it is also possible the nitrogen, being water mobile, is migrating below the sampling depth (4 feet) or potentially into ground water. The irrigation samples collected in Nebraska all had detectable levels of nitrate, but it is not clear if that is from historical leaching for agricultural application or something native to the environment. Additional research is needed in this area.
Upon grant application, it was hypothesized showing higher residual nitrogen post harvest in instances of "overapplication" would be one more line of evidence to reduce fertilizer application. Although the fate of the "overapplied" product was not determined through the data collected in this study, growers were pleased to see in both the control and reduced rate, the nitrogen was not fully depleted from the soil, adding costs to the rotational crops. This data was still valuable to the growers for future decision making about adopting this lower application model.
Research outcomes
Education and Outreach
Participation summary:
Unbeknownst at the time of applying for this grant, the timing of this project was impeccable. With increasing supply chain pressures, fertilizer prices have more than doubled over the year this project was underway. That vastly increased grower interest in the outcomes and willingness to adopt changes to cultural practice, either because they can't afford standard rates of application or can't get ahold of adequate quantities. This balances out the natural desire to add more nitrogen to fields when crop prices are so high, as is the case in the current commodity market.
Numerous consultations were held throughout project execution. The Chief Scientist met with the grower cooperators two times each to select fields, review soil sampling data and develop the plan for "control" and "reduced rate" applications. Upon receipt of each petiole sample and water sample, each grower cooperator was provided with the data and any questions or concerns brought up to the Chief Scientist were addressed. The agriculturalists representing the grower-cooperators were also included in these data exchanges. Prior to harvest, the Chief Scientist met with the growers to understand their harvest schedule and plan post-harvest soil sampling. Following harvest, the Chief Scientist met with each farmer cooperator to gather their yield and quality data and provide them with their post-harvest soil analysis report. Once all the data was tabulated, the Chief Scientist met with the agriculturalists and farmer cooperators to review the data and make sure all application rates, timings and harvest data were correct.
One workshop/field day was hosted in June of 2021. Farmers from across Western Sugar Cooperative and the rest of the industry were invited to observe Paul Schlagel's field trial in conjunction with the American Sugarbeet Growers Association summer board meeting. Although minimal data was available at this point in the season (e.g. no yield and quality data), growers were invited to observe the field, learn the difference in treatments, and speculate as to which portion of the field had received 140 pounds of nitrogen and which portion had no fertilizer applied. None of the 35 farmers in attendance were able to visually discern a difference. This was followed by a short seminar and Q&A in Paul's shop on the mission of the project and how it would lend itself to on-farm carbon reduction and improved farm revenue. A brief overview of the NRCS-SARE program was also given to encourage producers to apply.
Another field day was hosted in July of 2021. Roughly a dozen farmers and twenty agricultural professionals employed by the cooperative were able to visit one of the locations in Nebraska closely located next to our in-field variety trials. Again, the mission of the project and its connection to carbon reduction and economic resiliency were highlighted for the attendees as no crop performance data was available at the time.
As the data came together in the fall (November 2021), the Chief Scientist presented raw data and initial conclusions with the ag staff (15 people) and farmer members (20) of the cooperative's Joint Research Committee (JRC). This meeting was used to generate a formal one-page educational flyer and short PowerPoint presentation. In January 2022, the JRC reconvened and the one-pager was provided to all attendees and the formal PowerPoint presentation was delivered.
The PowerPoint presentation was given at the Western Sugar Cooperative annual meeting (60 grower attendees), the Colorado Sugarbeet Growers annual meeting (30 grower attendees; February 2022), and the Nebraska Sugarbeet Growers annual meeting (70 grower attendees; February 2022). The presentation will also be given at the Montana and Wyoming Growers annual meetings in March 2022.
The one-page summary of the report was posted to the grower-facing intranet and the posting was communicated to the entire shareholder base via email.
Education and Outreach Outcomes
The biggest challenge with this project was having two of the five fields in the study have confounding variables influence the results. Even though the results of those two fields were favorable to the initial project hypothesis, they needed to be excluded from any public communications/grower educational events.
There is a tremendous amount of risk for farmers to try significant fertilizer reductions at-scale and this system allowed for some risk mitigation through land rental agreements. However, the $75K cap on the program did not enough to cover multiple years of testing and only having one year of testing with limited biological replication was a valid criticism of the reviewers of this program. We are trying to get creative in finding partners for additional years of testing namely partnering with customers for farmer-based incentives. Fortunately, the current pricing environment for fertilizer has a lot of growers lining up to test this new model with zero support.
We are conscientious of the fact this model was solely developed for pivot irrigation with the highest water use efficiency; separate models will need to be developed for flood irrigated conditions. If the new limit of 225 pounds maximum proves successful on the 44+ farm trial in 2022, we will likely come back to USDA-NRCS-SARE to try developing a new, reduced model applicable to flood irrigated ground.
Being a farmer-owned cooperative we had lots of opportunity to engage with growers and share knowledge gained. Some of the criticism we received from this application was that "growers are not likely to change", however, when studies like this are conducted by internal employees they hold in high regard and feel the project is thorough and explained well, they are more than willing to change for the better.