Final report for OW23-386
Project Information
In recent years, producers and conservationists alike have focused on increasing nutrient use efficiency to decrease production costs and protect the environment from the detrimental effects of fertilizer overapplication. Plant sap analysis can enable precise, real-time monitoring of nutrient deficiencies and crop health, potentially providing producers with more accurate information than traditional methods. While its use as a diagnostic tool has been explored in other agricultural systems, little information is available for the Inland Pacific Northwest (iPNW) and winter wheat specifically.
This research compared traditional nutrient management and monitoring practices with periodic plant sap analyses to guide foliar fertilizer applications on three farms. Cost-benefit analyses of the trials will quantify the economic feasibility of adding this diagnostic tool to crop fertility management.
Project results were disseminated through education and outreach activities, including field tours, presentations at industry meetings, newsletter articles, social media posts, webpages, and informational handouts.
Study results helped producers evaluate the efficacy of adopting plant sap analysis, and with more research, could significantly advance precision agriculture thereby increasing yields while reducing costs and harmful nutrient runoff and leaching from overapplication of fertilizers.
The goals of this project were to 1) assess plant sap analysis as an effective and economical winter wheat nutrient diagnostic tool for the Inland Pacific Northwest and 2) disseminate research results and recommendations to producers.
Three objectives that guided this project are listed below:
Objective 1: Assess the performance of winter wheat produced using fertilizer applications informed by plant sap analysis compared to the performance of winter wheat fertilized according to traditional soil and tissue testing results.
Objective 2: Evaluate producer attitudes and the economic cost-benefits of using plant sap analysis for winter wheat nutrient management.
Objective 3: Disseminate agronomic and economic cost-benefit research results through online resources, publications, and in-person events to inform adoption of sap analysis as a tool for precision nutrient management.
The proposed project encompassed three crop years beginning in April 2023 and concluding in April 2026. Major milestones were the implementation of on-farm, side-by-side field trials to compare results of “business-as-usual” fertilizer recommendations with sap analysis. See attached project schedule for detail.
Cooperators
- - Producer
- - Technical Advisor (Researcher)
- - Producer
- (Researcher)
- - Technical Advisor (Educator)
- - Technical Advisor (Educator)
Research
Objective 1: Assess the performance of winter wheat produced using fertilizer applications informed by plant sap analysis compared to the performance of winter wheat fertilized according to traditional soil and tissue testing results.
Three years of on-farm trials were conducted on three participating Whitman County, Washington, farms. These producers use a no-tillage system and typically employ traditional methods to assess wheat nutritional needs. This has resulted in applications of fertilizer in the fall and sometimes spring to supplement natural soil nutrients.
The on-farm trials employed a paired plot design (six plots, two on each farm) to compare 1-acre strips of winter wheat fertilized according to recommendations informed by traditional soil and plant tissue tests (control) to 1-acre strips of winter wheat fertilized in the spring according to recommendations informed by soil and plant tissue samples and plant sap analysis (treatment). Each year, the strips used for soil and plant tissue test collection were moved to a different field to follow the rotation of winter wheat. As the plots rotated with the crops, researchers chose fields that were as similar as possible each year. All environmental data that could possibly add additional extraneous variables through this process were recorded and analyzed for significance. This will include potential variables such as soil type, fertilizer applications, cropping history, slope, and aspect.
Soil samples were collected at randomly selected locations in both control and treatment plots in the fall and spring. Soil samples were collected and analyzed 36 times during the project (12 per year, two per control and treatment plot). Tissue tests were collected and analyzed 18 times during the project (6 per year, one per control and treatment plot). Plant sap was collected a minimum of three times each growing season (three per year, one per treatment plot). The varying number of samples by technique matched the best practices for that technique.
Plant sap is typically collected by harvesting leaves from plants in a plot. Best practices include taking two samples, one of young leaves from the top of the plant and the other of older, vital leaves from the bottom of the plant. The number of leaves required for a complete sample varies by crop and nutrients measured. PCD worked directly with lab technicians to determine the needed amount for winter wheat samples.
Soil, tissue, and sap samples were sent to third-party laboratories for analysis. Soil and tissue samples were sent to Regen Ag Labs LLC in Pleasanton, NE and sap samples were sent to Apical Crop Science in Canby, OR.
Finally, PCD collected winter wheat grain from the randomly selected locations within the six plots before harvest to assess quality between the control and treatments. Wheat quality included test weight, presence of foreign material, damaged kernels, moisture, protein, gluten, grain nitrogen and falling number. PCD staff completed nutrient use efficiency calculations for all treatments that compare the crop yield per unit of applied fertilizer. Crop yields were compared using control and treatment strips with yield tracked using yield monitors. Yield data will be collected and reported by the participating farmers.
Objective 2: Evaluate producer attitudes and the economic cost-benefits of using plant sap analysis for winter wheat nutrient management.
Economic cost-benefit analysis included tracking seed costs, input costs (fertilizer, pesticides, other soil amendments), labor costs, testing costs (sap, soil, and tissue), fuel costs, and other equipment costs. Costs were subtracted from crop yield multiplied by the average price of wheat for that year. This calculation method was used for both the control and treatment plots, and results were compared to establish the economic viability of plant sap analysis as an alternative or addition to traditional methods.
PCD staff meet with producers annually to assess project progress and to collect feedback. PCD staff administered a questionnaire to the participating producers in the first and third years of the project to assess changes in attitude for sap testing as an additional method for spring-applied fertilizer. The questionnaire in the first year included gathering information on recent major management activities that could affect the results of the trials. This information helped PCD determine potential extraneous variables.
Objective 3: Disseminate agronomic and economic cost-benefit research results through online resources, publications, and in-person events to inform adoption of sap analysis as a tool for precision nutrient management.
PCD hosted several educational workshops and opportunities to introduce producers to plant sap analysis, shared the results from objectives 1 and 2 research activities, and promoted the use of proven precision nutrient management tools in the region to enable widespread adoption. Additional educational materials were produced for online resources and publications. The educational plan outlines specific tasks associated with this objective.
Objective 1: Assess the performance of winter wheat produced using fertilizer applications informed by plant sap analysis compared to the performance of winter wheat fertilized according to traditional soil and tissue testing results.
Year 1 Research Results (2023 crop year):
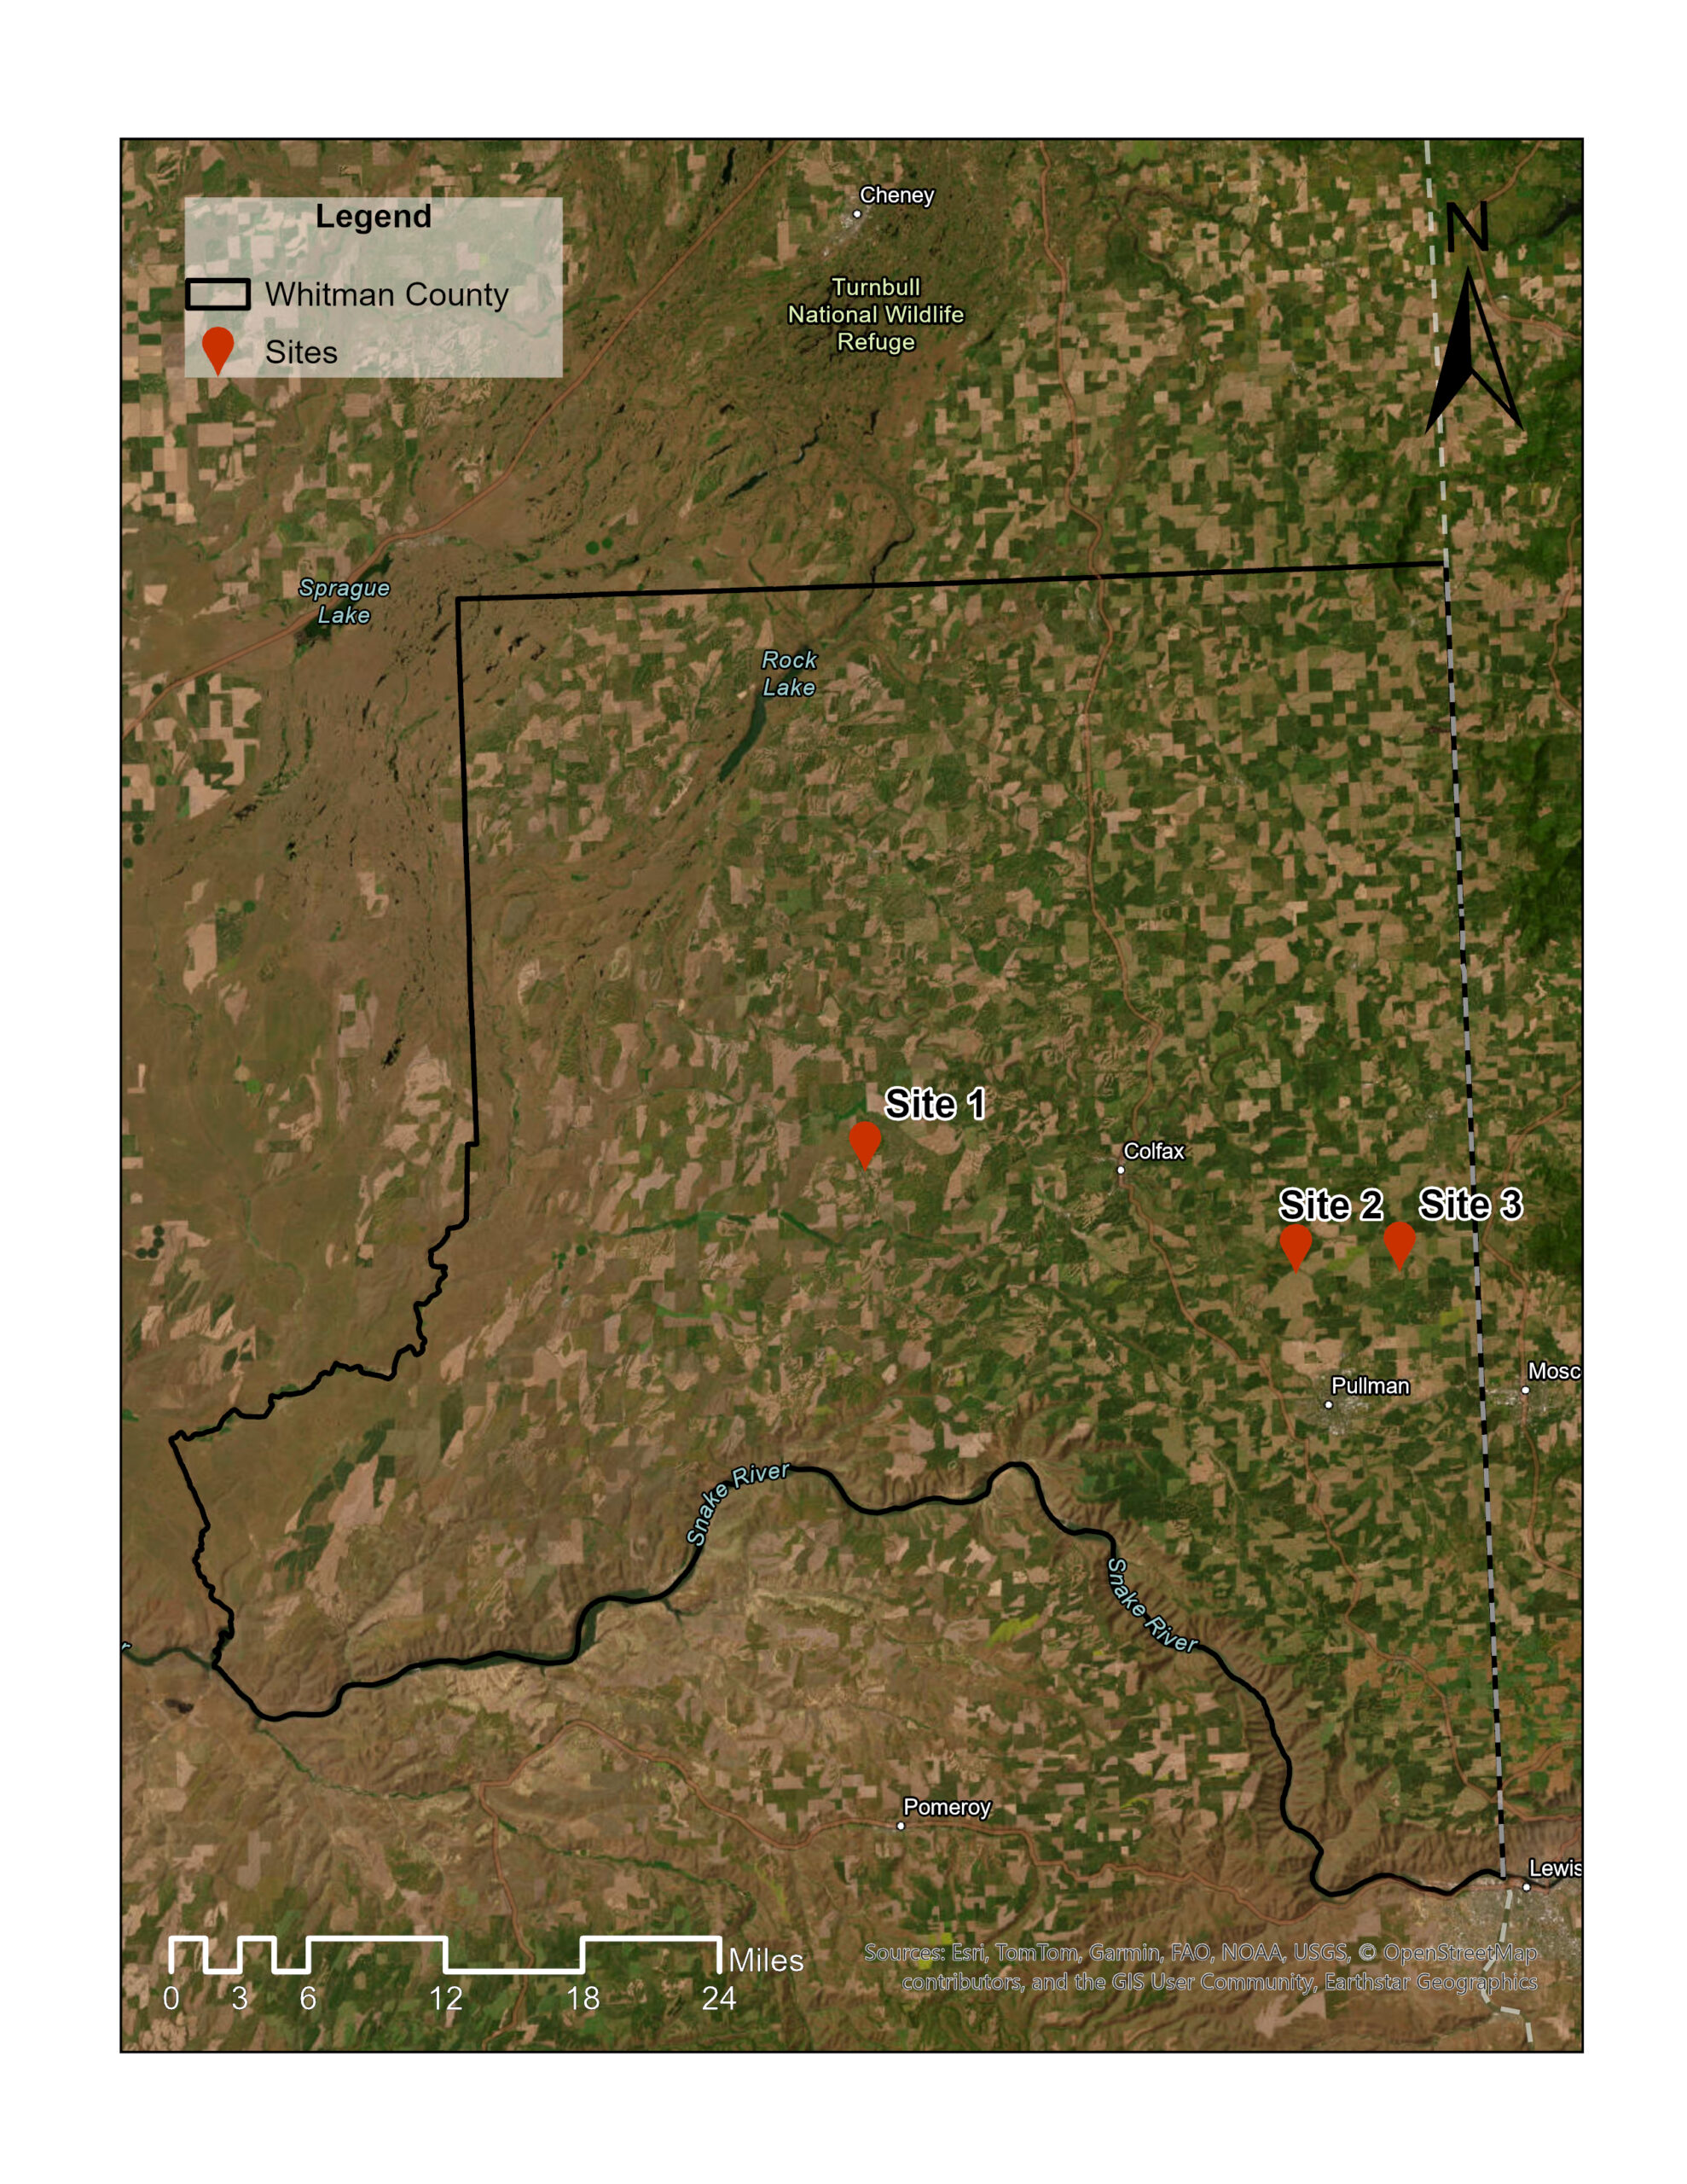
In the first year of the project, we established three field trials on farms located in Eastern Washington (Figure 1). Sites 1 and 2 were planted with winter wheat, while Site 3 was planted with winter triticale. All sites were located within the 10–20-inch average annual precipitation zone, where most precipitation occurs during the winter and spring months (National Centers for Environmental Information, National Oceanic and Atmospheric Administration, 2023).
Unfortunately, due to some logistical constraints, the participant at Site 2 was unable to apply fertilizer in the spring. This is one of the common challenges associated with conducting on-farm trials, and we have since developed a plan to improve implementation and ensure greater success moving forward.
Figure 1: Field trial sites in Eastern Washington
Soil nutrients status
Three composited soil samples were collected from 0-30 cm depth in both the 1-acre sap-managed plots (SAP) and the business-as-usual (BAU) comparison between early April and early May. Soil nutrients analysis was conducted by Regen Agricultural Labs in Nebraska using Melich-3 extraction method. Soil sampling recommendations received from the lab helped to inform if any top dressing should be done in the business-as-usual plots and what is available for plant uptake. The recommendations from the lab indicated that most soils lacked nitrogen, phosphorus, calcium, potassium, boron, molybdenum, and zinc. The soil sampling data can be found in Table 1 below.
Table 1. Spring soil sampling data 2023
Sap testing and in-season applications
Sap testing began in late March and continued throughout the spring until early June and was sent to Apical Labs in Canby, Oregon. Sap testing was used to track changes in nutrient s concentration, pH, electrical conductivity (EC), and total sugars in old and new leaves of the growing crop and to provide recommendations for foliar applications. As this was the first time many of the participating farmers had tested this method there was some trial and error in interpreting the results. With recommendations from the lab and with several consultations our team was able to interpret the results. The most common recommendations across all three sites included phosphorus, molybdenum, born, zinc, iron, and manganese. Figures 2 - 4 display the sap testing data throughout the sampling period. The two remaining farms foliar applied fertilizer based on the recommendations received from the lab between May 15th and June 1st.
Figures 2 - 4: Sap testing results from participating farms
Grain yield and quality
At harvest, crop yields and gran quality were measured in both the sap-managed and business-as-usual plots at the two of the farms that were able to apply fertilizer in the spring. Winter wheat at Site 1 averaged 78.4 bu/acre in BAU strips and 104.2 bu/acre where foliar feeding was attempted. Winter triticale at Site 2 averaged 53.6 and 47.7 bu/acre in BAU and sap strips, respectively. Due to an issue during sample handling, replicate samples within each strip were inadvertently combined prior to analysis, preventing statistical comparisons for this year’s dataset. Table 2 below has all yield and grain quality data collected.
Table 2: Crop yield and grain quality for the sap and business-as-usual plots
Economic analysis
At this point we were only able to compile the economic data for one of the farms. We decided that we would wait until we have a full economic analysis done to submit it. We will continue to compile the economic data for the 2023 crop year and will add it to the 2024 crop year data and submit it with our next report.
Year 2 Research Results (2024 Crop Year):
In the second year of experiments, all three farms from the previous year continued their participation. Site 1 and Site 3 are using sap testing as a tool for corrective fertilizer applications to improve yield, while Site 3 is reducing fertilizer application at planting and focusing on corrective applications to maintain yield.
Soil nutrients status at baseline and harvest
Soil nutrient status baselines were established at depths of 0-6 inches and 6-12 inches in late winter, between the end of February and the beginning of March. The next soil nutrient assessment took place at the end of the growing season in September (Table 3).
The late winter soil nutrient analysis showed nitrogen deficiencies at all sites, with levels below 8 ppm (Culman et al., 2020). Fields at Site 1 were also low in sulfur (< 8 ppm) and zinc (< 0.4 ppm) (Culman et al., 2020; WSU Dryland Cropping Systems Team, 2025). Phosphorus was also below recommended for small grains (54 ppm) at the 6–12-inch depth across sites (Culman et al., 2020). Zinc levels at Site 2 fields were below sufficient levels at the 6–12-inch depth as well.
At harvest, soil nutrient analysis showed that the previously deficient nutrients had increased to sufficient levels, except for nitrogen, which remained lower than in the initial sampling.
Table 3: Spring and summer soil sampling data, 2024
Sap testing
At each site, three sap tests were conducted between April and July. Laboratory interpretations identified recurrent deficiencies in the micronutrients boron, iron, silicon, and zinc across all sites and testing dates (Figures 5 to 7). Phosphorus deficiencies were observed early in the season at Site 2 (Figure 6) and Site 3 (Figure), but levels reached sufficiency in subsequent tests. Nitrogen deficiencies were detected at the onset of flowering at both Site 1 (Figure 5) and Site 3 (Figure 7). In addition, Site 1 showed deficiencies in molybdenum and copper (Figure 5), and Site 3 exhibited a calcium deficiency at the end of the vegetative period (Figure 7).
Figure 5 - 7: Sap testing results from participating farms in 2024
Tissue testing
This year, plant tissue analysis was added to the existing sap testing to reflect current practices at the sites. Tissue analysis was conducted at two stages: the seedling stage before tillering and at head emergence. Based on critical levels for seedlings and dry biomass tissue analysis provided by the Washington State University Wheat and Small Grains Program (2025), all sites were below critical levels for nitrogen (< 4%) and magnesium (< 0.14%) at the seedling stage in both sap testing and business-as-usual areas, except for magnesium at Site 1-SAP (Table 4). Zinc was deficient at the seedling stage at Site 1 and at the heading stage at Site 3 in both sap testing and business-as-usual plots. Boron tested sufficient at the seedling stage at all sites but was deficient (< 18 ppm) at the heading stage at Site 1-SAP, Site 2-business-as-usual, and in both treatments at Site 3. Additional nutrient testing below critical ranges included copper (< 4.5 ppm) and molybdenum (< 0.1 ppm) at Site 1-business-as-usual, though these were adequate at the heading stage. In contrast, iron levels reached toxicity in seedlings at Site 2 but fell within the acceptable range by the heading stage.
Table 4: Tissue analysis at seeding and heading stage in 2024
Grain yield and quality
Site 1 and Site 3 were using sap testing as a tool for corrective fertilizer applications to improve yield, while Site 3 was reducing fertilizer application at planting and focusing on corrective applications to maintain yield. Grain yield was significantly greater at Site 3 by ~36 bushels per acre and at Site 1 by ~20 bushels per acre (p-value ≤ 0.10) (Figure 8). In contrast, Site 2 maintained yield in the sap test trials relative to their business as usual.
Protein concentration decreased significantly in the sap testing trials at Site 3 by 0.7% (p = 0.09). At Site 2, protein concentration averaged about 1.4% below their usual practices, but this difference was not statistically significant (p = 0.13).
Figure 8: Yield and grain quality from the sap (SAP) and business-as-usual (BAU) plots in 2024
Year 3 Research Results (2025 Crop Year):
In the third year of experiments. Soil and sap tests were conducted following the same protocol used in the previous year. Based on the previous year’s research outcomes, we identified the need to reduce the turnaround time for interpreting results and to improve guidance for sap test interpretation.
To address these challenges, paired sap and tissue sampling was implemented throughout the season to establish sap nutrient thresholds based on tissue analysis criteria. Farmers worked closely with their agricultural advisor to interpret sap test results and plan in-season applications. We also maintained ongoing discussions with agronomists to improve the interpretation of sap testing results and reduce time constraints experienced in previous years. Lastly, we implemented a correlation analysis between sap measurements and yield to identify the key parameters driving yield outcomes in the dryland.
Soil nutrient status at baseline and harvest
Across sites, soil nitrogen (N) concentrations were consistently low (< 8 ppm) in spring 2025 in both SAP and BAU fields, except at Site 2 (Table 5). Nitrogen levels declined further by harvest, reflecting crop uptake and redistribution within the soil profile. This pattern was consistent across management systems, indicating that N availability remained a primary constraint throughout the growing season.
Site 1 was soil deficient in sulfur (S; < 8 ppm) and boron (B; < 1 ppm) (Table 5). Concentrations of both nutrients increased by the end of the season, likely due to in-season applications and/or mineralization of organic matter. In contrast, Sites 2 and 3 had adequate B levels in early spring that declined below recommended thresholds by harvest, suggesting depletion without sufficient replenishment.
Zinc (Zn) was deficient across all sites at both sampling times (Table 5). However, Sites 1 and 3 showed modest increases in Zn by harvest, indicating some improvement in availability or uptake. Overall, micronutrient dynamics varied by site, but Zn deficiency was consistent across environments.
Table 5: Spring and summer soil sampling data, 2025
Tissue Analysis and in-season applications
Tissue nutrient concentrations across sampling dates for the SAP and BAU fields are presented interactively in Figure 9, allowing filtering by site and nutrient. At Site 1, tissue analysis in the SAP field indicated early-season deficiencies in Zn and B, which were no longer observed by the boot stage. This recovery occurred despite no reported Zn or B applications, suggesting that changes in root activity, soil conditions, or mineralization improved nutrient availability.
Phosphorus (P) and potassium (K) were sufficient early in the season but declined to deficient levels at the boot stage in both SAP and BAU fields. This pattern is consistent with known crop physiology, where nutrients are remobilized from vegetative tissues to reproductive structures during grain development.
At Sites 2 and 3, both SAP and BAU fields showed repeated deficiencies in magnesium (Mg) and K, including at the boot stage. At Site 2, where no in-season nutrient applications were made, deficiencies persisted throughout the season. In contrast, Site 3 received Mg in late March, resulting in measurable increases in both tissue and sap concentrations within six days.
Grain yield and quality
At Site 2, sap testing was used to reduce fertilizer inputs at seeding, with in-season foliar applications applied as needed. The SAP plot received 20% less N, P, S, Zn, and B (Figure 9). Despite these reductions, no differences were detected in grain yield, protein, or moisture between SAP and BAU based on 1 m² hand-harvested quadrants (Figure 10). Yield monitor data were consistent with these measurements.
At Sites 1 and 3, SAP fields received additional inputs through in-season applications. Of these, only Site 3 showed a significant yield response, with SAP plots averaging 20 bu/ac higher than the BAU average of 46 bu/ac (Figure 10). Together, these results indicate that in-season nutrient management can maintain productivity with reduced upfront fertilization and, under some conditions, enhance yield.
Figure 10: Yield and grain quality from the sap and business as usual plots in 2025
Identifying Sap nutrient thresholds based on tissue criteria
Sap nutrient thresholds were developed using a paired sap-tissue approach. Tissue nutrient levels were first classified as high, adequate, or deficient based on established for small grains (Ritchey et al., 2011; WSU Dryland Cropping Systems Team, 2025), and corresponding sap samples were assigned to the same categories.
The distribution of sap nutrient concentrations within each category was then used to define reference ranges. This method produced distinct sap thresholds for 9 of the 14 measured nutrients. These results show that sap measurements can be aligned with established tissue standards. Because this analysis was conducted after the growing season, these ranges were not available to guide in-season decisions and remain provisional, requiring further validation before being used for management recommendations.
Relationships between Sap measurements and Yield
Relationships between sap nutrient levels and yield were evaluated to identify parameters associated with yield improvement. Significant positive correlations (p ≤ 0.05) were observed for N (r = 0.42-0.62), P (r = 0.41-0.52), I (r = 0.55), Si (r = 0.58), Se (r = 0.51), B (r = 0.48), Cl (r = 0.45), S (r = 0.44), and electrical conductivity (r = 0.57-0.72). These relationships imply that higher availability of these nutrients, as well as conductivity, were associated with improved yield outcomes.
In contrast, Ca (r = −0.44 to −0.59) and pH (r = −0.46) were negatively associated with yield. In winter triticale, only Na showed a significant relationship with yield, and it was negative (r = −0.60), indicating potential sensitivity to sodium levels in that crop.
The strong relationships between sap nutrient levels and yield supports the use of sap testing as a tool for guiding adaptive nutrient management, however further refinement on these relationships is needed before widespread implementation.
Objective 2: Evaluate producer attitudes and the economic cost-benefits of using plant sap analysis for winter wheat nutrient management.
Economic Analysis and Nitrogen Use Efficiency
A partial economic analysis was conducted for each farm, including fertilizer, herbicides, pesticides, and soil amendments (Table 6). Fuel, equipment, and labor costs were not included.
At Site 2, SAP plots generated higher net returns, ranging from $21 (5%) to $26 (7%) per acre, compared to standard practice over two years. These gains were achieved despite reduced fertilizer inputs, indicating improved input efficiency.
At Site 1, SAP plots resulted in higher net returns during the first two years: $165/ac (30%) in year one and $79/ac (12%) in year two. In the third year, SAP returns declined slightly, averaging $5/ac (−8%) below BAU.
At Site 3, SAP plots had lower returns in the first year, with a decrease of $4,902 (−11%) relative to BAU. However, in the following two years, SAP fields outperformed BAU, generating higher net returns ranging from $16,000 (45%) to $29,000 (92%). At this site, triticale was grown and sold for animal feed which is why the economic numbers are higher than at Sites 1 and 2.
Nitrogen use efficiency (NUE) varied among sites and years (Table 6). At Sites 1 and 2, SAP management generally improved NUE compared to BAU, indicating more efficient conversion of applied nitrogen into grain yield. Site 1 showed the highest NUE under SAP in 2024 (4.86 bu/lb N). In contrast, Site 3 exhibited more variable responses, with BAU often producing higher NUE values than SAP.
Overall, sap and tissue testing captured temporal nutrient dynamics, responses to in-season management, and associated economic outcomes. These findings indicate potential for sap-guided management but also highlight the need for further validation to confirm consistency across environments and crops.
Table 6: Economic analysis across three growing seasons (2023-2025)
Evaluating producer attitudes towards nutrient management and sap testing
From October 2025 to January 2026, the Palouse Conservation District in partnership with Arrowleaf Consulting, conducted a survey of agricultural producers and professionals in the region to better understand technical assistance needs and interests related to fertilizer strategies, interest in precision agriculture topics, and sap and soil testing. Of the population surveyed, there were 62 respondents; 77% were crop producers.
From the respondents, fertilizer strategies were dominated by uniform applications used by 79% of respondents, while 41% reported using zone-based fertilizer applications that vary rates across a field. Several respondents also mentioned additional practices such as nitrogen stabilizers and variable-rate applications. Interest in precision agriculture topics included learning more about individual spray nozzle control (65%), nitrogen use efficiency at the field scale (60%), and zone fertilizer application (58%). Interest was also high for drone-based applications, including weed identification and crop health mapping.
Responses regarding sap testing indicated limited familiarity with the process. Forty percent said they were not at all knowledgeable about using sap testing to guide fertilizer application, while 38% described themselves as only a little knowledgeable. Only 11% considered themselves very knowledgeable. The primary barriers identified were cost, the need for repeated testing during the growing season, lack of information about interpreting results, and limited information regarding practical uses and benefits. Respondents also expressed concerns about slow turnaround times, lack of local expertise, uncertainty regarding return on investment, and the absence of region-specific baseline data for annual crops such as wheat. The full report on the results from the survey can be found here.
In addition to evaluating the wider agricultural community, PCD worked with three producers to evaluate plant sap analysis as a nutrient diagnostic tool for winter wheat production compared to traditional tests as part of a WSARE-funded project. In November 2025 to January 2026, Ryan Boylan, Palouse Conservation District Research and Monitoring Program Manager, interviewed the three participating producers to gain information on the strategies they currently use to guide nutrient management; their experiences with and perspectives on the tradeoffs of plant sap testing relative to other strategies; their perspectives on the economic, agronomic, social, and other impacts of using plant sap testing; and feedback on project implementation for future projects. Boylan audio recorded the interviews with permission, and then Arrowleaf Consulting analyzed the interview transcripts using an inductive coding methodology in ATLAS.ti software. The full report can be found here.
Research outcomes
Year 1 Research Outcomes:
There were several outcomes from the first year of the trials that were worth noting. First, sap testing proved to be somewhat logistically complicated. The timing from when crops were sampled, results and recommendations were received from the lab, and product was ordered, and then applied, took too long. As was mentioned in the research results section, one of the farms was not able to foliar apply because the wheat had gotten too big and they were worried about crop damage. With these lessons learned, we moved our sampling dates earlier in the spring and started testing at more frequent intervals so the participating farmers could see results and order product in a timely manner.
A second outcome worth discussing was that one of the participating farmers was so impressed with the sap testing plot that they decided to by a new sprayer. This individual is going to increase the acreage that they will be applying fertilizer to in the spring based on sap testing results outside of the project.
Finally, there was a lot learned this year about the proper method, timing and interpenetration of sap testing results. For the 2024 crop year we started to work closely with Apical Labs and crop consults to provide more accurate recommendations for our region.
Year 2 Research Outcomes:
During the second year of experiments, growers reported three major challenges:
- Turnaround Time for Recommendations on Sap Tests: The recommendations from the lab took too long to be delivered, were unclear, and the recommended products were not readily accessible.
- Complexity of Results: The results were difficult to interpret. Without nutrient guidelines based on sap tests, sap testing has not effectively informed future applications.
- Utilization by Crop Consultants: Crop consultants struggled to adjust fertilization plans using sap test results due to a lack of information on this tool.
To address the major limitation of lacking nutrient guidelines from sap test analysis, the next step was to identify baseline nutrient levels for the participating sites. Sap testing was conducted at the following critical stages: 10 days prior to herbicide application, mid-late tillering, fix 5-6, and close to or at flag leaf.
To improve the timing and practicality of recommendations, a crop consultant started to collaborate with the growers to help interpret results and tailor recommendations to each site. Additionally, tissue analysis was conducted at the same critical stages to evaluate sap testing against regular practices.
Year 3 Research Outcomes:
During the third year, this project we:
- Established a field-based framework for combining sap and tissue testing at key growth stages, offering a more practical approach to in-season nutrient monitoring than sap testing alone.
- Identified that sap test interpretation is a critical barrier to adoption, with limited capacity among agronomists and farmers in the region to translate results into management decisions.
- Developed a paired sap-tissue testing approach to address interpretive gaps, providing a locally grounded reference for evaluating crop nutrient status.
- Strengthened the regional evidence base for adaptive nutrient management practices in dryland cropping systems in Eastern Washington.
These outcomes highlight both the promise and the current limitations of sap testing in dryland systems and point to the need for continued work on interpretation.
Education and Outreach
Participation summary:
Objective 3: Disseminate agronomic and economic cost-benefit research results through online resources, publications, and in-person events to inform adoption of sap analysis as a tool for precision nutrient management.
Year 1 Education and Outreach Activities:
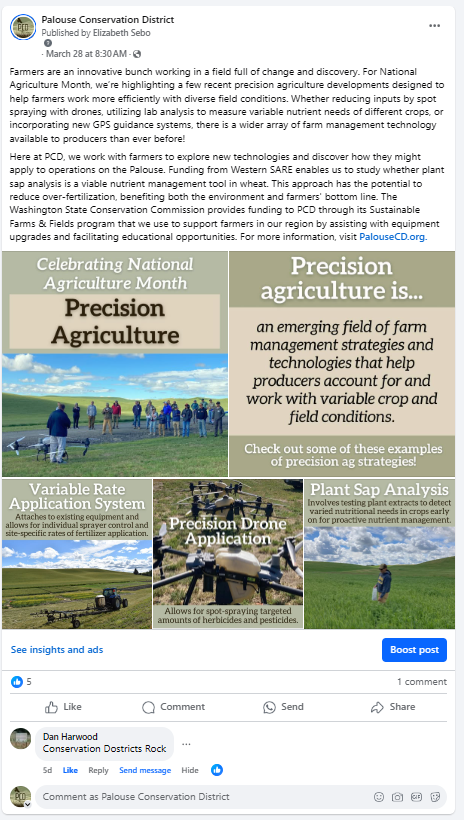
The first year of the education and outreach activities for the project revolved around planning and spreading the word about the project. Through the Palouse Conservation District's social media platforms, two posts were made about the project that was seen by just over 3,000 followers. The social media posts can be seen below. The project was also highlighted in the Palouse Conservation District's Annual Report that was distributed to our mailing list, reaching over 2,ooo subscribers. A copy of the annual report can be found below. We planned for both a sap testing stop on a field day that was held in May 2024 and a precision agriculture field day that took place in June 2024. The education and outreach team initiated work with a contractor (Arrowleaf Consulting) to develop a pre-project questionnaire that was distributed before both of these field days.
Sap Testing Social Media post 1
Sap Testing Social Media Post 2
2023 Palouse Conservation District Annual Plan
Year 2 Education and Outreach Activities:
In the second year of the project, several education and outreach events helped us to reach a wide audience. Social media posts on Facebook and Instagram, on June 2 and August 26, reached just over 3,000 people. In the Palouse CD 2024 Annual Report, an article on the project was distributed to around 2,000 people. Additionally, we hosted The Palouse Alternative Cropping Symposium , held on February 22, 2024, which had 81 participants, and we facilitated a Precision Ag field Day on June 27, 2024, which attracted 54 participants. A survey conducted during the field day received 21 responses. Other events included two Soil Health Breakfasts held on November 14, 2024, with 18 participants and another on December 12, 2024, with 27 participants.
Year 3 Education and Outreach Activities:
During Year 3 of the project, we conducted a range of education and outreach activities to further engage producers and agricultural stakeholders across the region. Events included a Soil Health Breakfast held on January 9, 2025, attended by 41 participants; the Palouse Alternative Cropping Symposium on February 27, 2025, with 105 participants; and a Winter Wheat Fertility Tour on June 11, 2025, attended by 19 participants. Pre- and post-event surveys were administered during the Winter Wheat Fertility Tour to evaluate participant learning and inform future programming.
To better understand producer interest and adoption barriers related to plant sap analysis and precision agriculture, we conducted a community survey from October 15 through December 15, 2025. The survey was promoted through Palouse Conservation District social media platforms, newsletters, website postings, direct email outreach to producers and agricultural stakeholders, and QR codes distributed at events. A total of 62 respondents completed the survey. Social media outreach supporting the survey included four posts published between November and December 2025. A boosted post published on November 6, 2025, received 11,133 views, 131 link clicks, 45 likes, 6 shares, and 1 save. Additional posts published on November 17, December 1, and December 11 received 352, 272, and 387 views, respectively, along with additional likes, shares, and link clicks that helped maintain survey visibility and engagement throughout the outreach period.
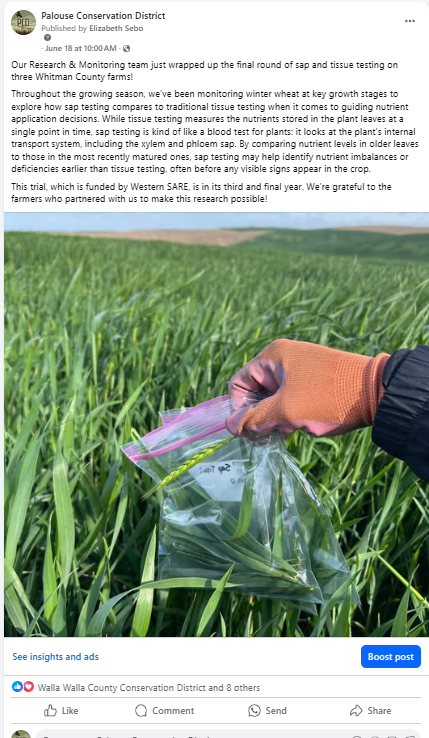
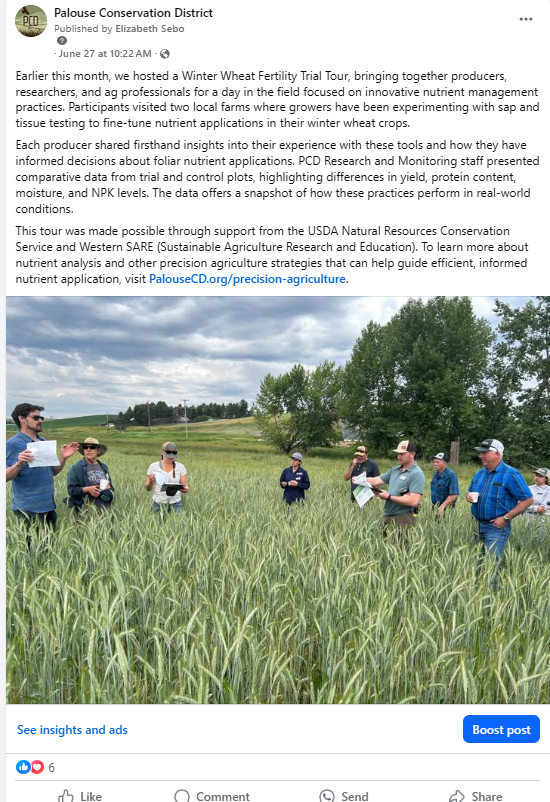
Project outreach efforts also included several publications and digital communications. The project was featured in the Palouse Conservation District’s 2025 Annual Report, which was distributed to approximately 2,200 recipients. In addition, three social media posts highlighting project activities and findings were published on Facebook and Instagram. The March 28, 2025 post received 639 views, 20 reactions, 3 shares, 1 comment, and 24 link clicks; the June 18, 2025 post received 381 views, 46 reactions, 1 comment, and 9 link clicks; and the June 27, 2025 post received 686 views, 29 reactions, and 20 link clicks.
Finally, we developed a one-page educational handout summarizing plant sap analysis and key project findings for distribution to producers and agricultural partners.
Social media posts as follow:
Sap Testing Social Media post 1
In the second year of the project, we spent a lot of time working on ramping up our education and outreach initiatives. We worked with a social scientist to develop a survey that was distributed to the participants at the Precision Ag field day in June. We received 21 responses from the survey, about half of the folks that attended. The survey highlighted that 20 of the 21 respondents reported an increase in knowledge for sap testing after the event, and the 1 other person already had a detailed knowledge base in sap-testing. Additionally, of the 17 respondents that do not use sap-testing, 14 of them are interested in using sap-testing as a diagnostic tool (where 3 others reported, not applicable). The survey that was distributed can be found here and the results from the survey can be found here.
Overall, the outreach and education efforts through this project engaged 175 individuals. This was accomplished through field tours (Precision Ag Field Tour) and in person events (The Alternative Cropping Symposium and the Soil Health Breakfasts). Additionally, articles printed in Palouse CDs Annual Report were distributed to 2,200 individuals and social media posts were distributed to over 3,000 followers.
Education and Outreach Outcomes
There were two major lessons learned from the education and outreach activities associated with this. First, we found the best way to engage a large audience was to host a joint field day with Washington State University. The Precision Ag Field Day was well attended, and partnering with the land-grant university enabled us to draw a larger audience. While sap and tissue testing were an important part of this event, we had other innovative precision ag topics, mainly the use of drones for spraying and fertilizing, that attracted the attention and curiosity of many producers. While we can't always keep up with the interests of the producers we serve, highlighting these technologies at in-person events help to build relationships and share information on current projects.
Second, working with Arrowleaf Consulting, we were able to survey a much larger population than expected on topics surrounding precision agriculture. Arrowleaf helped us to design the survey along with a strategy to administer it. The survey was open for nearly three months, and we tapped into many of our professional networks to reach a wide audience (over 60 responses from producers and ag industry). The information gathered was helpful to gauge interest and knowledge on sap and tissue testing, and also provided us with several great ideas for future work and events. We will continue to include these types of surveys in future projects.
Knowledge of sap testing and the logistics involved
Post harvest nutrient assessment maybe be more impactful than in season assessment
“We didn’t know what we didn’t know” – direct quote from on of the producer participants.