Final report for SW17-077
Project Information
Honey bees have become increasingly unavailable and expensive for crop pollination since Colony Collapse Disorder was described and the world was alerted to CCD and the many factors that negatively impact honey bee health. Although other managed pollinators, such as bumble bees, alfalfa leafcutting bees, and blue orchard bees (BOBs), are available to pollinate certain crops, a ready BOB supply and well-developed management system for their use are especially lacking. BOB suppliers and managers need more information to supply customers with disease- and pest-free bees, to manage bees for optimal performance for pollination, and to maintain populations in numbers large enough for profitable business and to accommodate large commercial operations. We seek to meet six objectives that tackle primary stakeholder concerns: 1) understanding variation in developmental phenology of regionally-distinct BOB populations; 2) finding the genetic basis for regional differences of BOB sources through cross-breeding/mating experiments; 3) studies of population genetics; 4) examining pest and pathogen communities of BOBs from distinct sources; 5) describing patterns and seeking causes of BOB dispersal/loss in commercial settings; and 6) disseminating user-friendly information to the general public. Field collections, orchard and laboratory behavioral studies, molecular bioassays, and visual, x-radiographic, and microscopic diagnoses all will be employed to meet the research objectives. Dissemination of information and development of public education materials and events will be developed under consultation with Extension personnel in Washington, Oregon, California, and Utah. Findings will reduce the need to trap BOBs from the wild where the impact of trapping is yet unknown and, thus, will preserve local diversity of native populations. Better bee management would provide a more reliable source of alternative bees for pollination of suitable, pollinator-dependent crops. Understanding incidence of pests and disease will reduce the chance of epidemic outbreaks in managed populations and possible spillover to native bees. We will continuously educate the public and primary stakeholders, while seeking valuable input from stakeholders as results unfold and new research approaches are developed.
1. Determine the variation in developmental phenology of regional populations of BOBs by maintaining regionally-specific bees under managed or unmanaged conditions. Year 2 January-December; Year 3 January-June.
2. Determine the heritability of regional phenology traits for BOBs from California and Utah by examining population crosses in controlled experiments. Year 2 January-December; Year 3 January-June.
3. Using population genetic tools, assess the extent of population genetic differentiation among regions where BOBs are sourced and where they are deployed, detect the current structure of populations, and understand the potential for future admixture. Year 1 September – Year 3 May.
4. Using visual or molecular examinations, identify parasites and pathogens obtained from collections of bees from wild-trapped and managed populations, and use findings to infer how BOB stocking density, co-pollination with honey bees, and other management strategies may effect disease transmission within the pollination or mass propagation systems. Year 1 September – Year 2 August.
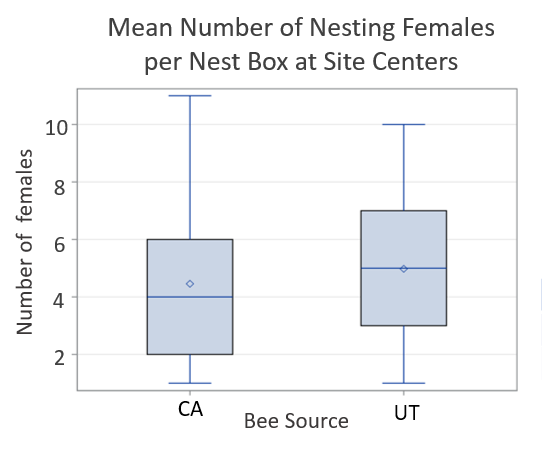
5. Determine the difference in the retention of females between California and Utah BOBs used as pollinators in regions outside of their geographic origin by examining the dispersal and flight range of these populations in cherry orchards in regionally distinct environments. Year 3 March-November.
6. Deliver high quality educational products and training on BOBs through extension and outreach to maximize information sharing and adoption of new technologies. Year 2 October – Year 3 December.
Cooperators
- - Producer
- - Producer
Research
Hypothesis Objective 1: Developmental phenotypes of blue orchard bees are regionally adapted to match their local climatic conditions.
Hypothesis Objective 2: Allowing reproductive crossing of blue orchard bee populations from different geographic locations results in development timing in progeny according to sex that causes female bees to emerge as adults before male bees.
Hypothesis Objective 3: Blue orchard bee populations can be distinguished genetically according to regions where they naturally occur.
Hypothesis Objective 4: Some parasites and pathogens found in blue orchard bee populations are regionally-distinct, while others are common to most populations.
Hypothesis Objective 5: The propensity to disperse is increased when blue orchard bee populations are released for crop pollination in non-native regions and out of synchrony with natural adult emergence timing.
For Objective 1, in 2018, recently-provisioned (≤ one-week old) BOB nests traps in California, Washington, and Utah were collected from traps with tunnels lined with paper straws. Paper straws containing nests were shipped to the Pollinating Insects Research Unit (PIRU) in Logan, UT. The straws were sliced longitudinally so each cell could be visually inspected to select only cells with unhatched eggs or second instars. Unfortunately, most of the nests shipped from Washington and California contained cells with developing larvae that were too old for our experiment, and numbers of appropriate cells were too low for use in the experiment. The Utah nest cells, however, were collected by the PIRU research team and contained ample numbers of eggs and early instars. These nest cells were divided into two treatment groups for developing in either Washington temperatures (which is similar to Utah temperatures) or California temperatures (= 2 treatments, 300 cells each). For the “unmanaged” treatment, one group of cells were held in growth chambers programmed to mimic the natural daily temperature cycles of the climates of their origin (Wenatchee, WA) starting at the time of collection (see Pitts-Singer 2014). Programmed temperatures were 5-year averages obtained from local weather stations. Each cell was visually inspected daily to determine mortality and developmental stages until mature larvae (5th instars) completed the spinning of their cocoons (marking the start of the prepupal stage) (similar to Pitts-Singer et al. 2014). The bees were then x-rayed every two days to record when the bees reached pupal and adult stages. Thirty days after reaching the adult stage, a winter-managed subsample of bees were subjected to two intermediate temperatures over a two-week period until the winter storage temperature of 4°C was reached (Bosch & Kemp 2001). An unmanaged subsample of bees remained at fluctuating Logan temperatures. In March/April 2019, as if needed for pollination of Washington and California cherries, half of the cocooned adults from each treatment were incubated at 22ºC (Bosch & Kemp 2000), and the other half remained unmanaged until they emerged naturally. The length of each developmental stage, the time to emergence, duration of emergence period, and weight of adults for each group of bees were measured. Mortality (and any known cause of it) also was recorded for all developmental stages.
For this same objective, the collection of just-created bee cells from traps in California, Washington, and Utah again occurred in spring 2019, and the experiment repeated with all three bee sources represented. Data collection was done in 2019 and continued through spring 2020 (as was done in 2018-2019), and generalized linear mixed models will were performed using PROC GLIMMIX to look for the effects of native region (CA, WA, and UT) and treatment (managed or unmanaged) on 1) developmental parameters for immature and adult bees, and 2) parameters concerning adult survival and duration of emergence period. Results help to determine the value of trapping and/or propagating regional populations for local crop pollination, and whether efforts could be made to breed populations to be more locally synchronized with crop bloom.
For Objective 2, in spring 2018 in Winters, CA, adult bees from California and Utah were allowed to mate in screened field cages (n = 8) placed over blooming Phacelia tanacetifolia, and using supplied nesting tunnels and floral resources, the females could build nests.  Two cages each
  contained mixed sources of adult bees (UT ♀ × CA♂; CA♂ × UT♀) and two cages each contained the same sources of adults as control crosses. Preliminary work suggested that mixing populations from different geographic locations may result in male progeny emerging after female progeny, which is the reverse of the natural protandrous system for this species (Trostle et al., unpublished). To determine if there are reproductive consequences of pairing bees from regionally-distinct trapping sites, we monitored cell production by each female and the progeny sex ratio. Offspring were allowed to develop to late larval or pupal stages in California and then were transported to PIRU to be raised at constant temperatures using standard management procedures. Developmental time and survival were scored, and in spring 2019, these progeny were used in California cage studies for Year 2 to perform back crosses. To stimulate downstream mating combinations, we made the following crosses: CACA♀ x CA♂, CAUT♀ x CA♂, CAUT♀ x UT♂, UTUT♀ x UT♂, UTCA♀ x UT♂, UTCA♀ x CA♂. The adults and progeny in the 2019 cage study were monitored and reared as in 2018-2019. Final data on progeny development (2019) and winter survival were obtained through spring 2020 and analysis of results is on-going.
For Objective 3, in 2017 for molecular analysis at PIRU, we obtained BOB females through trap-nesting and net collection from where populations have previously been located in California, Washington, Idaho and Utah. In addition, we used previously collected bees from Maryland, Virginia and Michigan as outgroups in analyses. A minimum of 15 female (diploid) adults were obtained for each population for analysis. We extracted DNA from a single leg of each bee using a Chelex® extraction protocol (modified from Walsh et al. 1991). Extracted DNA was stored at -20°C. We used PCR to amplify microsatellites. The 10-μl multiplex reactions contained: 1 μl extracted DNA, 1x Promega (Madison, WI) reaction buffer, 0.6 mM dNTP mixture, 0.1-0.4 μM primer, 0.001 mg BSA, 0.4 units Taq polymerase (Promega, Madison WI), and the MgCl2 concentration was adjusted to 1.4 mM. The PCR conditions for multiplex reactions were: one 4 min cycle at 95 °C, 30 cycles of 95 °C for 30 sec, and annealing at 54 °C for 75 sec, then 72 °C for 45 sec. The cycles were followed by a final extension period of 15 min at 72 °C. We used four previously developed loci (OruA8, OruC4, OruS4, and OruS8) in addition to six unnamed loci developed by J. Strange. We separated the DNA amplifications on an Applied Biosystems 3730xl automatic sequencer (Life Technologies), and we scored allele sizes using GeneMapper™ v4.0 Software (Applied Biosystems). During 2017-2018, we determined population genetics and performed spatial analysis. To account for differences in sample sizes across regions, we used the program HP-Rare (Kalinowski 2005) to calculate allelic richness and private allelic richness. Arlequin v.3.5.x (Excoffier and Lischer 2010) or Genepop v.4.2 (Raymond and Rousset 1995; Rousset 2008) were used to determine the fixation index FST for each pair of groups heterozygoseties, population pairwise comparisons, analyses of molecular variance (AMOVA), and isolation by distance (IBD). In 2018, we used the Bayesian methodology implemented in the program STRUCTURE (Pritchard et al. 2000) to infer population structure. We estimated the optimal number of populations by employing the methods of Evanno et al. (2005) in STRUCTURE HARVESTER (Earl and vonHoldt 2012). Pairing this method with our IBD analysis verified that farm-by-farm and region-by-region structure in populations would not be overlooked.
For 2018 Objective 3 molecular analysis, we obtained BOB females through trap-nesting and net collection from where populations have previously been located in California, Washington, and Utah. We extracted DNA from a single leg of each bee. We sampled DNA from 20 individuals at multiple sites in each state. We used PCR to amplify microsatellites at four previously developed loci (OruA8, OruC4, OruS4, and OruS8) in addition to six unnamed loci developed by J. Strange. DNA amplifications were completed, but analyses were not yet done on the raw data files. During 2019, the eight DNA microsatellite primers designed in 2017 were ordered and tested for utility in studying population differentiation. These primers were evaluated for variability in BOBs, and of the eight primers, four were found to have utility. We performed a second iteration of primer design and development to increase the number of molecular markers available for this study. We continued to work towards determining population genetics and performing spatial analysis.
For Objective 3 in 2020 for molecular analysis at PIRU, we surveyed the published genome of the Blue Orchard Bee (BOB), O. lignaria, (GCA_012274295.1_USDA_OLig_1.0_genomic.fna) that is publicly available on NCBI https://www.ncbi.nlm.nih.gov/genome/. Using Krait v1.3.3, we queried the genome for microsatellite markers across 44 scaffolds and developed primers to be tested with PCR amplification (Du et al. 2018). Three microsatellite types "perfect," "compound," and "imperfect" were identified in silico. Microsatellites were filtered using custom scripts in the R programming language (R Core Team 2020). Filtering strategies followed the methods employed by Strange et al. (2017) in the development of a Megachile rotundata microsatellite study. In brief, microsatellites that were di-, tri-, and tetra-nucleotide repeats were targeted. Products that were 100 – 500 nucleotides long were selected. Primer pairs that annealed to multiple sites across the genome were excluded. Loci that have primer pairs not exhibiting 40 – 60% GC content were excluded. Furthermore, only primers that had an annealing temperature near 55°C were included. Finally, of the loci that fit these criteria, we randomly selected one locus per scaffold for initial testing.
We tested the novel primers on extracted DNA of BOB specimens representing reliably native collections in California (n = 3) and Idaho (n = 1). Our goal in testing these primers was to determine repeatability of the PCR amplification, genetic diversity, and the capacity for the primers to detect genetic structure. To achieve these goals, we genotyped the extracted DNA with the developed primers of the novel microsatellites. Multiplex reactions and PCR conditions are described above. After product size confirmation on an agarose gel, we separated the DNA amplifications on an Applied Biosystems 3730xl automatic sequencer (Life Technologies). We scored allele sizes using Geneious Prime 2021.0.1. Estimates of expected heterozygosity (He) and allelic richness were calculated with the strataG library in R (Archer et al. 2017). Allelic richness of each locus was calculated as the number of alleles divided by the number of samples without missing data at that locus. Finally, we performed an analysis of molecular variance (AMOVA) to test for differences in genetic structure across the populations with the poppr library in R (Kamvar et al. 2014).
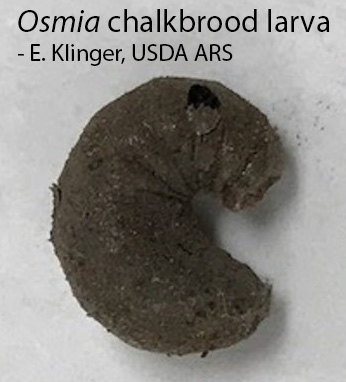
For Objective 4, to examine the health of the pollinator species, adult and immature bees plus cells with natural enemies were collected from trap nests from several separate sites in California, Washington, and Utah in 2017 to evaluate pest and pathogen levels. In the nest cells, parasites, parasitoids, and predators were identified using x-ray diagnosis and nest cell dissection. Adult bees and developing bees were frozen immediately in liquid nitrogen. While frozen, adults were identified and photographed using high resolution Z-stacks, and then they were bisected. One half were homogenized in TRIzol® reagent (Invitrogen) for analysis as individual bees, and the other half used for analysis of spores of the protozoan parasites and Nosema. Both sets of samples have been kept at -80°C until full analysis. In 2018, additional BOBs and other Osmia species were trap-nested from areas in California and Utah and also sampled from the California mating cage experiment (Objective 2). Many bees from the stock for the cage experiment died in the pre-adult stage and, thus, were collected and later frozen at -80°C; they are awaiting analysis. A limited number of bee samples have been extracted with TRIzol® reagent (Invitrogen) for molecular analyses, and the DNA and RNA have been isolated. Because the PCR work resulted in the detection of chalkbrood (Ascosphaera torchioi) in several of the collected BOBs, samples of the fungus were sent for DNA sequencing to gain additional genetic sequences for the pathogen and to allow for comparison of samples from the different regions. Sequences have been received and are being analyzed. PCR probes for the protozoan diseases are continuing to be tested and resolved for specificity. In addition, in a separate set of samples of BOBs and O. ribifloris, the microbiome has been sequenced and characterized from pollen provisions.
 For Objective 5 in 2019, to measure dispersal and BOB establishment with respect to source population and management history (Sgolastra et al. 2016), wild-trapped bees collected from California and Utah were introduced to spring-blooming commercial cherry orchards in both California and Utah. Nests collected in late summer 2018 were maintained in cold storage as cocooned adults in containers until ready to be incubated for emergence in spring 2019. After a short incubation time, ready-to-emerge female bees were excised from cocoons from each population and marked on the thorax with enamel paint to denote whether the bee was sourced from California or Utah. Bees were released into the orchards at a rate of 300 females and 750 males per acre into commercial cherry orchards at onset of bloom, with equal numbers of Utah- and California-sourced bees. Three orchards (isolated by at least 1 km) in each California and Utah were selected for this experiment.
 Within each orchard (e.g., Thomas Site Map), a three-acre section (110 m × 110 m, hereafter called site center)
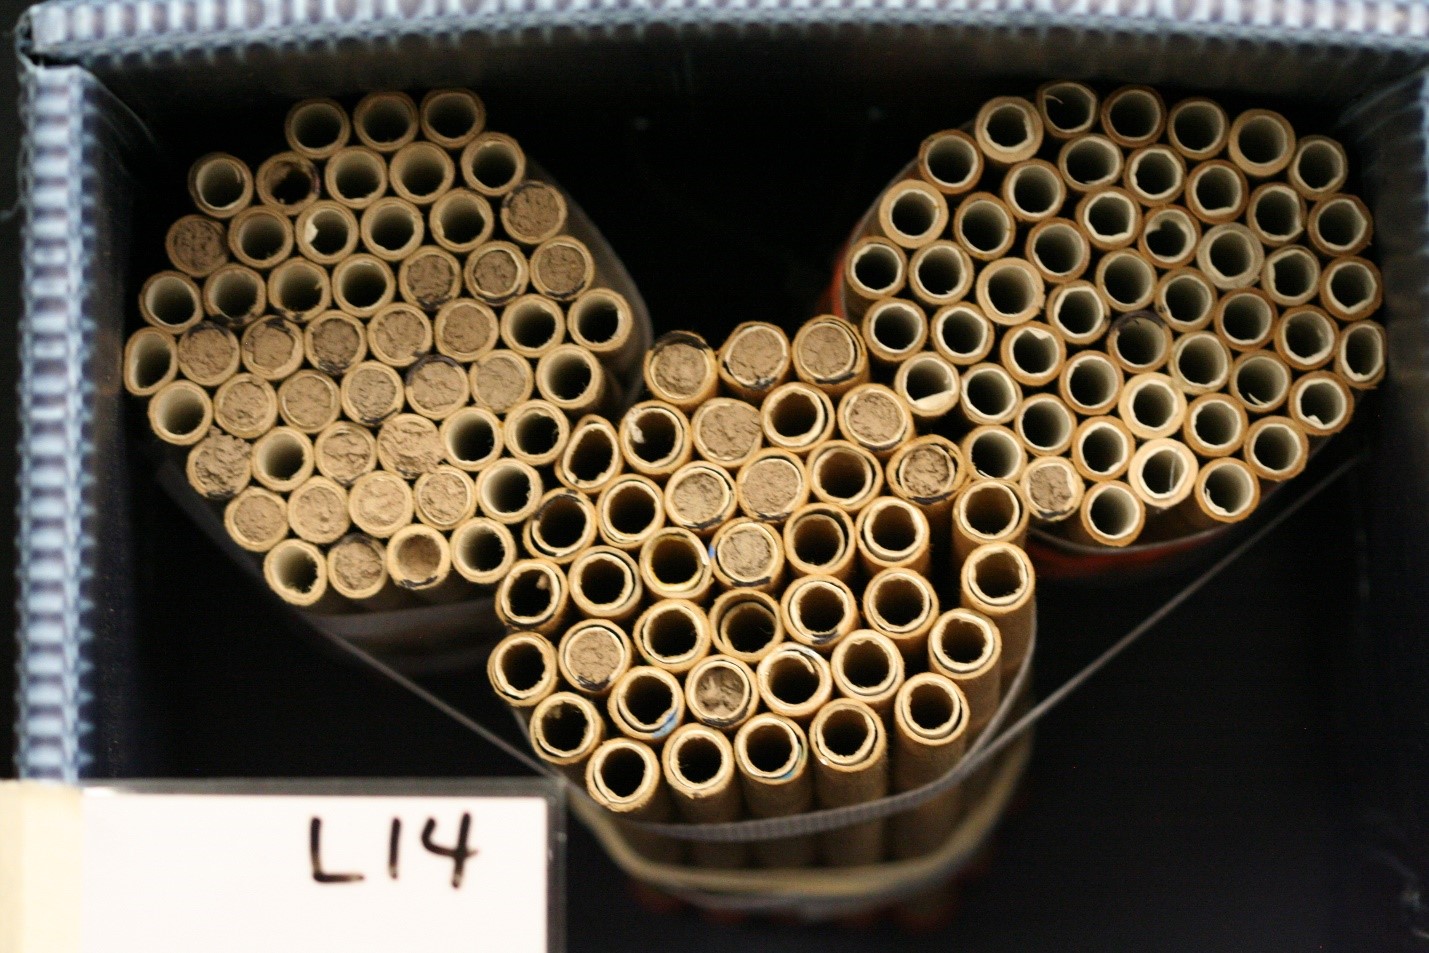
 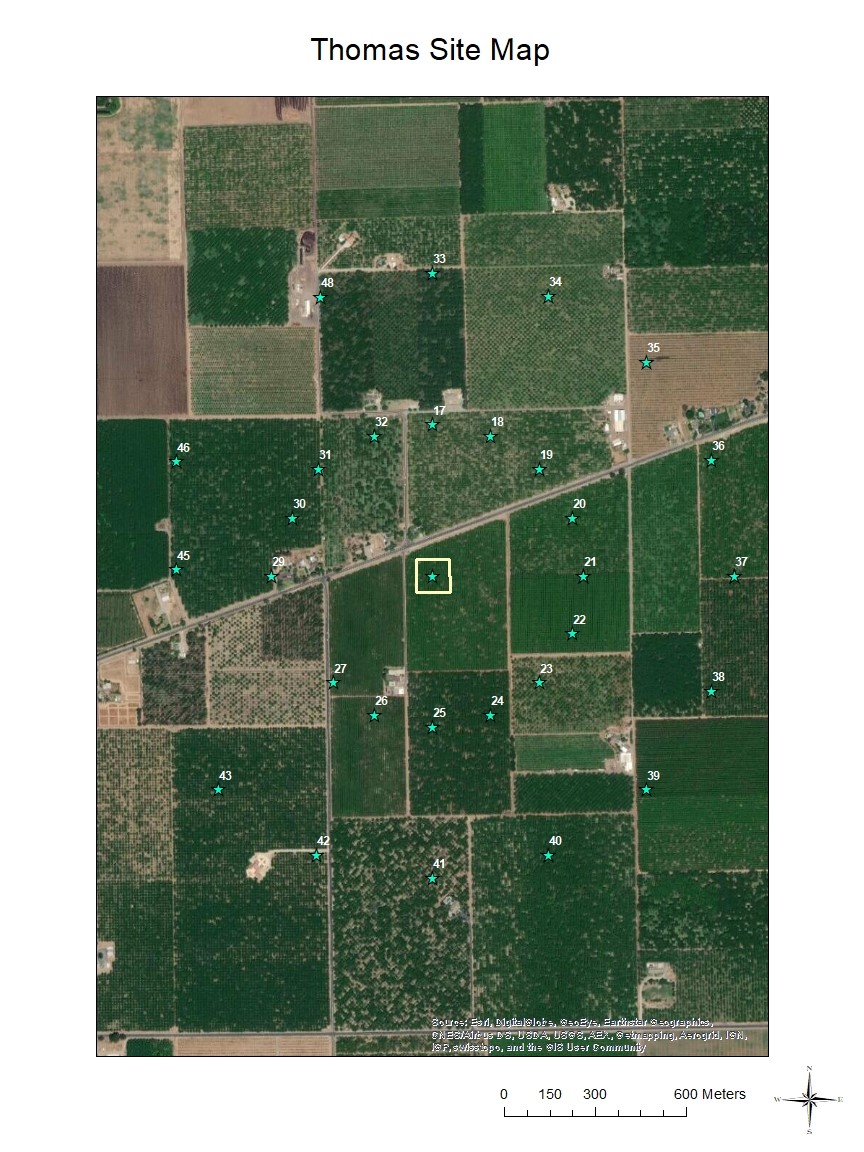 served as the study's bee release and main nesting site, and 16 corrugated plastic nest boxes containing 100 cardboard nesting tubes each (with paper straw inserts) distributed evenly throughout each three-acre section. Sixteen other nesting sites were placed both far (up to 500 m) and very far (1 km) from release points (up to 48 nest boxes per orchard) so that bees collected at all sites could be evaluated for their dispersal distance from release sites. Bees were permitted to forage and nest in orchards throughout the bloom period, during which up to three observations were made (on separate days) at each nest box to score presence of marked and unmarked female BOBs. In Utah, wild blue orchard bee populations have been observed foraging and nesting in managed cherry orchards (Pitts-Singer, unpub. data), which makes the use of the markers imperative for this study. Thus, in addition to evaluating emigration of managed bees from the orchard, we could also detect the immigration of (unmarked) wild bees into the orchard. By analyzing each nesting bee from all orchards in all both regions, we could obtain a thorough estimate of BOB retention over the course of the pollination season and statistically evaluate how dispersal may vary due to source population. To compare female retention at site centers as an effect of population source, we used a generalized linear mixed model with a zero inflated Poisson distribution, with nest box and site as a random variable, and with nest box nested within site. Analysis was run using R 4.0.0 and packages glmmTBM (Brooks et al. 2017) and mgcv (Woods et al. 2016).
Student Mentored
Subawards to transfer funds to Diane Alston of Utah State University for support of the graduate student and to Stephen Peterson of Foothill Bee Ranch were dispensed as cooperative agreements with ARS PIRU.
Graduate student Morgan Dunn performed experiments and analyses for Objectives 1, 2, and 5 and lead efforts to obtain materials for extension videos for Objective 6. She began her Master of Science Degree program in January 2018. Ms. Dunn had timely MS committee meetings and completed all of her coursework to assure that degree requirements were met. She passed her qualifying exam in Fall 2019. She is working to finish her thesis and journal articles from her research so that she will defend her thesis in May 2021 or shortly thereafter.
Bees Acquired
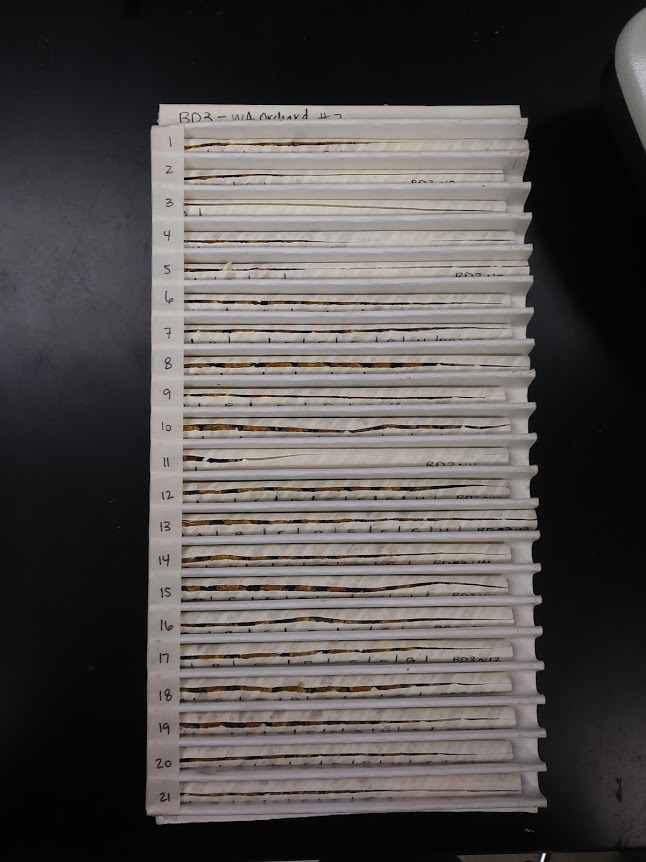
Bee nests containing cocooned adults, natural enemies and dead cells were collected in summers of 2017 and 2018 and (by winter) were shipped to PIRU. From these nests, we designated live bees for Objectives 1, 3, and 4. Cells with natural enemies and dead bees (larvae and adults) or unused provision were preserved for Objective 4. These nests were x-rayed for determining the number and category of each cell type. Bees for Objective 5 were purchased from a Utah suppler and provided for free from collaborator Steve Peterson in California. Other bees were collected through trapping or netting as described in methods .
Studies Performed
 For Objective 1, we coordinated with cooperating bee managers and ARS staff to obtain newly sealed
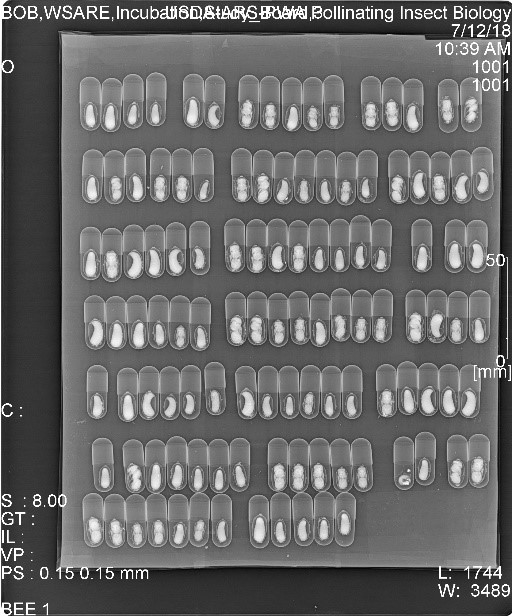 bee nests from Washington, California, and Utah where wild bees could be trapped. Those nests were sent to the Pollinating Insects Research Unit (PIRU) in Logan, UT for rearing at the various temperatures of the different regions, as described in the methods. Due to the problems incurred for getting bees from all regions in 2018, only bees obtained in 2019 were summarized and analyzed for this objective. The cells received from California, Washington, and Utah were randomly sorted so that approximately half of each population were put into incubators and allowed to develop at managed temperatures (constant 26°C) and the other half were exposed to unmanaged temperatures that mimicked their natural climate (6-year average annual temperatures by the hour, updated each week) (Table 1). During larval development, bees were checked three times per week until cocoons were completed ("e" in figure). After which, bees were X-rayed one per week to observe transitions from prepupa to pupa and adult ("f-h", respectively, in figure). Once bees reached adulthood, then bees were X-rayed once per month. One month after bees reached adulthood, the managed bees were gradually cooled over a two-week period until reaching an overwintering temperature of 4°C. Unmanaged bees remained at their natural temperatures throughout winter.
Mortality was high for all CA-sourced bees in both treatments due to desiccation (low humidity levels) 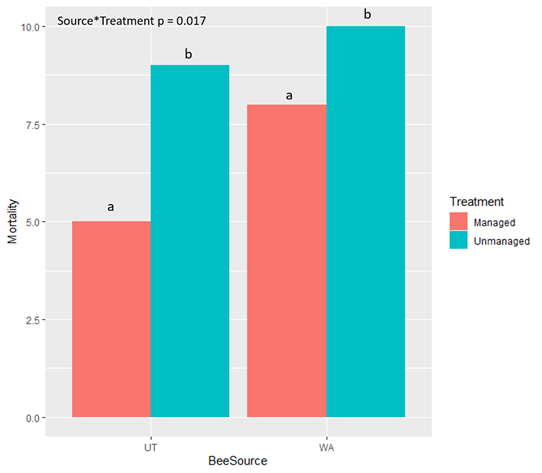 in the chamber containing bees in the
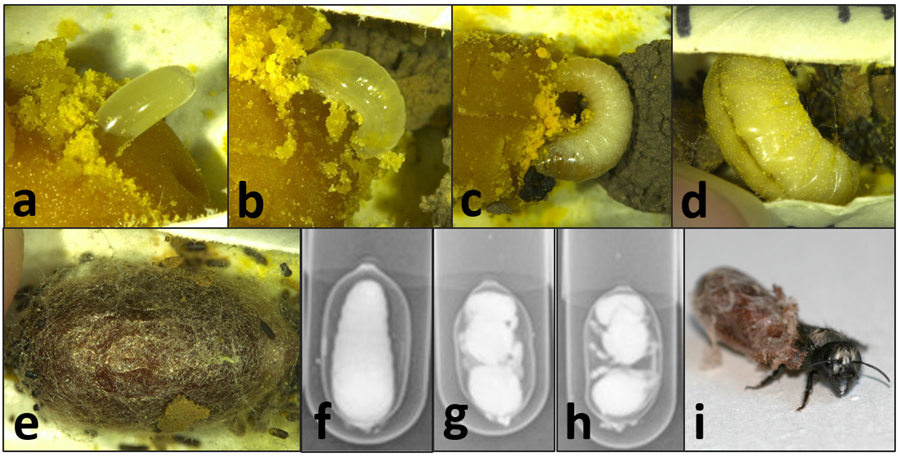 managed treatment and mold in the rearing chamber containing the bees in the unmanaged treatment. Therefore, all California bees were excluded from statistical analyses. We found that bees sourced from Utah and Washington both survived at a significantly higher rate when exposed to managed compared to unmanaged treatments (Table 1). UT-sourced bees that were unmanaged also had significantly lower mortality overall than unmanaged WA-sourced bees (P = 0.01). For bees in the unmanaged treatments, mortality at the prepupal stage was significantly higher in UT-sourced bees than in WA-sourced bees. When comparing mortality of life stages regardless of bee population source, we found that there was significantly less mortality at the egg stage ("a" in figure) than any other life stage. Regardless of treatment, significantly more WA-sourced bees died as larvae ("b-d" in figure) than did UT-sourced bees. For bees in both population sources, the entire immature development was significantly shorter for bees in the managed treatment than bees in the unmanaged treatment. Analysis is ongoing to further compare the duration of life stages between treatments and bee sources, as well as the timing and duration of spring emergence ("i" in figure).
|
Table 1. For bee populations collected as eggs from CA, UT, and WA and reared in incubators for Objective 1, number of eggs for each treatment, percent total survival, and percent mortality at each life stage (2019-2020). |
|||||||
|
Treatment |
n |
Total Survived |
Died as Egg |
Died as Larva |
Died as Prepupa |
Died as Pupa |
Died as Adult |
|
CA Managed |
162 |
22% |
7% |
29% |
17% |
7% |
17% |
|
UT Managed |
373 |
67% |
5% |
3% |
4% |
3% |
17% |
|
WA Managed |
369 |
58% |
7% |
11% |
4% |
4% |
17% |
|
CA Unmanaged |
182 |
0% |
2% |
26% |
47% |
24% |
1% |
|
UT Unmanaged |
325 |
6% |
8% |
13% |
35% |
30% |
8% |
|
WA Unmanaged |
366 |
13% |
5% |
9% |
9% |
20% |
42% |
For Objective 2, Steve Peterson identified Hedgerow Farms as a collaborator to provide floral resources (their own planting of P. tanacetifolia for seed production) for California cage experiments. In late Spring 2018, Morgan Dunn and PI Pitts-Singer transported chilled cocooned bees and field cages to Winters, CA. They set up the project equipment (e.g., cages and nest boxes), painted and measured adult females, and released bees in cages. Steve Peterson assisted Morgan Dunn in obtaining 5 weeks of data in California and he also monitored larval development throughout the summer. From the data collected for year 1, there were no significant differences between BOB crosses in time to initiate nests and in duration of the nesting period, nor in mean cell production per female. Utah adult females were found to be significantly larger than the California females. 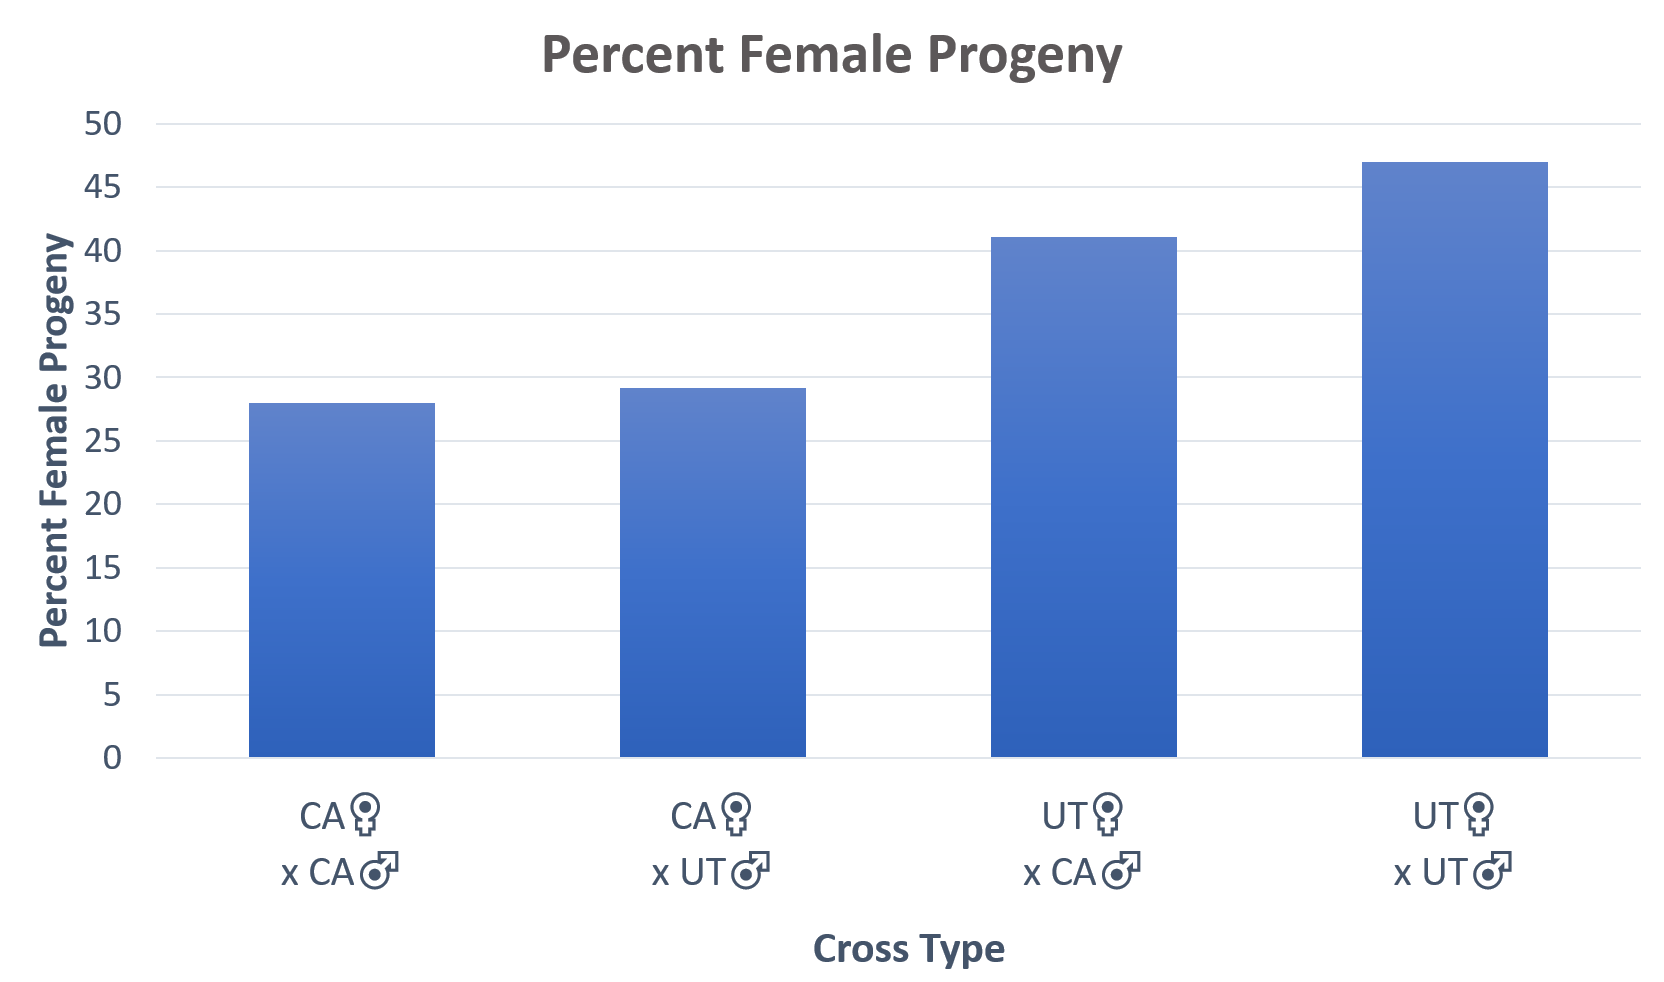 Utah females were twice as likely to nest as were California females. The Utah females also produced significantly more female offspring than did the California females, regardless of which of the source of males with whom they mated.
For the cage experiment work in 2019, Hedgerow Farms was contracted (paid) to plant a field of P. tanacetifolia. An ARS technician was hired specifically for helping with California projects (Objectives 2&5). Because cocooned adults collected from the cage project in 2018 were managed for early spring emergence for the 2019 cage study, all progeny that successfully emerged were again deployed in the same field cages for the 2019 component of the project. We had enough progeny to have one cage per cross, except the “pure Utah” cross, which had 2 cages. The experiment was conducted according to the 2018 protocols, and resulting offspring from these second-year crosses were again reared in a similar manner as the progeny produced from year 1 and were again monitored for spring emergence. Results currently are being analyzed, although there are only small samples and data sets for some crosses.
For Objective 3, an ARS technician was hired to develop and use primers for examining the genetic differences in bee populations. To date, 46 primer pairs were designed and tested for amplification by gel electrophoresis. Pairs that yielded a product sized between approximately 100 and 500 base pairs in length as visualized on gels were then ordered as dye-labeled primers for closer scrutiny of fragment sizes. Seventeen pairs met this criterion. They were tested in single and multiplex reactions using bees from different regions. Three new potential microsatellite loci resulted, and the remainder either were homozygous or amplified poorly. We optimized multiplex reactions to examine genetic differences in bee populations, and we continued designing and testing new primers in 2020.
In 2020, an ARS technician was hired to develop and use primers for examining the genetic differences in bee populations. In total, in silico analysis of microsatellites availability on the BOB genome identified 170,011 imperfect, 33,662 perfect, and 859 compound microsatellites. After filtering for specific criteria, we identified 24 perfect microsatellites and 26 imperfect microsatellites for further testing. No compound microsatellites fit our filtering criteria. After confirming product size of the 50 loci with PCR amplification and agarose gel visualization, 31 microsatellites were identified for continued testing in the current study (Table 1). 16 perfect and 15 imperfect microsatellite loci were retained for further analysis. The figure below shows an example a gel depicting the confirmation of four loci developed in the current study (Oli14, Oli021, Oli053, Oli064), as well as a locus developed for O. rufa (Oru4). Here we only report the results of the 16 perfect microsatellites as we are still testing the 15 imperfect microsatellite using PCR amplification and agarose gel visualization.
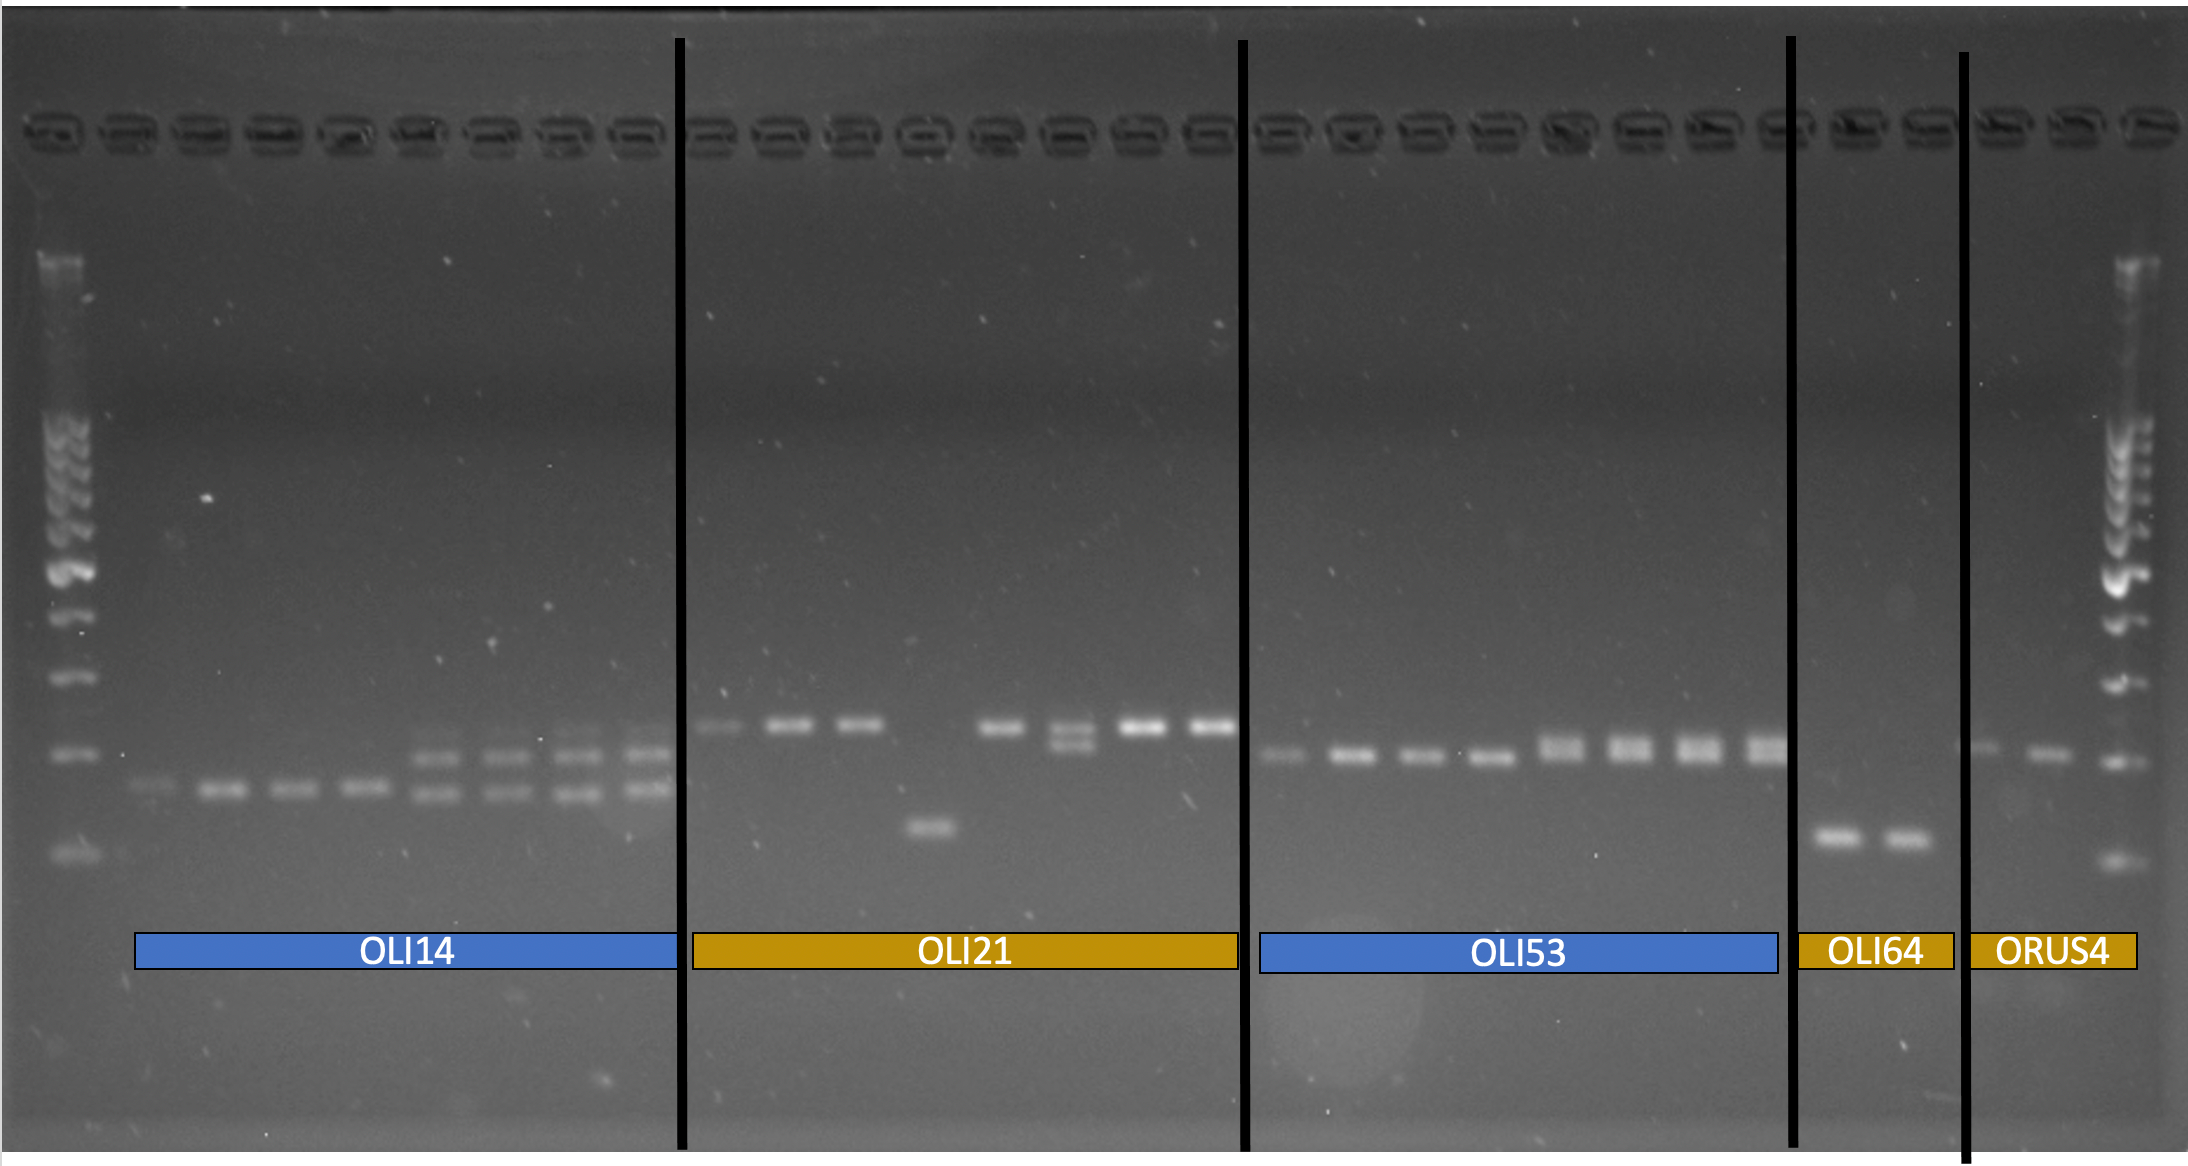 Figure Legend: Image of PCR-amplified DNA of O. lignaria on an agarose gel (1.2%) for four loci (Oli14, Oli021, Oli053, Oli064) developed in this study and one locus (OruS4) developed in a previous study for O. rufa. Ladder is 1 KB (far left side of image); bright band in the middle indicates 500 nucleotide (base) mark.
|
Table 2. Characteristics of 31 microsatellite loci, 15 of which have already been tested on samples of BOBs from four populations in western North America (El Dorado, CA; Franklin, ID; Fresno, CA; Placerville, CA), including primer sequences, core motif, size range, number of successfully genotyped chromosome sets (N), number of detected alleles (A), expected heterozygosity (HE), and employed annealing temperature (Tm). Loci 17 – 31 remain to be tested. |
|||||||||
|
Locus No. |
Locus |
Primer sequence (5' - 3') |
5' end label |
Core motif |
Size range (bp) |
N |
A |
Hexp |
Tm |
|
1 |
Oli064 |
F-CTTTGCAATTGTTGTTGTGC |
FAM |
AAGA |
87-127 |
72 |
9 |
0.83 |
55 |
|
R-CGTATATCGTTCAATCACGC |
|||||||||
|
2 |
Oli131 |
F-AAAGCTACTACCAACACACC |
VIC |
CTT |
118-157 |
71 |
7 |
0.63 |
55 |
|
R-TGCTCGTATCGAAGAATACG |
|||||||||
|
3 |
Oli014 |
F-AAACAGTGAACAGGGATAGG |
NED |
ACG |
107-188 |
71 |
15 |
0.93 |
55 |
|
R-CATCGTCCTCCAAAGTAGC |
|||||||||
|
4 |
Oli216 |
F-AAAGCTACTACCAACACACC |
PET |
GA |
163-191 |
71 |
9 |
0.71 |
55 |
|
R-GGTACGGTGTCAATGATCC |
|||||||||
|
5 |
Oli119 |
F-AAAGCTACTACCAACACACC |
FAM |
AG |
64-128 |
75 |
20 |
0.95 |
55 |
|
R-TTCTGTGTTCATCTCGTTCC |
|||||||||
|
6 |
Oli076 |
F-AATAATCGTCCTAGTTGCCC |
VIC |
GGAA |
154-170 |
69 |
5 |
0.72 |
55 |
|
R-GATACAAACTTGGTCGAACG |
|||||||||
|
7 |
Oli101 |
F-AAGGACGACTTTATCATGGG |
NED |
AG |
142-176 |
67 |
13 |
0.9 |
55 |
|
R-GTGCATAATGAATCAGTGGC |
|||||||||
|
8 |
Oli160 |
F-GAAACGACTGTAAAAGAGGC |
PET |
AGAT |
179-209 |
70 |
7 |
0.75 |
55 |
|
R-GCAATTAGCGAGCATAAGC |
|||||||||
|
9 |
Oli127 |
F-TCAAACCTGATCCCTAATCG |
FAM |
CTTC |
115-135 |
73 |
4 |
0.38 |
55 |
|
R-TGCCATCAAGATCCTAAAGG |
|||||||||
|
10 |
Oli107 |
F-AAAGCTACTACCAACACACC |
VIC |
CTT |
136-166 |
70 |
9 |
0.87 |
55 |
|
R-TGCTCGTATCGAAGAATACG |
|||||||||
|
11 |
Oli238 |
F-GTAATGTAAACGTCACGAGC |
NED |
ACGA |
181-223 |
71 |
7 |
0.77 |
55 |
|
R-TCACAATCATAACCAGACCC |
|||||||||
|
12 |
Oli053 |
F-GCATACGTATTCCAAAGAGC |
PET |
GT |
181-223 |
69 |
10 |
0.86 |
55 |
|
R-CGATAAAGGAGAGGTAACCG |
|||||||||
|
13 |
Oli156 |
F-TAACAAATGAAGGGAGGACC |
FAM |
CT |
99-171 |
74 |
13 |
0.9 |
55 |
|
R-AACAAGCGAAAAAGAAGAGC |
|||||||||
|
14 |
Oli141 |
F-GGCAGCTATTTCACAAATGG |
FIC |
TTA |
128-158 |
70 |
4 |
0.37 |
55 |
|
R-TTTATGTGTGTGGGCTATCC |
|||||||||
|
15 |
Oli134 |
F-TGTACGATGCCGATATTACC |
NED |
GG |
96-108 |
67 |
6 |
0.79 |
55 |
|
R-AGTAAAAAGGGGAAGGATGG |
|||||||||
|
16 |
Oli021 |
F-GAGATTCGAATGCAACGC |
PET |
CTT |
196-241 |
67 |
12 |
0.87 |
55 |
|
R-GAGTAGTGCGATGAAATATGC |
|||||||||
|
17 |
Oli744 |
F-GTTAAACTGATCACGTCACG |
FAM |
TGCC |
- |
- |
- |
- |
55 |
|
R-AGTTAGAAGGCAGAGGGG |
|||||||||
|
18 |
Oli104572 |
F-TTTCGTGTGACTAGTAAGGC |
FAM |
CCG |
- |
- |
- |
- |
55 |
|
R-ACATTCTAGAATCCCATAGCG |
|||||||||
|
19 |
Oli105252 |
F-TAGTCGAAGCTTGATCTGC |
VIC |
ATA |
- |
- |
- |
- |
55 |
|
R-GAACTGTTGGTTTTCGATCG |
|||||||||
|
20 |
Oli963 |
F-CGTCACTGTAAATTATCGCG |
VIC |
ACC |
- |
- |
- |
- |
55 |
|
R-AAATTTCGTGAATGAGACGC |
|||||||||
|
21 |
Oli62954 |
F-TTCGTGCGCTAATAAATTCC |
NED |
TAG |
- |
- |
- |
- |
55 |
|
R-TGAATTAACCCTTTCGTTGC |
|||||||||
|
22 |
Oli84207 |
F-ATGAAGGGAAGATTACAGGC |
PET |
GTT |
- |
- |
- |
- |
55 |
|
R-TCAATCGTATCCCTGAAAGC |
|||||||||
|
23 |
Oli76146 |
F-AAGTTATCGGGGAGTTTAGC |
FAM |
GGT |
- |
- |
- |
- |
55 |
|
R-ATCCCTATTACGAACGAAGC |
|||||||||
|
24 |
Oli61901 |
F-ACCACATAAACATCAGTCGG |
VIC |
AAT |
- |
- |
- |
- |
55 |
|
R-AGAAAGCGAAATAGCCTCG |
|||||||||
|
25 |
Oli51967 |
F-AATTTCTCTCTCCGATTCCG |
NED |
GA |
- |
- |
- |
- |
55 |
|
R-CGAAGAGTAGCGAGATTACC |
|||||||||
|
26 |
Oli144609 |
F-CGGGATAAGGTGAAAATTTCG |
PET |
ACA |
- |
- |
- |
- |
55 |
|
R-TCCTGTTACTAATGTTATCCGG |
|||||||||
|
27 |
Oli103483 |
F-CTTCATCATCGTCATTGTCG |
PET |
AT |
- |
- |
- |
- |
55 |
|
R-ATGTGCCGTACTATGTATGG |
|||||||||
|
28 |
Oli61901 |
F-ACCACATAAACATCAGTCGG |
VIC |
AAT |
- |
- |
- |
- |
55 |
|
R-AGAAAGCGAAATAGCCTCG |
|||||||||
|
29 |
Oli76146 |
F-AAGTTATCGGGGAGTTTAGC |
FAM |
GGT |
- |
- |
- |
- |
55 |
|
R-ATCCCTATTACGAACGAAGC |
|||||||||
|
30 |
Oli118533 |
F-AATCAGCTAGAAGGGAATGC |
PET |
GAAC |
- |
- |
- |
- |
55 |
|
R-CGAAACGTCATTTATCGAGC |
|||||||||
|
31 |
Oli128807 |
F-ATGCTCACAACTGAAAAACC |
PET |
CAA |
- |
- |
- |
- |
55 |
|
R-CTATTTCCGCTTGCAACG |
|||||||||
For the 16 perfect microsatellite loci that produced product sizes < 250 nucleotides, average allelic richness and Hexp across all populations was 0.37 (±0.02 SEM) and 0.66 (±0.03 SEM), respectively. The average number of successfully genotyped chromosome sets to estimate these genetic diversity metrics is 70.67 (±0.59) (Table 2). For these loci, we tested for differences in genetic diversity and structure in four populations of BOBs: Franklin, ID (n = 8), Placerville, CA (n = 13), El Dorado, CA (n = 16) and Fresno, CA (n = 11).
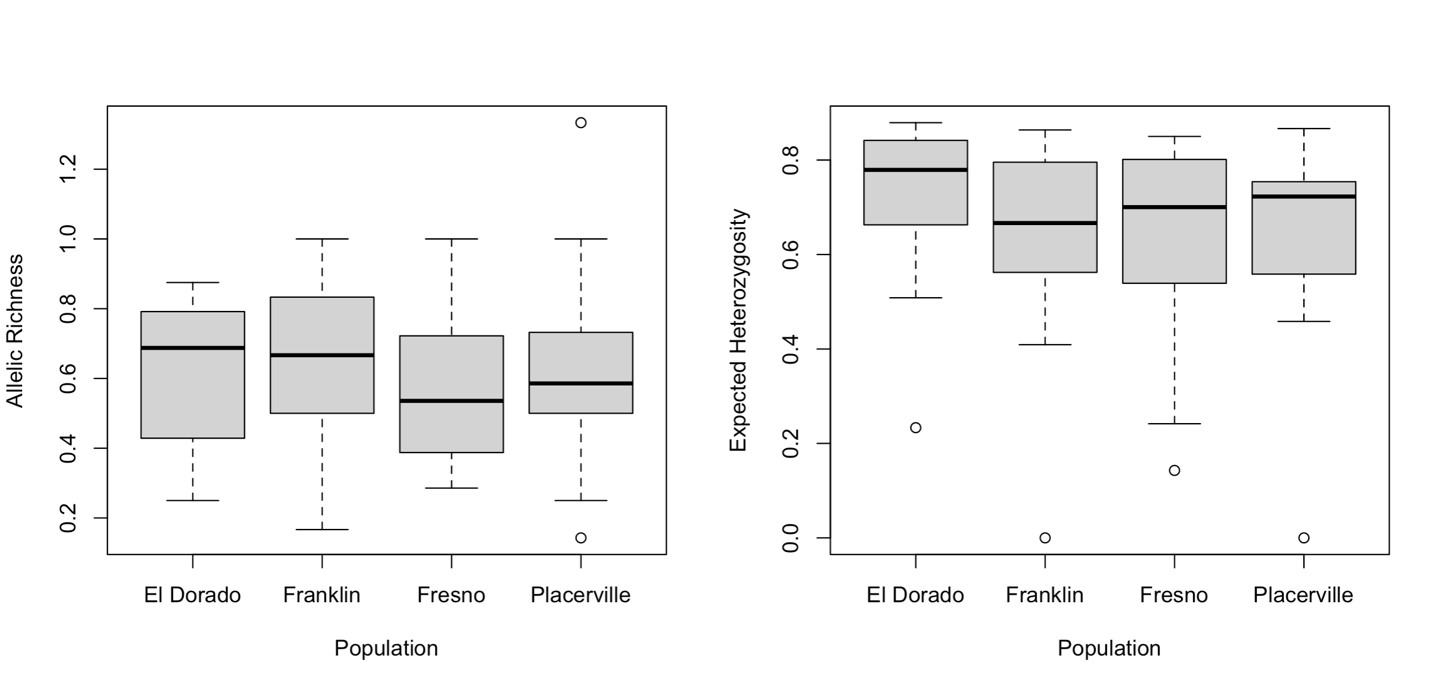 Figure Legend: Median allelic richness (A) and Expected heterozygosity He (B) across four BOB populations (El Dorado, CA; Franklin, ID; Fresno, CA; Placerville, CA) in western North America.
We failed to reject the null hypothesis that there are significant differences in average allelic richness (Kruskal Wallis Test: X2 = 2.03, df = 3, P = 0.57) (Figure A) and Hexp (Kruskal Wallis Test: X2 = 3.53, df = 3, P = 0.32) (Figure B) across BOB populations). Furthermore, AMOVA results found only 12.20% of the genetic variation among the four populations, 64.60% among individuals within the four populations, and 23.19% within individuals. Because most of the variance occurs among individuals within the four populations (64.60%), there is evidence of significant population genetic structure (overall FST = 1.24, p = 0.0009) (Table 3). Furthermore, there is no evidence for inbreeding within populations (overall FIS = 0.71, p = 0.98), which is supported by high estimates of allelic richness and Hexp.
In conclusion for Objective 3, we have identified 16 novel microsatellite loci for BOBs that are immediately available for population genetic analysis. These loci exhibited high genetic diversity (allelic richness, Hexp) and have the capacity to estimate genetic structure (FST, FIS). These loci have the potential to inform management and conservation decisions. Continued research at PIRU will be pursued to determine the utility of the 15 novel imperfect microsatellites identified in this study (Table 2).
|
Table 3. Results of analysis of molecular variance (AMOVA) for BOB populations across four populations (El Dorado, CA; Franklin, ID; Fresno, CA; Placerville, CA) based on the allele frequencies of 16 microsatellite loci. |
||||
|
Source of variation |
df |
Sum of squares |
Variance components |
% Variation |
|
Among populations |
3 |
129.62 |
1.53 |
12.20% |
|
Among individuals within populations |
28 |
533.76 |
8.08 |
64.60% |
|
Within individuals |
32 |
92.83 |
2.90 |
23.19% |
|
Total |
63 |
756.29 |
12.51 |
100 |
|
FIS = 0.71, p = 0.98; FST = 1.24, p = 0.0009 |
|
|
||
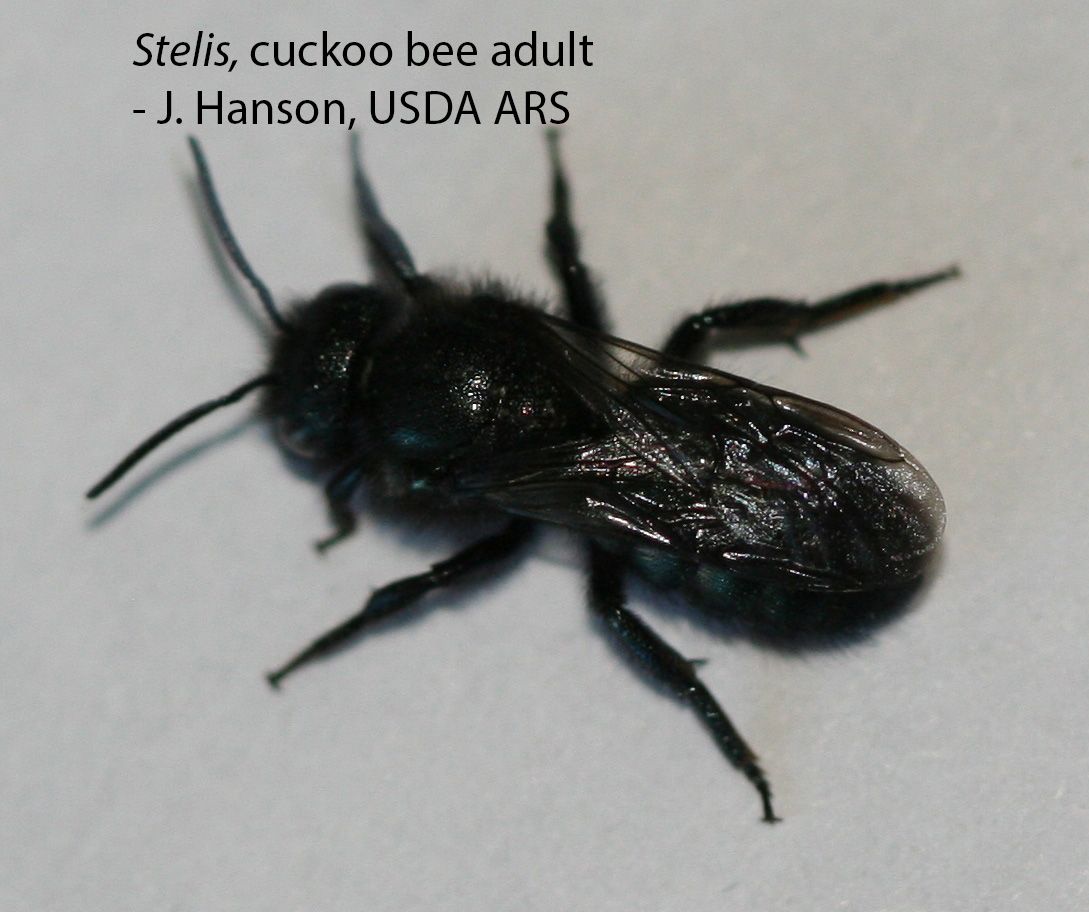
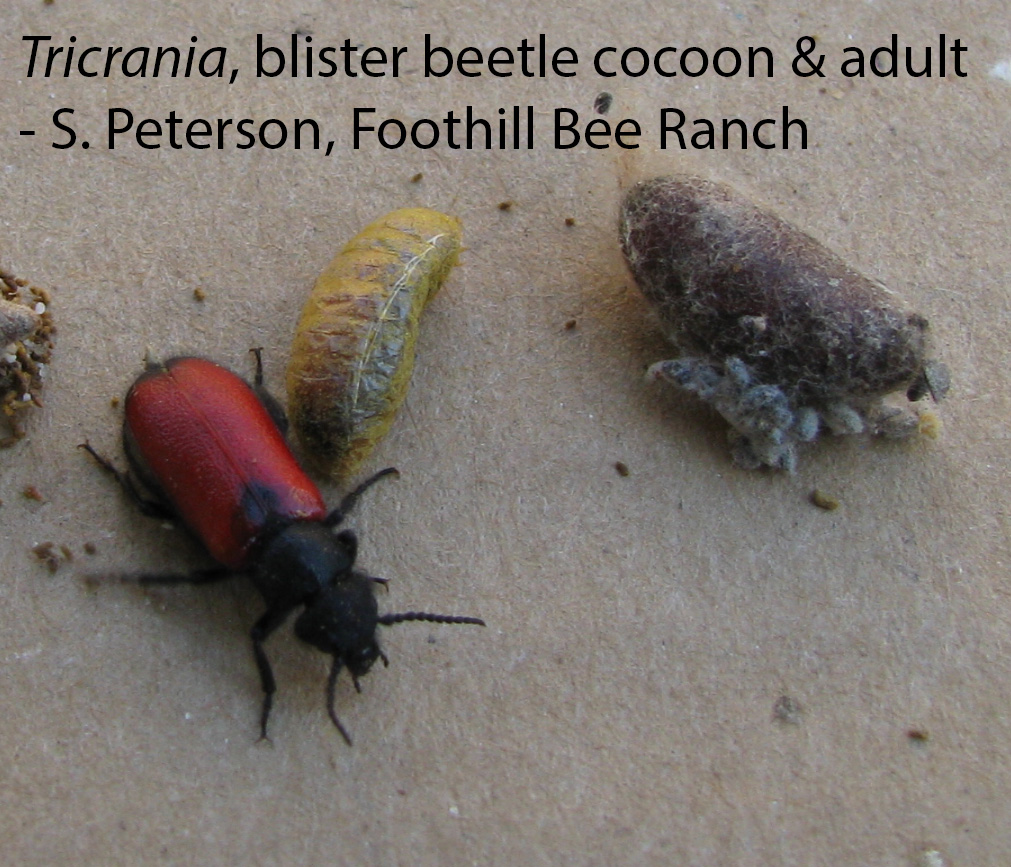
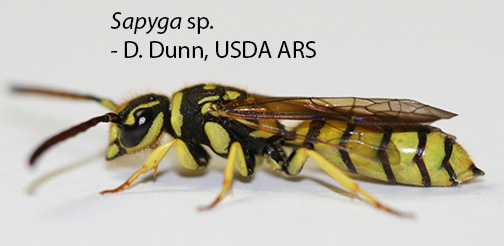
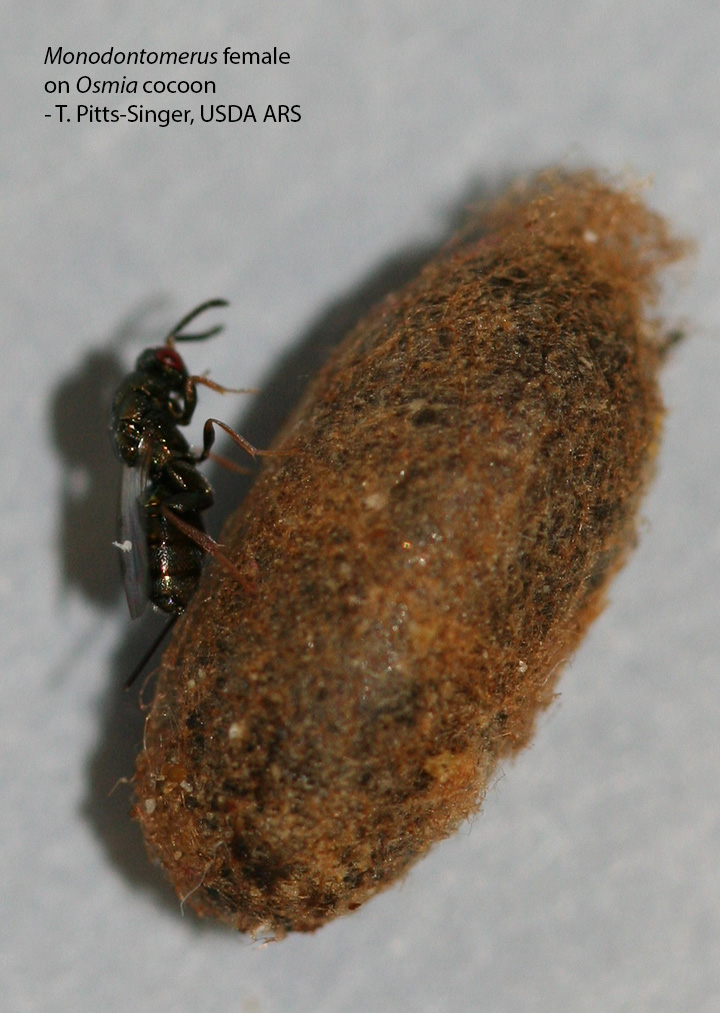
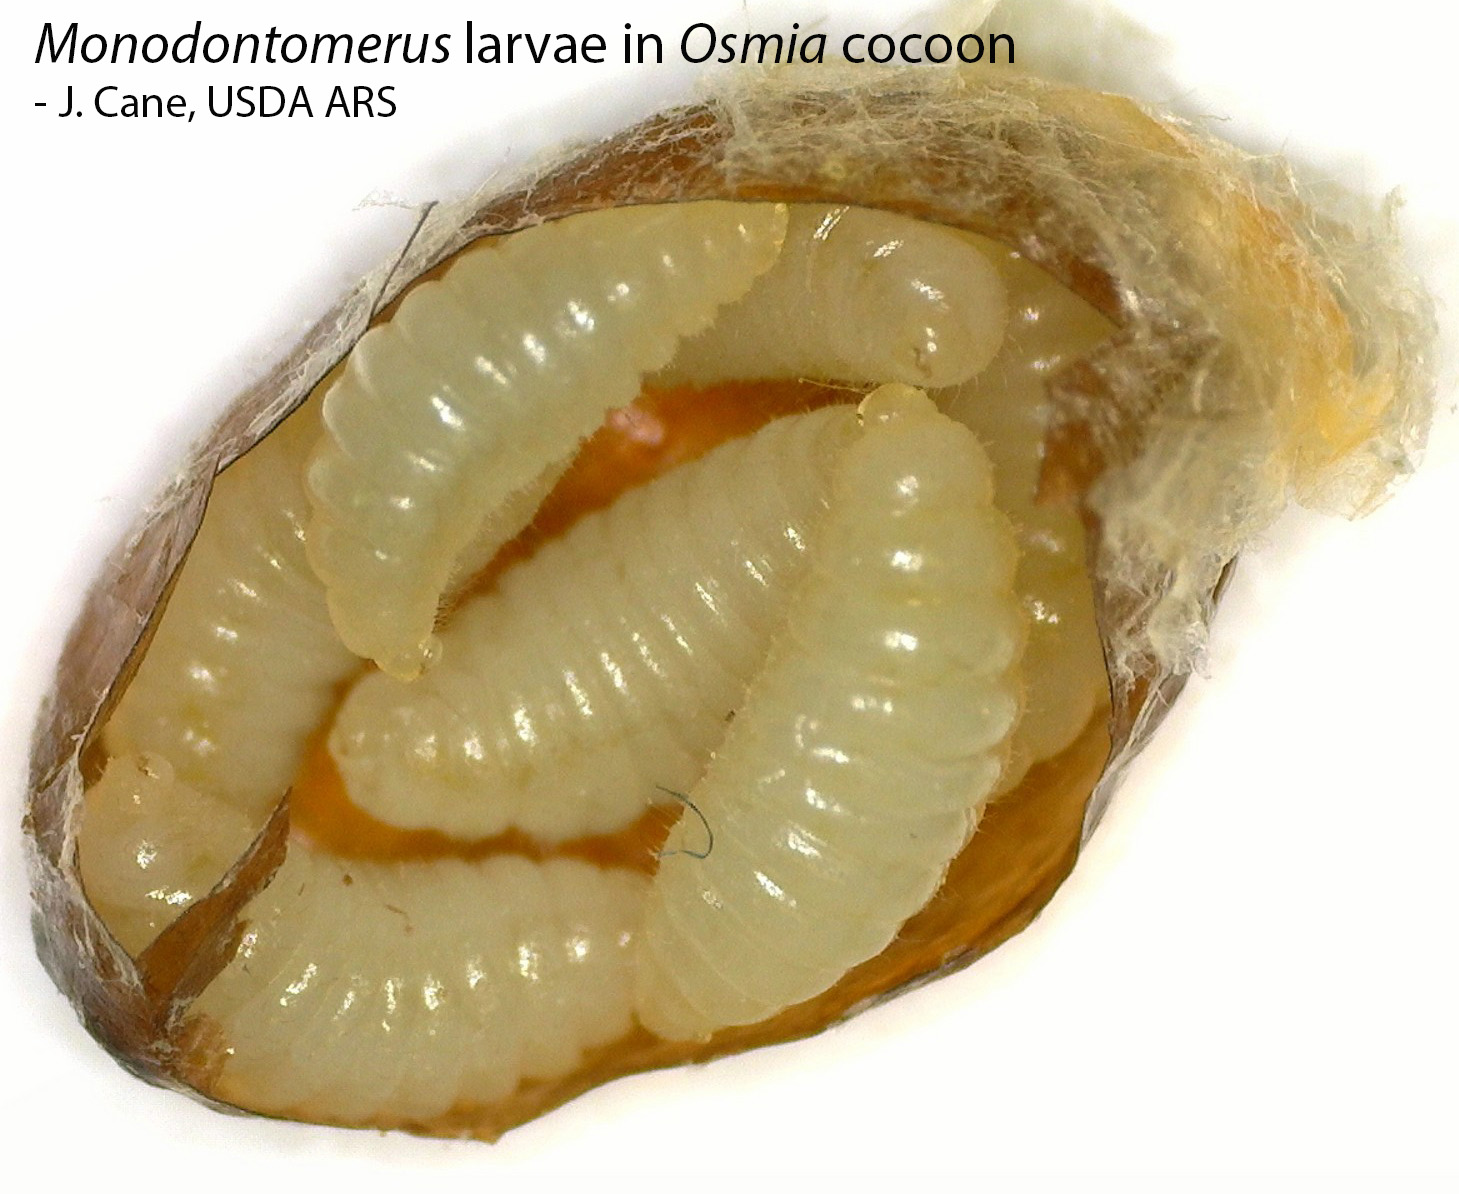
For Objective 4, BOB nests collected in 2017 from wildlands in California, Washington, and Utah (three sites in each state) contained x-ray detectable pests and one pathogen (Table 4). Of cells examined, the natural enemies included the cleptoparasites Stelis sp. (cuckoo bee; Megachilidae), Tricrania (blister beetle; Meloidae), and Sapyga sp. (wasp, Sapygidae), and the parasitoid Monodontomerus obscurus (wasp, Pteromalidae). The presence of some cells containing chalkbrood indicates that the fungal pathogen Ascosphaera sp., presumably A. torchioi, contributed to the death of some larvae. There were also other dead immatures to which no cause could be assigned. From these collections and rates of parasitism, we can conclude that the Utah samples were the most affected by Stelis, and the California samples had the most diverse array of natural enemies. By far for these populations, most cells contained healthy, live adult bees (Table 4). It was brought to our attention that some bee trappers clean out natural enemies and release bees back into trapping sites. This activity may artificially reduce the number and types of natural enemies found at these particular sites. Future studies are needed over multiple years to better elucidate the types and rates of attacks by pests and pathogens in sites where trappers are not influencing the bee populations.
|
Table 4. By state in which they were collected in 2017, number of cells examined and percent of those cells that contained live adults, natural enemies, or chalkbrood larvae. |
|||||||
|
State |
N cells |
% Live Bees |
% Stelis |
% Tricrania |
% Sapyga |
% M. obscurus |
% chalkbrood |
|
CA |
575 |
86.6 |
0.7 |
0.9 |
1.2 |
2.4 |
3.3 |
|
WA |
906 |
95.6 |
0.1 |
0 |
0 |
1.4 |
0.3 |
|
UT |
156 |
85.9 |
10.3 |
1.3 |
2.6 |
0 |
0 |
Given limited stocks of bees from the three different states, it was challenging to get adequate healthy bee samples from the different regions, in particular from Washington and California. In addition, the COVID-19 pandemic created issues with performing the molecular assays for the pathogens with samples being extracted right before the lab work was affected (samples are being stored at -80 °C for future work). Additional work will be performed when possible to gain a more complete record of the pathogens in BOBs from the different regions using these samples. From California, 179 dead BOB larvae have been extracted for RNA and DNA and await analysis. For newly emerged adult bees, we have extracted DNA and RNA from 52 bees from California, 64 from Utah, and 27 from Washington. We plan to analyze these bees for most of the pathogens described below in a complete discussion of our research findings on pathogens in Osmia and how their findings may impact use of Osmia in pollination or mass propagation systems. Many of the Osmia are being sourced from wild populations and bee managers may sell their stock of bees to people in other states. The chance for movement of pathogens from one area to another exists, so it is important to determine what pathogens to looks for.
The need for greater characterization of pathogens infecting Osmia and other cavity nesting bees was emphasized by an early study undertaken for comparing bee health for cavity-nesting bees and for Osmia species specifically. In replication of nest trapping studies done in the 1970’s, 1980’s, and early 2000’s, decreased numbers of Osmia and other bee species were found in 10 sites near Logan, UT in the summers of 2018 and 2019. The nest cells were analyzed, and the emerged adult bees identified. The patterns across the two years varied, with a greater number of failed cells in early development (pollen balls) found the second year, especially in the Mendon, UT site (M) where the majority of BOBs had been found the previous year. Dead larvae and pupae were detected without any known pathology. Some dead larvae with recognizable chalkbrood infections were found. Among the cells for the variety of bee species, a low % of parasitized cells were detected. However, in 2020, another study in the mountains outside of Logan, UT with Osmia bruneri, found a very high proportion (>60%) of the larvae parasitized with Melittobia. The same parasitoid has been reported in Osmia agalia in Oregon. Additional studies are needed to determine how common this parasitoid wasp is in natural BOB populations.
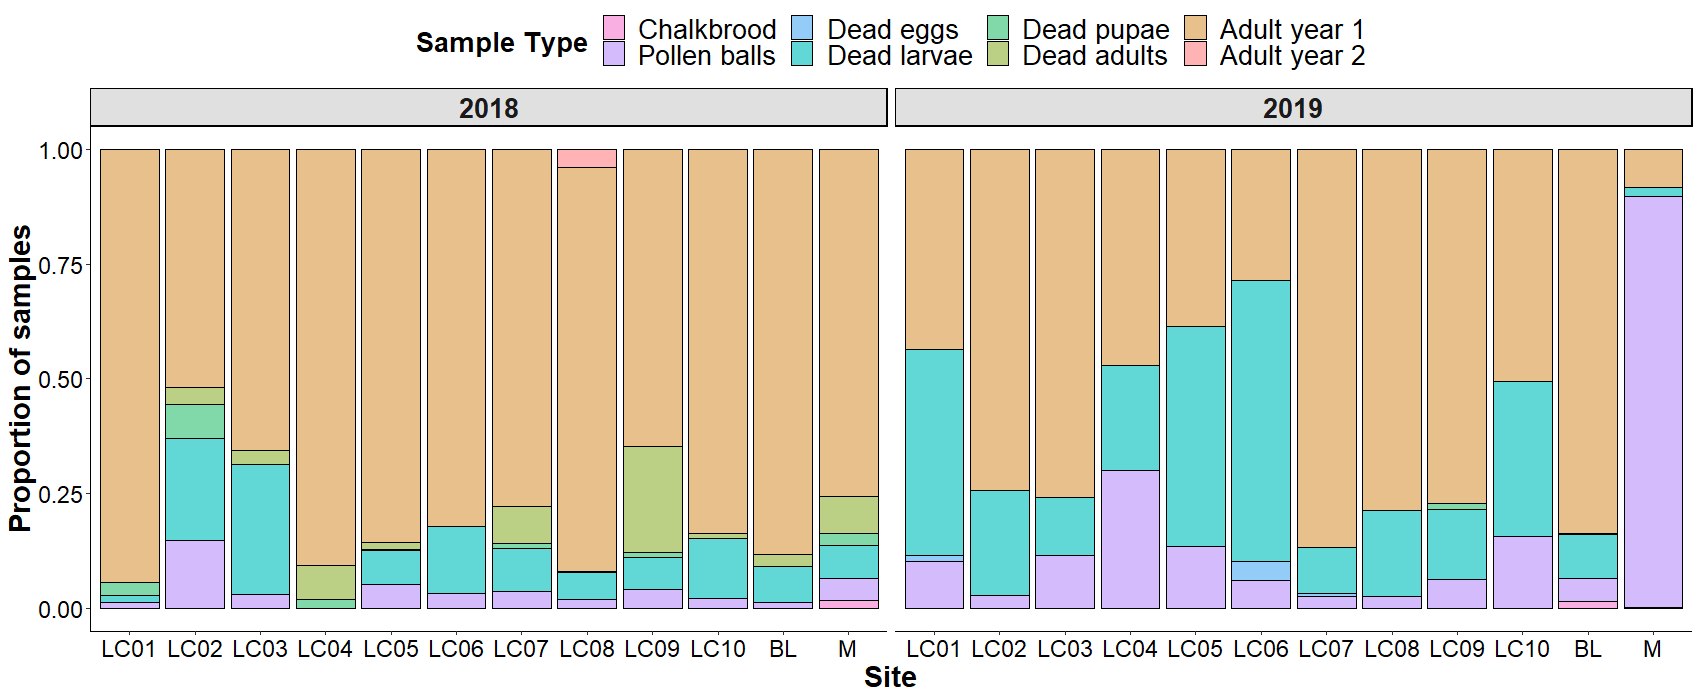 Figure Legend. Characterization of bee mortality in cavity-nesting bee species in wild areas. During 2018 and 2019, nest block traps were placed 12 sites outside of Logan, UT in replication of previous studies conducted by Dr. Frank Parker. Multiple hole sizes were used, to allow for sampling a wide variety of the cavity nesting bees. At the end of fall, the nests were opened, and the status of the cells determined. Pupating or diapausing bees were put into gel capsules and incubated at the appropriate seasonal temperatures. Cells with live bees that did not emerge in the subsequent summer were incubated again at the appropriate over wintering temperatures. In 2019, dramatic changes in bee development were observed at site M, potentially correlated with increased rainfall and cooler temperatures.
Insight into pathogens of concern come from a study determining the bacterial microbiome in pollen provisions for BOBs and O. ribifloris from samples taken in 2015 and analyses performed in 2019 (Rothman et al. 2020). In this comparison, bees were reared at the same four sites, a screenhouse without prior honey bee or bumble bee flights, an urban garden, and two wild land areas in USFS lands. The two bee species have separate floral host preferences. The microbiome of the pollen provisions was found to significantly differ between the two species with majority of bacterial species not being in common. The bacterial members of the microbiome in the pollen provision were determined by barcode regions of the genomes. No common set of microbes were associated with the samples for either bee species. The pollen provisions from the four locations also differed in their microbiome compositions. In areas with known honey bee and bumble bee colonies, several species of bacteria (Sodalis, Wolbachia, Lactobacillus, Snodgrassella, and Gillamelia) were detected at low levels in the pollen provisions for both species. Sodalis was found in a significantly higher percentage of samples in BOB nests. Sodalis and Wolbachia are both symbiotic bacteria found in other insects and have been suggested to potentially be pathogenic under some conditions. Some Lactobacillus are considered to be a beneficial gut bacterium involved in digesting pollens. Snodgrassella and Gillamelia are symbiotic gut bacteria found in both honey bees and bumble bees. Future research is needed to determine if these bacteria are capable of colonizing or infecting Osmia species.
Rothman JA, Cox-Foster DL, Andrikopoulos C, McFrederick QS. Diet Breadth Affects Bacterial Identity but Not Diversity in the Pollen Provisions of Closely Related Polylectic and Oligolectic Bees. Insects. 2020 Sep 20;11(9):645. doi: 10.3390/insects11090645.
Analysis of extracts of newly emerged BOB adults via DNA polymerase chain reactions did detect Spiroplasma, Rikettsia, Wolbachia, and Arsenophorus in a limited number of bees from California and Utah. In addition, sequences for Wolbachia were found in genome projects for BOBs from Utah. The one genomic project used isolated legs from bees for the DNA extractions, after the legs were rinsed of contaminating DNA, indicating that the bacterium was likely to be intracellular. Wolbachia is known to be an intracellular endosymbiont in other insect species. The detection of these four species in BOBs from California and Utah populations is a significant finding; in other insect species, it is known that insects having different strains of these species may have disrupted reproduction with death occurring in the embryos of the bees. Additional research is needed to determine if there is strain variation in BOB populations and if these species are linked to impacts on reproduction.
RNA viruses found in multiple bee species are known to be transmitted via fecal-oral routes on pollen. In addition, these pathogens may be vertically transmitted from mothers to their eggs via transovariole routes. For common RNA viruses, viral pathogens were detected using RT-PCR in eastern populations of BOBs and O. cornifrons (Pennsylvania) and in BOBs in California and Utah. In the Pennsylvania specimens, adult bees taken from nest cells had detectable levels of Deformed Wing Virus (DWV), Lake Sinai Virus (LSV), Blackened Queen Cell Virus (BQCV), Kashmir Bee Virus (KBV), and Israeli Acute Paralysis Virus (IAPV). Interestingly, BOBs and O. cornifrons from nests in the same apples orchards differed in viruses being detected, with BOBS having detectable KBV and O. cornifrons having DWV. In Utah and California populations, low levels of DWV and SBV have been detected in a limited number of samples tested. Further research is needed to determine the impacts of these viruses upon BOB health. In a related study, BOB larvae fed pollen contaminated with a viral slurry had significantly higher mortality than larvae fed pollen alone. Additional research is needed to determine how viral infections correlate with bee health in the field.
For protozoan pathogens, no Trypanosome pathogens were detected in samples from Utah wild lands. Primer sets recognizing Lotmaria and Crithidia were reacted with DNA extracts of 87 BOB adults and larvae from four sites in Utah; and these samples included both healthy and dying individuals. A known positive was included in the PCR assays. None of the extracts from the BOB samples had a reaction. Studies in other solitary bees have not reported detection of trypanosomes; although, these are commonly found in honey bees and bumble bees. A newly published study did report that BOBs can be infected with Crithidia when fed pollen with this protozoan; so future studies on unhealthy BOBs need to consider this potential infection.
For fungal pathogens, the best-known pathogen is Ascosphaera. This genus has many species, and there is a lack of understanding on the full extent of the number of species and their host associations. For BOBs, the chalkbrood is known to be caused by Ascosphaera torchioi. In collaboration with Kathryn LeCroy, we participated in characterizing and sequencing chalkbrood isolated from samples of BOBs from the state of Virginia. Some of the samples were characterized by sequencing PCR products and found to be Ascosphaera fusiformis. This species was previously identified in Japan as infecting O. cornifrons. Kate LeCroy’s research is determining if this fungal pathogen is newly introduced into the United States. This finding is important, since there have been some reports of BOBs being shipped from the east coast to the west coast. In future years, the species of chalkbrood needs to be confirmed in bee samples from the western United States, since the newly introduced pathogen may have different impacts on the larvae.
For other fungal pathogens, we have new findings. Microsporidia are fungal pathogens that have evolved to become host-specific pathogens. These are known from honey bees and bumble bees, with distinct microsporidia species infecting these bees. For the first time, we have detected microsporidia in BOBs. In bees taken from nests in four wild-land locations in Utah, 59 out of 87 sampled bees tested positive for presence of microsporidia, using DNA PCR reactions. In these positive reactions, multiple bands were detected in some samples, suggesting the potential for multiple microsporidia species. For the 87 samples tested, both live and dead bees (died during development in nests) were included. A greater proportion of dead bees were found to have microsporidia as compared to the live bees (N=87, d.f.=1, Pearson Chi Square=6.939, p= 0.0084).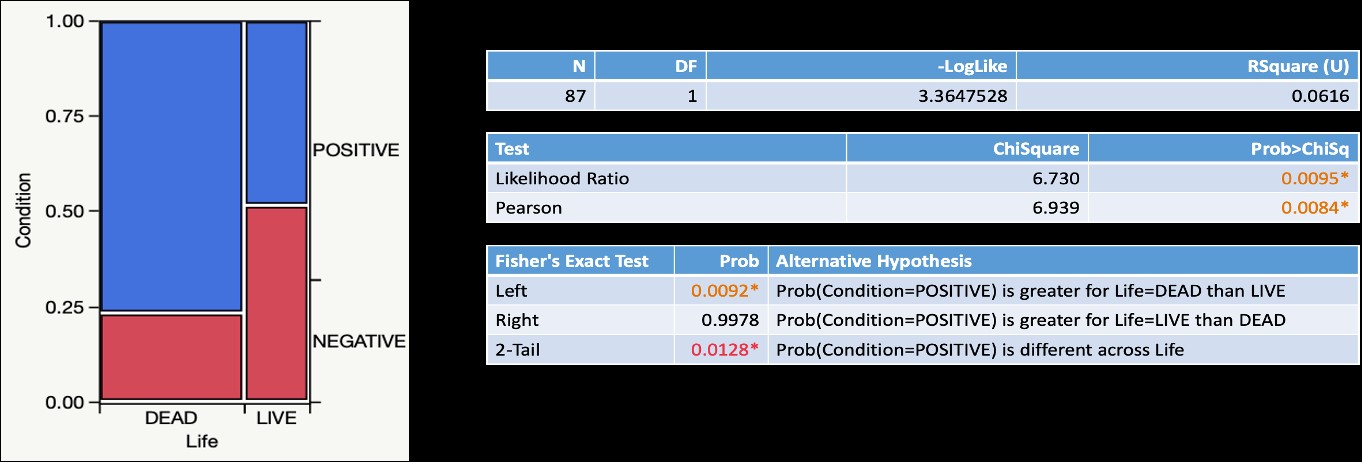
Figure Legend. Detection of microsporidia sequences is significantly greater in dead BOBs than in live BOBs.
In two of the locations in which the success rate in nesting was monitored, the presence of microsporidia correlated with a greater chance in nest cell failure. We are following up with characterizing the identity of the microsporida and determining the role of the bee health.
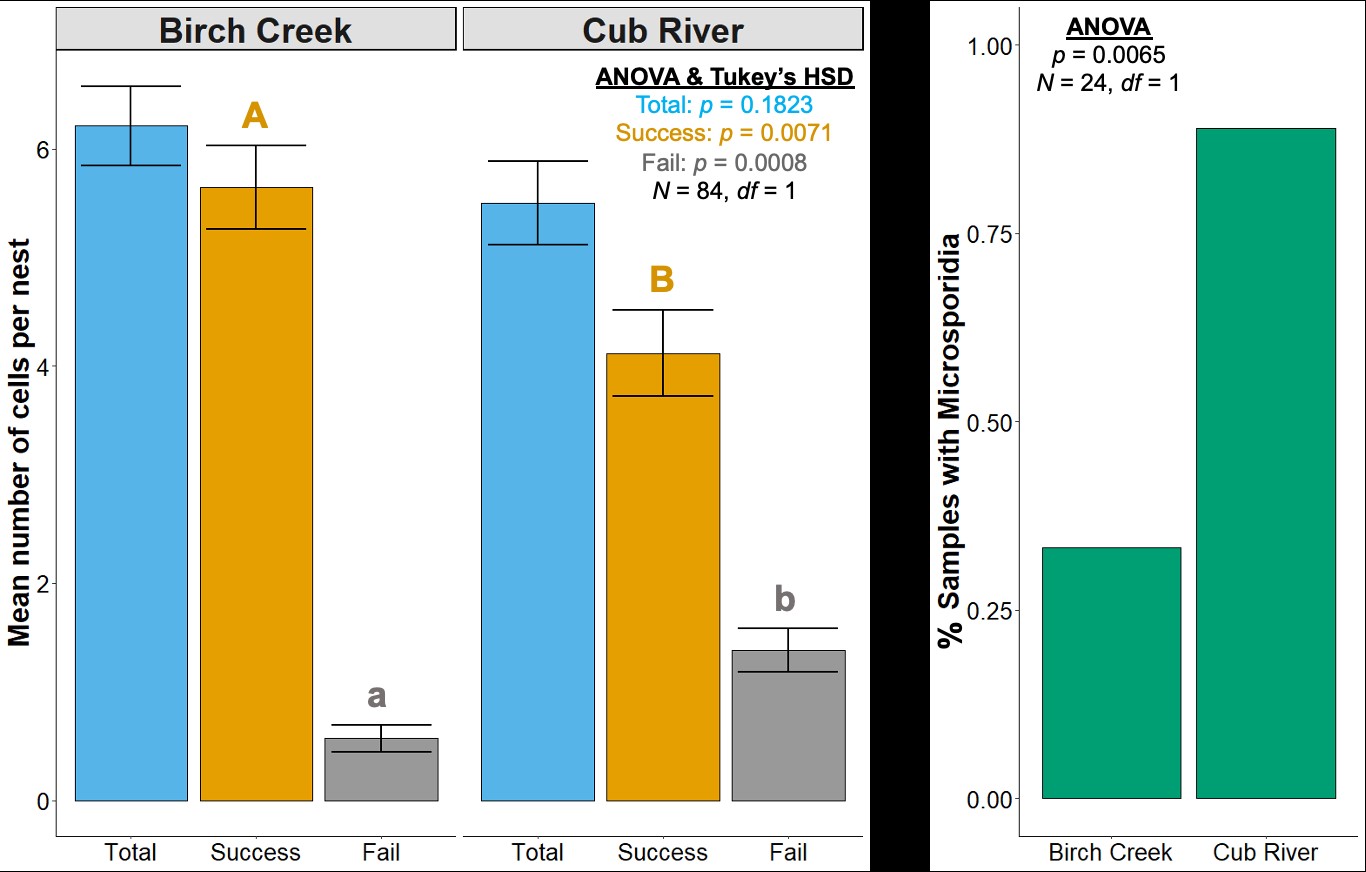 Figure Legend. Detection of microsporidia in adult BOB samples is correlated with the proportion of failed cells in nests, in comparison of two locations near Logan, Utah. The Cub River site has a known history of extensive illicit nest trapping and is associated with an increase in road traffic, while Birch Creek site is isolated and has no known history of illicit nest trapping. More research is needed to understand the role of stress in microsporidian infections in Osmia.
For Objective 5, Stephen Peterson identified cherry producers that allowed use of their property for the 2019 research work to occur. 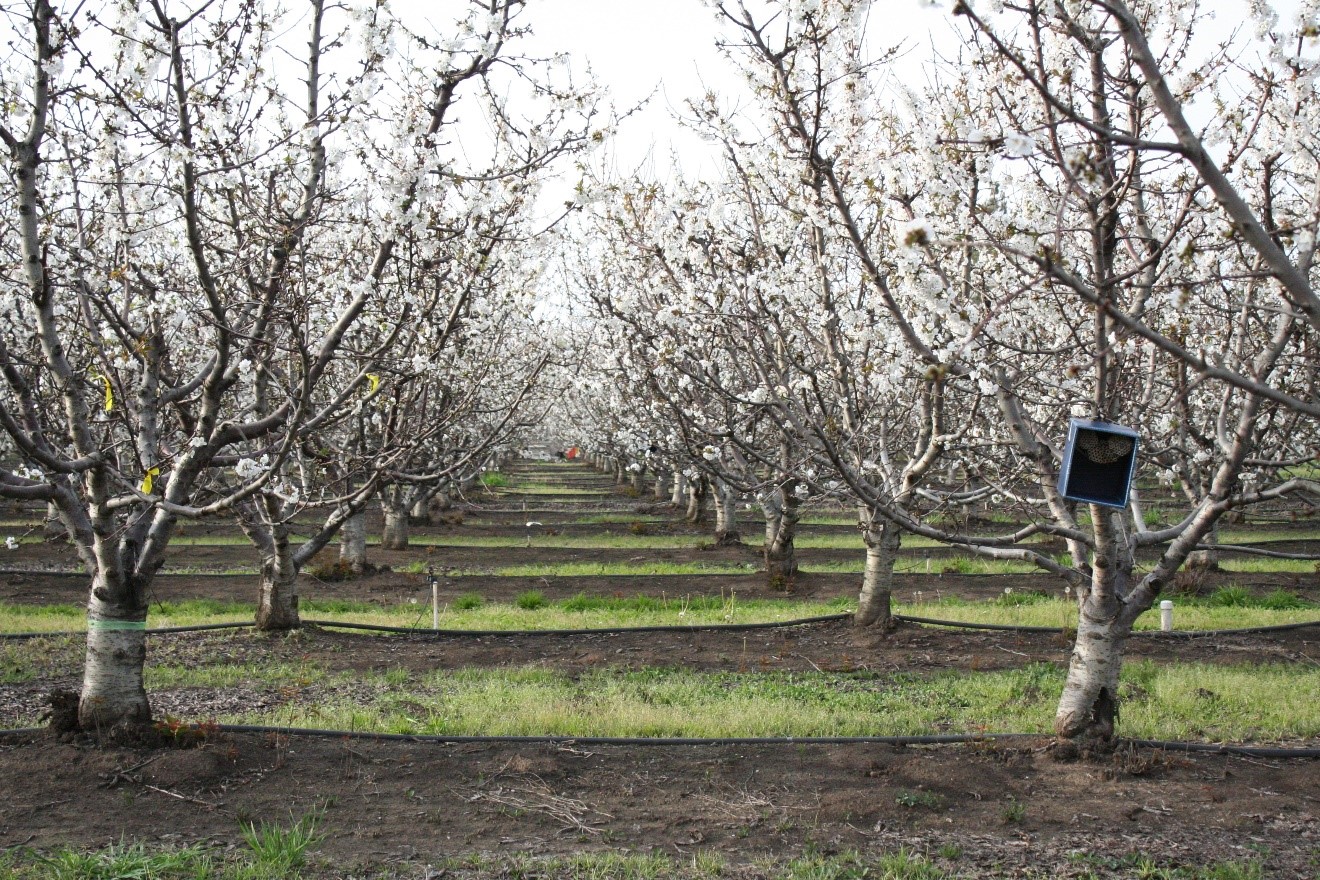 Dr. Peterson also provided CA-sourced bees, and UT-sourced bees were purchased for use. In California sweet cherry orchards, we had low female retention; a mean of 3.9% of the females released were later detected nesting at site centers. Comparing female retention based on population source, we found that significantly less CA-sourced females were retained at site centers than UT-sourced females (p<0.0001). We detected marked bees nesting far and very far away, showing that BOBs are capable of dispersing at least 1 km in dense agricultural lands. Only 3 CA-sourced females and 5 UT-sourced females were detected nesting far or very far away across all three sites. Nine unmarked females were detected across all three sites only at site centers, suggesting that these bees were probably sourced from our cocoons released as males and are not from local populations.
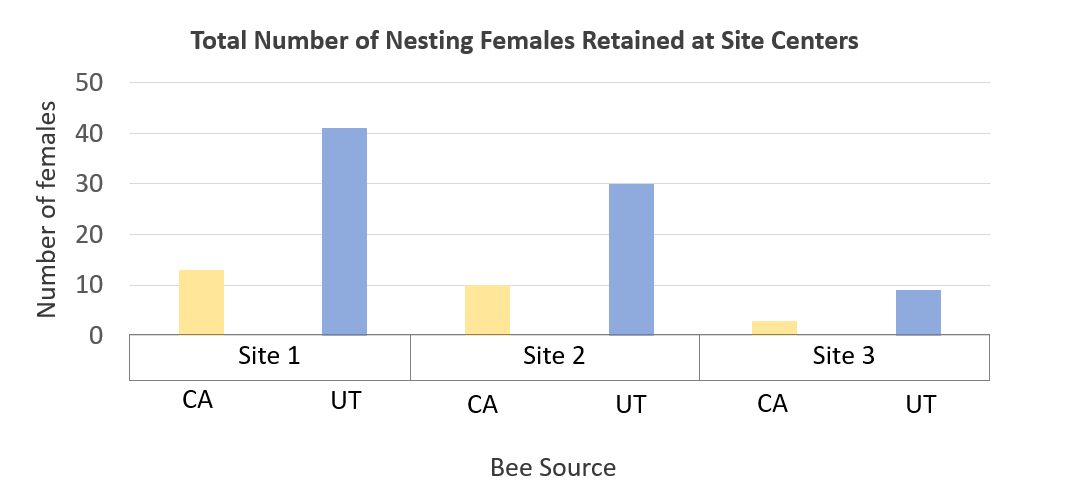
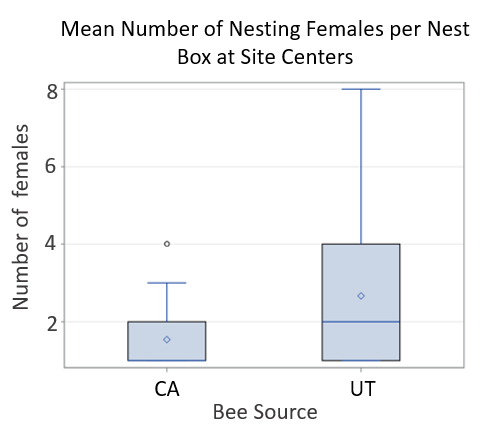
Figure Legend. Results from California cherry orchards found low retention of nesting BOB females.
In Utah tart cherry orchards, a mean of 13.2% of the females released were later detected nesting at site centers. Here, we found no significant difference in female retention based on population source (p=0.2098). Marked bees were again found far and very far away, but in higher numbers than in California; a total of 19 CA-sourced females and 41 UT-sourced females were detected nesting far or very far away across all three sites. A total of 236 unmarked females were found nesting in our nest boxes across all three sites; 119 unmarked bees were found at site centers and 117 were found far and very far away.
Figure Legend. Results from Utah cherry orchards found equal retention of nesting BOB females from California and Utah sources.
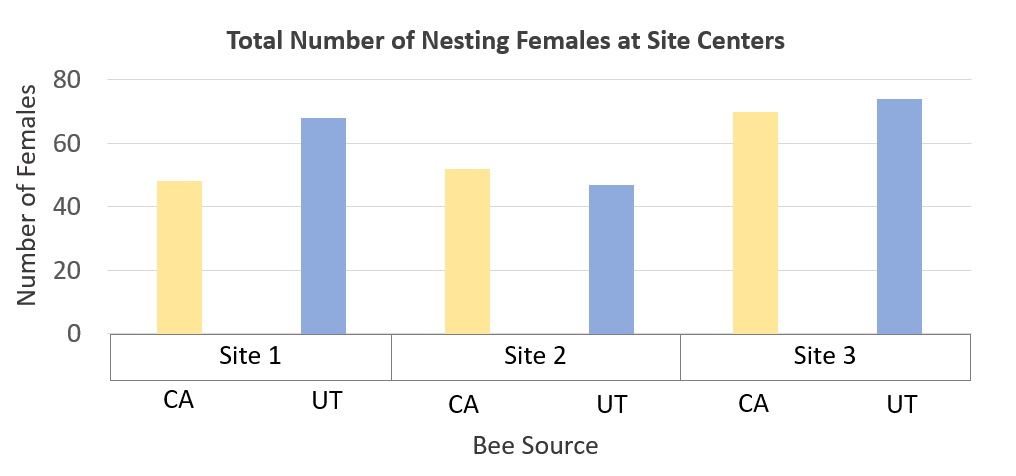
 The large numbers and even distribution of unmarked females throughout the sites suggests that these bees were from local populations, either wild or managed. From a mean of 13.2% percent female retention, we recovered a mean of 44.9% of the female population at site centers. When recovering progeny from entire sites (site center plus far and very far away), a mean of 79.3% of the female population was recovered. At site 3, 61.4% and 114.6% of the female population was recovered at site center and far and very far away, respectively. This highlights a potentially novel method for propagating managed populations in orchards in which we can use BOB’s apparent propensity to disperse to our advantage. BOB nesting substrates can be deployed throughout common orchard growing regions, even 1 km from where any given population is released, to maximize population return.
From Objective 1: BOBs sourced from Utah and Washington both had better survival when managed at constant temperatures during immature development compared to those bees that remained at ambient (natural) temperatures for their own regions. It was interesting but not easily explained that more WA-sourced bees died as larvae than did UT-sourced bees. For bees in both population sources, immature development was significantly shorter for bees under managed conditions rather than natural ones, which has further management implications for assuring proper timing for bee cold storage and duration of the overwintering period that helps to time bee emergence with crop bloom. We recommend that when BOBs are used for orchard pollination and are produced during crop bloom that managed protocols be implemented so that immature bees develop at controlled temperatures to optimize survival for use in the next season. We also have learned how vulnerable bees and provisions are to desiccation and also saprophytic fungi in temperature-controlled cabinets. Therefore, managing humidity and thorough cleaning (sterilizing) of equipment can be critical components of rearing bees under controlled conditions.
From Objective 2: It was surprising but important to find that Utah adult females are significantly larger than the California females. This supports personal observations from other studies, and this size difference may affect the ability of bees to adapt to novel environmental conditions (which we will explore in future studies). Utah females were twice as likely to nest and produced significantly more female offspring as those from the California source, regardless of the source of males with whom they mated. It is important to extend this study to determine whether California females that are produced in orchards are larger than their parents if kept in the orchard environment and if they become more attuned to the crop bloom timing and conditions for increasing their reproduction. We found that mixing bees sourced from different regions did not prevent mating because all nesting females produced female progeny (females are from fertilized eggs). However, because females from Utah that were mated with males from California appeared to produce fewer females overall, we recommend caution mixing these population sources. On-going evaluation of data from Year 2 crossing of hybrids should provide more guidance on this topic.
From Objective 3: In this search for genetic markers for BOBS, 16 novel microsatellite loci were identified that are immediately available for population genetic analysis. These loci exhibited high genetic diversity (allelic richness, Hexp) and have the capacity to estimate genetic structure (FST, FIS). These loci have the potential to inform management and conservation decisions. Continued research at PIRU will be pursued to determine the utility of the 15 novel imperfect microsatellites identified in this study. We recommend that this work continue to refine methods that divulge estimates of genetic diversity among BOBs populations that have the potential to inform management, conservation, and possibly regulatory decisions.
From Objective 4: Different pests were found in samples from Utah, Washington, and California populations. From studies of samples Utah, California, and from other studies across the U.S., multiple types of pathogens were found and highlight the importance of further exploration of pathogens and to determine if their presence alone effects BOB health or if their increase the susceptibility of BOBs to the effects of other environmental stressors. Further, sampling in Utah over two years revealed annual and site variation in mortality, without known pathology. Besides disease-causing microbes, there were other microbial organisms found that may play roles in bee health (harmful and helpful). Also, there needs to be clarity on whether BOB populations being trapped are truly natural or are being "farmed" by bee trappers. These types of surveys and databasing activities need to continue to expand across years and populations.
From Objective 5: Our experiments in regionally distinct orchard locations demonstrated that BOB population source has significant effect on female retention (demonstrated nesting post-release) under certain contexts and not others. In early-blooming California cherry orchards, we were surprised to find that CA-sourced bees were retained at a significantly lower rate than were UT-sourced bees, as we expected bees to perform best in their region of origin. However, female bees from both source populations performed better in Utah than California cherry orchards; more female bees were retained at site centers and were also found at dispersed nesting sites. Under these apparently more suitable conditions in later-blooming Utah cherry orchards, bee source population did not have a significant effect on female retention. The varying response in female retention due to population source in California and Utah orchards highlight the importance of the regional source of bees as well as the location and timing of their deployment. Reducing pre-nesting female dispersal, thereby enhancing female retention and population return, remains a major challenge for sustaining populations of BOBs in large commercial orchards. High return on bee populations reduces the cost of pollination services (by reducing the need to re-purchase bees each year) and helps to alleviate the current need to trap bees from wild populations. We directly measured female BOB retention in commercial orchards by identifying (i.e., marking) individuals and searching for them at nesting sites. Based on our results that female retention can be influenced by the regional source of bees and the timing and location of deployment in orchards, we recommend that local bees be obtained for pollination or that management (temperature regimens for wintering and incubation) be tailored to take in consideration the effect of source of bees on synchronizing bee with bloom and on in-orchard reproduction.
Research outcomes
Education and Outreach
Participation summary:
List of presentations:
Dunn, M., D. Alston, T. Pitts-Singer, and S. Peterson. Mixing regionally-distinct populations of blue orchard bees, Osmia lignaria, to understand development, emergence, and reproductive success. 2018 Joint meeting of Entomological Society of America, Entomological Society of Canada, and Entomological Society of British Columbia, 10 min student competition talk, Vancouver, BC, November 11-14. (Ms. Dunn was awarded the President’s Prize (1st place) for her presentation.) (~100 people in attendance)
Dunn, M., D. Alston, T. Pitts-Singer, and S. Peterson. Mixing regionally-distinct populations of blue orchard bees, Osmia lignaria, to understand development, emergence, and reproductive success. 2018 Orchard Bee Association, 15 min talk, University of California, Davis, CA December 7-9. (~40 people in attendance)
Dunn, M., D. Alston, T. Pitts-Singer. Managing blue orchard bees for pollination services in Utah: Best practices. 2019 Utah Association of County Agricultural Agents Summer Meeting, Murray, UT, Jun. 5. (~60 people in attendance)
Dunn, M. How to manage solitary bee hotels and bee-friendly gardening practices. Wild Birds Unlimited, Salt Lake City, UT, Sept. 2019. (~30 people in attendance)
Dunn, M., D. Alston, T. Pitts-Singer, and S. Peterson. Examination of blue orchard bee, Osmia lignaria (Hymenoptera: Megachilidae) origin on retention in commercial cherry orchards. 2019 International Pollinator Conference, poster, University of California, Davis, CA, Jul. 17-20. (~250 people in attendance)
Dunn, M., D. Alston, T. Pitts-Singer, and S. Peterson. Examination of blue orchard bee retention and dispersal in commercial cherry orchards. 2019 national conference of Entomological Society of America, 10-min student competition talk, St. Louis, MO, Nov. 17-20. (~100 people in attendance)
Dunn, M., D. Alston, T. Pitts-Singer, and S. Peterson. Blue orchard bee retention and dispersal in commercial cherry orchards. 2019 Orchard Bee Association, 15 min talk, University of California, Riverside, CA, Dec. 13-14. (~40 people in attendance)
Dunn, M. How to clean cocoons and store for winter. Invited talk for 2020 How to Use Orchard Mason Bees for Crop Pollination Virtual Workshop, Oct. 28. (~75 people in attendance)
Pitts-Singer, T.L. Why orchard bees? Invited talk for 2020 How to Use Orchard Mason Bees for Crop Pollination Virtual Workshop, Oct. 28. (~75 people in attendance)
Koch, J. 2020. How can genetics tools inform the management of the Blue Orchard Bee. 2020 Orchard Bee Association Meeting, Online Conference, December 11 (~25 people in attendance).
Branstetter, M. 2020. UCE phylogenetics and biogeography of the agriculturally important mason bee subgenus Osmia (Osmia). 2020 Orchard Bee Association Meeting, Online Conference, December 11 (~25 people in attendance).
Education and Outreach Outcomes
Future studies with BOBs are needed to better produce them within and outside of crops. Currently, BOB suppliers and managers are becoming more versed in their trade and leading the way towards greater adoption of this bee as a viable and affordable orchard pollinator when used in tandem with honey bees. The ability to completely sustain populations on-crop is not often achieved, and an annual outside source of BOBs is required to supplement the offspring from the previous year's crop. The major challenges are the short bloom time of orchard crops, the tendency of BOBs to disperse from release sites and not use provided nesting materials, and the need for careful management of BOBs using temperature control to safeguard immature bees from extreme conditions and manipulate emergence timing to match early bloom timing.
Furthermore, it is important to understand the genetic diversity of these bees as they are being sold across the US with little knowledge of any adverse consequences of mixing populations. As well, lessons learned from the alfalfa leafcutting bee and bumble bee industries are that pathogens and pests can quickly spread and wreak havoc on commercial bee stocks. Identifying the culprits and their harmful effects are imperative for developing the most practical and effective management protocols for the continued success of keeping these bees readily available as commercial pollinators.
- We did not have any formal surveys to gain feedback from farmers. However, we presented information about BOBs in general and findings of our research to participants of webinars and meetings (in-person and virtual). We hope for feedback from our YouTube videos and factsheet in the future once the public has a chance to view them. The knowledge and skills presented are for managing BOBs for sustaining them as crop pollinators.