Final report for SW18-500
Project Information
Cover crops have gained considerable attention in recent years as an important option for improving soil health and productivity on farms around the US. However, dryland agricultural systems in the western part of the country present a unique set of opportunities and challenges for cover crops. The Colorado Plateau, in particular, has a relatively short growing season along with low and erratic precipitation. Wheat-based cropping systems in the region rely on tillage and herbicide applications to keep soils bare for much of the year, and this has resulted in widespread soil degradation due to low organic matter inputs and erosion. Cover crops can help to counteract such losses in soil fertility and long-term productivity, but may also compete for water with cash crops and their net benefit remains largely unstudied in the Colorado Plateau.
Given the lack of research on cover crops in the high desert region, this project seeks to fill a critical information gap for local dryland producers. The proposed work will build on research conducted in the first phase of this project and assess the on-farm performance of different cover crop mixtures as well as the medium-term impact of cover crops on crop yields, overall farm profits, soil health, and a range of ecosystem services (e.g. soil water capture, erosion control, carbon sequestration, forage provision, weed control). Additionally, we will incorporate new research elements that emerged from Phase I (Western SARE Project SW15-008), including the testing of soil inoculants and alternative termination strategies of cover crops to minimize tillage. This project and the evolving directions of this research have grown directly out of local producer and stakeholder discussions, and represent a truly collaborative effort to understand the potential of cover crops to enhance long-term profitability and environmental quality of the region.
- Evaluate the growth and performance of different cover crop mixtures within different environmental and rotational contexts in multiple producers’ fields and at the Southwest Colorado Research Center (SWCRC) (Fonte, Russell, Schipanski, Berrada, Eash, Lockard, participating farmers). Mixtures will be comprised of functionally similar species combinations (considering legumes vs. grasses, fibrous vs. tap roots, warm vs. cool season, etc.) across fields/farms and rely largely on locally available seed.
- Assess medium-term (4-6 yr) impacts of cover crops on soil health and soil-based ecosystem services. Ecosystem services of interest include water capture and storage, crop production, erosion control, and potential forage provision. Additional soil health parameters include the maintenance of soil structure, soil C dynamics, and soil microbial diversity and activity (Fonte, Trivedi, Schipanski, Parslow, Eash, Lockard).
- Conduct economic analysis of cover crops to understand the net balance of establishment costs, differences in weed management and labor expenditures, and subsequent impacts on crop yields (Beiermann, participating farmers).
- Examine alternative management techniques to address emerging grower concerns (Russell, Trivedi, Fonte, Eash, Lockard). Specifically, these will include testing effectiveness of different legume inoculation techniques within cover crop mixtures as well as alternative termination methods (e.g. crimping - for application in organic systems) to foster the development of reduced tillage practices.
- Engagement with producers, community members, and other stakeholders to share project results and discuss the benefits and challenges associated with cover crops (Russell, Fonte, Eash, Lockard, and all participants). This will be achieved via:
- Annual workshops and field days with local stakeholders in Montezuma and Dolores Counties, CO, and San Juan County, UT.
- CSU/AES technical bulletins, factsheets, and peer-reviewed journal articles.
- Presentations of project results at regional conferences, workshops, and extension events in other parts of Colorado, Utah and the broader Western SARE region.
- Project videos (interviews, presentations, etc.).
- Regular updates and posting of materials (e.g. videos, presentations, technical bulletins) on project website (http://drylandcovercrops.agsci.colostate.edu/).
- Outreach to local schools to engage next generation farmers and agricultural researchers.
- Evaluate the project’s impact and reach (Westerman, Boswell). This will be achieved by documenting how well the outreach events are attended and obtaining feedback from each event.
Cooperators
- - Producer
- - Producer
- - Producer
- - Producer
Research
Replacing fallow periods between cash crops with a cover crop mixture will result in one or more of the following benefits: (1) reduction in soil erosion potential, (2) improved soil fertility, (3) soil C accrual, but will potentially present trade-offs in wheat productivity. No-till management and/or reduced cover crop growth period may alleviate these trade-offs.
Cover crop evaluation at the Southwestern Colorado Research Station
This project is a continuation of Western SARE Project SW15-008, in which two field trials were established on the Southwestern Colorado Research Station (SWCRC) to evaluate various cover crop mixtures. These trials were continued with the aim of assessing the effect of different mixtures (varying in legume vs grass proportion, cool vs warm season species, etc.) on biomass accumulation, soil health and ecosystem services. Cover crop mixtures were chosen in collaboration with participating farmers, NRCS staff, and research center staff. Mixtures include varying proportions of legumes, grasses, brassicas, and other broadleaves.
The first field trial was established in Fall of 2015 (Experiment 1) and compared three fall-planted cover crop mixtures alternating with winter wheat vs. a fallow-winter wheat control in a randomized complete block (RCB) design with three replicate plots. All were managed under no-till. The third cycle of wheat was harvested in July 2021.
In Fall of 2016 a second replicated trial (Experiment 2) was established with eight cover crop treatments including both spring- and fall- planted mixtures (planting windows) and compared against a winter wheat-fallow control. The experiment also examined these cover crop treatments within two-tillage regimes (no-till vs. conventional tillage) and follows a RCB design. The third cycle of winter wheat was planted in September 2021.
In Fall of 2018 a third trial was established at the SWCRC to evaluate the potential of perennial grasses and legumes for soil health restoration. Eight treatments were established, including a wheat fallow control and a wheat-annual cover crop treatment. Perennial treatments varied from dryland alfalfa (a practice already used by organic wheat farmers in the region) to mixtures of ryegrass, wheatgrass, alfalfa and sanfoin. The trial follows a randomized complete block design with four replicates per treatment. Treatments will be maintained for the remainder of the project to observe productivity, soil cover, and changes in soil quality over a three-year period. Due to extremely dry conditions in Fall 2018, germination was low and stand establishment was poor. The trial was replanted in Spring 2020 and will be evaluated again in Spring 2021 for stand establishment.
In the Fall of 2019 an inoculant trial was planted at the SWCRC to evaluate different types of rhizobium inoculants (liquid, peat, and granular) compared to a no inoculant control. Additionally, this trial had a termination treatment component blocked by tillage, chemical and crimping termination methods. The trial used the main cover crop mixture tested in the on-farm trials (see below) and was terminated in the Spring of 2020.
On-farm trials to evaluate cover crop mixtures
In order to assess performance of cover crop mixtures, medium-term impacts of cover crops on soil health, and evaluate profitability of cover crop implementation, field trials of annual cover crop mixtures, which were established in Project SW15-008 as early as 2015, continued in dryland production fields of participating farmers in Colorado and Utah. Farmer fields are divided into cover crop treatments and control treatments. The control treatment is managed according to usual farmer practices, usually a cash crop followed by a fallow period. Plots under cover crop management will be planted to a cover crop when the farmer would typically leave his or her land fallow. Four local producers are continuing their participation in the project (planted to either cover crop or winter wheat in Fall 2020), and one new field in Colorado was planted to cover crop in Fall 2018 and continued for a second cover crop cycle in Fall 2020.
The cover crop mixture evaluated on-farm is consistent across all participating farms and includes winter pea, hairy vetch, winter triticale, oats, nitro radish, and rapeseed. This mixture was selected based on farmer feedback and production data collected in Project SW15-008, taking into consideration both biomass production as well as cost minimization. It includes a significant proportion of both legumes and grasses, to gain the benefits of both nitrogen fixation as well as biomass accumulation.
Field Measurements/Data Collection
The following measurements were taken to assess cover crop benefits:
- Cover crop biomass. Collected using four sub-samples per replicate in each field using a 75-cm dia. range hoop), with all vegetation cut to a height of 1-2 cm and returned to the lab for sorting, oven-drying, and weighing.
- Soil cover. Measured using quadrats and a transect and line-point intercept method.
- Forage quality. Evaluated using near infrared reflectance spectroscopy (NIRS) to determine nitrogen content and decomposition dynamics of the residues.
- Soil moisture. Evaluated using soil cores, taken to a depth of ~1.0 m with a Giddings probe at cash crop planting.
- Erosion control. Wind and water erosion were modelled using RUSLE2 and WEPS, both available through the NRCS.
- Bulk density and aggregate stability. Measured in top layer (0-5 cm) of soil to evaluate soil compaction and structure.
- Soil fertility. Assessed at CSU for total organic C and N, available P, pH, and electrical conductivity. We also measured permanganate oxidizable C (POXC), an active fraction of soil organic matter that may provide an indicator of organic C accumulation in soils. Potentially mineralizable N was assessed via short-term laboratory incubations, to understand potential microbial activity, and release and availability of N for the subsequent crop.
- Crop yields. Production data for cash crops will be collected to understand economic impacts of cover crop implementation. This was done at both on-farm and on-station trials.
- Cost analysis. Through farmer surveys and interviews, field operations and associated costs were estimated to understand the cost of cover crop implementation.
Field Trials
Results from Trial 1 (T1), established in 2015, and Trial 2 (T2), established in 2016 are presented here along with results from on-farm trials. Our analyses focused the effects of cover crop planting window instead of cover crop mixtures because, despite planting different mixtures, stand expression was very similar among cover crop treatments of the same planting window. This is due to extremely dry conditions that caused only a few species to dominate (namely grasses and winter pea).
Wheat Productivity
Cover crops caused significant wheat yield penalties, as wheat yields following fall-planted cover crops were 48% lower than those in fallow control plots (0.77 Mg ha-1 in fall-planted cover crop plots and 1.6 Mg ha-1 in fallow plots; Tables 1 & 2). The yield penalty was highly variable among years, ranging from 80% decrease to a 12% increase as compared to wheat in fallow plots. Spring-planted cover crops presented less productivity trade-off, as the average wheat yield penalty was just 24%.
The wheat yield penalties were related to both cover crop biomass production in the previous year as well as the precipitation received during the wheat growing season (Fig. 1). When cover crop biomass accumulation was significant and precipitation was low, such as in Cycle 1 of Trial 2, the yield penalty was very pronounced (78% decrease). Conversely, when cover crop biomass production was low and precipitation received during the wheat growing season was average, such as in Cycle 2 of T1, there was no wheat yield penalty observed and, in fact, cover crop plots yielded 12% more than wheat grown following the bare fallow period (p=0.009). In Trial 2, wheat yields in no-till plots tended to be higher on average than in tilled plots, although the magnitude of the cover crop yield penalty was similar and this effect was only marginally significant in Cycle 1 of T2 (p=0.059; Tables 1 & 2). Wheat yields throughout the study period were tightly correlated with soil moisture at wheat planting and cover crop biomass; for each 1000 kg ha-1 of cover crop biomass produced resulted in a 10 mm decrease in soil moisture at wheat planting, and wheat yields in turn decreased by 130 kg ha-1 per 10 mm reduction in soil moisture at planting (Fig. 2).
Yield stability was also lower following cover crops in both T1 and T2 (p=0.002 and p<0.001, respectively; Tables 3 & 4). In Trial 2, where both tillage and cover crop were tested, there was a significant interaction effect (p<0.001) between tillage and cover crop window, such that yield stability was significantly decreased by cover crops in tilled plots but was similar to the fallow control in no-till plots (Tables 3 & 4).
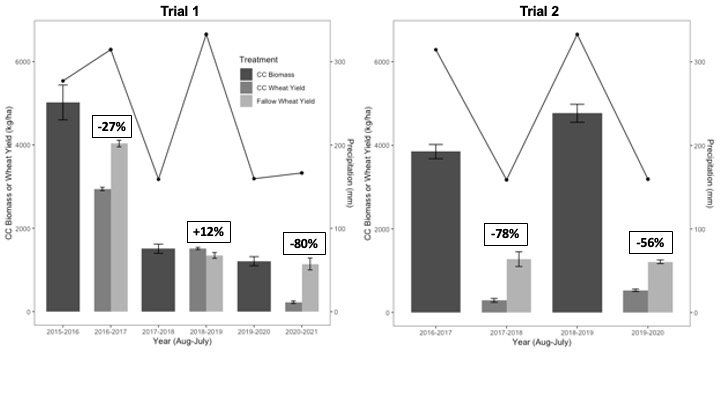
Figure 1. Winter wheat yields and yield penalties shown alongside cover crop (CC) biomass production and yearly precipitation (August through July; designated by line and secondary y-axis) in on-station field trials. Darkest bars indicate CC biomass in alternate years, medium-gray bars indicate wheat yields following CC, and light gray bars indicate wheat yields following a fallow period. Yield penalties are in text boxes displayed above wheat yields and were calculated as the percent reduction or increase of wheat yields following a CC as compared to fallow control plots.
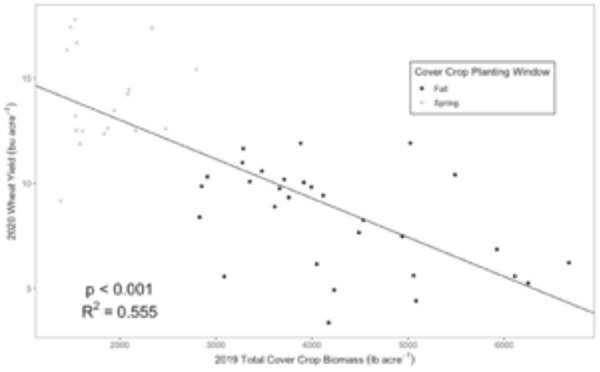
Figure 2. Correlation between 2019 cover crop biomass and 2020 wheat yields in Trial 2 (R2=0.555). Data points color coded by cover crop planting window.
Table 1. Mean values of results from three cover cropping (CC) cycles of Trial 1. Values with different lowercase letters (by column) indicate differences to an alpha level of 0.05, as determined by Tukey-adjusted multiple comparisons.
| Cycle 1 | Cycle 2 | Cycle 3 | |||||||||||
| Tillage | Treatment | Cover Crop Biomass | Soil Nitrate | Soil Water Storage | Wheat Yield | Cover Crop Biomass | Soil Nitrate | Soil Water Storage | Wheat Yield | Cover Crop Biomass | Soil Nitrate | Soil Water Storage | Wheat Yield |
| kg ha-1 | mg kg-1 | mm | Mg ha-1 | kg ha-1 | mg kg-1 | mm | Mg ha-1 | kg ha-1 | mg kg-1 | mm | Mg ha-1 | ||
| NT | Fall CC | 5020 | 9.93 a | 157 a | 2.95 a | 1510 | 12.4 a | 123 a | 1.52 a | 1210 | 3.75 a | 134 a | 0.22 a |
| Fallow | NE 1 | 17.1 b | 224 b | 4.03 b | NE | 19.4 b | 131 a | 1.35 b | NE | 6.04 b | 176 b | 1.14 b | |
| ANOVA 2 | |||||||||||||
| NA | <0.001 | <0.001 | <0.001 | NA | 0.001 | 0.24 | 0.009 | NA | 0.038 | <0.001 | <0.001 | ||
| 1 NE, not evaluated. 2 Differences estimated using a multifactor ANOVA with treatment included as a fixed effect and block was included as a random effect. p-values presented. 3 Differences estimated using a multifactor ANOVA with treatment, tillage and interaction included as fixed effects and block and tillage subplots included as random effects. | |||||||||||||
Table 2. Mean values of results from three cover cropping (CC) cycles of Trial 2. Values with different lowercase letters (by column) indicate differences to an alpha level of 0.05, as determined by Tukey-adjusted multiple comparisons.
| Cycle 1 | Cycle 2 | Cycle 3 3 | ||||||||||
| Tillage | Treatment | Cover Crop Biomass | Soil Nitrate | Soil Water Storage | Wheat Yield | Cover Crop Biomass | Soil Nitrate | Soil Water Storage | Wheat Yield | Cover Crop Biomass | Soil Nitrate | Soil Water Storage |
| kg ha-1 | mg kg-1 | mm | Mg ha-1 | kg ha-1 | mg kg-1 | mm | Mg ha-1 | kg ha-1 | mg kg-1 | mm | ||
| NT | Fall CC | 3880 a | 4.36 ab | 148 a c | 0.44 a b | 4700 a | 1.09 a | 111 a | 0.54 a c | 1500 a | 3.07 a | 120 a |
| Spring CC | 637 b | 5.43 b | 179 b d | 1.19 c d | 2100 b | 1.58 a | 128 a b | 0.85 b d e | 950 b | 5.77 a | 115 a | |
| Fallow | NE | 9.61 c | 209 d | 1.60 d | NE | 3.43 b | 156 c | 1.26 f g | NE | 9.36 a | 169 b | |
| CT | Fall CC | 3820 a | 3.14 a | 143 a b | 0.14 a | 4840 a | 0.77 a | 118 a | 0.52 a b | 1340 a | 6.52 a | 121 a |
| Spring CC | 845 b | 5.34 b | 185 c d | 0.81 b c | 2050 b | 1.58 a | 132 a b c | 0.93 c d f | 104 c | 7.70 a | 136 a b | |
| Fallow | NE | 9.15 c | 211 d | 0.95 b c d | NE | 1.25 a | 153 b c | 1.17 e g | NE | 5.91 a | 142 a b | |
| ANOVA 2 | ||||||||||||
| Source of variation | ||||||||||||
| Cover Crop | <0.001 | <0.001 | <0.001 | <0.001 | <0.001 | <0.001 | <0.001 | <0.001 | <0.001 | 0.13 | 0.002 | |
| Tillage | 0.79 | 0.11 | 0.89 | 0.059 | 0.88 | 0.073 | 0.7 | 0.94 | 0.02 | 0.65 | 0.82 | |
| Cover Crop x Tillage | 0.57 | 0.1 | 0.72 | 0.19 | 0.72 | 0.0038 | 0.58 | 0.13 | <0.001 | 0.09 | 0.063 | |
| 1 NE, not evaluated. 2 Differences estimated using a multifactor ANOVA with treatment, tillage and interaction included as fixed effects and block and tillage subplots included as random effects. 3 Wheat yield not collected in cycle 3 of T2, as project ended in Spring 2022. | ||||||||||||
Potential Forage Production
Forage (cover crop biomass) production was highly variable among years, ranging from a yearly average of 1210 to 5020 kg ha-1 in fall-planted plots and from 740 to 2080 kg ha-1 in spring-planted plots. Tillage regime only had a significant impact on cover crop biomass in Cycle 3 of T2, when spring-planted cover crops in no-till plots produced significantly more biomass than in tilled plots (p<0.001 for planting window x tillage interactive effect; Tables 1 & 2).
Soil Water Storage
Soil water storage at wheat planting was generally lower in fall-planted cover crop plots as compared to fallow control plots (Tables 1 & 2). The exception to this was in Cycle 2 of T1, when little cover crop biomass was produced and soil water caught up to fallow levels between cover crop termination and wheat planting. Following spring-planted cover crop plots, this difference was much less pronounced. Tillage did not have a significant effect on soil moisture at wheat planting in any year.
Soil Nitrate
A similar trend was observed for soil nitrate at wheat planting, though the difference between cover cropped and fallow control plots decreased and became less significant throughout the course of the study. In T1, the difference between cover cropped and fallow plots decreased from 7.17 mg kg-1 (p < 0.001) in Cycle 1 to 2.29 mg kg-1 (p=0.04) in Cycle 3. In T2, there was no significant difference in soil nitrate at wheat planting by Cycle 3 (p=0.13; Tables 1 & 2).
Soil Health and Erosion Control
While there were no differences in soil carbon stocks among all treatments, fall-planted cover crops suggested an improvement in erosion control that was particularly pronounced in tilled plots. Overall, modelled annual soil loss was lower in fall-planted cover crop plots as compared to fallow control plots. Estimated soil loss in tilled, fallow treatments was substantially higher than in no-till fallow plots (7289 and 568 kg ha-1 soil loss yr-1, respectively; Tables 3 & 4). Tilled, fall-planted cover crop plots had the same amount of modelled annual soil loss as no-till, fallow plots. In both tillage regimes, spring-planted cover crop treatments is estimated to be moderately effective in controlling erosion, but not to the extent of fall-planted cover crops.
After three cover crop cycles, there was a significant effect on soil structure, as fall-planted cover crop plots had greater aggregate stability as compared to fallow control plots in both T1 and T2 (p=0.05 and p<0.001, respectively; Table 3,4). No effects of cover crops or tillage were observed on belowground prokaryotic biodiversity as measured by both the Shannon Diversity Index and richness (Tables 3 & 4).
Table 3. Cumulative values from T1rial 1 following three cover cropping (CC) cycles. Values with different lowercase letters (by column) indicate differences to an alpha level of 0.05, as determined by Tukey-adjusted multiple comparisons.
| Tillage | Treatment | Average Wheat Yield | Yield Stability | Forage (Biomass) Production | Aggregation (MWD) | Alpha Diversity | Richness | Soil Water Availability | Soil Nitrate | Estimated Soil loss | SOC |
| Mg ha-1 | kg ha-1 | um | Shannon Index | OTU Count | mm | mg kg-1 | kg ha-1 yr-1 | % | |||
| NT | Fall CC | 1.56 | 0.13 | 2580 | 233 | 7.4 | 6265 | 135 | 6.56 | 220 | 0.8 |
| Fallow | 2.18 | 0.26 | 0 | 185 | 7.33 | 5907 | 170 | 10.16 | 568 | 0.8 | |
| ANOVA 2 | |||||||||||
| <0.001 | 0.002 | <0.001 | 0.05 | 0.30 | 0.24 | <0.001 | <0.001 | NA 3 | 0.5 | ||
| 1 NE, not evaluated. 2 Differences estimated using a multifactor ANOVA with treatment included as a fixed effect and block was included as a random effect. p-values presented. 3 Statistical analysis not performed on modelled soil loss estimates. | |||||||||||
Table 4. Cumulative values from Trial 2 following three cover cropping (CC) cycles. Values with different lowercase letters (by column) indicate differences to an alpha level of 0.05, as determined by Tukey-adjusted multiple comparisons.
| Tillage | Treatment | Average Wheat Yield | Yield Stability | Forage (Biomass) Production | Aggregation (MWD) | Alpha Diversity | Richness | Soil Water Availability | Soil Nitrate | Estimated Soil loss | SOC |
| Mg ha-1 | kg ha-1 | um | Shannon Index | OTU Count | mm | mg kg-1 | kg ha-1 yr-1 | % | |||
| NT | Fall CC | 0.49 a b | 0.69 a | 3360 a | 276 a | 7.49 a | 5849 a | 115 a | 2.05 a b | 188 | 0.67 |
| Spring CC | 1.02 c | 0.77 a | 1230 b | 236 a b | 7.46 a | 5498 a | 121 a | 3.99 b | 346 | 0.69 | |
| Fallow | 1.43 d | 0.84 a | 0 c | 203 b | 7.56 a | 6638 a | 162 c | 4.56 b | 568 | 0.70 | |
| CT | Fall CC | 0.33 a | 0.12 b | 3330 a | 287 a | 7.50 a | 6071 a | 120 a | 1.52 a | 568 | 0.68 |
| Spring CC | 0.87 b c | 0.82 a | 999 b | 233 a b | 7.59 a | 6033 a | 134 a b | 3.92 b | 2619 | 0.71 | |
| Fallow | 1.06 c d | 0.83 a | 0 c | 240 a b | 7.52 a | 6350 a | 147 b c | 3.65 a b | 7289 | 0.62 | |
| ANOVA 2 | |||||||||||
| Source of variation | |||||||||||
| Cover Crop | <0.001 | <0.001 | <0.001 | <0.001 | 0.78 | 0.52 | <0.001 | <0.001 | NA 3 | 0.56 | |
| Tillage | 0.15 | 0.081 | 0.68 | 0.32 | 0.69 | 0.76 | 0.78 | 0.38 | NA | 0.67 | |
| Cover Crop x Tillage | 0.18 | <0.001 | 0.64 | 0.54 | 0.43 | 0.81 | 0.027 | 0.82 | NA | 0.38 | |
| 1 NE, not evaluated. 2 Differences estimated using a multifactor ANOVA with treatment, tillage and interaction included as a fixed effects and block and tillage subplots included as a random effects. p-values presented. 3 Statistical analysis not performed on modelled soil loss estimates. | |||||||||||
Economic Analysis
Net returns in fallow plots were extremely variable among cropping cycles, ranging from -56.75 USD ha-1 in tilled, fallow plots in Cycle 1 of T2 to 209.99 USD ha-1 in no-till fallow plots in Cycle 1 of T1 (Table 5). Net returns of cover crops were consistently negative but also quite variable, ranging from -222.96 USD ha-1 in tilled, fall-planted cover crop plots in Cycle 1 of T2 to -10.16 USD ha-1 in no-till fall-planted plots in Cycle 1 of T1 (Table 5). Additional costs due to cover cropping were similar regardless of tillage regime and averaged 74.76 USD ha-1 cycle-1. Average reduction in wheat revenue following fall-planted cover crops was 114.47 USD ha-1 cycle-1 in no-till plots and 83.64 USD ha-1 cycle-1 in tilled plots. These additional costs and reduced revenue caused substantially lower net returns in cover cropped plots (Table 6). Though the reduction in wheat revenue was less pronounced following spring-planted cover crops, additional costs associated with weed control and planting caused the breakeven prices to be only slightly lower; spring-planted cover crops had an average breakeven price of 140.91 USD ha-1 and 96.54 USD ha-1 in no-till and tilled plots, respectively (Table 6).
Based on conversations with producers in the region and evidence from other semiarid regions in the US, the hypothetical sale of forage (considered to be 50% of cover crop biomass) was considered as a potential revenue stream. Forage, or partial cover crop, harvest more than offset cover cropping costs and revenue losses in T2 (Table 6). Additional revenue from the sale of forage averaged 420 USD ha-1 cycle-1 in fall-planted cover crop plots, while extra costs from mowing, raking, and baling hay averaged only $87 ha-1 cycle-1. Therefore, net gains due to cover crops in fall-planted plots in T2 were positive in each cycle (indicating additional profit as compared to the fallow control) and averaged 161.29 USD ha-1 and 175.90 USD ha-1 in no-till and tilled plots, respectively (Table 5). The exception to this finding, however, was Cycle 3 of T1, which produced very little cover crop biomass. Coupled with a large wheat yield penalty and higher wheat market prices that cycle, the breakeven price for cover crops in that cycle was still high at 292.12 USD ha-1.
As spring-planted cover crops produced less biomass, forage sales had less potential to offset costs and revenue loss in these plots. Though net returns increased in these plots when forage revenue was considered, it was not enough to offset costs of cover cropping.
Table 5. Costs, revenue, and net income (NPV) associated with fall- and spring-planted cover crop (CC) treatments, managed under either no-till (NT) or conventional tillage (CT). Data are from Trial 1 and 2.
| NPV No Forage (USD ha-1 cycle-1) | NPV with Forage (USD ha-1 cycle-1) | |||||||||||||
| Trial | Tillage | Cover Crop Treatment | Cycle 1 | Cycle 2 | Cycle 3 | Average | Cycle 1 | Cycle 2 | Cycle 3 | Average | Average Costs (USD ha-1 cycle-1) | Average Revenue (USD ha-1 cycle-1) | Average Forage Costs (USD ha-1 cycle-1) | Average Forage Revenue (USD ha-1 cycle-1) |
| T1 | NT | Fall CC | -$10.16 | -$66.76 | -$174.42 | -$83.78 | $377.03 | $6.61 | -$111.91 | $90.58 | $272.23 | $188.45 | $80.69 | $255.05 |
| Fallow | $209.99 | -$8.59 | $175.28 | $125.56 | $209.99 | -$8.59 | $175.28 | $125.56 | $187.29 | $312.85 | NA | NA | ||
| T2 | NT | Fall CC | -$198.09 | -$157.44 | NA | -$177.84 | $78.39 | $226.52 | NA | $152.52 | $236.29 | $58.45 | $87.28 | $417.64 |
| Spring CC | -$143.05 | -$156.19 | NA | -$149.68 | -$181.97 | -$25.69 | NA | -$103.86 | $269.53 | $119.85 | $87.28 | $133.10 | ||
| Fallow | -$18.85 | $1.31 | NA | -$8.77 | -$18.85 | $1.31 | NA | -$8.77 | $171.75 | $162.98 | NA | NA | ||
| CT | Fall CC | -$222.96 | -$128.25 | NA | -$175.67 | $48.07 | $269.11 | NA | $158.66 | $218.07 | $42.40 | $87.28 | $421.61 | |
| Spring CC | -$134.16 | -$93.34 | NA | -$113.79 | -$152.84 | $32.38 | NA | -$60.25 | $217.77 | $103.98 | $87.28 | $140.82 | ||
| Fallow | -$56.75 | $22.27 | NA | -$17.25 | -$56.75 | $22.27 | NA | -$17.25 | $143.29 | $126.04 | NA | NA | ||
Table 6. Difference in net returns (NPV) between cover crop (CC) and fallow treatments, managed under either no-till (NT) or conventional tillage (CT). Negative values imply losses due to cover cropping. Data are from Trial 1 and 2.
| NPV of CC - NPV of Fallow (USD ha-1) | |||||||
| Forage Revenue | Trial | Tillage | Cover Crop Treatment | Cycle 1 | Cycle 2 | Cycle 3 | Average |
| Excluded | T1 | NT | Fall CC | -$220.24 | -$58.19 | -$349.49 | -$209.31 |
| T2 | NT | Fall CC | -$179.31 | -$158.82 | NA | -$169.06 | |
| Spring CC | -$124.25 | -$157.57 | NA | -$140.91 | |||
| CT | Fall CC | -$166.28 | -$150.58 | NA | -$158.43 | ||
| Spring CC | -$77.44 | -$115.65 | NA | -$96.54 | |||
| Included | T1 | NT | Fall CC | $167.11 | $15.21 | -$292.12 | -$36.60 |
| T2 | NT | Fall CC | $97.28 | $225.30 | NA | $161.29 | |
| Spring CC | -$163.18 | -$27.01 | NA | -$95.10 | |||
| CT | Fall CC | $104.86 | $246.94 | NA | $175.90 | ||
| Spring CC | -$96.13 | $10.11 | NA | -$43.01 | |||
Three of the nine outcome variables evaluated, namely erosion control, forage production and soil structure, increased in fall-planted cover crop plots, while four were greater in fallow plots. N supply and soil water availability were lowest in fall-planted cover crop plots and highest in fallow plots. These two factors likely led to lower wheat yield and profitability (without considering forage revenue) of fall-planted cover crops across both tillage regimes. Yield stability in cover cropped tilled plots was significantly lower than in fallow tilled plots. C storage and belowground biodiversity were unaffected by tillage and cover crop treatment during the study period.
On-farm Trials
Similar trends have been observed on plots located in participating farms. Biomass produced in cover crop plots on-farms has been highly variable, depending on precipitation, planting window and cover crop mix. 2017 wheat yields following a cover crop were on average 21% less than following a fallow period. However, this trend was not as pronounced in 2019 due to poor cover crop stand establishment in 2018 (Fig. 3).

Figure 3. Wheat yields following cover crop (CC) or fallow (F), collected from six fields of participating farmers. Yields presented in bushels per acre (multiply by 0.067 to convert yields to Mg ha-1).
Inoculation and Termination Trial
A cover crop mixture of winter pea, hairy vetch, winter barley, forage radish, and rapeseed was inoculated with either a peat-based, granular, or liquid rhizobia inoculant before planting in Fall 2019. A control with no inoculant was also included. Root nodulation (on leguminous species) and plant biomass was measured in June 2020. There were no root nodules observed, possibly due to dry conditions in the weeks before sampling. While there were no significant differences in total biomass among inoculation treatments (p=0.09), significant differences were detected (p = 0.02) using orthogonal contrast analyses to compare the group of inoculation treatments (peat-based, granular, and liquid) vs. the control treatment. On average the inoculated treatments produced more biomass than the control (non-inoculated) treatment (Fig. 4).
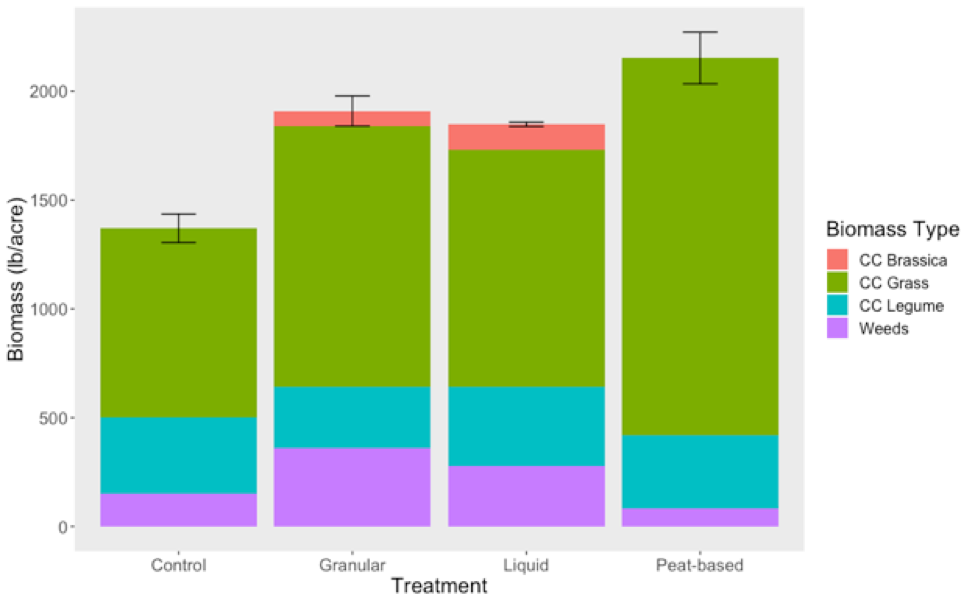
Figure 4. Biomass sampled in June 2020 in the inoculation trial, grouped by plant type [cover crop (CC) legume, CC grass, CC brassica, or weeds]. Cover crop was planted in Fall 2019 and treated with either a liquid, granular, or peat-based inoculant. The control was not treated with inoculant.
We used a split-plot design (diving the innoculant plots in half) to also examine the success rate of different cover crop termination methods. Specifically, we used roller crimping, herbicide (40 oz/acre of glyphosate), and tillage (using a field cultivator). Two weeks after termination, percent cover of bare soil, brown vegetation, and green vegetation was noted within a 0.25 m2 quadrant, taking in 3 locations per plot (Fig. 5). A visual termination rating scale of 0 to 10 was assigned to each quadrant, with 0 being no kill and maximum greenness and 10 being complete kill (Fig. 6). This method follows procedures outlined in Ashford & Reeves (2003).
The roller crimper was the least effective termination method, with an average termination rating of 4.29 ± 0.32. This may be due to a dry soil surface that did not mold to the form of the roller crimper and effectively break cover crop stems. The most effective termination method was tillage, with an average termination rating scale 9.96 ± 0.04. Herbicides were moderately effective in comparison, which again may have been due to dry conditions that limited plant uptake.
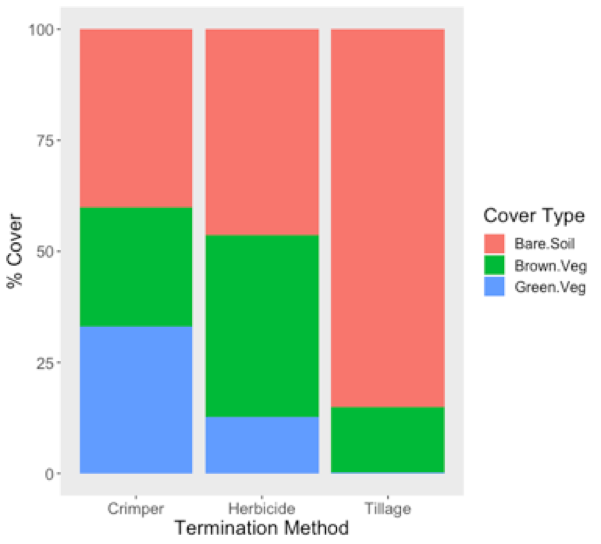
Figure 5. Percent cover of bare soil, brown vegetation, and green vegetation in plots examining different cover crop termination methods. Measurements were taken 2 weeks after termination.
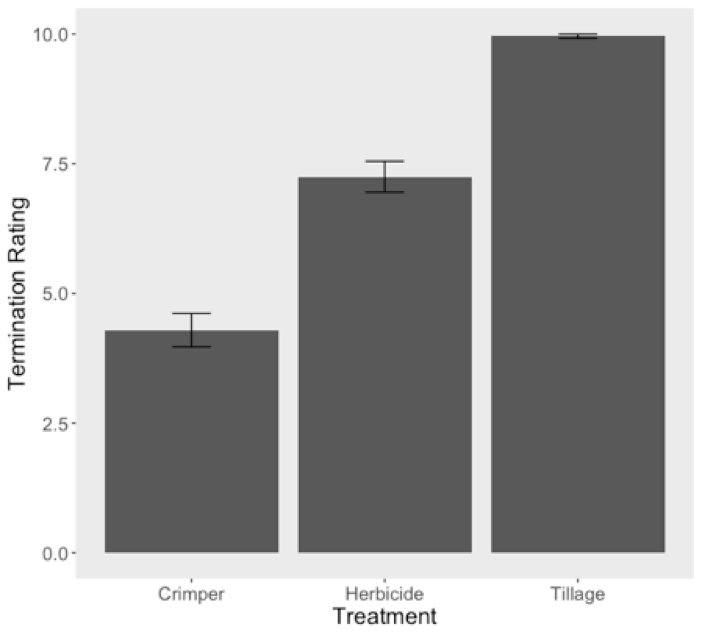
Figure 6. Visual termination rating scale of 0 to 10 assigned in plots examining different cover crop termination methods. A rating of 0 indicates no kill and maximum greenness and 10 indicates complete kill. Measurements were taken 2 weeks after termination.
Perennial Trial
After three growing seasons, none of the perennial grass and legume treatments successfully established, despite replanting. This indicates that perennial cover cropping for soil restoration is challenging in this region given water limitations. In order to produce enough biomass to have an impact on soil health, perennials would likely have to be planted in a year with above-average precipitation, but this opportunity was not presented during this phase of the project.
Fall-planted cover crops provided improved soil structure and erosion control benefits, and could therefore address sustainability issues for dryland farmers on the Colorado Plateau. However, these benefits are associated with significant productivity and economic trade-offs. The replacement of the fallow period decreases available moisture at wheat planting and results in lowered and variable wheat yields. Spring-planted cover crops may help balance this trade-off, though costs are high and they do not offer the same benefits as fall-planted cover crops, as trends were not significant after a six-year study period. The impact of no-till was relatively subtle and inconsistent throughout the course of the study. Yield stability was relatively better in no-till, fall-planted cover crop plots but not in tilled plots, and no-till plots yielded slightly higher in wheat and in cover crop biomass in some years. Precipitation storage benefits from no-till were not apparent, likely because plant-available water was depleted at the time of cover crop termination, particularly in years with below-average precipitation.
Wheat yield penalties and direct costs of cover cropping translate to significant reductions in net profit, but the sale of fall-planted cover crop biomass as forage appears to be a promising option that can more than compensate for these losses. Longer-term research should be conducted to further assess the viability of this option, as more pronounced soil health benefits may accrue over time, and economic impacts may change with fluctuations in hay and wheat prices. Reducing bare fallow periods in this region is imperative for sustained agricultural production, and our findings suggest that forage production may offer an economically and environmentally sustainable alternative.
Research outcomes
Education and Outreach
Participation summary:
- Annual field tours – A cover crop specific field tour was held on June 3, 2019 with approximately 40 participants. An additional research center Field Day was held on August 14, 2019 with cover crop resources presented to 50 area participants including farmers, ranchers, Extension personnel, and community members. A 2020 field tour was originally planned but was not held due to COVID-19. A wrap-up field tour will be held in June 2022 to present final results and gain feedback from participating producers and community members.
- Local Presentations - Local presentations were limited in 2020 and 2021 due to COVID-19.
- Soil moisture and fertility sampling demonstration at Fozzie’s Farm, June 2020, Lewis, CO. ~15 attendees.
- Winter Workshop, covering cover crops, soil health, and project results, February 2020, Dove Creek, CO. ~30 attendees.
- Soil Sampling Demonstration, Veteran’s Homestead Project, April 2019, Hesperus, CO.
- Provided demonstration cover crop plantings for NRCS “demo box” for area elementary educational programming.
- Plant ID workshop, Montezuma Land Conservancy Fozzie’s Farm, June 15, 2019, Lewis CO. Community Event, ~15 participants
- Research Update, Southwestern Colorado Research Center 2019 Advisory Committee Meeting, Yellow Jacket, CO.
- Aggregate stability demonstration, Chuck McAfee-local rancher, June 2019.
- Soil Infiltrometer Demonstration, Veteran's Homestead Project, April 2018, Hesperus, CO.
- Soil Infiltrometer Demonstration and Soil Health Presentation, Montezuma Land Conservancy Fozzie's Farm, September 2018, Lewis CO. Dolores Elementary School 6th grade class, ~40 students.
- Research Update, Southwestern Colorado Research Center Advisory Committee Meeting, November 2018, Yellow Jacket, CO, ~20 attendees.
- Continual communication through text, phone calls, and emails has been maintained with participating farmers. This provides a means to gather farmer feedback and planning for project activities.
- Presentations at the state and regional level
- Presentation at USU Field Day, June 2020, virtual, ~50 attendees.
- Research Update, CSU Agricultural Experiment Station Conference, January 2020, Fort Collins, CO, ~60 attendees.
- Research Update, CSU Agricultural Experiment Station Conference, January 2019, Fort Collins, CO, ~60 attendees.
- Video presentation with CSU Extension published to the project website, in which Steve Fonte, Katie Russell and Gus Westerman gave an overview of the project objectives and methodology. (https://www.youtube.com/watch?v=7eOTuFzfeBI&feature=youtu.be)
Education and Outreach Outcomes
Dryland cover cropping in the region does not appear to be viable option for farmers in the region due to tradeoffs in water use and associated decline in cash crop yield. However, preliminary evidence suggests that partial harvest of cover crop biomass, may offer many benefits of cover cropping (based on evidence from similar regions) and help offset wheat yield penalties and to the practice more economically viable. Further research is needed to better understand the impact of partial biomass removal on soil health parameters in the region.
- Cover crop management
- Soil health
- Soil conservation concepts
Cover crop management