Final report for SW19-907
Project Information
High-elevation sagebrush rangelands in southwest Montana are used by livestock producers for summer grazing. These areas also provide habitat for many wildlife species, including sage-grouse hens rearing broods. The main source of water for these mesic (high moisture) sites are large snowbanks. As they melt, snowbanks provide water to first order streams and promote green vegetation, if the release is gradual. Several studies have documented decreases in the size of these snowbanks and predicted they will continue to decrease in size and melt earlier in the year as a result of climate change. To slow the release of water from these snowbanks during the summer grazing season, several ranchers and conservation organizations have installed water slowing and spreading structures. These structures aim to 1) convert the water stored in snowbanks into increased soil moisture that will prolong water release and 2) increase plant production to the benefit of livestock and wildlife. The purpose of this project is to evaluate the effectiveness of these structures by comparing treated areas to untreated control areas, evaluating 1) cattle use, 2) vegetative changes, and 3) arthropod responses related to sage-grouse brood rearing habitat. We do not know of another community project like this in the western United States. This unique effort should promote the sustainability of the grazing livestock industry, improve wildlife habitat and promote land stewardship. Results from this study will be shared with other ranchers, scientists and conservationists. This is a 3 year study.
The objectives of this proposal are to compare areas below snowbanks with water slowing/spreading devices to areas without these structures to answer the following questions:
- Do cattle use treated areas more than control areas without any structures?
- Do water slowers/spreaders improve herbaceous cover and plant production more than similar control sites without any structures?
- Do water slowers/spreaders increase known greater sage-grouse chick food resources (arthropods and vegetation) compared to similar control sites without any structures?
Year 1
April Hire crew members and two graduate students; prepare for field season.
Identify 30 treated areas and 30 control site areas to be sampled for objectives 1,
2, & 3.
June Begin cattle observations for objective 1 and sample arthropods for objective 3.
July Continue cattle observations for objective 1, continue arthropod sampling for
objective 3, and sample plant production for objective 2.
August Complete field work for all objectives.
Sept.–Oct. Field students summarize data.
Sort and identify arthropods, Data entry and analysis.
Year 2
April Hire and organize field crew, prepare for field season.
June Begin cattle observations and arthropod sampling for objectives 1 & 3.
July Continue cattle observations for objective 1, continue arthropod sampling for
objective 3, and begin plant production sampling for objective 2.
August Complete field work for all objectives.
On-Site field day
Sept-Oct. Field students summarize and analyze data.
Sort and identify arthropods
Nov – March Graduate students and advisors analyze data.
Year 3
April Hire and organize field crew, prepare for field season.
June Begin cattle observations for objective 1 and arthropod sampling for objective 3.
July Continue cattle observations for objective 1, begin plant production sampling for
objective 2, and compile data for objective 3.
August Complete field work for all objectives.
Host 2nd on-site field day and Town Hall meeting in Dillon, MT.
Sept-Oct. Field students summarize and analyze data.
Nov – March Graduate students and advisors analyze data and write results.
Extension video completed.
Two scientific manuscripts submitted for publication.
Extension Reports completed.
Submit final report to SARE
Cooperators
- - Technical Advisor
- - Producer
- (Researcher)
- - Producer
- (Researcher)
- - Producer
Research
Hypothesis:
The objectives of this proposal are to compare areas below snowbanks that have water slowing/spreading structures (treated) to areas without these structures (control) to address the following hypotheses:
- Do cattle grazing in pastures with water slowing structures prefer the mesic areas compared to the upland sites?
- Plant Response
- There are no differences in plant cover, green cover, forbs, grasses and rushes/sedges at treated areas compared to untreated control areas from 2021 and 2022.
- There are no differences in plant production of forbs, grasses and rushes/sedges at treated areas compared to untreated control areas in 2019 and 2020.
- There are no differences in soil moisture between treated areas and untreated control areas using 6 drainages from 2019 to 2022 when measured with a surface probe (Vegetronix VG-Meter)
- There are no differences in soil moisture between treated and untreated control areas from 4 drainages measured with hourly soil moisture probes in 24 reaches (12 treated, 12 control) from 2020 to 2022.
- There are no differences in soil moisture between treated areas and untreated control areas in seasonal drying rates, soil water retention and water residence time after rainfall events.
- 3. Sage-Grouse Resource Responses:
- There are no differences in herbaceous vegetation preferred by sage-grouse chicks at treated areas compared to control areas.
- There are no differences in abundance or biomass of arthropod orders known to be sage-grouse chick food sources at treated areas compared to untreated control areas.
Materials and Methods:
In the summers of 2018 and 2019, field crews and producers installed water slowing and spreading structures. We sampled 159 water-slowing and 3 water-spreading structures.
The initial selection and construction of these structures was conducted by Bryant Jones, Barry McCoy, and Rulon Buhler of our producer team, Dr. Levine of University of Montana Western, Kyle Cutting of Red Rock Lakes National Wildlife Refuge (NFWF), and Jim Berkey and Sean Claffey of The Nature Conservancy. Half of the costs associated with the construction and subsequent monitoring came from a National Fish and Wildlife Foundation (NFWF) grant. The other half of the funds came from matching in-kind funds from the other cooperating institutions, including the Bureau of Land Management.
These structures are within the 1.5-million-acre core sage-grouse areas of southwest Montana, in Beaverhead and Madison Counties. This region is nestled between the High Divide and the Greater Yellowstone area. This region is not only important to many family-run cattle grazing operations but is also vital to ecotourism. Most of the structures are located in mountain big sagebrush (Artemisia tridentate spp. vaseyana) plant communities above 6,700 ft, with the majority located on private land, and the remaining structures on public lands.
Experimental Design
We used identical sampling methods in treated and control reaches. Treated reaches had at least three water-slowing structures, whereas control reaches had at least three locations that could have had such structures. We centered our data collection on three by two-meter subplots in these locations (Figure 1). We sampled the most upstream and downstream water-slowing structures (in treated reaches) or the location where structures would have been installed, as well as the most central structure/location. In 2019 and 2020, no sampling took place within a 1.5-m buffer of each water-slowing structure (or the location where it could have occurred in control reaches) to eliminate bias associated with the disturbed ground created during construction; we placed the subplot immediately upstream of this buffer area.
During the summer of 2019, we sampled 16 reaches (8 treatment, and 8 control) in four drainages; this timing of sampling captured responses one year after treatment. During summer 2020, we collected data in the same 16 reaches, to capture responses two years after treatment. We also sampled 38 new reaches (18 treatment and 20 control) in three additional drainages in 2020, representing one year after treatment. We sampled vegetation and arthropods in each reach three times (visits): once in each of the months of June, July, and August. We chose this sampling schedule to capture the gradient of senescence throughout the summer. During the summers of 2020 through 2022, we added one additional vegetation sampling visit during the month of September.
Vegetation cover and production tend to increase in wet meadows, as well as trend towards increased cover of graminoids and forbs. We expected to see denser canopy coverage and increased production in treated sites when compared to untreated sites.
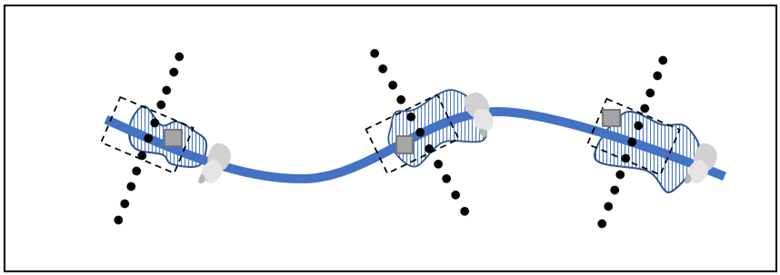
Figure 1. Visual representation of a reach, our experimental unit, and sampling areas including the sampling area (black hashed line), vegetation frame (gray square), and soil moisture readings (black circles) southwestern Montana.
Cattle Observations
Cattle spent very little time in drainages that contained treatments and controls, and only 10 of the 340 observations made were of cow/calf pairs in treated drainages. Observations from the 2021 field season showed that cattle location could not be identified by treatment or controls since the scale was so small. However, we counted cattle in drainages near study sites to estimate how much time cattle spend in mesic areas vs. uplands. This was done by observing cattle in peak grazing times from a vantage point from 0600 to 1200 and 1700 to 2100 hr. During these times of day a researcher would count the number of cow/calf pairs in mesic and upland areas every 15 minutes. We obtained 110 hours of observations (n=440) during the 2021 and 2022 grazing season on the four sites that were grazed. Cattle were present in Keystone Tributary, Clover Tributary, Little Basin Seven Tributary and Little Basin 24 Tributary during the months of July and August.
Vegetation
We used a canopy coverage approach to quantify plant communities. We estimated total cover of vegetation and non-vegetation (e.g., woody debris, bare ground) within a 0.5 x 0.5-m frame randomly placed within each subplot, resulting in three estimates per reach (0-100%; Figure 1). We then identified each individual plant to the lowest taxonomic level feasible and estimated percent coverage of each functional group (e.g., forbs, grasses, litter); the total of these estimates did not exceed 100%. In 2021 and 2022, we added an additional three frame estimates resulting in six estimates per reach. In 2021 and 2022, we also clipped the half meter squared quadrats to estimate total vegetation production (g/m2).
Vegetation and Soil Moisture Data Analysis
To characterize the efficacy of the restoration structures, we analyzed variation in soil moisture, as well as vegetation cover (by functional group) and species composition. We averaged data collected within each reach. We modeled each response variable as a function of treatment and visit (month) using general linear mixed models; we included a random intercept for drainage to account for repeated sampling and inherent variation among drainages. To account for variation within each drainage, we included four additional covariates: relative distance, gully slope, bank aspect, and the width-depth ratio for each reach. We repeated this process for years 1, 2, 3 and 4. Relative distance was the distance between the sampled reach and the most upstream reach in the drainage, to account for spatial trends. Gully slope was the average incline of sampled areas within each reach, to adjust for lower water infiltration and drier conditions with steeper slopes. To accommodate variation in how quickly soils dry after a period of moisture recharge, we averaged the bank aspect (river left) of sampled areas within each reach. Finally, we computed the width-depth ratio, dividing the width of the gully by the depth, averaged for all sampled areas in the reach, to account for changes in shape leading to changes in soil saturation. Larger values of this ratio denote wider and shallower gullies, which tend to be wetter than narrower and deeper gullies.
Soil Moisture
We characterized soil moisture by measuring volumetric water content at a depth of 10 cm (Vegetronix VG-Meter-200, Vegetronix, Inc., Riverton, Utah). In each subplot, we sampled soil moisture along a 10-m transect, which was perpendicular to and centered on the gully, two meters above the structure. We collected measurements at one-meter increments, with one measurement taken in the center of the gully (11 total measurements per subplot). Gully widths varied and we only included soil moisture measurements that fell within the bank edges of the gully in analyses. In the summers of 2020 through 2022, we collected hourly soil moisture at 12 treated and 12 control reaches evenly divided between 4 drainages using soil moisture probes (HOBO IOHS moisture sensors) placed at 0m, 1m and 3m from the centerline of the gully. Probes were buried at 15cm. A Davis tipping bucket was attached to record total rainfall.
Arthropod Sampling
To ensure we captured both ground- and vegetation-dwelling arthropods, we used a combination of vacuum and pitfall sampling to characterize arthropod communities in treatment and control reaches in 2019 to 2020. We combined samples from each of the methods collected within a reach during the same visit.
Vacuum sampling - To capture flying and vegetation-dwelling arthropods, we used a vacuum/blower (Stihl SH56C, Stihl, Inc., Waiblingen, Germany) with window screen attached to the end. One vacuum sample was collected at a random location within each sampling plot, for a total of three for each experimental unit. At the selected location, we placed a 0.25-m2 plastic barrel with an 800-micron screen covering on top, to prevent arthropods from escaping. We ran the vacuum for 30 seconds within that barrel at each sampling location. To reduce bias from disturbing vegetation, we ensured vacuum sampling was the first task completed after arriving at the experimental unit. This method was not conducted in 2021 or 2022.
Pitfall sampling - We used pitfall trapping to capture ground-dwelling arthropods. Ideally, pitfall traps should have a diameter between 6.5 and 15 cm, to allow for relatively efficient sampling without drastically increasing effort. With this in mind, we used 9.5 x 12-cm plastic cups (Solo Cup Company, Lake Forest, Illinois) dug deep enough to be flush with the ground. Additionally, we removed vegetation and debris from the area immediately surrounding the pitfall trap to allow for free movement of ground-dwelling arthropods. We partially filled each pitfall trap with propylene glycol (LowTox Antifreeze/Coolant, Prestone Products Corporation, Lake Forest, Illinois) to kill and preserve trapped insects. We placed one pitfall trap within each sampling unit, for a total of three for each experimental unit, for one 24-hour period. For the first visit (June), we randomly selected a location within each sampling plot. For the second (July) and third (August) visits, we reused the pitfall hole dug during the first visit to reduce soil disturbance.
Arthropod Processing
After collection, arthropods were cleaned of debris and stored in 90% ethanol until further processing. We identified each collected arthropod to order. We measured all collected arthropods from frons to the tip of the abdomen to the nearest millimeter, then converted arthropod length to estimated biomass using taxon-specific length/mass regression equations. We computed an estimated biomass by order for each reach, combining data from the three sampled locations during one visit. In 2021 and 2022, we dried arthropods as weighed specimens to obtain dry biomass. We focused on known important arthropod foods (see Analysis).
Sage-Grouse Analysis
We used information from the literature to characterize important arthropod and plant foods for sage-grouse. Although we aimed to find diet information from nearby areas, we used references from other locations as needed. Sage-grouse chicks overwhelmingly consume arthropods belonging to the orders of Hymenoptera (mainly Formicidae), Coleoptera, Orthoptera, and larval Lepidoptera. We used the combined estimated biomass (in µg) for important arthropod foods in each reach for each visit as the response variable for sage-grouse chicks. In Montana, Idaho, and Oregon, chicks primarily consume forbs belonging to the families Brassicaceae, Fabaceae, Polemoniaceae, Asteraceae, and Lilaceae in areas dominated by big sagebrush (Artemisia tridentata). We compared canopy coverage of known important genera within these families as the response variable in models for sage-grouse chicks. We modeled each response variable as a function of treatment (treated or control) and visit (month) using general linear mixed models: we included a random intercept for drainage to account for repeated sampling and inherent variation among drainages. To account for variation within each drainage, we included four additional covariates: relative distance, gully slope, bank aspect, and the width-depth ratio for each reach.
Research results and discussion:
We sampled 16 reaches (8 treatment, 8 control) and 4 water spreaders (2 treatment, 2 control) 3 times during the summer of 2019, and 53 reaches (26 treatment, 27 control) and 4 water spreaders (2 treatment, 2 control) in the summer of 2020. In 2021 and 2022 we sampled 54 reaches in 7 drainages.
Year 1 (2019) and Year 2 (2020)
Vegetation and Soil Moisture
We were unable to detect differences in vegetation cover or composition (Table 1). We also did not detect differences in soil moisture between treated and control reaches during any sampling period (Table 2).
Table 1. Canopy coverage of functional groups (% coverage, means) in sampled reaches, one-year post-treatment (summers 2019 and 2020, n = 53, 27 control, 26 treatment), southwestern Montana. No differences (P<0.05) were detected for any category in any month.
|
|
June |
July |
August |
September |
|
|
Total vegetation |
Treatment |
65 |
73 |
69 |
70 |
|
Control |
60 |
69 |
69 |
71 |
|
|
Total green vegetation |
Treatment |
62 |
68 |
51 |
28 |
|
Control |
66 |
65 |
46 |
29 |
|
|
Forbs |
Treatment |
29 |
27 |
25 |
19 |
|
Control |
25 |
27 |
21 |
16 |
|
|
Grasses |
Treatment |
18 |
34 |
26 |
28 |
|
Control |
23 |
27 |
25 |
31 |
|
|
Rushes/Sedges |
Treatment |
12 |
15 |
13 |
9 |
|
Control |
26 |
21 |
18 |
19 |
|
Table 2. Soil volumetric water content (% saturation, means) in sampled reaches, one-year post-treatment (summers 2019 and 2020, n = 53, 27 control, 26 treatment) and two years post-treatment (summer 2020, n = 16, 8 control, 8 treatment), southwestern Montana. No differences (P<0.05) between treatments and controls were detected for any month.
|
|
June |
July |
August |
September |
|
|
1-year post-treatment (2019) |
Treatment |
44 |
31 |
32 |
16 |
|
Control |
44 |
31 |
18 |
18 |
|
|
2-years post-treatment (2020) |
Treatment |
47 |
62 |
32 |
48 |
|
Control |
31 |
61 |
30 |
48 |
|
Vegetation, Soil Moisture and Sage-Grouse Resources Year 1 and 2
We did not detect differences in important forage items for sage-grouse chicks between treated and control reaches one- or two-years post treatment (Table 3).
Table 3. Means from models assessing important arthropod (biomass in µg) and plant foods (percent canopy coverage) for sage-grouse in sampled reaches, one-year post-treatment (summers 2019 and 2020, n = 53, 27 control, 26 treatment) and 2 years post-treatment (summer 2020, n = 16, 8 control, 8 treatment), southwestern Montana. Plants were sampled in June, July, August, and September, and arthropods were sampled in June, July, and August. No differences (P<0.05) between areas treated with water slowing/spreading structures and controls were detected for any month.
|
|
June |
July |
August |
September |
||
|
1-year post-treatment (2019) |
Arthropods micrograms |
Treatment |
41 |
124 |
565 |
|
|
Control |
111 |
186 |
470 |
|
||
|
Plants % Cover |
Treatment |
7 |
7 |
9 |
8 |
|
|
Control |
7 |
7 |
7 |
7 |
||
|
2 years post-treatment (2020) |
Arthropods micrograms |
Treatment |
48 |
123 |
201 |
|
|
Control |
86 |
111 |
502 |
|
||
|
Plants % Cover |
Treatment |
10 |
6 |
7 |
4 |
|
|
Control |
6 |
7 |
8 |
7 |
||
Research results and discussion:
Year 3 (2021) and Year 4 (2022)
Cattle Use
We tested the hypothesis that cattle used mesic habitats more than upland habitats based on the number of cattle observed in each type at 15-minute intervals. In 2021, we observed 247 total head of cattle from July to August. Cattle use of mesic areas was greater (P=0.03) than cattle using uplands (Table 4) In 2022, observations from 191 total head of cattle did not find any difference (P<0.05) in cattle use between mesic and upland habitats (Table 7).
Table 4
Comparison of the mean number of cattle observed, standard error of the means (SEM) and p-values in mesic meadows to uplands in 2021 and 2022 in southwest Montana.
|
July – August 2021 Number of observations =249 |
Mesic/Upland |
Mean # animals observed |
SEM |
p-value |
|
Mesic |
50 |
1.6 |
0.036 |
|
|
Upland |
34 |
|||
|
July-august 2022 Number of observations=191 |
Mesic/Upland |
Mean animals observed |
SE |
p-value |
|
Mesic |
19 |
2.3 |
0.644 |
|
|
Upland |
20 |
Vegetation
Results from Year 3 (2021) and Year 4 (2022) are listed in Table 5. Total vegetation cover of reaches with restoration structures was increased (P<0.06) in July, August and September of 2021. Green cover of treated reaches was increased (P<0.002) in July of 2021. Grass cover of treated reaches was increased (P<0.01) in all months of Year 3 (2021) compared to control reaches. There were no differences (P<0.05) in forb cover and rush/sedge cover between treated and control reaches in 2021.
In Year 4, or 2022, there were no differences (P<0.05) in total mean cover between treated and control reaches (Table 5). With a few monthly exceptions, green cover, forb cover, grass cover and rush/sedge cover of treated reaches were not different (P<0.05) from control reaches in Year 4, or 2022.
Total vegetation biomass g/m2 of treated reaches was not different from control reaches in Year 3 (2021) or Year 4 (2022) after restoration structures were installed (Table 6).
Table 5
Mean percent cover of Total (forb+grass+shrub+rush/sedge), Forb, Grass, Rush/Sedge, and standard error of the means (SEM) and p-values of treatments using restoration structures compared to control (no treatments) from June to September in 2021 and 2022 in southwest Montana.
|
Year |
Month |
T/C |
Mean Total Cover (%) |
SEM |
p |
Mean Total Green Veg(%) |
SEM |
p |
Mean Forb Cover(%) |
SEM |
p |
Mean Grass Cover(%) |
SEM |
p |
Mean Rush/Sedge Cover(%) |
SEM |
p |
|
2021 |
June |
T |
25 |
2.3 |
0.318 |
34 |
2.5 |
0.829 |
9 |
1.5 |
0.205 |
16 |
1.5 |
0.010 |
4.35 |
1.3 |
0.124 |
|
C |
12 |
33 |
1 |
|
|
10 |
6.23 |
||||||||||
|
July |
T |
26 |
2.2 |
0.003 |
33 |
2.3 |
0.002 |
6 |
1.3 |
0.854 |
21 |
1.6 |
<0.001 |
4.85 |
1.3 |
0.237 |
|
|
C |
20 |
26 |
9 |
|
|
11 |
6.35 |
||||||||||
|
Aug |
T |
29 |
2.5 |
0.002 |
27 |
2.5 |
0.551 |
5 |
1.0 |
0.409 |
24 |
2.3 |
0.002 |
0.18 |
1.2 |
0.111 |
|
|
C |
27 |
16 |
9 |
|
|
17 |
1.99 |
||||||||||
|
Sep |
T |
18 |
1.4 |
0.067 |
16 |
1.2 |
0.391 |
3 |
0.8 |
0.233 |
16 |
1.4 |
0.002 |
2.61 |
1.0 |
0.085 |
|
|
C |
16 |
17 |
7 |
|
|
9 |
4.41 |
||||||||||
|
2022 |
June |
T |
37 |
2.1 |
0.209 |
46 |
1.2 |
0.392 |
13 |
1.6 |
0.090 |
24 |
1.9 |
0.005 |
5.47 |
1.0 |
0.639 |
|
C |
39 |
49 |
10 |
|
|
29 |
5.42 |
||||||||||
|
July |
T |
34 |
2.1 |
0.323 |
46 |
2.3 |
0.093 |
2 |
1.5 |
0.100 |
31 |
1.9 |
0.021 |
4.82 |
1.2 |
0.003 |
|
|
C |
39 |
50 |
10 |
|
|
30 |
8.35 |
||||||||||
|
Aug |
T |
32 |
2.0 |
0.579 |
27 |
2.3 |
0.291 |
9 |
1.3 |
0.932 |
23 |
1.7 |
0.489 |
5.26 |
1.3 |
0.731 |
|
|
C |
33 |
25 |
9 |
|
|
24 |
5.72 |
||||||||||
|
Sep |
T |
33 |
1.9 |
0.976 |
20 |
1.6 |
0.036 |
9 |
2.0 |
0.046 |
24 |
1.8 |
0.224 |
5.39 |
1.2 |
0.257 |
|
|
C |
31 |
17 |
2 |
|
|
29 |
6.77 |
Table 6
Total mean vegetative biomass (g/m2), standard error of the means (SEM) and p-values of reaches treated with restoration structures compared to control reaches without treatments in 2021 and 2022 in southwest Montana. No differences between treatments were detected in either year.
|
Year |
Mean Weight Treatment (g/m2) |
Mean Weight Control (g/m2) |
SEM |
p-value |
|
2021 |
42.86 |
37.98 |
6.3 |
0.441 |
|
2022 |
59.14 |
53.12 |
6.5 |
0.361 |
Soil Moisture
Soil Moisture collected from 53 reaches (26 treatments and 27 controls) were used to compare the effectiveness of water retaining structures to increase soil moisture. We did not detect any differences between areas with structures and similar reaches without structures in 2021 or 2022 (Table 7), testing hypothesis 1a using a Vegetronix VG meter.
In 2020, 2021 and 2022 we sampled 24 reaches in 4 drainages (12 treatments, 12 controls) to see if there was a difference in soil moisture using continuous monitoring from HOBO probes. Treatment reaches were a section of stream with 3 or more restoration structures installed. Control reaches were sections of streams that were suitable for restoration, but no structures were installed. We found no differences (Table 4) in average soil moisture, seasonal drying rate or total seasonal water retention between treatments and controls (hypothesis 1b and 1c). We found that after rainfall events, treated reached held water an average of 1.67 days longer than control reaches (P=0.0069).
Table 7. Soil volumetric water (% saturation of soil moisture, standard error of the mean (SEM) and p-valued) in sampled reaches (n=53, 26 treatments, 27 controls) comparing soil moisture retaining structures to untreated controls three (2021) and four years (2022) after installation. No differences (P<0.05) were detected for between treatments in any month.
|
Year 3, 2021 |
||||
|
Month |
Mean Treatment % SM |
Mean Control % SM |
SEM |
p-value |
|
June |
21 |
21 |
1.4 |
0.7 |
|
July |
7 |
7 |
0.8 |
1.0 |
|
August |
9 |
10 |
1.3 |
0.5 |
|
September |
8 |
9 |
0.9 |
0.6 |
|
Year 4, 2022 |
||||
|
June |
36 |
35 |
1.7 |
0.7 |
|
July |
10 |
10 |
1.4 |
0.9 |
|
August |
6 |
6 |
0.7 |
0.7 |
|
September |
3 |
3 |
0.3 |
0.8 |
Sage-grouse chick resources
In 2021 and 2022, we compared the arthropod availability using 24 hr. pitfall traps from June to August of 27 treated reaches and 27 control reaches in 7 drainages to see if structures increased arthropods available to sage-grouse chicks. We have found no difference (P>0.10) in arthropod activity density or dry biomass between treated and control reaches in any of the two year or within any of the months.
We tested the hypothesis that reaches with meadow restoration structures would increase plant canopy cover of known sage-grouse chick foods in 2021 and 2022. We found a 27% increase (P=0.004) in total canopy cover and a 30% increase (P=0.003) in live canopy cover across both years and all drainages.
Discussion
We did not measure any increase in soil moisture, plant response or sage-grouse food items in the first two years after the structures were installed. Even four years after installation, we did not measure any increases in soil moisture, except we found that structures retained moisture 1.67 days longer (P<0.05) than control reaches after a rainfall event. By the third and fourth years, we still saw no increases in arthropods which might be used by sage-grouse chicks. However, we found a 27% increase in total canopy cover (P=0.004) and 30% increase (P=0.0013) in live canopy cover of plants used by sage-grouse in reaches with structures compared to control reaches. Overall vegetative responses indicated that total vegetative cover and grass cover was increased (P<0.05) by structures in some months three and four years after installation.
Measuring positive effects of restoration efforts usually takes time. Silverman et al. (2019) used Normalized Difference Vegetation Index (NDVI) collected with satellites to estimate plant production five years after installing structures. Using these techniques, they were able to measure increases in plant production in perennial streams. Our environment consists of ephemeral streams which would take longer to accumulate sediment and increase plant production.
The longer residence time for water following a precipitation event suggests that low-tech restoration structures may provide a promising option for improving sagebrush meadows. Increasing water storage should build resistance against climate change for livestock and wildlife.
We were unable to test if restoration structures increased cattle grazing in the immediate area due to the difficulty of assigning the exact location of each cow in reference to the structure. Instead, we tested if grazing cattle spent more time in mesic areas compared to upland sites. They preferred mesic sites over upland sites in 2021 but not in 2022. Based on other research structures provided more green biomass than control areas. This should enhance grazing for beef cattle.
Research conclusions:
Conclusions
Low-tech solutions are a relatively new method of wet meadow restoration and continued monitoring is crucial to developing our understanding. Comparing findings from the growing number of studies focused on these tools also will help us to understand the factors that may alter efficacy and the time needed to detect effects.
Producers that participated in this study said the amount of labor needed to build these structures would be difficult to justify unless there was some large-scale community assistance. We only had three other producers who visited the sites on a field day. They stated they could not implement this practice without some outside labor.
Compared to other restoration methods, the low cost and relative speed of installation make a compelling case for low-tech solutions in wet meadows. Climate change, overgrazing, and habitat conversion, combined with the importance of wet meadows to many plant and wildlife species, suggest this approach is needed to restore wet meadows in arid landscapes and improve habitat for sagebrush-associated species.
Research outcomes
Producers acknowledged the need for conservation structures but stated there would have to be another organization to construct them.
Education and Outreach
Participation summary:
Two MS theses have been completed at this time.
A third MS thesis is under review.
We had one field day where our information was shared with 54 people. Other field days were not possible due to covid restrictions.
One video of our project was prepared and made available on Youtube, the Department of Animal and Range Sciences, Montana State University and the Centennial Valley Association websites. https://www.youtube.com/watch?v=-KlWIDfIXro
Extension publications will not be finalized until all graduate students have defended.
Education and Outreach Outcomes
None to report at this time.
Field work has not been completed.
- Knowledge of Riparian Restoration: After our interaction or field day, we hope that producers have some knowledge of the overall goal of the project. They should be able to remember material we present, including the long-term predictions of snowfall and runoff in this area, as well as describe and recognize predictions for abiotic factors that will influence the production of beef cattle in this valley for the next 25-50 years. They should also be able to describe and recognize the role of small, water-slowing structures to offset these changes.
- Application of Riparian Restoration: We are most interested in the application of this information and how willing producers would be to adopt our methods and apply our findings on their property. We want to assess their willingness to adopt or modify their current management practices to include some water-slowing structures to increase soil moisture to benefit livestock and wildlife.
Riparian Restoration