Final report for SW19-908
Project Information
Conversion of land use in western states has increased over the past few years. In California, land use conversion is typified by 1..depletion of rangeland to cropland and to urbanization. Between 1983 and 2008 for example, approximately 20,000 acres of prime rangeland were lost every year, mainly in the Central Valley region. While it is generally recognized that the rapid and widespread conversion of rangeland in the absence of sound conservation management would negatively affect ecosystem services, little is known about the full range of ecosystem changes (negative and positive) that occur on converted grounds of rangeland. This project will provide new insights into the essentials of ecosystem function changes during rangeland conversion to cropland. The project will also examine areas where rangeland functionality is weak in terms of soil health and develop extension and educational strategies to propose remediation/conservation measures that optimize rangeland ecosystem functions while maintaining and improving rangeland economic returns. We will use field data collection and computer modeling to evaluate the impacts of rangeland conversion on ecosystem functionality by comparing environmental quality data between rangeland and almond fields. We will set up and monitor three study sites, each with a rangeland site adjacent to almond orchards over a period of three years in collaboration with producers. We will collect field data to compare how infiltration, water flux, evapotranspiration (ET), soil nutrient content, runoff, soil microbial activity, soil carbon, plant production, plant, vertebrate and invertebrate species diversity, weed infestation, and soil compaction vary between rangeland and almond orchard sites. We will use modeling to evaluate the impacts of various conversion arrangements on hydrology at a watershed scale and explore the potential for linking and integrating production systems (i.e. mixed production approach) that can enhance overall ranch and farm profitability. We will also utilize the exiting literature to identify the institutional requirements for building resilience in rangelands, and apply those insights in analyzing the existing policies and institutional mechanisms for the governance of rangelands in the Central Valley of California. We will monitor the initial costs of converting rangeland to cropland and costs associated with maintaining recently established cropland given potential changes in ecosystem functions. We will monitor revenue per acre earned from recently converted cropland across various potential crops and compare to returns earned over time. Data collected will be used to construct a simulation model to test economic implications of conversion over time. We expect this project to lead to improved recommendations for conversion of rangelands in California and western states in order to help optimize environmental sustainability of rangelands. The project will provide science-based information to assist producers and ranchers determine which conservation practices/arrangements may work in their operations. The installation and results of this project will be incorporated into Extension and Outreach programming and other educational activities that will be released through a variety of outlets to inform producers and ranchers about the potential ecosystem changes that occur following conversion of rangelands.
The goal of this project is to provide insight into the basics of negative and positive ecosystem function changes during rangeland conversion to cropland. The project will propose measures to optimize rangeland ecosystem functions and will also explore the potential for establishing more integrated yet diversified agricultural production systems when land use changes occur to improve ecological sustainability. The specific objectives of this projects are to:
- Establish field study sites for educational demonstration of rangeland conversion to cropland;
- Evaluate the impacts of rangeland conversion on ecosystem functions (plant production, species diversity, soil condition and water budget) at field scales;
- Use modeling to evaluate watershed scale impacts of selected ecosystem functions of rangeland conversion to cropland;
- Synthesize the relevant literature to identify the institutional requirements for enhancing resilient rangeland systems, and assess the performance of existing institutional mechanisms for the governance of rangelands and their adequacy in promoting sustainable and resilient working landscapes.
- Evaluate the on-farm and off-farm costs of rangeland conversion to cropland and costs of maintaining converted cropland given potential changes in ecosystem functions over time.
- Develop appropriate farm and watershed level management strategies to optimize farm/ranch profitability and ecological sustainability; and
- Disseminate research findings to
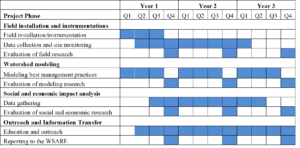
The proposed project milestones and timeline are shown below.
Cooperators
- (Educator and Researcher)
- (Educator and Researcher)
- (Educator and Researcher)
- - Producer (Educator and Researcher)
- - Producer (Educator and Researcher)
- (Educator and Researcher)
- - Producer
- (Educator and Researcher)
- (Educator and Researcher)
- (Educator and Researcher)
Research
Land-use conversion from rangelands to orchards is associated with changes in ecosystem functions (soil organic matter, nutrient content, water infiltration, plant and insect diversity, and production) which in turn affect ecosystem services provided by landscapes.
This project focuses on analyzing ecosystem changes, both positive and negative and explores the potential to integrate land-use systems, determine complementarity between mixed land uses, and evaluate watershed management strategies that can be adopted with the conversion of land use to optimize farm/ranch profitability.
The study investigates also the drivers behind the decisions for land-use change and the socio-economic implications of the changes.
Completed Activities:
Activity 1: Set up 3 study sites with rangelands in proximity to almond orchards (2 conventional and 2 integrated), and two age groups (young <6 years and old >8 years) with help from the collaborating producers. Samples are collected in three macroplots in each production system (rangelands and orchards ) with four soil samples collected within each macroplot. In the orchard systems, two samples are collected within rows about half-point between a central tree within the macroplot and two neighboring trees; and two samples between rows of the almond trees to capture potential differences in the two microsites of the almond orchards.
Activity 2: Collected 84 soil samples to evaluate the effects of rangeland conversion on soil health and condition All soil samples were analyzed for nutrient availability, microbial activity, soil structure, and water budget.
Activity 3: Eighty-four soil cores were collected to measure seed bank plant diversity in the orchard and rangeland systems. The soil cores were broken up and seeded and grown in pots in a greenhouse. Plant species and their respective number were recorded.
Activity 4: We measured 2 seasons of herbaceous plant production and diversity at peak standing biomass in late spring on rangelands only. Data were collected using the harvest method in 20 randomly placed 30 x 30 cm quadrats within the 10 x 50m macroplots. Weed management in orchard systems where most weed treatment is preemergent created a scenario that limited the use of such data for comparison with rangeland data. As a result, we decided against collecting herbaceous plant biomass in orchards.
Ongoing and future activities:
Activity 5: Insect diversity samples were collected in 3 different ways every two weeks from spring to early summer of 2021. During every sampling period: 84 pitfall trap samples, 28 sticky trap samples, and 28 sweep net samples were collected. Insect Identification is still ongoing.
Activity 6: Use modeling to evaluate watershed-scale impacts of selected ecosystem functions of rangeland conversion to cropland. To get more accurate models we installed soil sensors to detect water movement through the soil profile, which we will use as ground-truthing data that can calibrate the hydrology models. The next steps include evaluating changes in water quantity and quality following the conversion at a watershed scale using the Soil and Water Assessment Tool (SWAT). Quantify the dynamic balance of water in the soil profile at the field and watershed scale.
Activity 7: Identify the institutional requirements for enhancing resilient rangeland systems, and assess existing policies and institutional mechanisms for the governance of rangelands. Based on the assumption that rangeland systems are complex social-ecological systems that are constantly exposed to multiple drivers of change to which they must build the capacity for adaptation and transformation in order to be sustainable, we will conduct a comprehensive review of the literature to identify the institutional requirements for the sustainable governance of rangeland systems.
Activity 8: Work to evaluate the costs of rangeland conversion to cropland and costs of maintaining converted cropland given potential changes in ecosystem functions over time will start this summer. We will use established methodologies (almond harvest, and forage production estimates) to assess the costs and returns on newly converted cropland for various crops typically grown in the study region.
Activity 9: As the data analysis continues and clear patterns emerge we will start developing more holistic farm and watershed level management strategies to optimize farm/ranch profitability and ecological sustainability.
Activity 10: Disseminate research findings to stakeholders through the popular press, social media, and public events working with collaborating producers.
One of the almond research sites used a more integrated/regenerative orchard production system and was analyzed separately.
A total of 84 soil samples were collected for each of the following: soil nutrient analysis, seed bank study, bulk density, and related properties. All soil samples have been processed for bulk density and related properties (porosity, estimated volumetric water content, estimated water infiltration rate, microbial respiration, and routine nutrient content (N, P, K). Soil organic matter was high in rangelands, then declined in young almond orchards and then peaked in older orchards. SOM was higher in regenerative orchards compared to conventional in both age groups.
The seed bank samples (84) were germinated in a greenhouse from December 2019 until spring 2020. We recorded plant species and numbers, and the approximate timing of plant emergence was recorded. We used this data to calculate Simpson's Diversity Index. Plant diversity was highest on rangelands, followed by regenerative orchards and lowest or conventional orchards. Based on abundance of forage species in each system, regenerative orchards had the A1. highest nutritional value, followed by rangelands and last conventional orchards.
Insect Diversity Data was collected from Spring 2021 using sticky traps, pitfall traps, and sweep nets- through the end of summer. Insect diversity changes seasonally in the different systems as expected, with diversity 2. picking on rangelands in end of earlier in spring, compared to in orchards. Almond orchards continue to have higher insect population into late spring when rangelands are 3. getting into senescence. At the peaks, regenerative almond orchards had the highest insect diversity.
The landscape hydrology assessment portion of the project started in the fall of 2021. We installed soil sensors for field measurements that will be used to calibrate the models. We are in the process of developing models. This work is continuing into spring 2023.
- We 4. perfoormed a literature review to identify the drivers for land use conversion and institutional requirements for the sustainable governance of rangeland systems. Drivers of rangeland conversion included negative public perception about grazing impacts diversity and green house gases (GHG), restrictive public policy on grazing management, improved technology that allows more marginal rangelands to be used for orchard systems, lower economic returns, inheritance issues and rangeland fragmentation. Factors that reduced conversion rates include conservation programs (eg EQIP, Williamson Act, and conservation easements); education programs that emphasizes the benefits of working rangelands to biodiversity and wildlife habitat; Payment for Ecosystem Services (PES) and the establishment of California Conservation Coalition (CRCC). The establishment of the CRCC is an example of adaptive governance that has created a platform for social learning - that promotes the sharing of information about multi-use and benefits of well managed rangelands.
Lab closures due to the COVID-19 pandemic slowed down or completely stopped some soil tests in 2020. Fieldwork was slowed down by the social distancing requirements which limited field crews in 2020.
Preliminary results show higher nutrients, more respiration, plant diversity, and insect diversity in integrated almond orchards and rangelands and less in conventional orchards in general. For insect diversity - we are seeing evidence of seasonal changes in the species and numbers.
Research outcomes
Preliminary results show that regenerative orchard production reduces the long term loss in ecosystem function when land is converted from rangelands to crop production
We found higher insect diversity, plant diversity and soil organic matter in regenerative almond orchards compared to convention almond orchards. The regenerative site included in this research is organic, has plants cover crops (although not ever year) and uses sheep and fire for weed control - our recommendation is for orchard producers to add regenerative management strategies over time to not significantly disrupt production, especially starting with cover crops.
We recommend more peer-to-peer advisory meetings among producers of different commodities to encourage relationship building and developing landscape level management strategies that address complex issues such as sustainability and regional level climate resilience. These relationships could strongly improve regional level implementation of circular production systems, reduce wasted by-products or transportation to other markets, and makes more efficient use of local resources that could improve profitability.
Insect Diversity Data
| Sticky Card Trap -Rangeland | ||||||||||
| Date | Site ID | Trap 1 (ID) | Trap 1 (Count) | Trap 2 (ID) | Trap 2 (Count) | Trap 3 (ID) | Trap 3 (Count) | Trap 4 (ID) | Trap 4 (Count) | Notes |
| 4/20/2021 | Cunningham | flies(larger) | 6 | flies(larger) | 14 | flies(larger) | 12 | flies(larger) | 9 | |
| small flies | small flies | small flies | small flies | no specific count | ||||||
| ladybug | 1 | ladybug | 1 | ladybug | 0 | ladybug | 1 | |||
| gnats(sciaridae) | gnats(sciaridae) | gnats(sciaridae) | gnats(sciaridae) | no specific count | ||||||
| thrips | 329 | thrips | 273 | thrips | 276 | thrips | 371 | |||
| aphidius colemani | 26 | aphidius colemani | 33 | aphidius colemani | 22 | aphidius colemani | 27 | parasitic wasp | ||
| aphids | aphids | aphids | aphids | no specific count | ||||||
| encarsia | 4 | encarsia | 1 | encarsia | 2 | encarsia | 4 | small parasitic wasp | ||
| beetles | 7 | beetles | 4 | beetles | 3 | beetles | 2 | |||
| black rove beetle | 23 | black rove beetle | 39 | black rove beetle | 25 | black rove beetle | 22 | |||
| 6-spotted thrip | 2 | 6-spotted thrip | 10 | 6-spotted thrip | 5 | 6-spotted thrip | 4 | |||
| spiders | spiders | spiders | spiders | no specific count | ||||||
| aphytis | 1 | aphytis | 0 | aphytis | 0 | aphytis | 0 | small parasitic wasp | ||
| leafhopper | 1 | leafhopper | 6 | leafhopper | 3 | leafhopper | 4 | |||
| stethorus beetle | 1 | stethorus beetle | 7 | stethorus beetle | 4 | stethorus beetle | 16 | |||
| bee | 1 | small black hemiptera | 1 | small black hemiptera | 1 | |||||
| small bee | 1 | |||||||||
| Sticky Card Trap -Rangeland | ||||||||||
| Date | Site ID | Trap 1 (ID) | Trap 1 (Count) | Trap 2 (ID) | Trap 2 (Count) | Trap 3 (ID) | Trap 3 (Count) | Trap 4 (ID) | Trap 4 (Count) | Notes |
| 4/20/2021 | Burroughs | flies(larger) | 3 | flies(larger) | 3 | flies(larger) | 5 | flies(larger) | 5 | |
| small flies | small flies | small flies | small flies | no specific count | ||||||
| ladybug | 0 | ladybug | 0 | ladybug | 0 | ladybug | 0 | |||
| gnats(sciaridae) | gnats(sciaridae) | gnats(sciaridae) | gnats(sciaridae) | no specific count | ||||||
| thrips | 406 | thrips | 343 | thrips | 276 | thrips | 361 | |||
| aphidius colemani | 1 | aphidius colemani | 5 | aphidius colemani | 0 | aphidius colemani | 2 | parasitic wasp | ||
| aphids | aphids | aphids | aphids | no specific count | ||||||
| encarsia | 53 | encarsia | 176 | encarsia | 30 | encarsia | 30 | small parasitic wasp | ||
| beetles | 5 | beetles | 5 | beetles | 2 | beetles | 11 | |||
| black rove beetle | 0 | black rove beetle | black rove beetle | 1 | black rove beetle | 2 | ||||
| 6-spotted thrip | 4 | 6-spotted thrip | 0 | 6-spotted thrip | 1 | 6-spotted thrip | 1 | |||
| spiders | spiders | spiders | spiders | no specific count | ||||||
| aphytis | 2 | aphytis | 2 | aphytis | 1 | aphytis | 1 | small parasitic wasp | ||
| leafhopper | 0 | leafhopper | 1 | leafhopper | 4 | leafhopper | 1 | |||
| stethorus beetle | 0 | stethorus beetle | 0 | stethorus beetle | 0 | stethorus beetle | 1 | |||
| ant | false chinch bug | 3 | lygus | 5 | lygus | 2 | ||||
| cranefly | isopod | 1 | earwig | 1 | ||||||
| false chinch bug | 1 | |||||||||
| small bee | 2 | |||||||||
| Sticky Card Trap -Rangeland | ||||||||||
| Date | Site ID | Trap 1 (ID) | Trap 1 (Count) | Trap 2 (ID) | Trap 2 (Count) | Trap 3 (ID) | Trap 3 (Count) | Trap 4 (ID) | Trap 4 (Count) | Notes |
| 4/20/2021 | Ichord | flies(larger) | 7 | flies(larger) | 8 | flies(larger) | 7 | flies(larger) | 14 | |
| small flies | small flies | small flies | small flies | no specific count | ||||||
| ladybug | 0 | ladybug | 1 | ladybug | 0 | ladybug | 0 | |||
| gnats(sciaridae) | gnats(sciaridae) | gnats(sciaridae) | gnats(sciaridae) | no specific count | ||||||
| thrips | 112 | thrips | 1052 | thrips | 385 | thrips | 206 | |||
| aphidius colemani | 2 | aphidius colemani | 1 | aphidius colemani | 1 | aphidius colemani | 2 | parasitic wasp | ||
| aphids | aphids | aphids | aphids | no specific count | ||||||
| encarsia | 3 | encarsia | 6 | encarsia | 3 | encarsia | 3 | small parasitic wasp | ||
| beetles | 2 | beetles | 1 | beetles | 4 | beetles | 1 | |||
| black rove beetle | 0 | black rove beetle | 2 | black rove beetle | 1 | black rove beetle | 4 | |||
| 6-spotted thrip | 0 | 6-spotted thrip | 0 | 6-spotted thrip | 0 | 6-spotted thrip | 0 | |||
| spiders | spiders | spiders | spiders | no specific count | ||||||
| aphytis | 0 | aphytis | 1 | aphytis | 0 | aphytis | 0 | small parasitic wasp | ||
| leafhopper | 3 | leafhopper | 8 | leafhopper | 6 | leafhopper | 26 | |||
| lygus | 2 | lygus | 2 | lygus | 5 | lygus | 1 | |||
| ant | 1 | cranefly | 1 | |||||||
| false chinch bug | 1 | |||||||||
| Sticky Card Trap - Orchard | ||||||||||
| Date | Site ID | Trap 1 (ID) | Trap 1 (Count) | Trap 2 (ID) | Trap 2 (Count) | Trap 3 (ID) | Trap 3 (Count) | Trap 4 (ID) | Trap 4 (Count) | Notes |
| 4/20/2021 | Burroughs young | flies(larger) | 4 | flies(larger) | 9 | flies(larger) | 7 | flies(larger) | 4 | |
| small flies | small flies | small flies | small flies | no specific count | ||||||
| ladybug | 0 | ladybug | 0 | ladybug | 0 | ladybug | 0 | |||
| gnats(sciaridae) | gnats(sciaridae) | gnats(sciaridae) | gnats(sciaridae) | no specific count | ||||||
| thrips | 323 | thrips | 77 | thrips | 124 | thrips | 48 | |||
| aphidius colemani | 15 | aphidius colemani | 8 | aphidius colemani | 0 | aphidius colemani | 3 | parasitic wasp | ||
| aphids | aphids | aphids | 4 | aphids | no specific count | |||||
| encarsia | 12 | encarsia | 3 | encarsia | 6 | encarsia | 7 | small parasitic wasp | ||
| beetles | 2 | beetles | 4 | beetles | 9 | beetles | 0 | |||
| black rove beetle | 0 | black rove beetle | 0 | black rove beetle | 1 | black rove beetle | 0 | |||
| 6-spotted thrip | 0 | 6-spotted thrip | 1 | 6-spotted thrip | 0 | 6-spotted thrip | 0 | |||
| spiders | spiders | spiders | spiders | no specific count | ||||||
| aphytis | 0 | aphytis | 1 | aphytis | 0 | aphytis | 0 | small parasitic wasp | ||
| leafhopper | 2 | leafhopper | 1 | leafhopper | 0 | leafhopper | 0 | |||
| stethorus beetle | 0 | stethorus beetle | 0 | |||||||
| crane fly | 1 | crane fly | 1 | |||||||
| small bee | 1 | ant | ||||||||
| Date | Site ID | Trap 1 (ID) | Trap 1 (Count) | Trap 2 (ID) | Trap 2 (Count) | Trap 3 (ID) | Trap 3 (Count) | Trap 4 (ID) | Trap 4 (Count) | Notes |
| 4/20/2021 | Burroughs Old | flies(larger) | 0 | flies(larger) | 3 | flies(larger) | 5 | flies(larger) | 8 | |
| small flies | small flies | small flies | small flies | no specific count | ||||||
| ladybug | 0 | ladybug | 0 | ladybug | 0 | ladybug | 0 | |||
| gnats(sciaridae) | gnats(sciaridae) | gnats(sciaridae) | gnats(sciaridae) | no specific count | ||||||
| thrips | 182 | thrips | 342 | thrips | 49 | thrips | 126 | |||
| aphidius colemani | 1 | aphidius colemani | aphidius colemani | 8 | aphidius colemani | 0 | parasitic wasp | |||
| aphids | aphids | aphids | aphids | no specific count | ||||||
| encarsia | 82 | encarsia | 32 | encarsia | 62 | encarsia | 41 | small parasitic wasp | ||
| beetles | 4 | beetles | 0 | beetles | 0 | beetles | 5 | |||
| black rove beetle | 3 | black rove beetle | 1 | black rove beetle | 0 | black rove beetle | 2 | |||
| 6-spotted thrip | 2 | 6-spotted thrip | 0 | 6-spotted thrip | 1 | 6-spotted thrip | 3 | |||
| spiders | 1 | spiders | spiders | spiders | no specific count | |||||
| aphytis | 1 | aphytis | 0 | aphytis | 4 | aphytis | 0 | small parasitic wasp | ||
| stethorus beetle | 1 | leafhopper | 1 | leafhopper | 1 | cranefly | 2 | |||
| small bee | 3 | small bee | 3 | small bee | 1 | |||||
| leafhopper | 3 |
| Sticky Card Trap - Orchard | ||||||||||
| Date | Site ID | Trap 1 (ID) | Trap 1 (Count) | Trap 2 (ID) | Trap 2 (Count) | Trap 3 (ID) | Trap 3 (Count) | Trap 4 (ID) | Trap 4 (Count) | Notes |
| 4/20/2021 | Chapman | flies(larger) | 3 | flies(larger) | 2 | flies(larger) | 5 | flies(larger) | 0 | |
| small flies | small flies | small flies | small flies | no specific count | ||||||
| ladybug | 1 | ladybug | 0 | ladybug | 2 | ladybug | 0 | |||
| gnats(sciaridae) | gnats(sciaridae) | gnats(sciaridae) | gnats(sciaridae) | no specific count | ||||||
| thrips | 282 | thrips | 441 | thrips | 329 | thrips | 280 | |||
| aphidius colemani | 7 | aphidius colemani | 11 | aphidius colemani | 15 | aphidius colemani | 13 | parasitic wasp | ||
| aphids | aphids | aphids | aphids | no specific count | ||||||
| encarsia | 2 | encarsia | 22 | encarsia | 14 | encarsia | 15 | small parasitic wasp | ||
| beetles | 1 | beetles | 4 | beetles | 9 | beetles | 0 | |||
| black rove beetle | 2 | black rove beetle | 1 | black rove beetle | 6 | black rove beetle | 3 | |||
| 6-spotted thrip | 0 | 6-spotted thrip | 0 | 6-spotted thrip | 0 | 6-spotted thrip | 0 | |||
| spiders | spiders | spiders | spiders | no specific count | ||||||
| aphytis | 6 | aphytis | 8 | aphytis | 7 | aphytis | 10 | small parasitic wasp | ||
| leafhopper | 5 | leafhopper | 3 | leafhopper | 1 | leafhopper | 3 | |||
| earwig | 3 | earwig | 1 | |||||||
| ant | ||||||||||
Vegetation Diversity Data
| Plot | Species | Native/Nonnative | Annual/Perennial | # of Individuals |
| Burroughs Young Orchard | Juncus bufonius | Native | Annual | 32 |
| Poa annua | Nonnative | Annual | 55 | |
| Chenopodium murale | Nonnative | Annual | 2 | |
| Festuca perennis | Nonnative | Annual/biennial/perennial | 6 | |
| Tribulus terrestris | Nonnative | Annual | 1 | |
| Avena sp. | Nonnative | Annual | 1 | |
| Stelleria media | Nonnative | Annual | 34 | |
| Erodium moschatum | Nonnative | Annual | 5 | |
| Capsella bursa-pastoris | Nonnative | Annual | 17 | |
| Digitaria sanguinalis | Nonnative | Annual | 4 | |
| Polygonum aviculare | Nonnative | Annual/perennial | 4 | |
| Hordeum murinum | Nonnative | Annual | 2 | |
| Amaranthus californicus | Native | Annual | 2 | |
| Spergularia bocconei | Nonnative | Annual | 26 | |
| Cyperus esculentes | Native | Perennial | 2 | |
| Cerastrium glomeratum | Nonnative | Annual | 2 | |
| Cynodon dactylon | Nonnative | Perennial | 39 | |
| Eluesine indica | Nonnative | Annual | 2 | |
| Unknown forb 1 | Annual | 3 | ||
| Rumex sp. | Nonnative | Annual | 1 | |
| Unknown bunchgrass | 2 | |||
| Trifolium repens | Nonnative | Annual | 1 | |
| Plot | Species | Native/Nonnative | Annual/Perennial | # of Individuals |
| Burroughs Old Orchard | Stelleria media | Nonnative | Annual | 47 |
| Erodium moschatum | Nonnative | Annual | 5 | |
| Poa annua | Nonnative | Annual | 235 | |
| Amaranthus californicus | Native | Annual | 2 | |
| Festuca perennis | Nonnative | Annual/biennual/perennial | 12 | |
| Juncus bufonius | Native | Annual | 15 | |
| Malva parviflora | Nonnative | Annual | 1 | |
| Echinochloa crusgalli | Nonnative | Annual | 4 | |
| Convolvulus arvensis | Nonnative | Perennial | 1 | |
| Digitaria sanguinalis | Nonnative | Annual | 3 | |
| Avena spp. | Nonnative | Annual | 2 | |
| Sonchrus oleraceaus | Nonnative | Annual | 1 | |
| Cerastrium glomeratum | Nonnative | Annual | 5 | |
| Cynodon dactylon | Nonnative | Perennial | 1 | |
| Cotula australis | Nonnative | Annual | 1 | |
| Bromus commutatus | Nonnative | Annual | 1 | |
| Rotala indica | Nonnative | Annual | 1 | |
| Plot | Species | Native/Nonnative | Annual/Perennial | # of Individuals |
| Burroughs Rangeland | Erodium moschatum | Nonnative | Annual | 9 |
| Stelleria media | Nonnative | Annual | 16 | |
| Festuca perennis | Nonnative | Annual/biennual/perennial | 6 | |
| Avena spp. | Nonnative | Annual | 8 | |
| Juncus bufonius | Native | Annual | 44 | |
| Amaranthus californicus | Native | Annual | 2 | |
| Festuca bromoides | Nonnative | Annual | 12 | |
| Poa annua | Nonnative | Annual | 1 | |
| Erodium botrys | Nonnative | Annual | 4 | |
| Bromus commutatus | Nonnative | Annual | 10 | |
| Rumex sp. | Nonnative | Annual | 3 | |
| Hordeum murinum | Nonnative | Annual | 1 | |
| Unknown brassicaceae 1 | Annual | 7 | ||
| Croton setiger | Native | Annual | 3 | |
| Galium parisience | Nonnative | Annual | 12 | |
| Dichelostemma sp. | Native | Perennial | 2 | |
| Cerastrium glomeratum | Nonnative | Annual | 1 | |
| Vicia sp. | Nonnative | Annual | 1 | |
| Unknown chenopodiaceae | Annual | 1 | ||
| Hypochaeris glabra | Nonnative | Annual | 1 | |
| Plot | Species | Native/Nonnative | Annual/Perennial | # of Individuals |
| Angle Orchard (Conventional young) | Erodium moschatum | Nonnative | Annual | 12 |
| Medicago polymorpha | Nonnative | Annual | 1 | |
| Juncus bufonius | Native | Annual | 92 | |
| Stelleria media | Nonnative | Annual | 12 | |
| Poa annua | Nonnative | Annual | 1 | |
| Cerastrium glomeratum | Nonnative | Annual | 5 | |
| Melilotus indica | Nonnative | Annual | 1 | |
| Eupohorbia maculata | Nonnative | Annual | 1 | |
| Unknown forb 2 | Annual | 3 | ||
| Erodium cicutarium | Nonnative | Annual | 1 | |
| Plot | Species | Native/Nonnative | Annual/Perennial | # of Individuals |
| Ichord Rangeland | Juncus bufonius | Native | Annual | 392 |
| Erodium botrys | Nonnative | Annual | 30 | |
| Erodium moschatum | Nonnative | Annual | 2 | |
| Festuca bromoides | Nonnative | Annual | 10 | |
| Trifolium repens | Nonnative | Perennial | 12 | |
| Hypochoeris glabra | Nonnative | Annual | 2 | |
| Bromus commutatus | Nonnative | Annual | 11 | |
| Avena sp. | Nonnative | Annual | 3 | |
| Stelleria media | Nonnative | Annual | 1 | |
| Cerastrium glomeratum | Nonnative | Annual | 1 | |
| Leontodon sp. | Nonnative | Annual | 1 | |
| Unknown forb 2 | Annual | 5 | ||
| Dichelostemma sp. | Perennial | 3 | ||
| Plot | Species | Native/Nonnative | Annual/Perennial | # of Individuals |
| Cunningham Rangeland | Erodium botrys | Nonnative | Annual | 5 |
| Erodium moschatum | Nonnative | Annual | 9 | |
| Juncus bufonius | Native | Annual | 61 | |
| Hypochoeris glabra | Nonnative | Annual | 4 | |
| Stelleria media | Nonnative | Annual | 24 | |
| Festuca perrenis | Nonnative | Annual/biennual/perennial | 20 | |
| Poa annua | Nonnative | Annual | 5 | |
| Festuca bromoides | Nonnative | Annual | 14 | |
| Medicago polymorpha | Nonnative | Annual | 14 | |
| Hordium murinum | Nonnative | Annual | 27 | |
| Avena sp. | Nonnative | Annual | 6 | |
| Bromus commutatus | Nonnative | Annual | 3 | |
| Cerastrium glomeratum | Nonnative | Annual | 1 | |
| Diplacus angustatus | Native | Annual | 1 | |
| Capsella bursa-pastoris | Nonnative | Annual | 1 | |
| Trifolium repens | Nonnative | Annual | 4 | |
| Dichelostemma sp. | Perennial | 1 | ||
| Plot | Species | Native/Nonnative | Annual/Perennial | # of Individuals |
| Chapman Orchard (Conventional Old) | Poa annua | Nonnative | Annual | 140 |
| Cotula australis | Nonnative | Annual | 15 | |
| Stelleria media | Nonnative | Annual | 21 | |
| Erodium moschatum | Nonnative | Annual | 17 | |
| Festuca perennis | Nonnative | Annual/biennual/perennial | 2 | |
| Euphorbia maculata | Nonnative | Annual | 6 | |
| Echinochloa crusgalii | Nonnative | Annual | 6 |
SOIL ANALYSIS DATA
Soil Nutrients
| Location (Landuse) | Sampling Location in Orchard | 1:1 Soil pH | WDRF Buffer pH | 1:1 S Salts mmho/cm | Texture No | Organic Matter LOI % | Soil Organic Carbon % | Nitrate-N ppm N | lbs N/A | Olsen P ppm P | Potassium ppm K | Sulfate-S ppm S | Calcium ppm Ca | Magnesium ppm Mg | Sodium ppm Na | CEC/Sum of Cations me/100g | %H Sat | %K Sat | %Ca Sat | %Mg Sat | %Na Sat |
| Angle (Young Orchard) | Between Tree Row | 6.0 | 6.8 | 0.2 | 2.0 | 1.7 | 1.0 | 20 | 36 | 18 | 190 | 9 | 1358 | 323 | 26 | 12 | 18 | 4 | 55 | 22 | 1 |
| Angle (Young Orchard) | Within Tree Row | 6.8 | 7.1 | 0.2 | 2.0 | 1.5 | 0.9 | 6 | 10 | 24 | 185 | 8 | 1229 | 325 | 115 | 10 | 4 | 5 | 60 | 26 | 5 |
| Burroughs (Range) | 6.2 | 6.8 | 0.1 | 2.0 | 2.0 | 1.1 | 12 | 21 | 18 | 176 | 9 | 1079 | 195 | 10 | 10 | 21 | 5 | 57 | 17 | 0 | |
| Cunningham (Range) | 6.3 | 6.9 | 0.2 | 2.0 | 3.4 | 2.0 | 12 | 21 | 20 | 268 | 9 | 3261 | 771 | 31 | 25 | 7 | 3 | 63 | 27 | 1 | |
| Burroughs (Young Orchard) | Between Tree Row | 6.8 | 7.1 | 0.4 | 1.8 | 1.8 | 1.0 | 34 | 62 | 70 | 398 | 28 | 1077 | 158 | 16 | 8 | 2 | 13 | 68 | 16 | 1 |
| Burroughs (Young Orchard) | Within Tree Row | 7.2 | 7.2 | 0.2 | 2.0 | 2.1 | 1.2 | 10 | 18 | 50 | 194 | 50 | 1343 | 145 | 23 | 9 | 0 | 6 | 79 | 14 | 1 |
| Burroughs (Old Orchard) | Between Tree Row | 7.2 | 7.2 | 0.4 | 2.0 | 3.7 | 2.1 | 26 | 47 | 141 | 453 | 69 | 2010 | 254 | 28 | 13 | 0 | 9 | 75 | 15 | 1 |
| Burroughs (Old Orchard) | Within Tree Row | 7.3 | 7.2 | 0.3 | 2.0 | 2.4 | 1.4 | 12 | 21 | 66 | 265 | 38 | 1769 | 264 | 38 | 12 | 0 | 7 | 73 | 19 | 2 |
| Ichord (Range) | 5.7 | 6.8 | 0.1 | 2.0 | 1.8 | 1.0 | 17 | 31 | 9 | 124 | 7 | 873 | 170 | 13 | 8 | 26 | 4 | 52 | 16 | 1 | |
| Chapman (Old Orchard) | Between Tree Row | 6.8 | 7.0 | 0.1 | 2.0 | 2.6 | 1.5 | 2 | 4 | 10 | 147 | 9 | 2215 | 376 | 16 | 15 | 4 | 3 | 73 | 20 | 1 |
| Chapman (Old Orchard) | Within Tree Row | 6.4 | 7.0 | 0.1 | 2.0 | 2.0 | 1.2 | 5 | 9 | 9 | 113 | 9 | 1621 | 439 | 28 | 13 | 7 | 2 | 62 | 28 | 1 |
Soil Respiration
| Location (Landuse) | Sampling Location in Orchard | Mineralizable C (mg C kg-1 24h-1) |
| Angle (Young Orchard) | Between Tree Row | 80 |
| Angle (Young Orchard) | Within Tree Row | 44 |
| Burroughs (Young Orchard) | Between Tree Row | 148 |
| Burroughs (Young Orchard) | Within Tree Row | 88 |
| Burroughs (Old Orchard) | Between Tree Row | 126 |
| Burroughs (Old Orchard) | Within Tree Row | 102 |
| Burroughs (Range) | 60 | |
| Chapman (Old Orchard) | Between Tree Row | 65 |
| Chapman (Old Orchard) | Within Tree Row | 54 |
| Cunningham (Range) | 104 | |
| Ichord (Range) |
62
|
Soil Physical Characteristics
| Location (Landuse) | Sampling Location in Orchard | Bulk Density (g/cm3) | Estimated Water Content (g/g) | Porosity | Estimated Volumetric Water content (g/cm3) | Estimated inches of water/ft soil |
| Burroughs (Young Orchard) | Between Tree Row | 1.73 | 0.02 | 0.35 | 0.03 | 0.39 |
| Burroughs (Young Orchard) | Within Tree Row | 1.53 | 0.06 | 0.42 | 0.10 | 1.15 |
| Burroughs (Old Orchard) | Between Tree Row | 1.68 | 0.04 | 0.37 | 0.07 | 0.87 |
| Burroughs (Old Orchard) | Within Tree Row | 1.54 | 0.09 | 0.42 | 0.14 | 1.70 |
| Burroughs (Range) | 1.75 | 0.02 | 0.34 | 0.03 | 0.33 | |
| Angle (Young Orchard) | Between Tree Row | 1.61 | 0.15 | 0.39 | 0.22 | 2.69 |
| Angle (Young Orchard) | Within Tree Row | 1.62 | 0.13 | 0.39 | 0.22 | 2.59 |
| Cunningham (Range) | 1.53 | 0.19 | 0.42 | 0.29 | 3.48 | |
| Ichord (Range) | 1.68 | 0.01 | 0.37 | 0.02 | 0.27 | |
| Chapman (Old Orchard) | Between Tree Row | 1.68 | 0.19 | 0.37 | 0.33 | 3.91 |
| Chapman (Old Orchard) | Within Tree Row | 1.62 | 0.23 | 0.39 | 0.37 | 4.42 |
Our social science component of this work identified the importance of using an Adaptive Governance approach that emphasizes mobilizing and sharing information among diverse audiences to generate awareness and support among stakeholders for conservation across private and public lands. We used the California Conservation Coalition (CRCC) as our case study for this.
ADAPTIVE GOVERNANCE AND THE CALIFORNIA RANGELAND CONSERVATION COALITION (CRCC)
HISTORY OF CRCC
|
Drivers of change |
Explanation |
|
Changing societal values |
A shift towards negative perceptions about grazing among land managers and environmental groups in the 1980s and 1990s led to policies reducing grazing on public lands (Alvarez 2011)
Similarly, changes in community norms and practices away from production and towards amenity enjoyment, as well as increasing trends in amenity migration, reflected in the decline in the number of landowners involved in crop or livestock production and an increase in landowners who primarily managed for amenities (Ferranto et al. 2014) |
|
Perception of ecological crisis |
Failures in land management practices led to recognition that the reduction in grazing practices led to an increased spread of nonnative vegetation, as well as loss of native plant and wildlife communities (Alvarez 2011; Huntsinger et al. 2014).
Emerging scientific evidence further highlighted the potential role of grazing in enhancing biodiversity conservation (Barry et al. 2007; Alvarez 2011; Huntsinger et al. 2014).
Moreover, concerns over grassland conversion and the adverse impact of regulations on ranching highlighted the need for more effective mechanisms for rangelands management (Alvarez 2011).
Lack of effective landscape scale conservation mechanisms for vulnerable rangeland ecosystems mostly occurring on fragmented private lands (Alvarez 2011; Huntsinger and Bartolome 2014) |
|
Availability of arena for interaction and formulation of a shared vision |
The US Fish and Wildlife Service initiated the process of convening stakeholders at a ranch in the San Francisco Bay Area in 2005. The meeting provided an opportunity for interaction and led to the realization by a diverse stakeholder group, including environmental groups, ranching communities, and government representative at the local, state and federal levels that they share a common aspiration in protecting California’s grasslands as well as the plant and animal communities they support (Barry et al. 2007; Alvarez 2011).
|
|
Emergence of new institutions |
Adoption of the California Rangeland Resolution and the establishment of the California Rangeland Conservation Coalition, with current signatories of more than 100 organizations, based on shared vision and scientific evidence pointing to the importance of landscape history in current management decisions (Barry et al. 2007; Huntsinger and Bartolome 2014).
Related initiatives include: the preparation of a map highlighting grasslands to be protected for wildlife and plant conservation; adoption of a strategic plan highlighting mechanisms for mobilizing resources, providing incentives, sharing information, streamlining permitting processes, and filling research gaps; and establishment of the California Rangeland Trust to facilitate conservation easement processes on private lands (Huntsinger et al. 2014). |
CURRENT STRUCTURE AND FUNCTIONING OF CRCC (Alvarez 2011ab; Barry et al. 2011; Ferranto et al. 2014; Huntsinger and Bartolome 2014; Huntsinger et al. 2014; Huntsinger and Oviedo 2014)
|
Adaptive governance attributes |
Performance of CRCC |
|
|
|
Positive attributes |
Potential challenges |
|
Adaptive and integrated management goals |
Recognition of rangeland habitat as social-ecological systems that are a product of grazing and other past management practices of ranchers
Promotion of rangeland conservation efforts across multiple scales from the ranch and pasture levels to the landscape level
Management of rangelands to achieve a variety of goals, including cattle ranching, environmental conservation, provision of ecosystem services, as well as climate change mitigation |
Threats to ranching, including low profitability, drought, loss of critical ranching infrastructure, as well as loss and fragmentation of rangelands due to land use conversion
Challenges associated with grazing permits, including fear of government restrictions, lack of rancher knowledge on the application process, shortage of available leases, lengthy application procedure, and lack of government and NGO personnel knowledge about grazing
Challenges associated with rancher participation in ecosystem service provision, including lack of incentives, and limited rancher familiarity with ecosystem services and payments for ecosystem services
Challenge of integrating ranching into other uses in a compatible manner on private and public lands, including the difficulty of finding personnel with skills across the diverse land uses |
|
Diverse knowledge systems |
Emphasis of the CRCC on mobilizing and sharing information to generate awareness and support among stakeholders for rangeland conservation across private and public lands
Promotion of social learning through yearly summits, workshops and field trips that facilitate interaction and knowledge exchange among researchers, resource management organizations and private ranchers
Recognition and utilization of traditional and local knowledge gained from the experience of ranchers by promoting peer-to-peer learning among ranchers
Bridging the science-policy gap by bringing ranchers in direct contact with researchers and resource managers |
Lack of knowledge about the impacts of grazing
Lack of knowledge on the valuation of ecosystem services, as well as high transaction costs associated with the quantification and verification process
Potential room for more investment in social science research and mechanisms for integrating local/traditional knowledge in understanding the behavioral and institutional aspects of ranching and rangelands management |
|
Polycentric institutional structure |
Promotion of vertical and horizontal interactions among diverse actors (government, private sector, and non-governmental organizations) across federal, state, and local levels to facilitate the implementation of rangeland management practices that also conserve the environment
Emphasis on building local capacity for rangeland management through the provision of various forms of support, including education, funding, permit assistance, opportunities for deliberation, and facilitation of ranchers’ participation in conservation easement programs
Safeguarding the autonomy and flexibility of ranchers and landowners to make management decisions at the local level in an adaptive fashion in response to the availability of new information
Innovative use of incentives and other non-regulatory mechanisms, such as Payment for Ecosystem Services and the role of the California Rangeland Trust, to ensure voluntary compliance of ranchers and other stakeholders with provisions of the California Rangeland Resolution
|
Existence of complex and potentially conflicting regulatory mechanisms among the diverse actors involved in rangelands management across land ownership types |
|
Analytic deliberation process |
Emphasis on the facilitation of dialogue and collaboration as mechanisms for reaching common ground among stakeholders
Involvement of the general public through workshops and summits with the aim of raising awareness about the ecological benefits of rangelands |
Potential room for investment in conflict management mechanisms as part of the functioning of the CRCC |
Preliminary results from the hydrology section of our work is uploaded in the media library.
Education and Outreach
Participation summary:
Mashiri F.E (2022) Quantifying the Effects of Rangeland Conversion on Ecosystem Function: Soil Organic Matter, Plant Diversity, and Insect Diversity. Society for Range Management Conference February 21-25, 2022.
Mashiri F.E (2022) Measuring Ecosystem Function Across Farming Systems: Soil Organic Matter, Plant Diversity, and Insect Diversity. Regenerative Almond Field Day Feb 17, 2022, Regenerative ag field day
Theresa Becchetti and I were interviewed by the Public Policy Institute of California, discussing the associated land-use changes, impacts, and future management strategies. Some of our answers were informed by preliminary results from this ongoing research project- https://www.ppic.org/blog/could-rangeland-return-to-the-central-valley/ - This one is difficult to measure the number of people reached by blog - my LinkedIn post of the blog has 820 impressions.
Mashiri FE. (2023)Rangeland Conversion Drivers and Impacts of Post-Conversion Management Strategies on Landscape Level Ecosystem Health. Society for Rangeland Management February 13-16, 2022
Mashiri F.E (2023) Comparing Ecosystem Function Across Rangelands, Regenerative and Conventional Almonds Orchards: A Landscape Level Evaluation: Regenerative Almond Field Day Feb 22, 2023
Mashiri F. E (2023) Effects of Rangeland Conversion to Regenerative and Conventional Almonds Orchards on Ecosystems Function UC ANR Statewide Conference April 24-26, 2023
The two presentations at the 2022 and 2023 Regenerative Agriculture Field day had the most engagement of both producers and researchers with over 300 attendees each year. Presentations at SRM conferences also engaged researchers and producers, about 30 attendees in 2022 and over 60 in 2023 in person. The SRM presentations are also made available online which would have increased the number of people who got access to the information.
The work has highlighted the importance of multidisciplinary research across different production systems and commodities, to develop best management practices that improve climate resilience, biodiversity and economic returns at landscape level. This work fostered collaboration rather than competition among producers and researchers of different commodities.
Education and Outreach Outcomes
With increasing acres of crop fields going fallow in California due to water shortages and the SGMA law - follow up research on best land rehabilitation practices, weed control etc
- Benefits of rangeland for biodiversity
- Differences between conventional and regenerative agriculture and it's benefits
- Factors driving convesion of rangeland
- Benefits of landscape level management for ecosystem funtion, climate relience and economic benefits
Regenerative agriculture benefits
Benefits if crop-livestock integration