Final report for SW19-909
Project Information
Concerns about water scarcity are mounting due to rapid urban growth, depleting groundwater supplies, and drought resulting from less and more variable snowpack in the western United States. These concerns are apparent in several areas of Idaho and Utah where water shortages are already common. We propose collaborations with several stakeholders to answer these three critical research questions: (1) Which combinations of irrigation and crop management practices result in the optimal use of limited water supplies for the best yield and profit outcomes for producers? (2) Which water conservation practices are and could be used by producers? and (3) How can their barriers to adoption be overcome?
To address these research questions, we propose expanding ongoing work to: i) conduct on-farm and research station experiments to identify how individual and ‘stacked’ water conservation practices (irrigation, crop genetics, and crop management) optimize water use and increase crop profit at three sites in Utah (Logan, Cedar City, and Vernal) and three in Idaho (Pocatello, Rexburg, and Twin Falls); and ii) conduct statewide and local surveys of major irrigators in Idaho and Utah to quantify adoption rates of water conservation practices, barriers to adoption, and impacts of the proposed work. This work will be focused on pivot irrigation which comprises most of the sprinkler irrigation in Utah and Idaho. Dynamic outreach components will include interactive field days at the six research sites, presentations and publications through Idaho and Utah Extension and professional associations, and new curriculum and training for students at six Universities.
The anticipated project outcomes in the Western Region include:
1. Over 300 stakeholders will engage in discussions and demonstrations of water conservation research at six field days;
2. Over 1,000 stakeholders will be educated on practices to optimize their water use during various Extension and professional presentations;
3. Producers, agricultural professionals, and others will have access to timely information about practices that optimize water use through at least 3 Extension publications and 3 journal articles;
4. Over 2,000 producers will have the opportunity to share their experience with water conservation through surveys; and
5. Students from six universities will have access to new water conservation curriculum and hands-on training.
Producing and disseminating results on the suites of practices that economically and feasibly optimize water should lead to greater acceptance and use of these practices. Preliminary studies by investigators have shown that some combinations reduce irrigation and energy use without impacting yield. Annual diversion of water could be reduced by 100,000’s of acre-feet if advanced practices were implemented by just half of the irrigators in Idaho and Utah. These outcomes would also assist producers and other stakeholders involved in proposing, creating, and administering cost-share or water bank programs to help conserve water. Furthermore, we expect these trials will provide the foundation for years of valuable information concerning ideal short- and long-term water conservation practices, and should spur further funding and support from the state and federal agencies where water conservation and optimization is a high priority.
- Identify combinations of six (irrigation system, rate, and schedule coupled with crop type, crop genetics, and tillage) water conservation practices with the greatest ability to optimize water and energy use. Years 1-3.
- Expand variable-rate irrigation research to provide dynamic irrigation prescriptions based on soils and yield to improve water and energy use efficiencies. Years 1-3.
- Determine producer’s attitudes, acceptance rates, and barriers to adoption of water conservation practices in order to better adapt and target Extension and outreach efforts. Year 2.
- Deliver dynamic educational products and training on water and energy optimization through Extension and coordinated outreach to increase awareness and adoption of proven water optimization practices. Year 2 and Year 3.
|
Obj. |
Site |
Task Name |
2019 |
2020 |
2021 |
2022 |
|||||||||
|
J-S |
O-D |
J-M |
A-J |
J-S |
O-D |
J-M |
A-J |
J-S |
O-D |
J-M |
A-J |
||||
|
1 |
CC |
Install soil sensor network and weather station |
MY NA EC BHU |
|
|
|
|
|
|
|
|
|
|
|
|
|
1 |
CC |
Monitor soil moisture and energy use |
|
MY NA EC BHU |
|
|
MY NA EC BHU |
MY NA EC BHU |
|
|
MY NA EC BHU |
MY NA EC BHU |
|
|
|
|
1 |
L |
Establish irrigation and crop treatments |
|
MY NA EC |
MY NA EC |
|
|
|
|
|
|
|
|
|
|
|
1 |
L |
Install soil sensor network and weather station |
|
|
MY NA EC |
|
|
|
|
|
|
|
|
|
|
|
1 |
L |
Monitor soil moisture and energy use |
|
|
|
|
MY NA EC |
MY NA EC |
|
|
MY NA EC |
MY NA EC |
|
|
|
|
1 |
V |
Establish irrigation and crop treatments |
|
|
|
|
|
MY NA EC SH |
MY NA EC SH |
|
|
|
|
|
|
|
1 |
V |
Install soil sensor network and weather station |
|
|
|
|
|
|
MY NA EC SH |
|
|
|
|
|
|
|
1 |
V |
Monitor soil moisture and energy use |
|
|
|
|
|
|
|
|
MY NA EC SH |
MY NA EC SH |
|
|
|
|
2 |
REX |
Collect and process background soil and crop information |
NH RS |
|
|
|
|
|
|
|
|
|
|
|
|
|
2 |
TF |
Collect and process background soil and crop information |
NH HN |
|
|
|
|
|
|
|
|
|
|
|
|
|
2 |
REX TF |
Install soil sensor network |
NH HN RS MY |
|
|
|
|
|
|
|
|
|
|
|
|
|
2 |
REX TF G |
Develop VRI prescriptions |
|
NH BH MH RC |
|
|
|
|
|
|
|
|
|
|
|
|
2 |
REX TF G |
Implement VRI prescription treatments |
|
|
|
NH BH MH RC |
NH BH MH RC |
|
|
NH BH MH RC |
NH BH MH RC |
|
|
NH BH MH RC |
|
|
2 |
REX TF G |
Monitor crop growth and yield |
|
|
|
|
NH BH MH RC |
NH BH MH RC |
|
|
NH BH MH RC |
NH BH MH RC |
|
|
|
|
3 |
- |
Develop questionnaire |
|
|
|
|
|
|
|
All |
|
|
|
|
|
|
3 |
- |
Test questionnaire with producers |
|
|
|
|
|
|
|
|
RC BHU SH JW |
|
|
|
|
|
3 |
- |
Administer survey and analyze results |
|
|
|
|
|
|
|
|
MY NH |
MY NH |
|
|
|
|
4 |
All |
Host Extension field days |
HN MY NH RC |
|
MY BH NA EC |
|
HN MY NH RS |
|
|
MY NA EC |
HN MY NH |
|
|
MY NA EC |
|
|
4 |
- |
Present results at Extension and professional meetings |
|
|
MY HN |
|
|
MY NH |
MY HN |
|
|
MY NH |
MY HN |
|
|
|
4 |
- |
Prepare and publish articles and manuscripts |
|
|
|
|
All |
|
|
|
All |
All |
All |
All |
|
|
4 |
- |
Develop curriculum and summer training course for students at 6 Universities. |
|
|
|
|
RS NH HN BH NA |
RS NH HN BH NA |
RS NH HN BH NA |
|
|
|
|
|
|
|
4 |
All |
Conduct training course |
|
|
|
|
|
|
|
All |
|
|
|
|
|
|
Team members |
|
|
|
|
|
|
|
|
|
|
|
|
|||
|
MY = Matt Yost, HN = Howard Neibling, EC = Earl Creech, NA = Niel Allen, NH = Neil Hansen, MH = Matt Heaton, BH = Bryan Hopkins, RS = Ross Spackman, RC = Ryan Christenson, BHU = Brent Hunter, ST = Steve Hanberg, JW = Jason Westover |
|||||||||||||||
|
Sites |
|
|
|
|
|
|
|
|
|
|
|
|
|
|
|
|
CC = Cedar City, L = Logan, V = Vernal, REX = Rexburg, TF = Twin Falls, GRA = Grace |
|||||||||||||||
Cooperators
- - Producer
- - Producer
- - Producer
- (Educator)
- - Producer
- - Producer
Research
- Suites of six (irrigation system, rate, and schedule coupled with crop type, crop genetics, and tillage) water conservation practices will increase the ability to optimize water and energy use in forage and grain cropping systems in the Intermountain West.
- Variable-rate irrigation based on in-field dynamic irrigation prescriptions will improve water and energy use efficiencies.
- Quantifying producer’s attitudes, acceptance rates, and barriers to adoption of water conservation practices will assist in more adaptable and targeted Extension and outreach efforts.
Objective 1: Identify combinations of six water conservation practices with the greatest ability to optimize water and energy use.
In the early spring of 2019, the first of three water optimization trials were established at the Utah State University (USU) Wellsville Farm. The second trial was established at the USU Vernal farm in 2020 and the third was established in Cedar City in 2021. Establishment first included installing a lateral irrigation system to irrigate the ~15 acre test/demonstration area at each site.
Sixteen different irrigation strategies were tested and demonstrated in 2019-2021 at all established sites. This included all combinations of:
- four irrigation systems [mid-elevation (MESA), two low-elevation sprinklers (LEPA and LESA), and mobile drip irrigation (MDI) or low-elevation nelson advantage (LENA)]
- four irrigation rates (100%, 75%, 50% of ET, and 50% with partial-season irrigation)
In addition to these irrigation strategies, we also examined different crop management practices with potential to improve water use efficiency, including drought tolerant genetics, no-tillage, alternative crops, and cover crops. Corn and alfalfa were grown at each site each year. The alternative crops varied by site and year and were safflower, hemp, and teff. A total of 300-400 plots were established to test these at each site.
Crop yield, profit, and irrigation productivity have been determined for each treatment. Crop water balances are also being determined in order to evaluate and demonstrate consumptive water use. We installed a total of 120-300 soil moisture sensors in all four irrigation systems at the 100% and the 50% irrigation rates at each site. We also installed sensors to test differences between “conventional corn practices” vs. “most advanced management” that included no-till, drought-tolerant genetics, and cover crops.
Objective 2: Expand variable-rate irrigation research to provide dynamic irrigation prescriptions based on soils and yield to improve water and energy use efficiencies.
The pilot VRI study that was initiated on an Idaho field in 2016 showed a 25% irrigation water savings, reduced variation but similar total yield compared to those expected under uniform irrigation.
To expand the existing pilot study, three VRI research and demonstration sites were established across Southern Idaho (Twin Falls, Pocatello, and Rexburg) in 2019-2021. The Pocatello, ID location expanded on the pilot study and will be led by our producer representative, who utilizes a VRI system on a field in a potato-wheat rotation.
Here are reports for each of the three sites:
Rexburg: In 2019, a wheat field in Rexburg Idaho was chosen for VRI research. Soil samples were collected on April 29th just after planting, May 30th, June 25th, and August 29th, just after harvest. Sample locations were 66 points based two superimposed grids to have samples that were spaced at a range of sampling intervals (Figure 1). Field-moist soil samples were collected using augers driven into the soil with a jack hammer and stored in plastic bags. Samples were weighed, dried at 105o for 24 hours and re-weighed. From these wet and dry weights volumetric water content (VWC) values were determined. These were interpolated (kriged) to a 5m grid then values for the four measurement times were averaged.
A k-means clustering algorithm was used in SPSS to group the average VWC data into 2-7 zones. The largest break of slope in the mean squared errors was for 3 zones so 3 zones was assumed to be optimal. The 3-zone VWC map was used to compare with 3-zone maps produced using other ancillary variables that could be inexpensive and effective for delineating management zones.
Ancillary variables included yield data from a yield monitor, normalized difference vegetation index (NDVI) from LandSat 8 imagery (June and July 2014-2019), elevation (collected from the GPS on the yield monitor) and derived topographic attributes such as slope, aspect and topographic wetness index (TWI). These datasets were kriged to the same 15 ft grid that as the VWC data and were used individually and in different combinations to create more 3-zone maps using k-means clustering. The percentage agreement between the different 3-zone maps was determined.
In 2020, the field was again managed with uniform irrigation and soil moisture was measured on the same spatially dense grid on four dates. A full set of soil moisture sensors were installed in each zone. The set of sensors included water content sensors (Teros 12, Meter Group Inc) at 6, 18, and 30 inch depths) and water potential sensors (Teros 21, Meter Group Inc.) at 6 and 18 in depths.
Remote sensing objectives were accomplished using a DJI Phantom 4 outfitted with a Sentera single NIR sensor and RGB camera. The Phantom 4 Pro Camera has a 1 inch CMOS with 60 ft effective pixels. A 3 axis gimbal integrated with the inertial navigation system stabilized the camera during flight. The UAV followed automated flight paths created with DroneDeploy (DroneDeploy, 2020) that imaged the entirety of each field at 290 ft above ground level (AGL) and 308 ft above ground level (AGL) with at least 80% image side and end overlap in the flight paths. Images for Rexburg were collected May 30, 2019 and June 25, 2019 during optimum UAV operating times (11:00 am-2:00 pm). The data were processed in Web OpenDroneMap (ODM, 2020). All the individual photos of each field were imported into WebODM and Reviewed. WebODM then automated the stitching together of the separate images into a multiple orthomosaics of the imaged fields. These were exported as a GeoTIFF to be processed in ArcGIS Pro. The RGB images were acquired with a ground resolution of 0.02 ft at 290 ft height and were saved with GPS location information in GeoTIFF format.
In both years, wheat grain yield was measured using an Ag Leader Versa (Ames, IA, USA) with a TerraStar-C Pro GPS with a relative accuracy of +/- 5 cm. The yield monitor was calibrated using a mass flow sensor collecting yield data at a 32 ft2 spatial density. Erroneous data points were defined as outside the limits of ± 75% of the median. In addition, points where the combine did not harvest the full header width were removed.
Twin Falls: The VRI project is located under a single-span VRI pivot at the University of Idaho Kimberly Research and Extension Center. The field site is on a hillside of eroded soil. The upslope half of the pivot is approximately 3% slope of eroded Portneuf silt loam soil. Low infiltration rates and excessive surface runoff due to surface seal formation are serious issues. The lower half of the pivot is approximately 1% slope Portneuf silt loam with relatively deep topsoil resulting from deposition of topsoil eroded upslope. This portion of the field has less tendency for surface seal formation and runoff issues. Crop productivity is also higher than for the more sloping portion of the pivot.
In 2019, plots were arranged so that equal numbers of plots of each crop were located in each quadrant of the pivot. In 2019, all plots received the same irrigation and fertility applications. Crop yield varied considerably, based on location on the hillside for each of the 3 crops. Part of the difference appears to be due to overall fertility / soil tilth conditions and part due to differences in water available for crop growth due to infiltration / runoff differences with slope position. End-of-season soil water content was measured for each of the 48 plots at 6-inch depth increments to 5 feet. Plots on the top (more sloping and eroded) half of the field had a noticeably lower post-harvest water content, more visual indications of crop water stress during the growing season, and lower crop yields relative to the lower slope, non-eroded portion of the field. Data from 2019 were used to develop VRI prescriptions for testing during the 2020 growing season for spring wheat. VRI was applied during the 2020 growing season. Soil moisture data, crop yield, and associated data were collected.
Grace: The field site is near Grace, Idaho and winter wheat (Triticum aestivum L.) was growing in 2019. The field was equipped with a variable rate irrigation (VRI) system. The sampling scheme at Grace included 100 soil sample locations (Figure 1) with soil collected to compute volumetric water content (VWC) on April 23, May 30, June 25, and September 5 of 2019. Beginning sampling was at spring green-up, and the final sampling was shortly after harvest. In this study, the data from May 30th were focused on. Five irrigation zones were created and managed from soil sensors with sensor location installed in each zone. Soil sensors collected VWC and irrigation was applied to reach field capacity. A large portion of the west side of the field had ponding due to snow melt early in the season so wheat was replanted in spring, causing a late growth in this area compared to the rest of the field. In 2020 the field was managed using VRI based on measured soil water content in each zone, but no soil sampling was performed in 2020. The yield monitor and GPS in the combine collected spatially referenced yield data. SpaceStat and ArcPro were used for all spatial and statistical analysis. Remote sensing was done as describe for the Rexburg location, with flights May 31, 2019, June 26, 2019 and July 8, 2020, during optimum UAV operating times (11:00 am-2:00 pm).
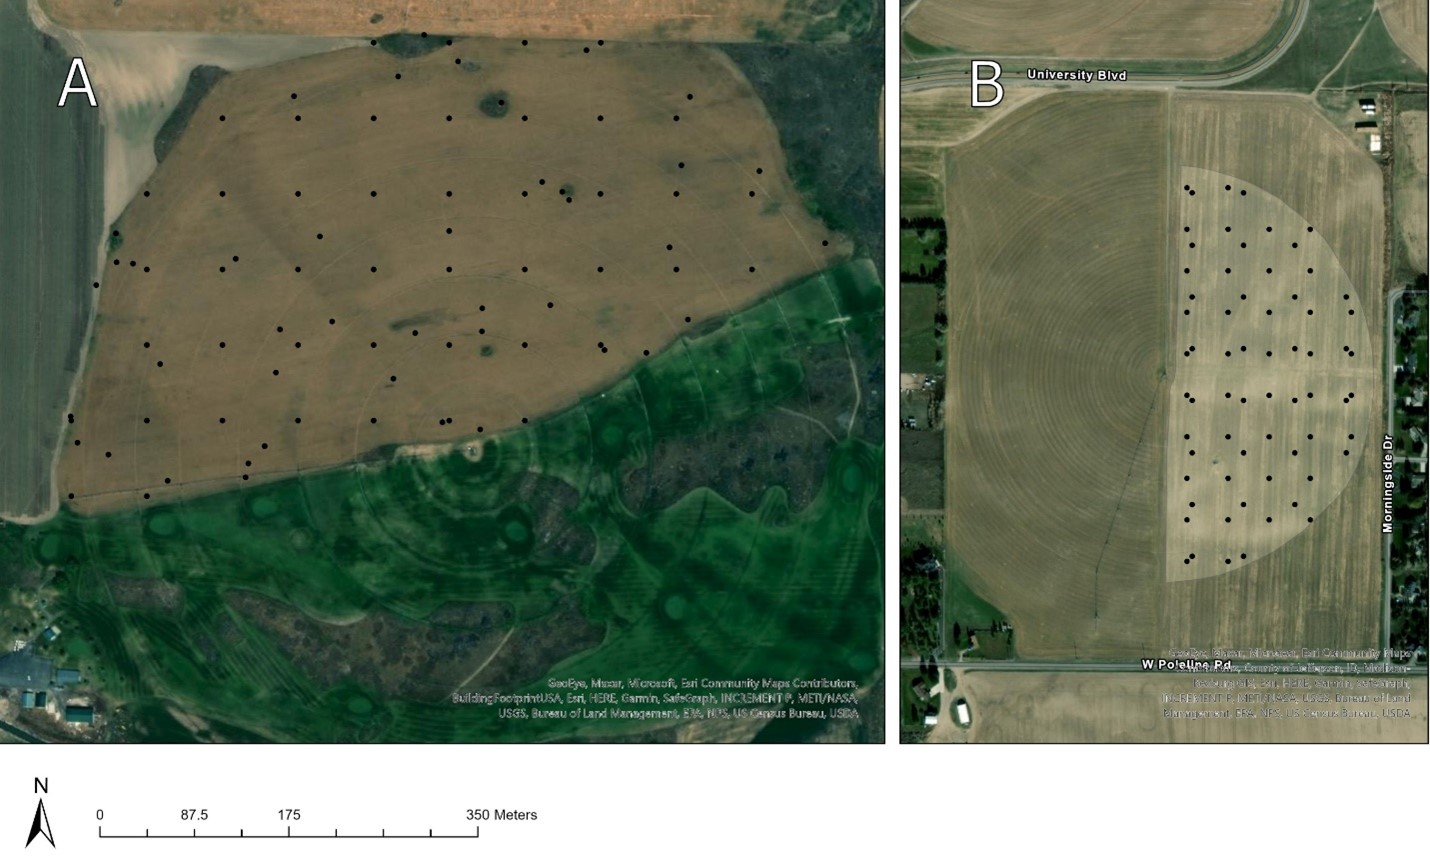
Figure 1. Map of research site near Grace, ID, USA (A), and research site in Rexburg, ID, USA (B) with VWC sample locations.
Objective 3: Determine producer’s attitudes, acceptance rates, and barriers to adoption of water conservation practices in order to better adapt and target Extension and outreach efforts.
Three nearly identical online 8-page surveys were developed in 2019 for corn, potatoes, and small grains. The questions were developed to ask Idaho and Utah growers how they manage irrigation and nitrogen needs. Questions were formulated to ask in an order of finding out the scope of the production, planting populations, fertilization plans, and irrigations plans. For the N fertilizer section, growers are asked questions relating to the time of year of application, rate of application, application practices, and application source. The irrigation questions are similar in nature, asking about irrigation type, scheduling, amounts, and frequencies. For both areas, growers are questioned about advanced practices such as variable rate applications. The last few questions of each crop survey for both nitrogen fertilizer and irrigation question growers on how they would handle a price increase of each of the inputs. This will allow us to assess both irrigation and nitrogen 4R adoptions and barriers. The survey was emailed to about 7,000 growers in Utah and Idaho during the early part of 2020. Preliminary results were presented in several local, regional, and national meetings. We are currently conducting the final analyses in preparation for publication. A complete summary was included in a thesis chapter and are now being compiled for a research article submission in March 2023.
Objective 1:
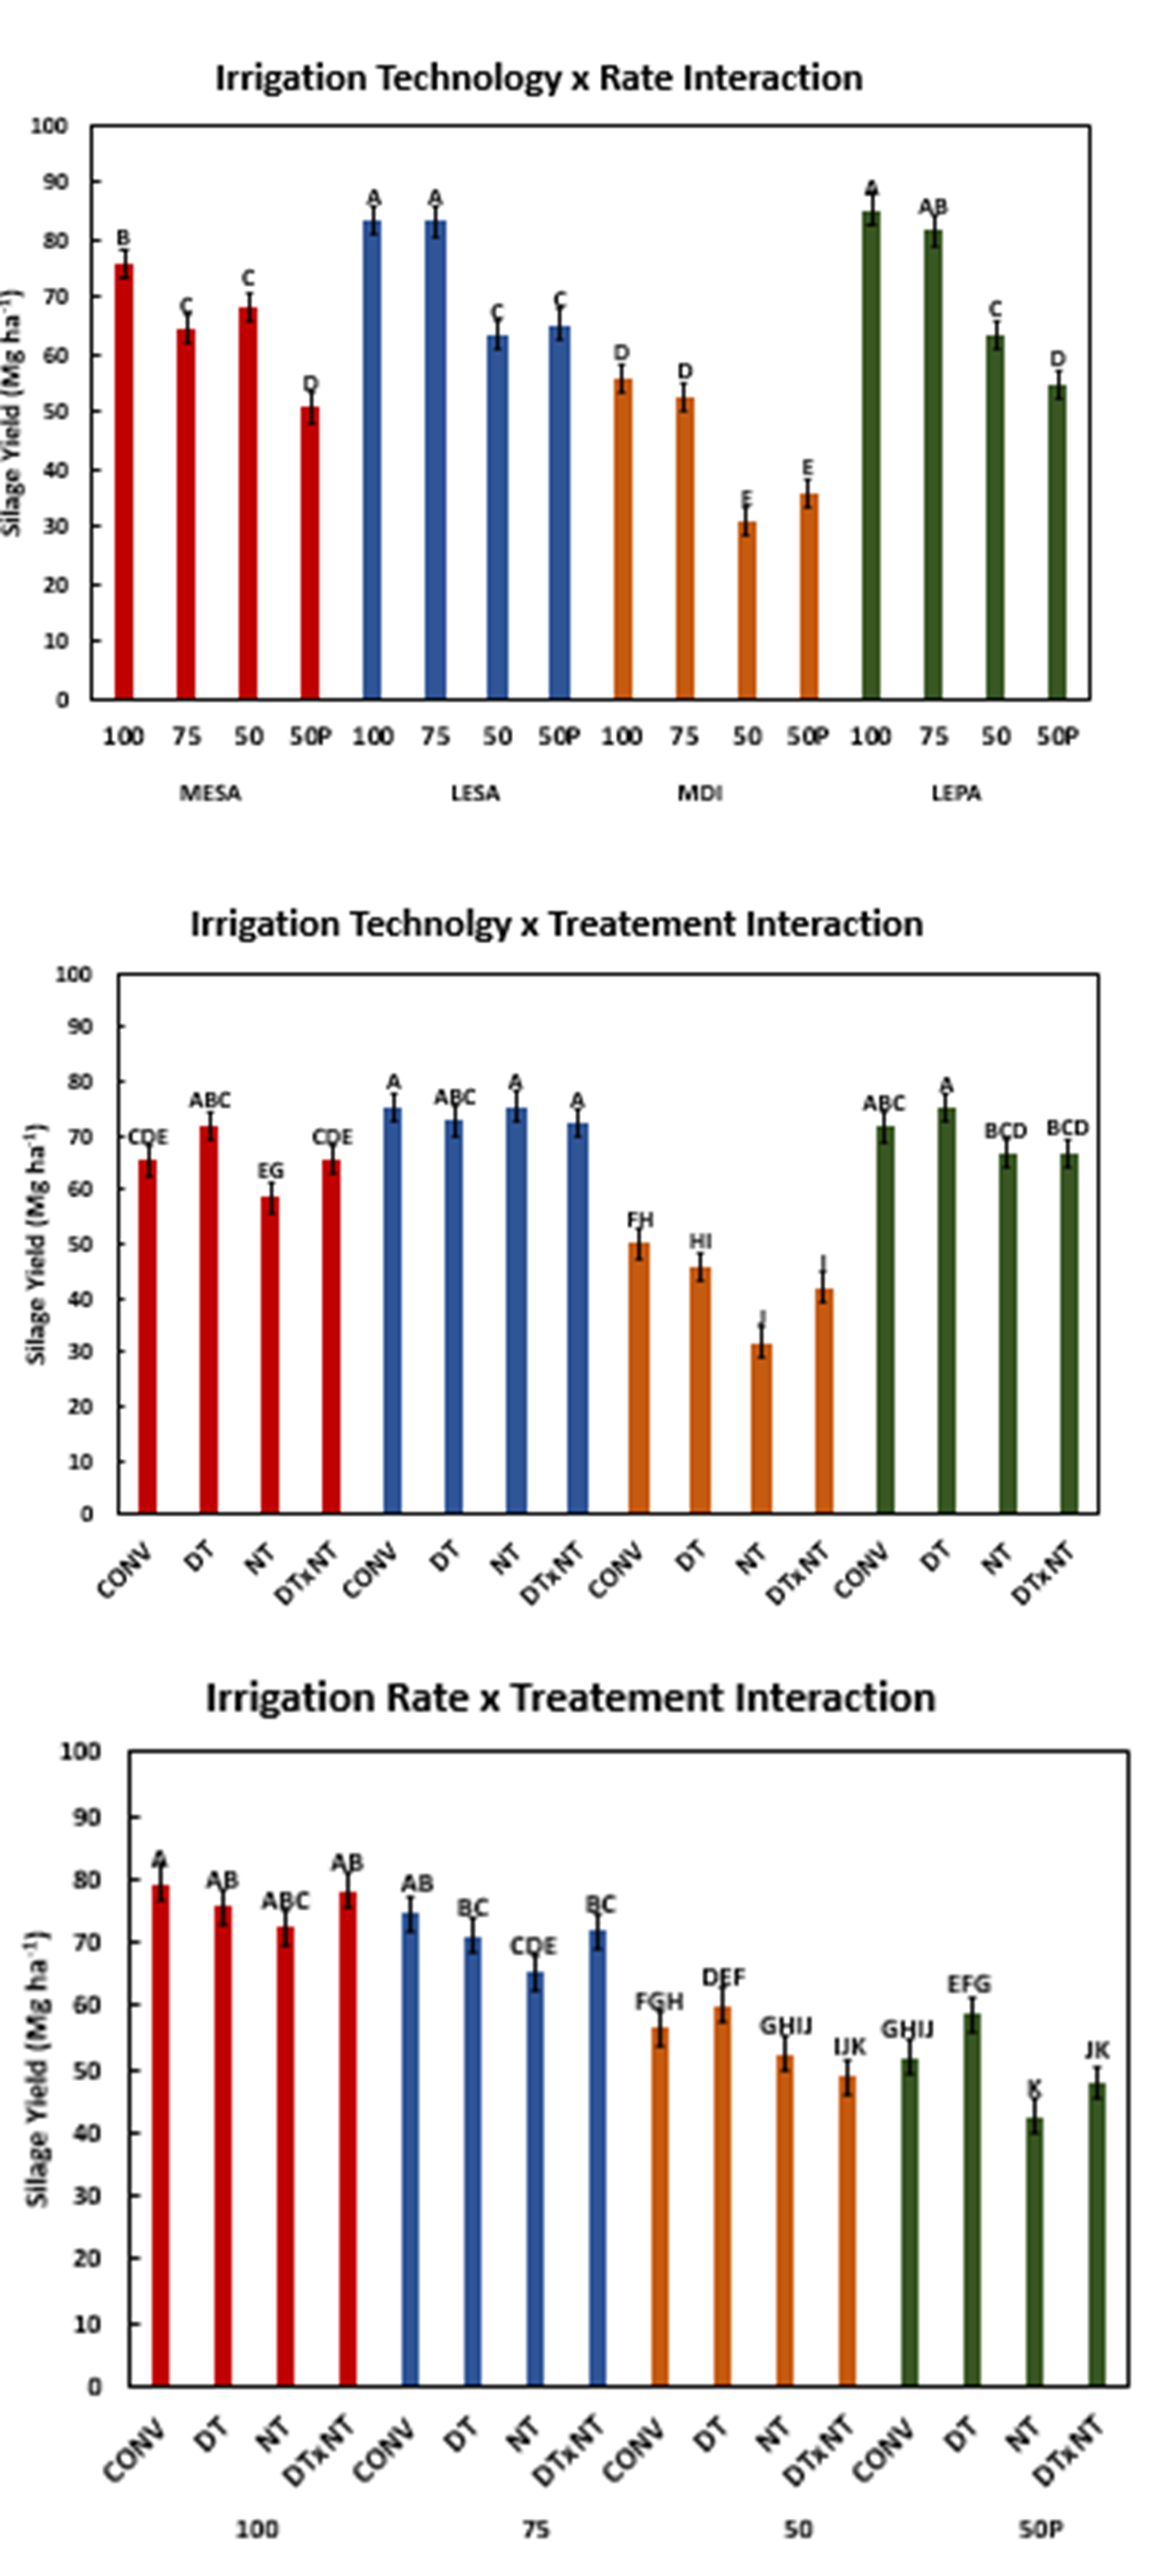
Irrigation technologies, irrigation rates, and drought-tolerant genetics had only minor impacts on yield in 2019 at the Logan site (Data not shown) due to an abnormally wet spring. In contrast, most factors influenced silage corn yield in 2020 in Logan, and at the new established site in Vernal. The interaction of irrigation technology and irrigation rate was significant at both sites, with results suggesting that the higher efficiency sprinklers (LEPA, and LESA) can result in higher yields when irrigation rates are reduced. Treatment type was heavily influenced by the irrigation technology as well at both sites. The addition of the soil wetting agent did not improve yield at reduced rates and thus would not be warranted. At reduced irrigation rates, drought-tolerant genetics rarely improved yield. No-till only sometimes decreased yield and reductions were more pronounced when water stress was greater. Targeted 50% irrigation rate reductions to critical crop growth stages was often worse and never better than a straight 50% reduction in rate all season. The corn study will be repeated at the Vernal site with the additional factor of cover crops, and the third site at Cedar City, Utah will have a corn study with the similar factors. In conjunction with corn at the sites, alfalfa, small grains, and alternative crops will be examined at the three sites. This study aims to determine the long-term effect on crops when shorting irrigation consistently.
Vernal Corn 2020 Results. Bars with the same letter had the statistically equivalent yield. NT = no-till, DT = drought tolerant genetics, and CONV = conventional (tillage and no DT).
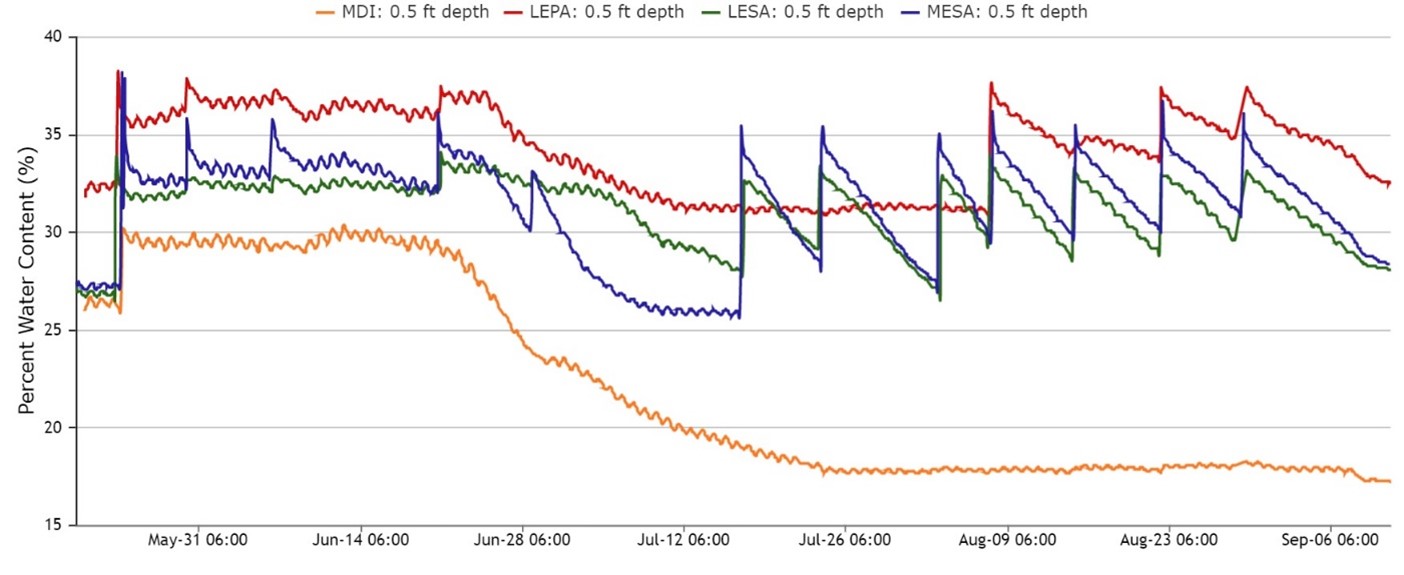
Corn soil moisture results for plots with tillage and with full irrigation (100% rate). This is only for the top 1 foot of soil (sensor placed at 6-inch depth). The second and third foot were also measured, but this was shown for simplicity. In tilled plots, the mobile drip irrigation (MDI) had much lower soil moisture all season long. LEPA had the greatest soil moisture for much of the growing season. This indicates that LEPA’s application efficiency may have been greater than other systems.
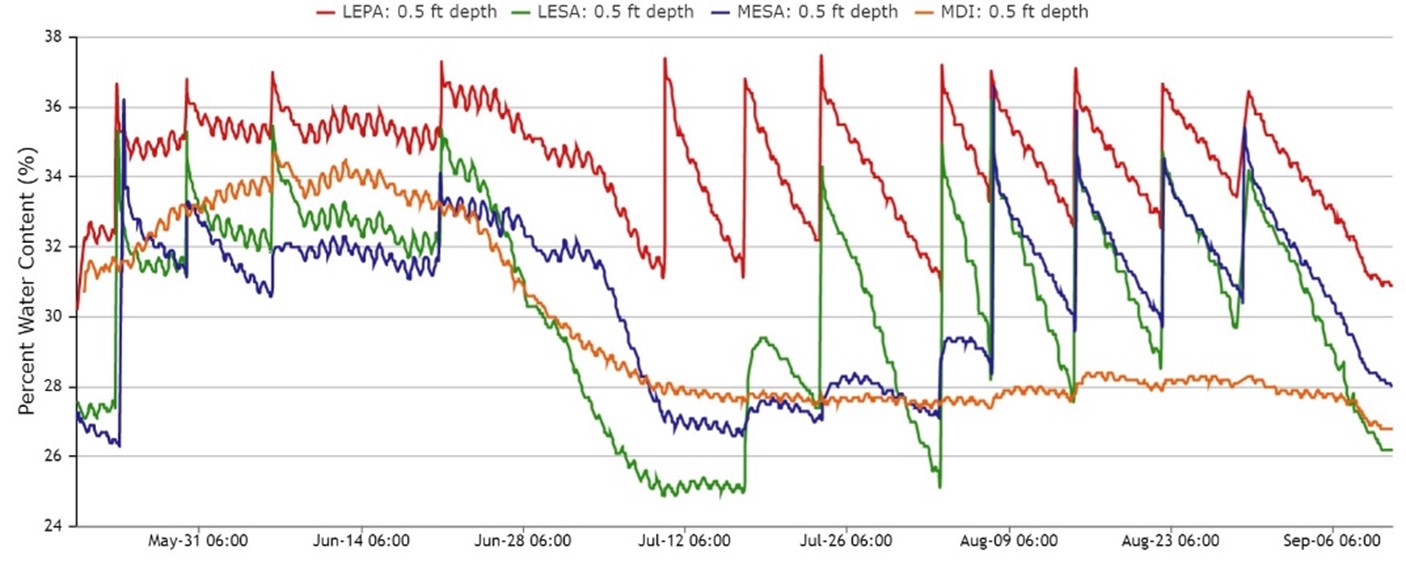
Corn soil moisture results for plots with no-till and drought tolerant corn genetics with full irrigation (100% rate). This is only for the top 1 ft of soil. In no-till plots, LEPA again had the greatest soil moisture for most of the growing season and MDI generally had the least.
A three-way mix of small grains was planted in April and harvested in July at the Vernal site in 2020. The mix included wheat, barley, and oat. It was planted on April 23 at 100 lbs/acre and harvested in mid-July. Small grain forage yield in 2020 range from 1.5 to over 3.5 tons per acre. The LESA system at full irrigation produced the greatest yield, while the MDI produced the least. All systems except LESA were able to maintain yield with 25% less water. MESA was the only system where the 50% reduction also maintained yield compared to full irrigation. This indicates that small grain forage has a great ability to withstand water stress, and that traditional MESA systems may have some of the greatest potential.
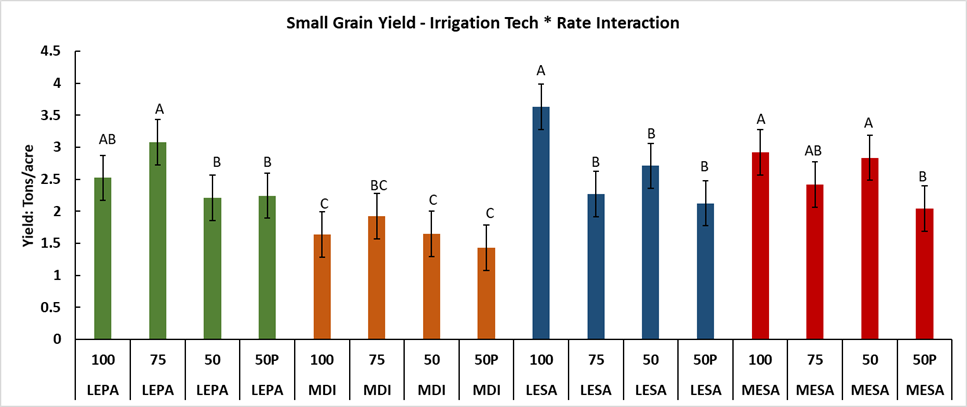
Small grain forage quality was only impacted by irrigation rates. Forage quality increased as water stress increased. This is likely because less growth in water-stressed areas can reduce plant stem, which can improve forage quality. Quality and yield data will be combined to examine the economics of these treatments. Soil moisture data in the top 1 foot of soil showed that LEPA had the greatest moisture in the first half of the season, but had the least during the second half. The other three systems had very similar trends throughout the season.
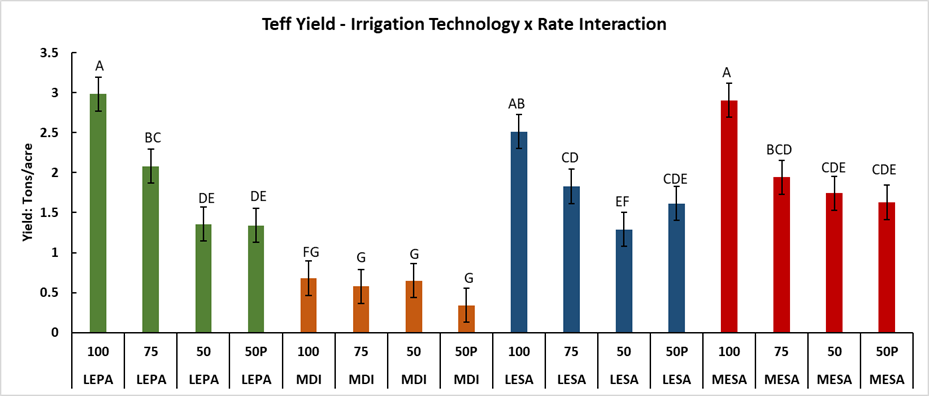
Teff was the alternative crop in Vernal. Two teff grass trials were established. The first examined how the 16 irrigation treatments impacted yield and quality. At full irrigation, all irrigation systems besides MDI (poor yield in all treatments) performed equally well. None of the three advanced irrigation systems could maintain yield with 25% less irrigation. However, for MESA and LESA, the 50% reduction yielded the same as the 25% reduction in irrigation rate.
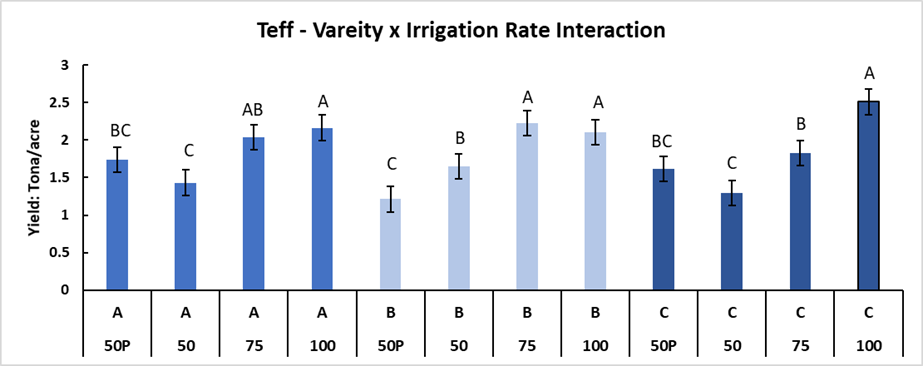
The second project was to examine how three different teff varieties handled water stress. Results showed that there was a different. Variety “A” and “B” could maintain yield with 25% less water, but variety “C” could not.
Teff forage quality was also measured in LESA irrigation systems only. Variety only impacted two quality parameters – digestible fiber and a forage quality metric called RFV (relative feed value). The partial irrigation treatment that had 50% irrigation with targeted applications had the best overall forage quality of the three varieties. Soil moisture was measured in one teff variety in two irrigation rates of each of the four irrigation systems. LESA had the lowest soil moisture for much of the growing season. This is likely because it had the best yield and the teff was likely using the most water. Likewise, MDI had the greatest moisture because teff growth was poor in these plots.
The studies were repeated at Logan and Vernal in 2021, and the third site in Cedar City was established. This resulted in a total of six site-years of data (3 from Logan, 2 from Vernal, and 1 from Cedar City). The results from all six site-years showed that drought-tolerant genetics for corn and alfalfa rarely impacted crop yield or forage quality. Likewise, we saw few to no interactions of crop genetics and irrigation rate. This indicated that drought tolerant genetics were not providing enhance resilience to water stress and may not be an effective option for optimizing water use.
Results from the four irrigation systems over the six site-years showed that irrigation system performance varied by site and by year at sites with multiple years (Logan and Vernal). The LESA, LEPA, and LENA systems were often (50-100% of cases for alfalfa and corn) able to maintain or increase alfalfa and corn yield with less water. However, the MESA systems sometimes also had equivalent yield with 25% less water than the full irrigation rate. The MDI system rarely could maintain yield with full or reduced irrigation rates and is likely not a viable option unless filtration issued can be adequately addressed. These results indicated that low-elevation systems can be an effective tool for reducing water diversions, but that their benefits are highly site-specific and in some cases crop-specific. We are in the process of calculating and estimating evapotranspiration from soil moisture sensors to compare water consumption differences among all treatments. This will be completed in the summer of 2023.
Early data on no-tillage and cover crops across all site-years indicates that they often reduced or maintained corn silage yield but were not able to increase yield, especially with water stress treatments. This data is preliminary as these treatments had only been implemented for 1-3 years. The second phase of this long-term study will provide robust data on how cover crops and no-till individually and combined will impact water use and silage corn yields over time.
Objective 2:
An objective at the VRI field sites was to characterize the spatial variability of soil moisture and compare it to variability of several ancillary variables. Under uniform irrigation management in both Rexburg (2019 and 2020) and Grace (2016), there was significant variation in measured soil volumetric water content an every sampling date. Variation was large enough to justify application of VRI. At the Rexburg site, the volumetric water content, averaged over all sampling dates, best clustered into three unique zones (Figure 2A). When those zones were compared to three-zone maps of the field generated from ancillary variables (slope, elevation, yield, soil apparent electrical conductivity(EC)), all had between 40% and 50% agreement, with EC and elevation having the highest agreement. At the Grace location, the volumetric water content, averaged over all sampling dates, best clustered into five unique zones (Figure 2A). At this location elevation had the best agreement among the ancillary variables evaluated. Based on the results from both locations, we conclude one wants to delineate VRI zones based on an individual, simple ancillary variable, then elevation is likely to be a good choice.
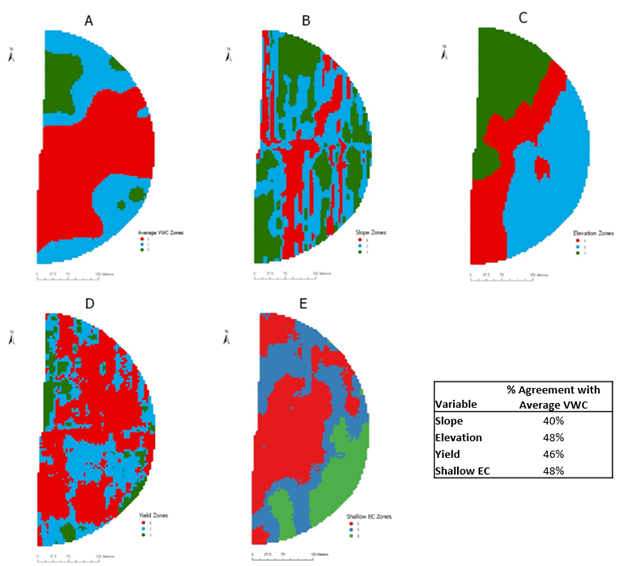
Figure 2A-2E. Three zone maps for the Rexburg site: average 2019 volumetric water content (VWC) (2A), slope (2B), Elevation (2C), Yield (2D), shallow EC (2E).
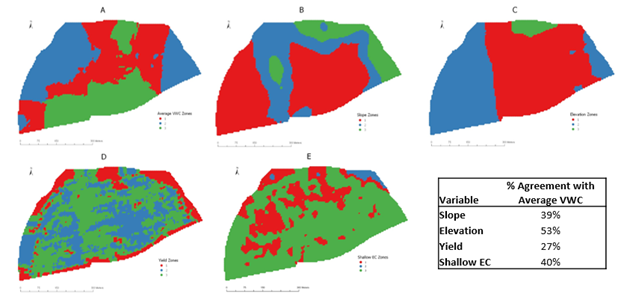
Figure 3A-E. Three zone maps for the Grace site: average 2016 VWC (3A), slope (3B), Elevation (3C), Yield (3D), shallow EC (3E).
Another objective of the VRI study was to determine the spatial variation of crop growth within the field and whether that should be considered in making VRI recommendations. We evaluated visible vegetation indexes (VVIs) based on UAV images for their ability to predict leaf area index (LAI) and describe the spatial variation of LAI within irrigated fields. The relationship between wheat LAI and 12 unique VVIs were then compared to measured LAI values using simple linear regression. The results showed that three VVIs had near identical outputs. Visible atmospherically resistant index (VARI), normalized green-red difference index (NGRDI), and modified green-red vegetation index (MGRVI) all estimated LAI equally well (R2= 0.66, 0.66,0.66; RMSE=0.74,0.73,0.73; MAE=0.57,0.56,0.56). Those VVIs estimated most accurately when resampled to 3 m spatial resolution and resampled through the ladder resampling method. This study introduces a promising solution to remotely estimating LAI using only RGB cameras and consumer grade drones, potentially leading to other applications such as remotely estimating evapotranspiration of irrigated fields and delineation of zones in variable rate irrigation systems. We then used the VARI derived equation to characterize the spatial variation of LAI for each field and each sampling date. Figure 4 shows an example of the variation of LAI at the Rexburg location and how the LAI data could be clustered into zones. We have also documented that there was significant spatial and temporal variation of mean LAI across the pre-defined VRI zones at both field locations.

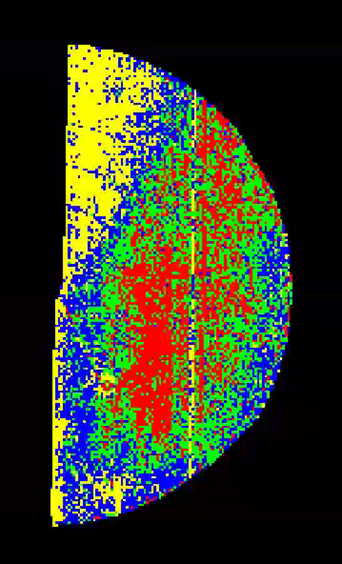
Figure 4 a: Raster image representing estimated LAI values for Rexburg May 2019 based on best LAI estimation methods and b: K means clustered image of Rexburg May 2019 with 4 equal classes of leaf area index values
The Grace location was managed using VRI in 2019 and 2020. For each irrigation event, soil moisture sensors in each zone were evaluated to determine the zone specific irrigation rate. Cumulative applied irrigation by zone is shown in figure 5 and is compared to the irrigation that would have been applied using the growers standard practice (GSP). There was meaningful variation in applied irrigation over the zones, with a difference of 60 mm of irrigation between the least and greatest zones. On average, the VRI approach reduced applied water by 40 mm. Although there was not a direct way to compare grain yield in the VRI system to what it would have been under the GSP, we did conduct a relative yield analysis between zones under the VRI to the same analysis from a previous year under uniform irrigation. This analysis suggests that the yield under the VRI system is equivalent to that of the GSP but used less water.
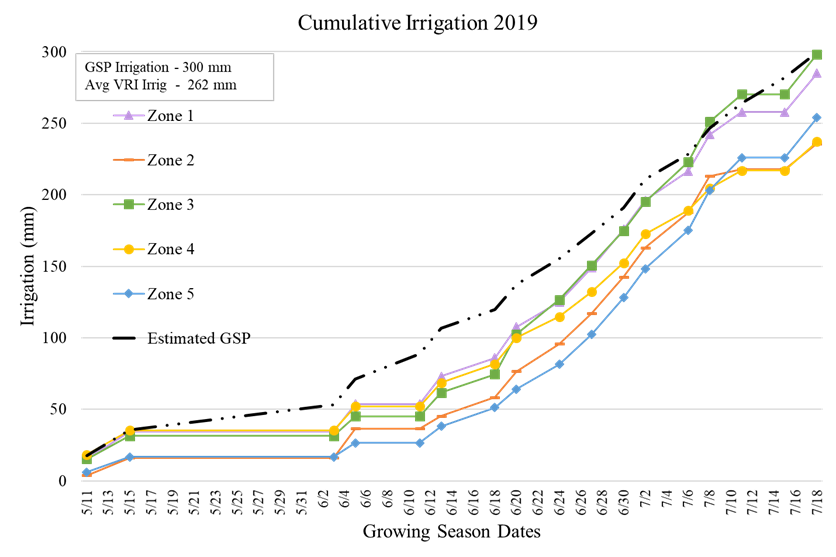
Figure 5. Cumulative irrigation totals for a wheat crop in 2019 at the Grace, ID location under variable rate irrigation (VRI) with five irrigation zones compared to the estimated cumulative grower standard practice (GSP) total.
Another aspect of this work in 2020-2021 was to examine variable-rate irrigation approaches for alfalfa. This study was provoked by the potential of using leaf area index (LAI) to inform VRI recommendations within irrigated alfalfa. LAI has a direct connection with crop coefficient (Kc) used to estimate crop evapotranspiration (ETc). Irrigation zone specific Kc could improve ETc. Measuring LAI manually can be destructive. One approach to estimating LAI is the correlation to visible vegetation indices (VVIs) from an unmanned aerial vehicle (UAV). There are three objectives; (1) manually measure LAI and canopy height, (2) identify VVIs with canopy height that are correlated to LAI, and (3) translate UAV imagery into maps of LAI. The study was conducted in 2021-2022 in Rexburg, Idaho. Measured LAI varied from 0.23-11.28 and canopy height varied from 6 cm to 65 cm. There is strong spatial clustering in measured LAI but the spatial patterns are dynamic between dates. The VVI model with the highest coefficient of determination for estimating LAI was Modified Green Red Vegetation Index (MGRVI) and was improved when field average canopy height was included in the model R2=0.93. The MGRVI and canopy height model was applied to all the UAV imagery and there was statistically but not practical difference between zones for predicted LAI. These results have indicated that UAV imagery coupled with field average crop height can be a useful tool to predict LAI in alfalfa. This could help guide future precision irrigation in alfalfa and other forage crops.
Objective 3:
Surveys of Utah and Idaho growers were conducted to determine their current irrigation and nitrogen practices in corn, potatoes, and small grains. A total of 58 corn responses, 137 small grain responses, and 25 potato responses were collected from February to May 2020. Removing and cleaning the responses lead to much fewer usable responses of 41 corn, 90 small grain, and 15 potato, mutually exclusive of one another (n = 146). The corn responses included 16 grain corn and 25 silage corn and the small grain responses included 30 small grains forage and 60 small grains harvested for grain. The corn responses represented roughly 6,900 ha of production, small grain at 14,500 ha, and potato responses representing about 4,000 ha. This sample supplied three percent of responses from the contacted target population, which was calculated based on the number of usable responses compared to the number of participants emailed. Online only surveys typically have lower response rates compared to paper and phone counterparts. All the potato responses were from Idaho as Utah has minimal potato production. Most responses came from southeastern Idaho (8%) and northern Utah (32%).
The independent variables of acreage managed, percentage of acreage owned, manager years, and test plot occurrence played the biggest roles 4R nitrogen and irrigation practices for corn, potatoes, and small grains. There could be other factors at play such as income from off farm jobs and other aspects to the farm such as livestock components. Nitrogen management had the largest number of full responses. This is probably due to the questions being towards the beginning of the survey before respondents began to drop-off as the survey continued. The nature of the sensitivity to change questions or environmental concern questions may have also turned off participants from completing the survey.
It should be noted that the survey was conducted post-2019 season, and answers were based on the 2019 growing season – a record wet year for Idaho and Utah after several drought years. The survey occurred at the same time as the start of COVID19 pandemic shutdown. Responses could have been low as many of the growers are typically informed in person about Extension projects, or they have not provided up-to-date email addresses to the listserv. The combination of these factors could have led to the low response rate and the type of responses received as all online, opt-in type surveys get low response rates. Further digital surveys often have lower response rates than main-in or phone surveys (Dillman et al., 2021). Repeating this survey post- 2021, an extreme drought year, would lead to more realistic or change viewpoints in sensitivities to change. Though growers should have the ability to look forward towards change, many of the responses suggest this was not the case or answers had an elevated positive outlook of the future. In 2021 and going into the 2022 growing seasons, growers were faced with doubling costs of fertilizer; a follow-up survey would be interesting to see if growers did have to cut fertilizer rates, or they offset the costs in other ways.
The opportunities to expand the use of conservation practices are evident from the responses received, especially in the areas of precision application adoption with nitrogen and irrigation. Simple changes such as changing nitrogen or irrigation rates, especially in a precision technology application, could lead to higher investment returns and reduced resource losses. The sample population gave insight to a group that appears more willing to change – the less experienced smaller operations. The less experienced with smaller operations might be more willing to try new technologies, products, and methods as there could be a lower implementation cost or they are less set in their current ways. There are plenty of areas that need improvement as evident from the survey results, though the sample was small and not as ideally representative of all of Idaho and Utah crop growers. The survey results have been drafted into a journal article that will be submitted for publication in the spring of 2023.
Objective 1:
To date this research has shown that irrigation systems (MDI, LEPA, and LESA) has less impact on crop yields and irrigation productivity than irrigation rates. Deficit irrigation with 50% water all season is producing more crop than a 50% targeted deficit irrigation where water is targeted to critical crop stages. Corn drought tolerant genetics have not improved yield in water stress conditions. Short-term no-tillage reduced corn yield and did not greatly improve water use efficiency of corn.
Objective 2:
Our study to date has shown that there is merit in the use of VRI. At two research locations, we have documented significant spatiotemporal variation in volumetric water content. This variation was used to create three VRI zones at the Rexburg location and five VRI zones at the Grace location. We compared the spatial variation of volumetric water content to easily measured ancillary variables and found reasonable agreement at both locations, with elevation being the best predictor. We also documented spatially variable crop development as measured by UAV measured LAI. As further evidence of the value of VRI, we have shown the ability to reduce overall irrigation through VRI while maintaining similar yield levels.
Objective 3:
Results will be compiled and summarized when surveys are completed.
Research outcomes
- Drought-tolerant corn and alfalfa genetics rarely or never improved crop yield under full or reduced irrigation rates. This indicates they may not be tools for conserving water.
- The low-elevation spray application sprinklers often maintained or improved corn and alfalfa yield with 25% less irrigation than conventional mid-elevation sprinklers. These systems have high potential to save water but do not save in all cases.
- It was difficult to adequately filter mobile drip irrigation to ensure proper irrigation rates. These challenges caused mobile drip to almost always reduce crop yields at full and reduced irrigation rates.
- Early data on cover crops and no-tillage in silage corn production systems indicates they can sometimes reduce crop yield and have not increased yield with full or reduced irrigation rates.
- Zone-based variable-rate irrigation systems often maintained or improve potato and wheat yield with similar or up to 20% less irrigation.
- Future research should continue to compare these and other options to identify how combinations or conservation practices can most effectively improve water optimization.
Education and Outreach
Participation summary:
Objectives, design, methods, and results of this project have been presented and published in many Extension, farm press, university classrooms, and professional settings. This included over 60 separate presentations at Extension crop schools and other related meetings in Utah. It also included a news highlight of this work by the American Society of Agronomy, along with 12 professional presentations by scientists and/or graduate students at regional and national professional meetings. Due to his involvement with this and other related projects, Dr. Yost was invited to write a journal article on 75 years of applied water conservation efforts for a special edition of the Journal of Soil and Water Conservation.
Factsheets. Eleven factsheets that drew on efforts and experience gained in this project and focused on water conservation were developed in 2019-2022. Some of these stemmed directly from training priorities that were identified at our training event we held in Wellsville, UT as a part of objective 1 and 4. Factsheets included among others deficit irrigation strategies, irrigation systems, defense against drought, variable-frequency pumps, and mobile drip irrigation. See the information products section for a full listing.
Trainings. We hosted four separate trainings for irrigation professionals, crop advisors, and conservation planners (NRCS and Utah Department of Agriculture, and Utah Association of Conservation Districts) in 2020-2022 with a total of over 250 participants.
Promotional Video. The Utah State University marketing team requested interviews from Matt Yost and Boyd Kitchen about the project. The interview was developed into a promotional video that was advertised through several USU channels.
Virtual crop schools. We hosted six virtual crop schools in the early part of 2021 and 2022. There was a total of about 1,400 farmers and agricultural professionals that attended these meetings. Results from all three objectives were shared at these events. One presentation focused on alfalfa, one on corn, and another on alternative crops.
Virtual field day. We were planning to hold a face-to-face field day in 2020, but were not able to due to the CO-VID19 pandemic. Therefore, we planned and organized a mega virtual field day to replace these face-to-face events. It was a 2-day event with over 30 speakers and 40 presentations. Event invitations were sent by email and mail to a total of ~7,000 stakeholders in Utah and Idaho. A total of 260 people registered for the field day. The agenda and recorded presentations are available here. The presentation that was given on this project was posted on YouTube here. It has had another 66 views since being posted in July.
A total of 118 unique people joined the first day and 125 joined the second day. Some of attendees were included in the count both days so we could not track the exact total attendance, but we were thrilled that we had that many.
Below are some highlights:
- Everyone that evaluated the meeting would recommend it to others and would attend again. Most indicated that repeating this type of event twice a year(shorter though) would be best.
- 35% of the people that attended had never attended a USU field day. This was a huge positive outcome – we reached a new audience.
- The majority of our audience was crop advisors and farmers (average of 60% of the attendees that completed evaluations).
Most (87%) were satisfied with the sessions and about half had high or very high knowledge gain.
116 Farmers intend/plan to change their practice(s)
Irrigation Curriculum
We finished the irrigation curriculum development. The recommended textbook is Principles of Irrigation, 3rd edition, published by the Irrigation Association. There are 10 PowerPoint lectures:
- Soil
- Determining whether or not to irrigate
- Soil water physics
- Sensor selection
- Distribution systems
- Irrigation efficiency and uniformity
- Water hydraulics
- Electricity and motors
- Pumps
- Erosion and drainage
- Optional- Reclaimed water
There is a homework assignment and two quizzes for each chapter. An instructor key is also provided. There are three exams covering thirds of the course with two versions of each exam. Additionally, there are study questions for each chapter along with an answer key. A list of reading assignments is included for each chapter as well.
It is geared for a 2-credit lecture-based class, roughly 26 hours of instruction. The audience is horticulture and agronomy students. Examples are used for both groups. It was a bit challenging to make it brief enough to fit into 2 credits. A 1 credit lab is also in the works and should be completed within a month. We are having difficulty getting responses from anybody with pivot control materials that we had hoped to include in the labs. We also plan to add a variable rate lab.
Currently, we are working to have the entire curriculum available for online instruction. It should be ready by Fall 2023 semester. Labs will all be face-to-face but taught on the first block to avoid travel for students in inclement weather.
Objective 3: Determine producer’s attitudes, acceptance rates, and barriers to adoption of water conservation practices in order to better adapt and target Extension and outreach efforts.
This effort included conducting a survey of growers in Idaho and Utah to learn more about how they manage 4R (source, rate, time, and place) of irrigation management. One of the major findings of the survey was that irrigation shutoff time varies greatly by crop and county in this region. This indicates that there is much opportunity to conduct new and disseminate existing research on irrigation management to help growers better manage their final irrigations in small grains, corn, and potatoes. Another result was that many growers adjust their irrigation timing when drought occurs, and would do the same if water prices were to double. This signified that there are opportunities to increase use of irrigation scheduling tools that can help growers deal with less water, and possible water price increases as water scarcity becomes more of an issue in the future. The surveys were conducted online with in-person advertisements to growers in several meetings. It likely would have been more effective to do a mail survey but the cost increases greatly to use this method.
Objective 4: Deliver dynamic educational products and training on water and energy optimization through Extension and coordinated outreach to increase awareness and adoption of proven water optimization practices.
We developed 11 fact sheets that were published through USU Extension. These fact sheets were disseminated online with over 5,000 visits during the project period, through online e-articles with over 3,000 views, through social media with over 2,000 followers and several thousands of impressions/views. The results of this study were also shared in many local, regional, and international meetings and conferences. During this process, we learned that hybrid methods for educating growers were highly effective. We conducted virtual crop schools in 2020 due to co-vid and had over 1,000 growers and crop advisors join our five virtual schools. Due to this success, we have continued to conduct a virtual school each year and it continues to have over 150 attendees each year. We also learned that short e-articles were an effective way to share research results. Most growers might not seek out our factsheets on their own. Further, with so much available online, it is difficult to find credible resources. We emailed short introductions to our fact sheets to about 1,800 growers through our list-serve and many articles received about 300-450 views and engagements. This increased our ability to engage and reach growers with evidence-based resources based on our research.
Education and Outreach Outcomes
We have learned important lessons during the first three years of this long-term project. Many lessons learned about mobile drip irrigation and variable frequency drives were recently published as USU Extension fact sheets. Filtration is critical for successful irrigation with mobile drip irrigation.
We have also engaged the irrigation industry (both irrigation professionals and crop advisors) in a coordinated and statewide way that has never been done before. This resulted in new connections and collaborations between these two important stakeholder groups who both assist growers in making irrigation decisions. Providing training and hosting roundtable discussions to identify and meet needs, and to prioritize research efforts has helped make Extension efforts more pertinent and useful to these industries, and has and will further the use of evidence-based practices to optimize water use in Utah and in the region.
We are beginning to identify conditions where variable-rate irrigation (VRI) might be feasible and economic. These appear to be where water requirements are highly variable, as caused by variable soils, variable yield, or variations in field conditions. These findings are being developed into a variable-rate irrigation guide that will serve Utah, Idaho, Washington, and Oregon growers in making decisions about precision irrigation implementation. This guide will also be useful to other areas in the West with overhead sprinkler irrigation systems.
- Irrigation maintenance and irrigation scheduling
- Irrigation systems for overhead irrigation
- Alternative crops
- Cover crops
- Conservation tillage
- Drought-tolerant crop genetics
- Water optimization in agriculture
- Deficit irrigation strategies
84% of the 183 participants who completed evaluations for the crop events indicated that they had gained knowledge about advanced techniques for irrigation scheduling. 63% indicated that they planned to use the information to improve their management.