Final report for SW22-940
Project Information
This collaborative project uses replicated on-farm research trials in combination with online information delivery to support adoption of cover cropping for inland Pacific Northwest (iPNW) dryland cereal-based cropping systems. Globally, cover cropping is a recognized strategy for mitigating soil erosion, loss of fertility and soil acidification, compromised soil health, reliance on synthetic inputs, and decreased biodiversity that jeopardize the sustainability of cropping systems. Despite these advantages, adoption of cover cropping has lagged in the iPNW relative to other regions. This is largely due to uncertainty regarding integrating cover crops into longstanding cereal-based crop rotations and how cover crop species perform for specific agronomic goals. In much of the region, low precipitation presents unique challenges to cover crop establishment and ensuring moisture sufficient for primary cash crops. Ongoing climatic challenges, including reduced summer precipitation and greater frequency of heat stress events, exacerbate these changes. The grower partners for this project (co-PIs and cooperators), all of whom are early adopters of cover cropping in the region, are motivated to diversify their production for the long-term benefits to soil health and resilience to climate variability and the potential to generate novel sources of income for their farms. They have expressed needs for research to help them and others succeed with cover crops in the iPNW, and participated in the design of this project’s three objectives: 1. Compare cover crop mixtures and termination dates for effects on cover crop performance, water infiltration rates, bulk density, nitrogen availability, weed and insect biodiversity and performance of the subsequent cash crop, 2. Compare the effects of treatments in Objective 1 on soil moisture profiles during the season and after different termination dates, 3. Use information from Objectives 1 and 2, existing published literature and data, and grower workshops and interviews to develop a comprehensive online support system for iPNW cover crop management. The system will include tools for deciding on what cover crops to plant and how to manage them, links to cover crop information and a platform for producer discussions and information sharing. The project will be the first of its kind to address key issues challenging cover cropping in iPNW cereal systems by providing key information needed for optimization and adoption. It is a crucial step toward improving soil health and the sustainability of these systems over the long run. This proposal is for a 3-year project, but we have also indicated the intent to carry it on for three additional years with additional funding to be requested in a proposal to WSARE.
1. Compare cover crop mixtures and termination dates for effects on cover crop performance, water infiltration rates, bulk density, nitrogen availability, weed and insect biodiversity and performance of the subsequent cash crop
2. Compare the effects of treatments in Objective 1 on soil moisture profiles during the season and after different termination dates
3. Use information from Objectives 1 and 2, existing literature and data, and grower workshops and interviews to develop the first comprehensive online support system for inland Pacific Northwest cover crop management
Project organizational meetings will include a launch meeting and annual project meetings in the first quarter of each year. Funds are requested for a project start in October of 2022. We will use the last quarter of 2022 for planning and to begin constructing the PaNDAS site. Plot establishment and assessments for Objectives 1 and 2 will take place in 2023-2025. In a fourth partial year (2025), data from the subsequent winter wheat will provide three full years of that assessment. Workshops to inform PaNDAS design will take place in the first winter (2023). Review of beta versions of PaNDAS site will be ongoing into 2024. A live version of PaNDAS will be launched in first quarter of 2024 and maintained through end of project. Funds will be sought to continue PaNDAS, which is conceived as a permanent, dynamic resource for producers. Each season, the project will be represented at field days and grower schools, and it will hold its own field day demonstration at two of its (AC and AC-F) sites.
Table 1. PaNDAS project timeline
Research
The project addresses two key grower-identified questions through two objectives.
1. Compare cover crop mixtures and termination dates for effects on cover crop performance, water infiltration rates, bulk density, nitrogen availability, weed and insect biodiversity and performance of the subsequent cash crop
2. Compare the effects of treatments in Objective 1 on soil moisture profiles during the season and after different termination dates
Design and Treatments
Treatments will be applied in replicated trials on the eight working farms of the Producer Co-PIs and Producer Cooperators for this project. Four farms will be in the region’s lower precipitation Annual Crop-Fallow (AC-F) (FT in reporting sections) agroecological zone where business as usual (BAU) cropping consists of a three-year fallow-winter wheat-spring wheat rotation. Four farms will be in the higher precipitation annual cropping (AC) zone where BAU consists of a three-year rotation, predominantly spring legume-winter wheat-spring cereal. On each farm, nine strips (~ 0.5 ac. each) will be established within BAU fields, replacing fallow in AC-F (FT) and spring wheat in AC with experimental cover crop mixtures. A schematic of the plot design on a participating farm over three years is provided in Figure 1.
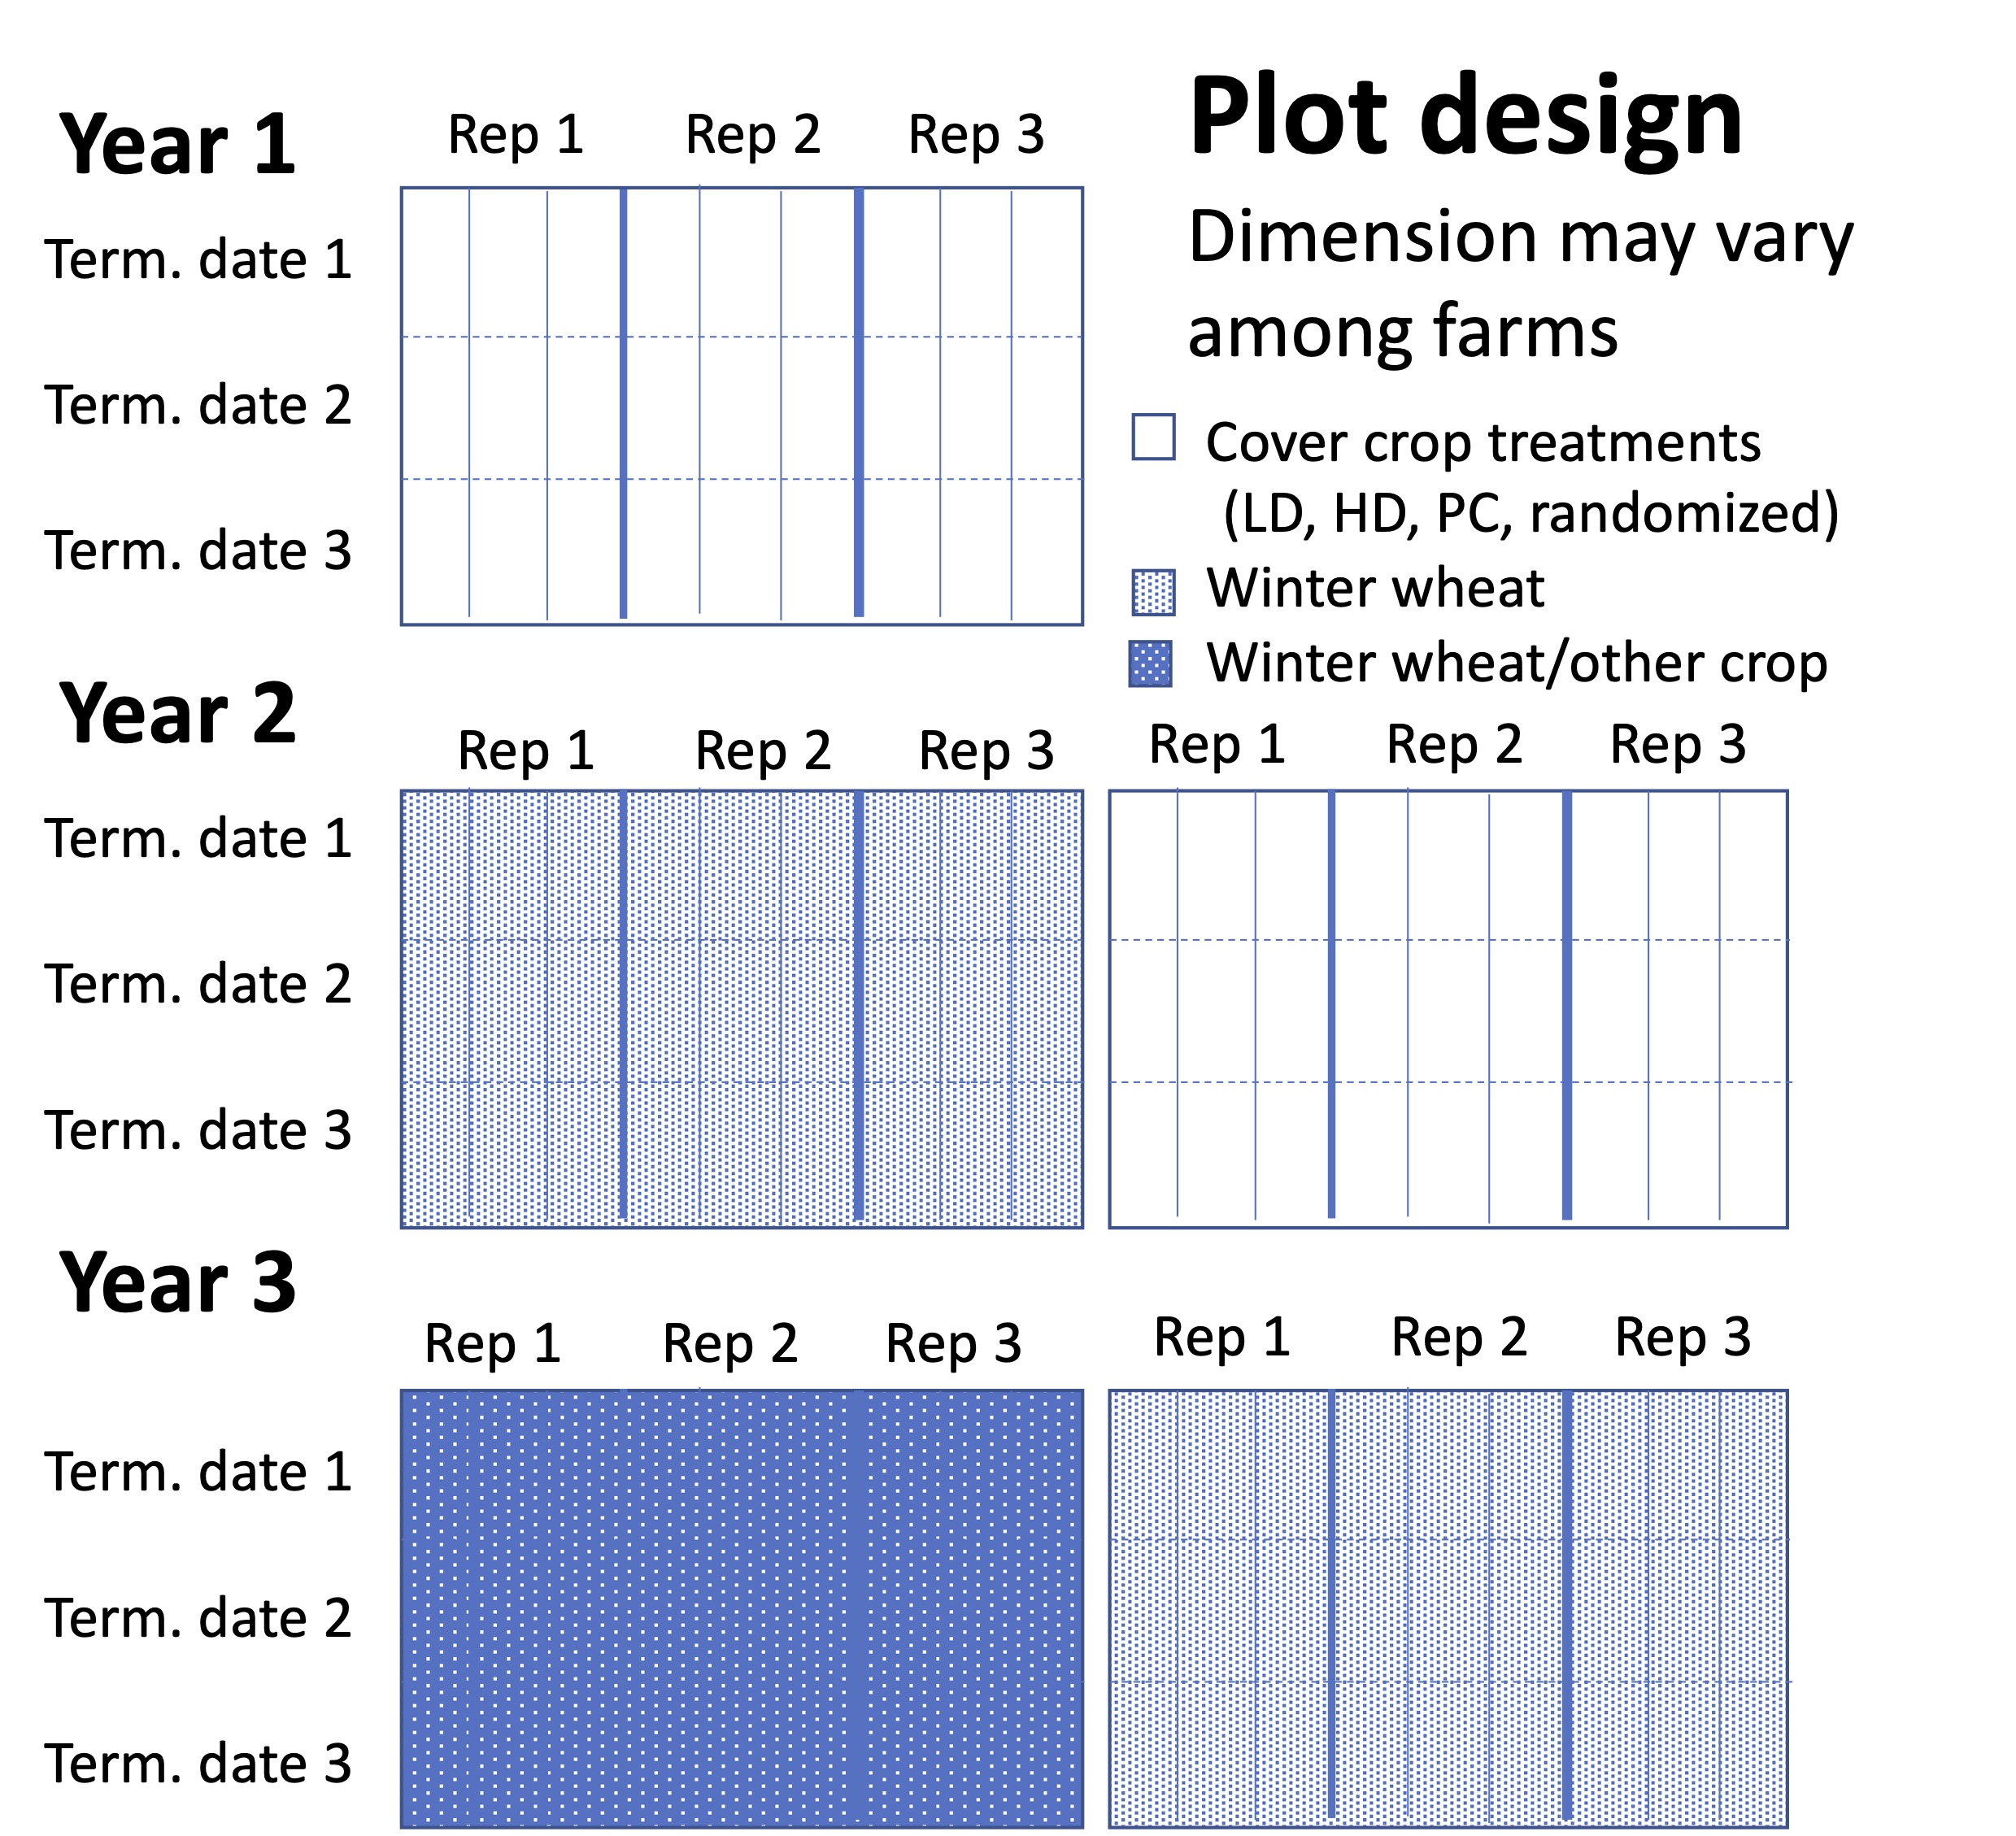
Cover Crop Mixtures. On each farm, three cover crop mixtures will be established, each with three replicate strips. Configuration will vary among farms to accommodate geometry and equipment. Common treatments will include a low-diversity cover crop mixture (LD) and a high-diversity cover crop mixture (HD). The LD mixture will include one grass, one legume and one brassica species in these proportions: 60% oats, 30% pea, and 10% turnip. The HD mixture will include three grasses (20% oats, 20% millet, 20% triticale), three legumes (10% pea, 10% sweet clover, 10% lentil), and three brassicas (3.3% turnip, 3.3% radish, 3.3% mustard). The third mixture on each farm will be a ‘Producer’s Choice’ (PC). We recognize that growers in different parts of the region, in addition to their common interests and questions about cover crops, have different challenges that influence their selection of cover crop mixes. The PC treatment will enable producers to test performance of a mixture designed based on their experience and interest. The findings about these mixtures will also inform our cover crop selection tool (see Objective 3). The PC mixtures and rationales for including them (Table 1) were developed as an outcome of a discussion involving all the cooperators and producer co-PIs for this project. Rationales common to several producers include nitrogen fertilization (4/8), weed suppression (4/8), bio-drilling (4/8, all in AC-F (FT) subregion), increasing organic matter (3/8), grazing income (2/8, both in the AC subregion). For this project, all three treatments will be established each year in the spring to improve comparability. There is also interest in fall planted cover crops in the region but evaluating those practices will be beyond the scope of this project.
Table 2. Producer-choice cover crops which will comprise the third treatment on each farm.
Termination Dates. Each of the standard treatments (HD and LD) and most of the PC treatments (see Table 1) will be terminated using herbicide in a split plot design on three dates based on cover crop vegetative growth profiles. Termination date 1 (TD1) will be on or before June 1, when cover crops are fully established and in accordance with USDA-NRCS guidelines and crop insurance program requirements. Termination date 2 (TD2) will be at first pod formation in any cover crop legume, and TD3 will be when all cover crops have reached maturity. The dates selected will maximize biomass production and related benefits to soil health while minimizing excessive moisture loss through transpiration and seed production leading to volunteer plants in the following. Producer-choice mixtures will also be terminated on these dates.
Subsequent Crop: Each year, strips will be relocated on each farm, marking their locations. In the subsequent cropping year, the ground with strips will be planted to winter wheat following standard grower procedures. The subsequent winter wheat crop yield and quality and soil nitrogen availability in near-surface soil will be measured in this follow-on wheat crop in the previous year’s cover crop and BAU strips to assess the effects of cover crops on the principal cash crop. Measurements to address Objective 1 and 2 on all farms will be as follows:
Objective 1. Cover Crop and Subsequent Cash Crop Performance: Cover crops will be evaluated for percent emergence and established stand diversity and cover crop coverage and biomass by species at each TD. In the second and third year of the project, the subsequent winter wheat will be assessed following cover crop and in the BAU system for emergence, stand, mature biomass, yield, grain moisture and protein.
Soil Physical Properties: Penetration resistance (Dane et al. 2002), bulk density (Grossman and Reinsch 2002), and water infiltration rates (van Es and Schindelbeck 2001) in cover crops at TD3 and in the subsequent winter wheat crops will be assessed to determine the impact of cover crops on soil physical properties. Penetration resistance measurements and infiltration rates will be measured once a year in cover crops and the following winter wheat crop. Bulk density measurements will be made prior to planting of the cover crops and at the end of the experiment.
Soil N and Organic Matter: Plant available nitrogen (Mulvaney 1996) in the first 1.5 m of soil will be measured in one TD in LD, HD and PC cover crop treatments at each site both in spring and at harvest. Three replicate, 1.5-m deep soil cores will be taken within each plot and split into 30-cm increments in the field. Subsamples from each depth increment will be combined to form one representative sample per treatment that will be analyzed. Changes in plant available nitrogen with depth, along with measured values of total nitrogen in above ground biomass, will be used to evaluate the impact of each cover crop treatment on nitrogen uptake and availability to the following crop. Sampling in the winter wheat crop will be limited to spring and results will be utilized to determine nitrogen fertilization application rates. Soil organic matter, estimated by loss on ignition (Nelson and Sommers 1996) will be assessed on the same samples collected to determine plant available nitrogen.
Weed and Insect Pressure and Biodiversity: Aphids (Aphididae; e.g., cereal aphids, pea aphid), wireworms (Elateridae), hessian fly (Mayetiola destructor), pea weevil (Bruchus pisorum), and pea leaf weevil (Sitona lineata) are some of the key insect pests in the iPNW. Additionally, several beneficial insects such as bees, wasps, flies, ladybug beetles, green lacewings are present in the region that need to be documented on cover crops. Similarly, key weeds are Mayweed chamomile (Anthemis cotula), cheat grass (Bromus tectorum), rattail fescue (Vulpia myuros), prickly lettuce (Lactuca serriola), common lambsquarters (Chenopodium album), and catchweed (Galium aparine). Baseline information of weeds, insect pests and beneficial insects within BAU and alternative cropping systems is important to understand the sustainability of future agricultural landscapes. Substantial changes in crop species and diversity could promote ecosystem services such as biological control and pollination, but also promote disservices by exacerbating existing pest populations or introducing new pests. To anticipate these potential effects, pests and beneficial organisms will be assessed in all treatments in the on-farm strip trials and in adjacent BAU crop fields. Briefly, weed abundance, coverage and diversity will be assessed before each termination dates in five 1-m2 quadrats in each cover crop strip and adjoining BAU fields during first two years, and in winter wheat following cover crops in the second and third years. Aboveground weed biomass will be assessed by clipping all plants rooted within quadrats, sorting to species, drying, and weighing. Following a similar schedule, insect pests and beneficials will be assessed on each strip using sweep net sampling along a W-shaped 30 m transect. Insect samples will be sorted to species for key pest species and beneficial insects to genus or family.
Objective 2. Sensors linked to data loggers (Acclima, Meridian ID) will continuously monitor volumetric soil moisture and temperature at two depths in each cover crop treatment at TD2 and TD3 in one replicate block per farm. There will be 14 probes per site, which include 2 probes in each LD, HD, and PC at both TD2 and TD3 as well as 2 probes in the BAU. As a complement, soil moisture will be measured gravimetrically based on soil samples at the beginning and end of each growing season in all plots on each farm, utilizing the same cores collected under Objective 1. Volumetric water contents will be calculated utilizing measured bulk density values. These measurements will allow assessment of water use and tradeoffs between soil moisture conservation and biomass production. Replicated gravimetric measurements will allow comparisons of treatments within and across farms. Continuous monitoring will provide new information on soil moisture dynamics to understand the origin of point measurement values and guide future efforts to identify optimal cover crop termination dates to balance benefits of biomass production and potential costs of cover cropping to the yield of subsequent cash crops in our region. Termination dates currently are determined by producers based on intuition, scantly replicated experience on individual farms and generally follow some aspect of cover crop phenology as an approximate guide. Some are incentivized to terminate early (before June 1) for crop insurance reasons. Data will be widely disseminated to stakeholders through our decision support system (see Objective 3). Results on termination after June 1 and before end of season will have relevance for those involved in advising on crop insurance policy requirements. Water infiltration rates will be measured in all treatments each spring and after the final TD. This measurement has been encouraged by producers who have seen evidence of water infiltration improvement after cover crops and are greatly interested in this output from the project. Under low rainfall, this can be critical for maximizing harvesting of precipitation for crop growth.
Analysis for Objectives 1 and 2
The effects of cover-crop treatment, nested within farm, on each response variable (soil biological, chemical and physical properties) will be analyzed with analysis of variance (ANOVA), multivariate analysis of variance (MANOVA), or mixed models with data transformed as required for each variable. For common cover crop treatments, the effects of farm site and production zone and their interaction on response variables will also be assessed. Specifically, differences in weed and insect abundance, species richness, diversity, and community composition will be analyzed using appropriate mix-effects ANOVA models and multivariate analysis such as Non-Metric Multidimensional Scaling (NMDS). We will test differences in weed and insect community structures between cover crop treatment and termination timing using Permutational Multivariate Analysis of Variance (PERMANOVA) of the dissimilarity matrix using the vegan package in R statistical software (R Core Team 2019, Oksanen et al. 2020). This will enable detection of effects that are broadly relevant in the iPNW across its precipitation regimes and those that are site or production class specific, critical information for guiding cover crop implementation and management. Summaries of all these findings will be distilled for presentation on the project’s PaNDAS website into thematic segments such as: “Terminating your cover crop to optimize water use”, “Best cover crop species for water conservation”, and “iPNW cover crops and weed suppression”. The findings will also be unique and publishable in refereed journals including Journal of Agronomy, Journal of Soil and Water Conservation, Applied Soil Ecology.
Farm sites in the 2023, 2024 and 2025 field seasons
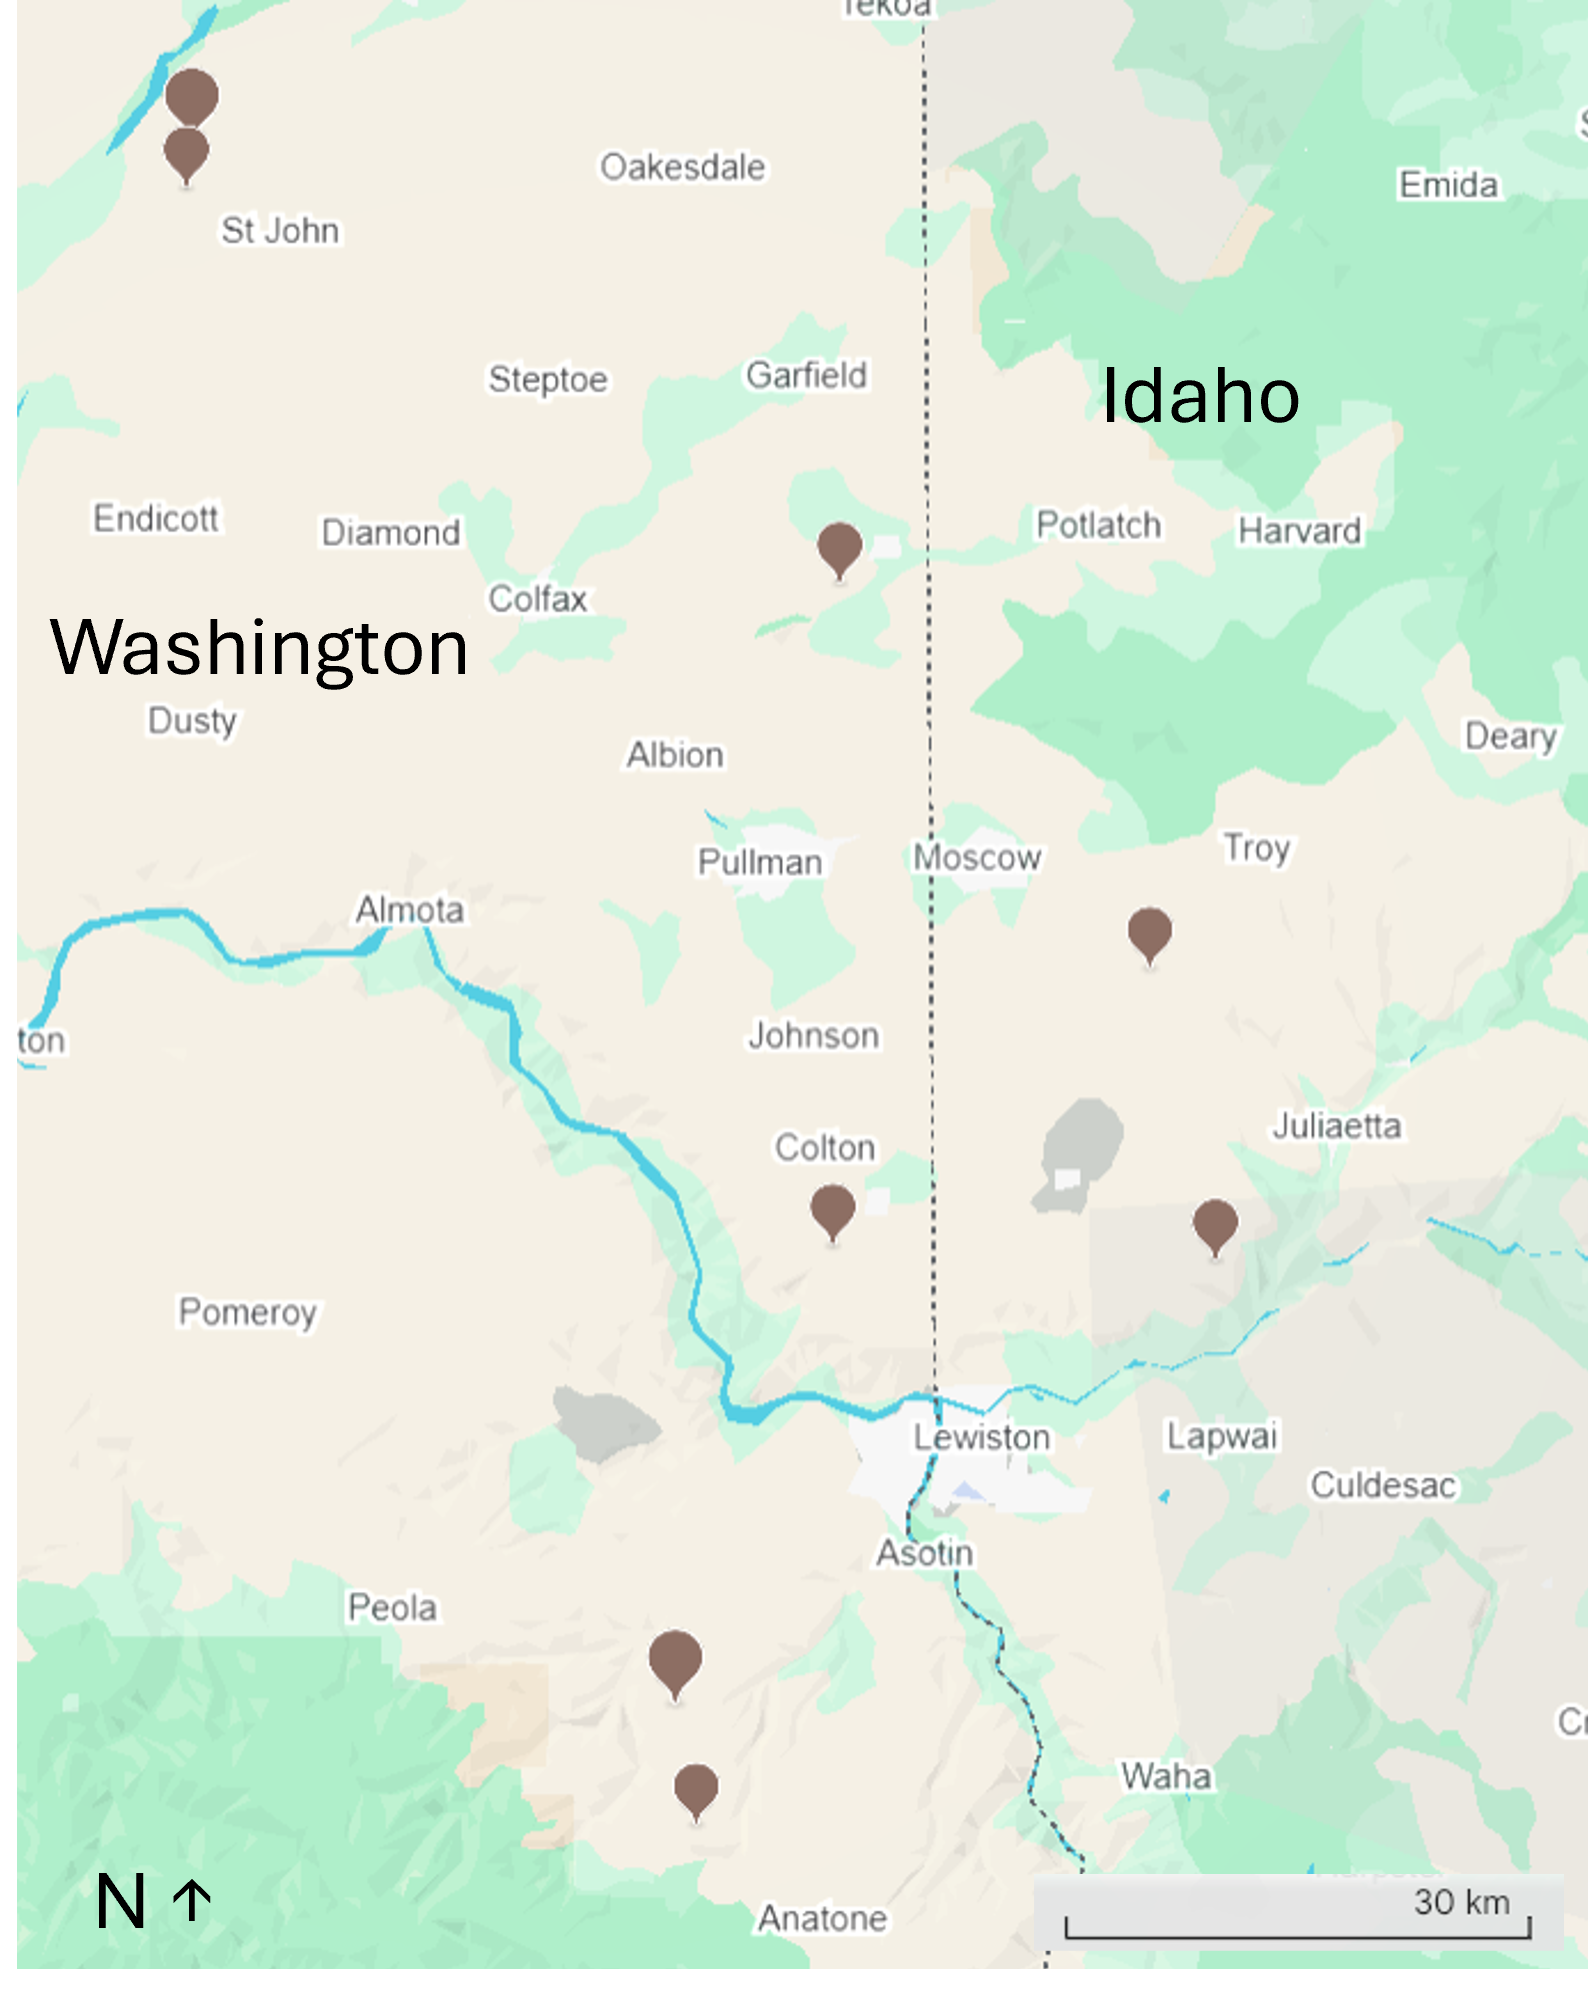
Between the project start date and April 15, 2023, the specific plot locations were identified on each of the 8 farmer cooperator/co-PI farms (Fig. 2) and flagged for planting. First sets of plots were established instrumented, planted and monitored on all 8 farms in 2023 and second sets of plots were established, planted and monitored in 2024 field season on each farm.The second set was close to the first set, generally less than a mile distant. In 2024, data were taken on the follow-on BAU treatment (winter wheat) over the 2023 plots as well as from cover crops in the 2024 plots. In 2025, data were taken on the follow-on BAU treatment (winter wheat) planted over the 2024 plots.
Operations conducted on each farm - Objective 1
Unless otherwise stated, the following procedures were followed on each set of plots in 2023 and 2024 field season.
- Pre-plant (spring) and end of season soil samples were collected in the designated second termination date treatment strip of all plots and a BAU area adjacent to plots, in 30 cm increments from 0-150 cm for plant available soil N and gravimetric water content.
- Seed for the common cover crop mixtures was procured and delivered to each farm in preparation for planting and all plots were seeded with cover crop mixes in April- May.
- Germination counts were completed within 2 weeks after seeding.
- Bulk density was measured only in the end of season soil samples in the termination date strip only of our cover crop plots, while collecting samples for soil N and gravimetric water content. This was only measured once due to time limitation in the spring, which is a deviation from what is stated in the last report under ‘Design and Treatments: Soil physical properties’.
- Infiltration was measured at two farms in 2023, one in each rainfall zone, after the final cover crop termination and in one farm in 2024. This is a very time consuming measurement to collect. We used a dual infiltrometer in attempt to get a more accurate reading than the simpler single ring infiltrometer. This original plan is stated in the last report under ‘Design and Treatments: Soil physical properties’ subheading and also mentioned under Objective 2.
-
Soil penetration resistance was not measured in spring 2023 during early cover crop growth. Instead we measured it in April-May 2024 to assess soil physical properties during the winter wheat phase, 1 year after cover crop treatments.
- Producers were not requested to adjust N fertilizer applications based on soil N tests as planned, but rates used for the winter wheat planted on each farm were recorded for assessing N budgets.
- Cover crop and weed biomass were collected using three 0.5 m2 frames per each of nine plots across fields before each of the three crop termination dates.
- Insect samples were collected during the summers of 2023 and 2024 using 1800 standardized sweep net sampling (40 sweeps along a 40 m W-shaped transect per plot) for each of nine treatments and three BAU plots across eight producer cooperator fields during peak cover crop blooming (i.e., before the second or third crop terminations). Plots were sampled twice (i.e., before the second and third crop terminations) in 2023 and once (i.e., before third crop terminations) in 2024. The 2023 and 2024 samples processing was completed in the laboratory and identified to family or the lowest possible classification. Data were analyzed using mixed-effects models and visualized using the ggplot2 package in R. For presentation to the target audience, insects were grouped into major taxonomic categories (e.g. aphids, thrips, leaf beetles) and aggregated functional categories (predators, pollinators). The effect of cover crop type and BAU on these community compositions within and across production zones was assessed.
Follow-on winter wheat
-
- The 2023 and 2024 cover crop plots were seeded to winter wheat in August-September 2023 and 2024 and monitored to evaluate cover crop impact on winter wheat yield, N availability, and soil water availability in 2024 and 2025. Seed zone moisture was measured at planting. In April 2024 and 2025, soil N was measured in 0-30 and 30-60 cm increments, paired with winter wheat biomass and N-biomass content measurements.
- Winter wheat samples were collected by hand in July-August 2024 just before combine harvest. Samples were threshed to measure grain yield, grain protein and total crop biomass
- Cover crop biomass samples collected from 2023 were analyzed for total plant tissue N by plant family.
- Available soil N sample analysis (KCl extractable nitrate and ammonia)from the more than 1,850 samples that were collected from plots in 2023-2024. Nitrogen and carbon were also evaluated in the above ground biomass of cover crops and cash crop. These data were processed for estimation of total N pools in soils and aboveground plant tissues in all treatments to understand N cycling in BAU and cover cropping systems.
- Soil pH was measured on ¾ of sites, for soil characterization of each site. A pilot study of soils from 2 farms indicated no effect of cover crop on soil pH.
- Organic matter, measured as loss on ignition was used to compare baseline (pre-plant) to post-cover crop values. A pilot study is being conducted to determine the timeframe most appropriate for detecting changes in organic matter after cover crop treatments: end of cover crop growing season, spring following cover crops (~8 months), or 1 year following cover crops (end of winter wheat harvest).
Operations conducted on each of these sites - Objective 2
On cover crop plots, second set on each farm established in 2024:
-
-
- In the 2024 plots, cover crop and weed biomass was collected before each of the three termination dates. Cover crops were separated by plant family, dried and weighed. No sensors were installed in the 2024 cover crop plots. Instead, soil moisture was monitored gravimetrically in 30 cm increments from 0-150cm during pre-plant and post-harvest soil sampling, and in 0-30, 30-60, and 60-90 cm soil depths at each termination date. Additionally surface soil moisture, 0-10 cm, was measured with a handheld TDR probe at each termination date, and at winter wheat seeding in all 27 sub-plots per site in Sept-Oct 2024.
- Soil moisture and temperature sensors were installed at all 8 farms prior to cover crop planting in 2023 and maintained throughout the winter wheat crop phase in 2024, providing continuous measurement of soil water availability in the cover crop treatments through winter wheat harvest in 2024.
-
On the follow-on winter wheat planted over 2023 and 2024 cover crop plots and evaluated in 2024 and 2025
-
- Soil moisture and temperature sensors were maintained throughout the winter wheat crop phase, providing continuous measurement of soil water availability in the cover crop treatments in 2023 through winter wheat harvest in 2024 and winter wheat planted and harvested over the 2024 cover crop plots. Data collection from these sensors has continued to date.
- Seed zone moisture was measured at winter wheat planting (Fall 2023 and Fall 2024).
- In April 2024 and 2025, soil N was measured in 0-30 and 30-60 cm increments, paired with winter wheat biomass and N-biomass content measurements
- Soil penetration resistance was measured in April-May 2024 and 2025 to assess soil physical properties 1 year after cover crop treatments.
- Winter wheat samples were collected by hand in July-August 2024 and 2025 just before combine harvest in each year. Samples were threshed to measure grain yield, grain protein and total crop biomass
- Soil N and gravimetric soil water samples were collected in Fall 2024 and 2025 in 30 cm increments from 0-150 cm after winter wheat harvest - one year after cover crop treatments
Summary of agronomic operations throughout the project
The dates of seeding cover crops and follow-on crop, and the dates of cover crop termination for each farm in the study are provided in Table 3.
Table 3. Summary of agronomic operations by farm, throughout the study
In this summary the following abbreviations are used:
AC = Annual cropping zone; FT = Fallow-transition cropping zone (Annual Crop - Fallow, AC-F in methods*); TDx - one of the three cover crop implementation dates; HD = High diversity cover crop; LD = Low diversity cover crop; PC = Producers choice cover crop; BAU = Business as usual farming practice or crop; TIN = Total inorganic nitrogen.
* This designation adopted for simplicity in reporting.
Objective 1
Above-ground cover crop biomass in both zones and years increased with TD (Fig. 3). In the AC zone, averaged across cover crop mix treatments, total dry biomass of cover crops doubled between TD1 and TD3 in 2023, and more than tripled between TD1 and TD3 in 2024.
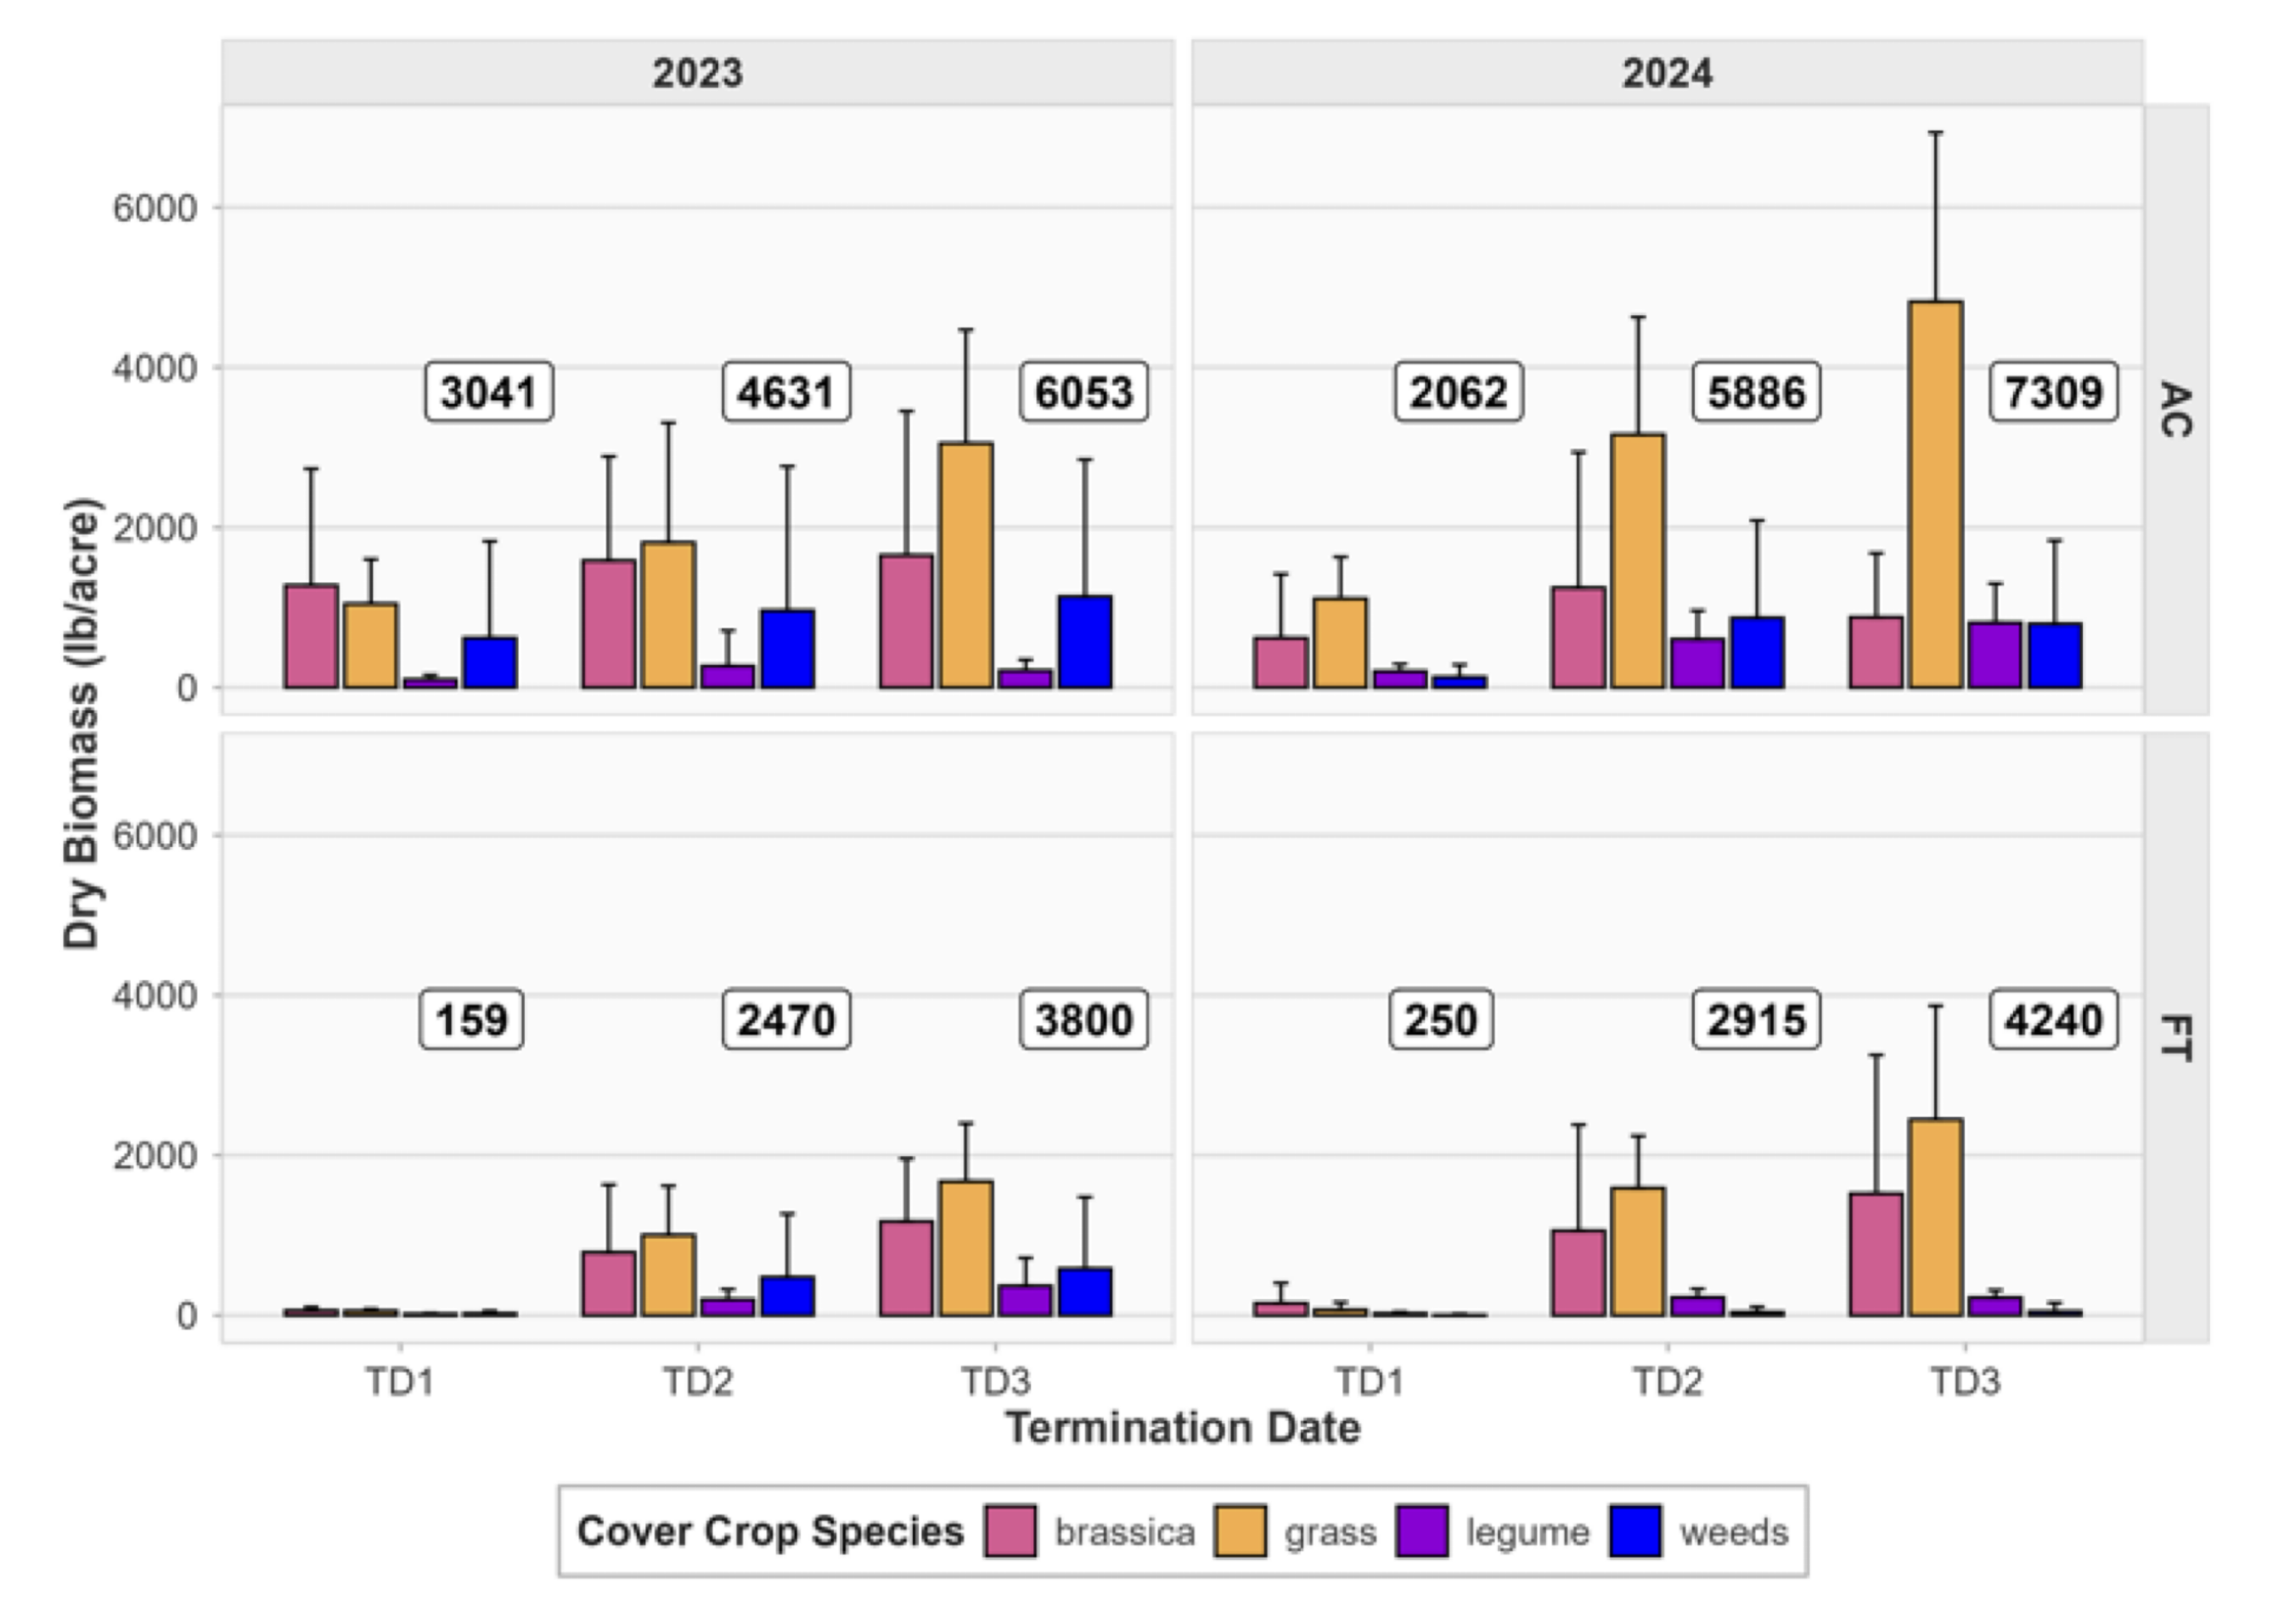
In the FT zone, cover crops terminated at TD1 produced less than 250 lb/acre of aboveground biomass, while those terminated at TD2 and TD3 averaged 2500-2900 lb/acre 3800-4240 lb/acre respectively in both years. Brassicas and grasses were the dominant contributors to aboveground biomass in all treatments and termination date in both zones (Fig. 3).
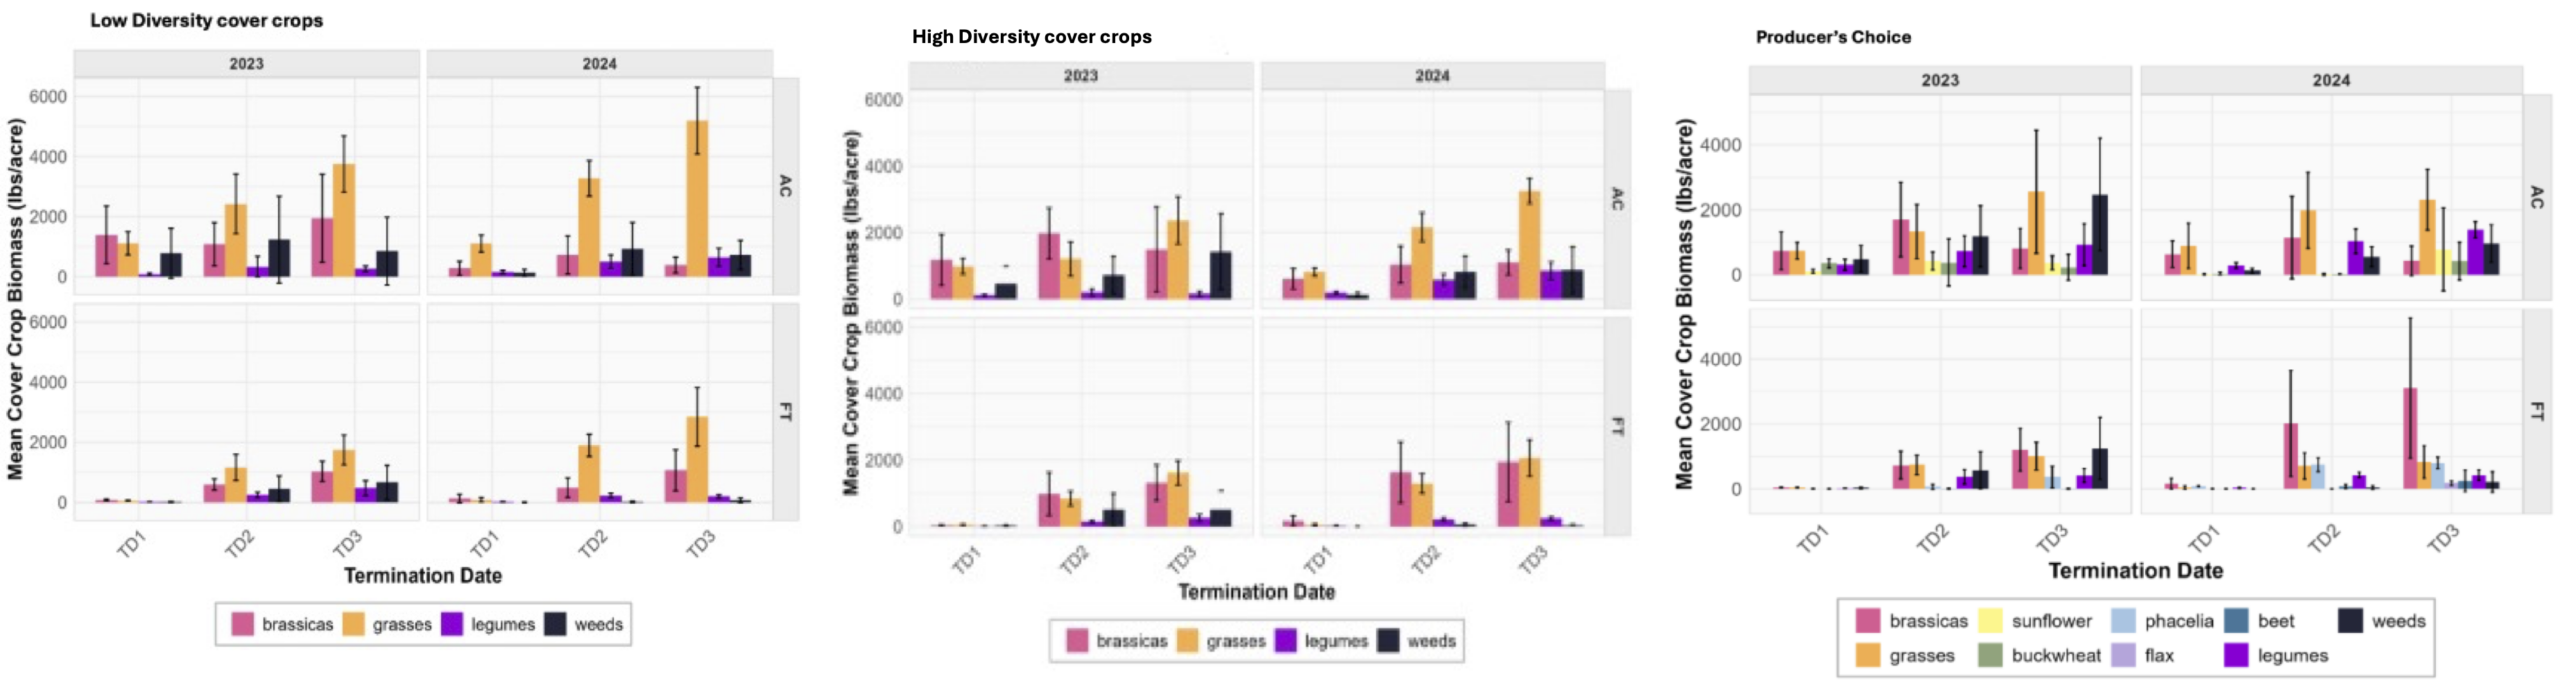
This trend was evident in all three cover crop mixtures (HD, LD, PC) (Fig. 4). In the HD and PC treatments in 2023, there appears to be a slight trend of greater weed pressure at TD3 than the earlier termination date, in some instances
Effects of Cover Crops on Nitrogen Cycling
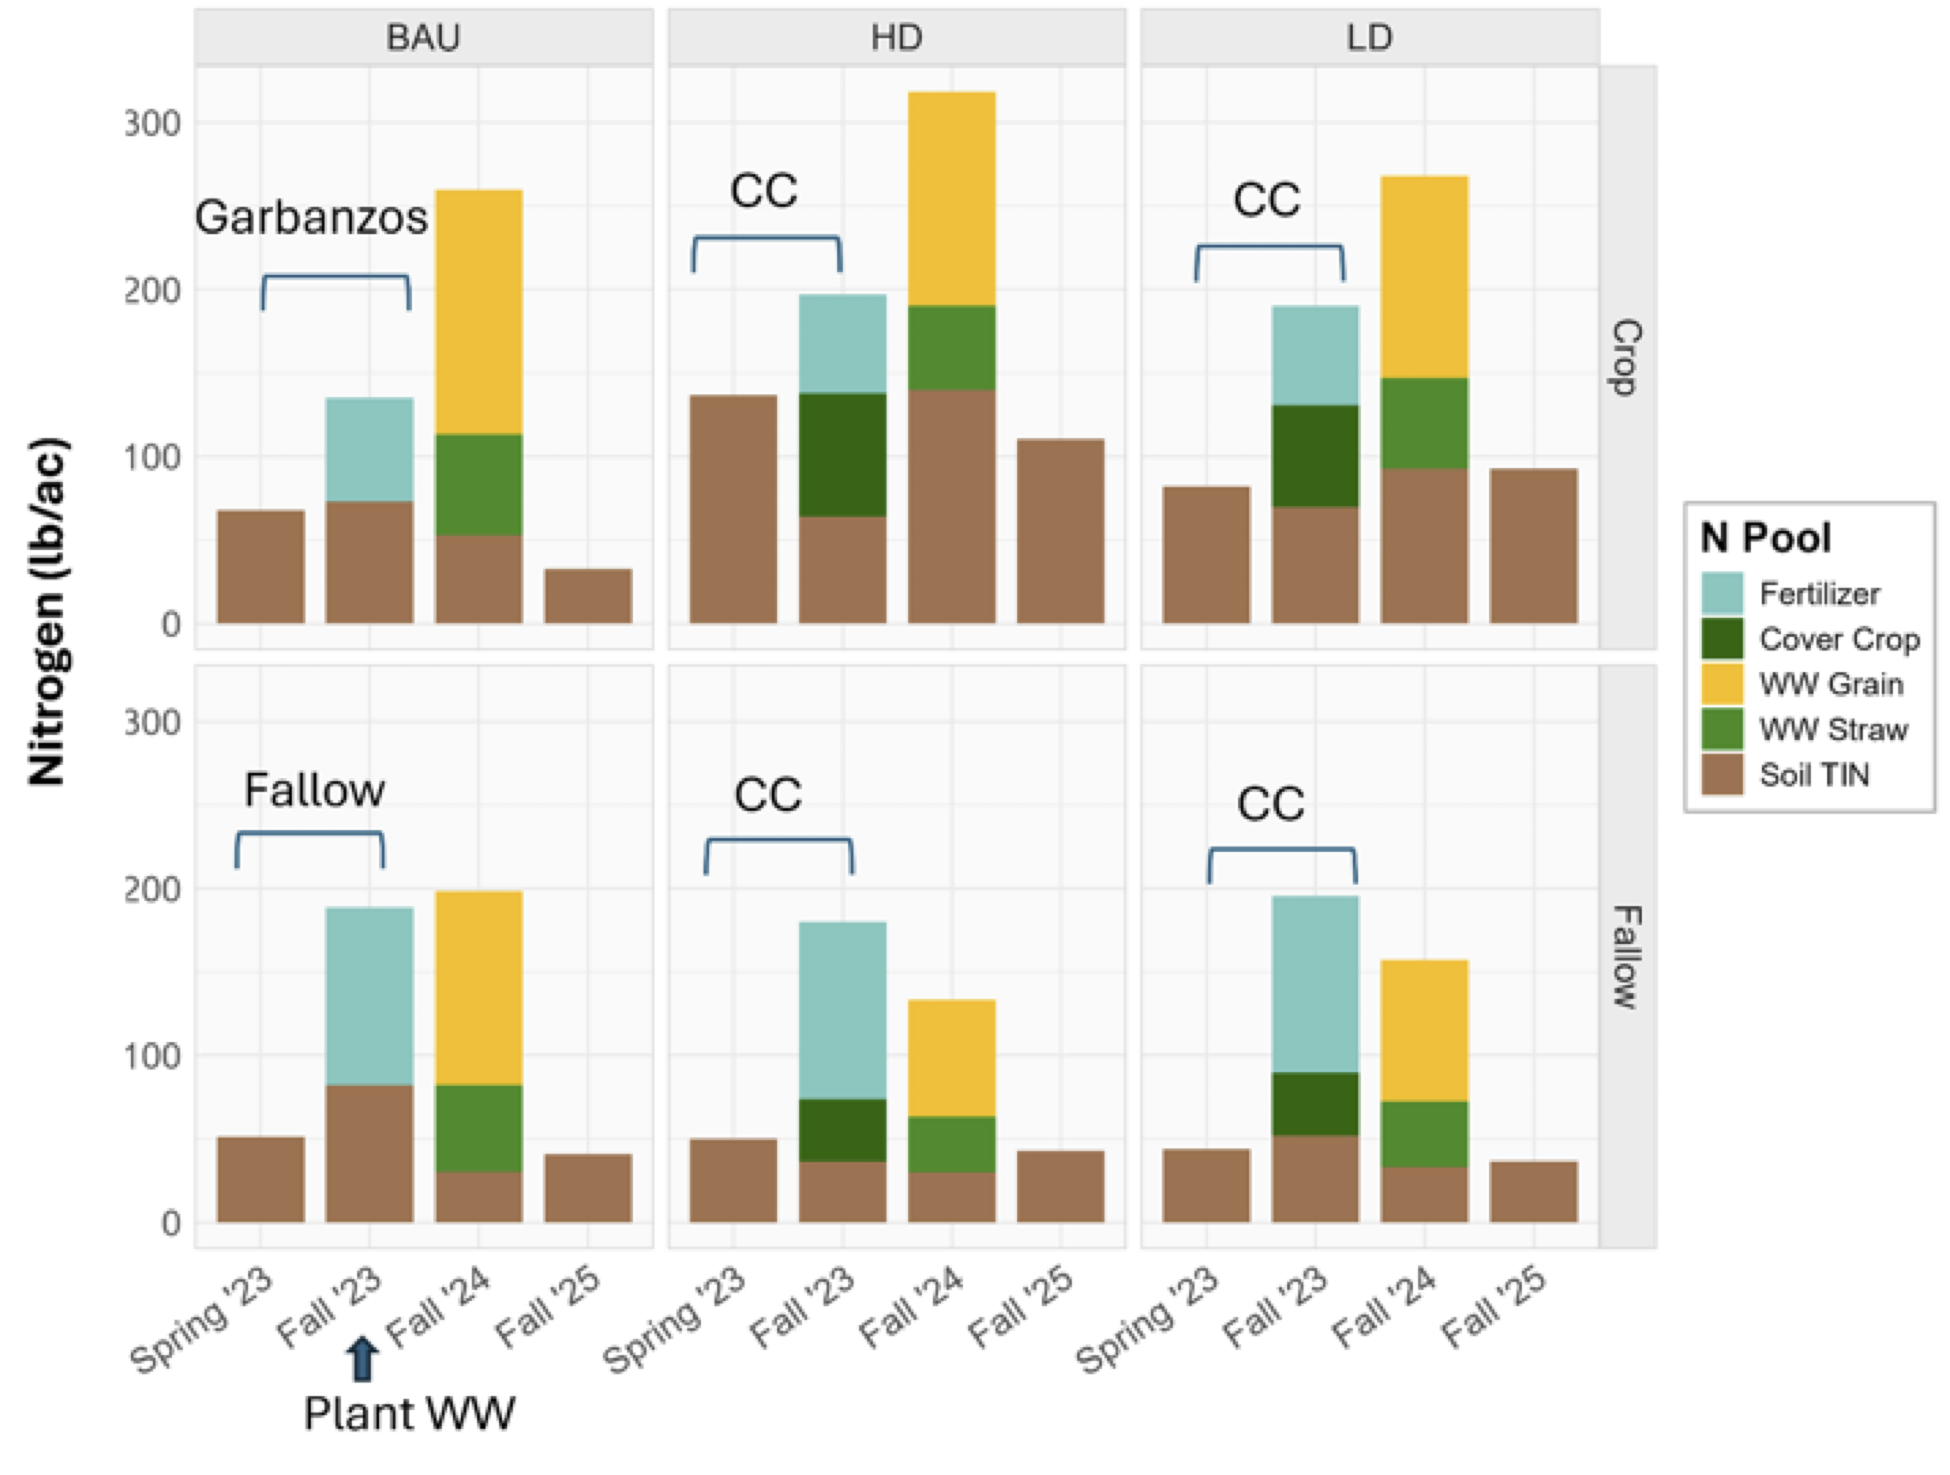
Potential effects of cover crop integration on N cycling can be assessed by examining N partitioning among cover crop biomass, crop residue ‘straw,’ harvested grain, and soil available N pools over time (Fig. 5). The total measured N storage at each of four sample dates are represented by stacked columns in Fig. 5 and the stack is partitioned among N pools. The difference in the height of the stacked bars from Spring 2023 to Fall 2023 shows the change in the total N storage during the growing season. Similarly, the difference between Fall 2023 and Fall 2024 shows change over the winter wheat crop year. There was a trend of increased N availability in the winter wheat following cover crops in Fall 2024, particularly comparing the soil TIN pools in the High Diversity treatment and BAU-crop treatment. In BAU-fallow sites (bottom row Fig. 5), total N storage was similar between fallow and cover crop fields in Fall 2023, although present only in the soil or fertilizer in fallow treatment, but also present in cover crop in those treatments. Here the cover crops reduce the soil available N pool that is susceptible to loss pathways over winter months, storing it in organic forms that may become available for future crops. This analysis tracks available forms of N cycling through crop and soil pools and indicates general trends of available N over time. Drivers of these fluctuations are the cover crop uptake combined with N temporary immobilization in the soil (which appears as a loss), and N additions through biological fixation, which are not captured explicitly in our measurements.
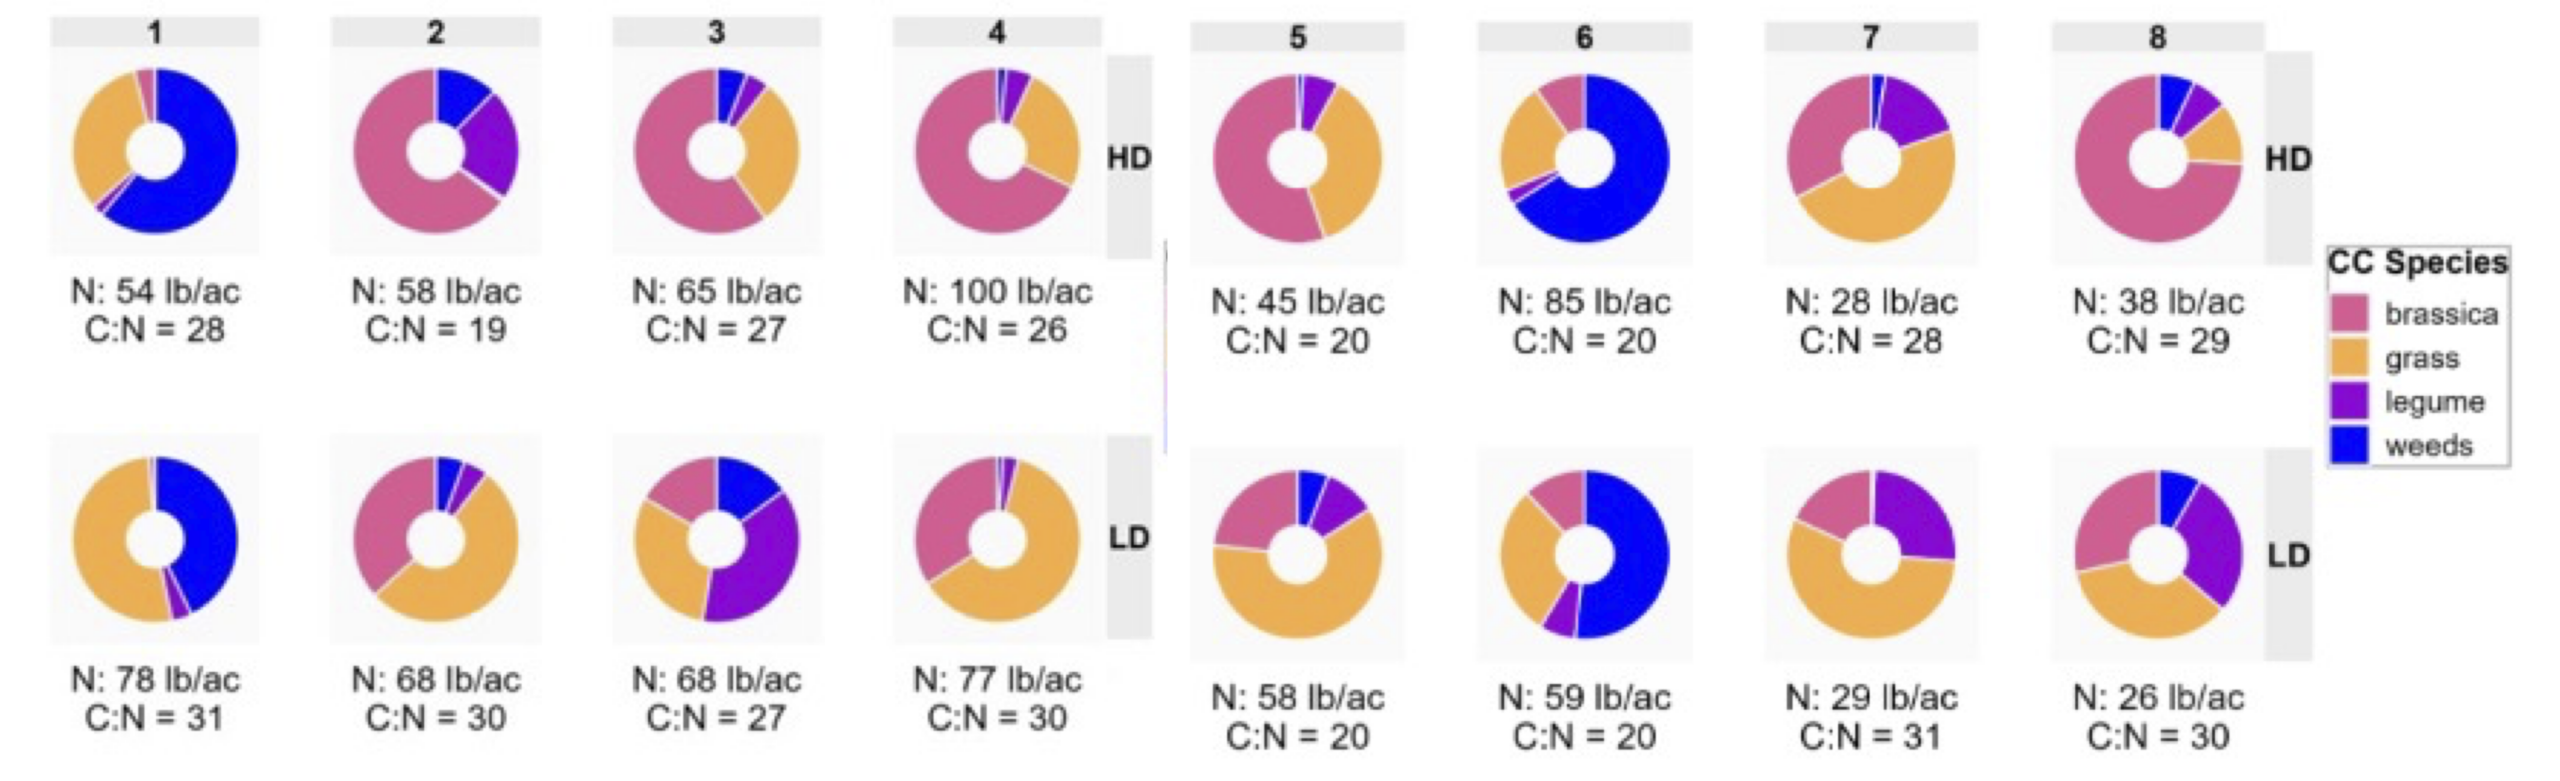
Nitrogen in the aboveground cover crop biomass ranged widely among sites in both zones. Representative data from TD2 only are presented here (Fig. 6). For TD2, nitrogen in above-ground cover crop biomass ranged between 54 and 100 lb/acre (average 70 lbs/acre) on AC sites and between 26 to 85 lb/acre (average 45 lb/acre) in the FT transition zone sites (Fig. 8). Above-ground cover crop nitrogen did not differ between HD and LD treatments in either zone. The C:N ratios in above ground cover crop biomass (data not shown) ranged from 20:1 to 30:1, which is within range to support microbial mineralization of this organic N, and is advantageous for nutrient cycling as compared with the typical C:N ratio in wheat biomass (>70:1).
Insect pressure and biodiversity
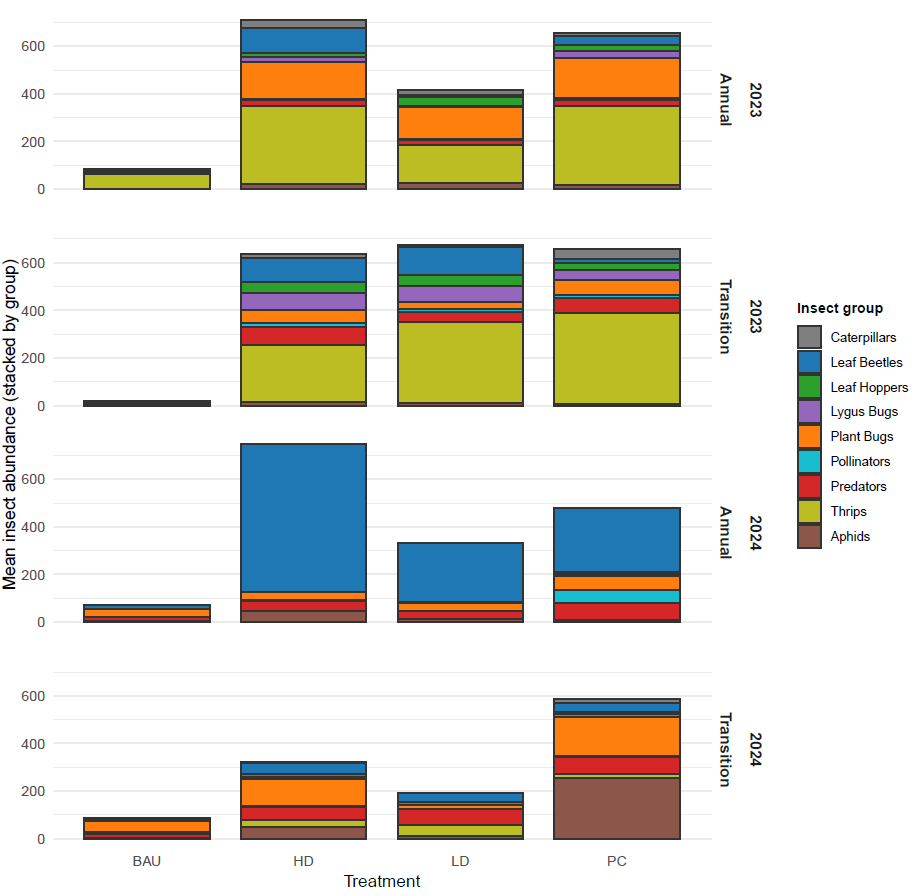
A total of 88,467 insect specimens was collected in 2023 from eight fields across three cover crop treatments and BAU plots (192 samples = 8 fields × 2 sampling dates × 12 plots). Common insect groups, although not considered major pests in the region, included thrips (42% of total specimens), plant bugs (Miridae; 16%), leaf beetles (Chrysomelidae; 9%), leafhoppers (Cicadellidae; 5%), lygus bugs (5.5%), and caterpillars (3%) (Fig. 7). Generalist predators such as spiders, lady beetles, big‑eyed bugs, minute pirate bugs, and damsel bugs accounted for 6% of the total, while pollinators (wasps and hoverflies) comprised 2%. Together, these groups represented more than 88% of all insects collected.
In 2024, a total of 27,393 specimens was collected from seven fields across the same set of cover crop treatments and BAU plots (84 samples = 7 fields × 1 sampling × 12 plots). The dominant insect groups shifted compared to 2023. Crucifer flea beetles were the most abundant group (37% of all specimens), followed by plant bugs (Miridae; 18%) and aphids (Aphididae; 15%), with thrips (Thysanoptera; 4%), lygus bugs (Miridae; 1%), and caterpillars (1%) comprising smaller proportions, unlike in 2023 (Fig. 7). Generalist predators accounted for 12% of the total catch, doubling their proportion of total abundance relative to 2023, while pollinators again made up approximately 2%. Collectively, these insect groups accounted for more than 90% of the specimens collected in 2024.
Across both years, insect abundance was consistently higher in cover crop plots relative to BAU fields (Fig. 7). In all years and zones except FT in 2023, insect abundance was greater in HD than in LD cover crops. Abundance was similar in PC and HD cover crops in 2023. In 2024, abundance in PC was less than in HD in the annual zone and greater than HD in the FT zone (Fig. 7). Insect diversity was greater overall in 2023 than in 2024. Different specific groups were abundant in each year, with thrips predominant in 2023 and leaf beetles in the annual zone in 2024. Most of these beetles were crucifer flea beetles in both years. Plant bugs were prominent in the annual zone in 2023 and the FT zone in 2024. Aphids were notably abundant in the fallow-transition zone in 2024. Abundances of generalist predators and pollinators did not differ between cover cropping treatments, although pollinators were noticeably more abundant in PC in the annual zone in 2024.
Cash crop yield following cover crops vs. following BAU
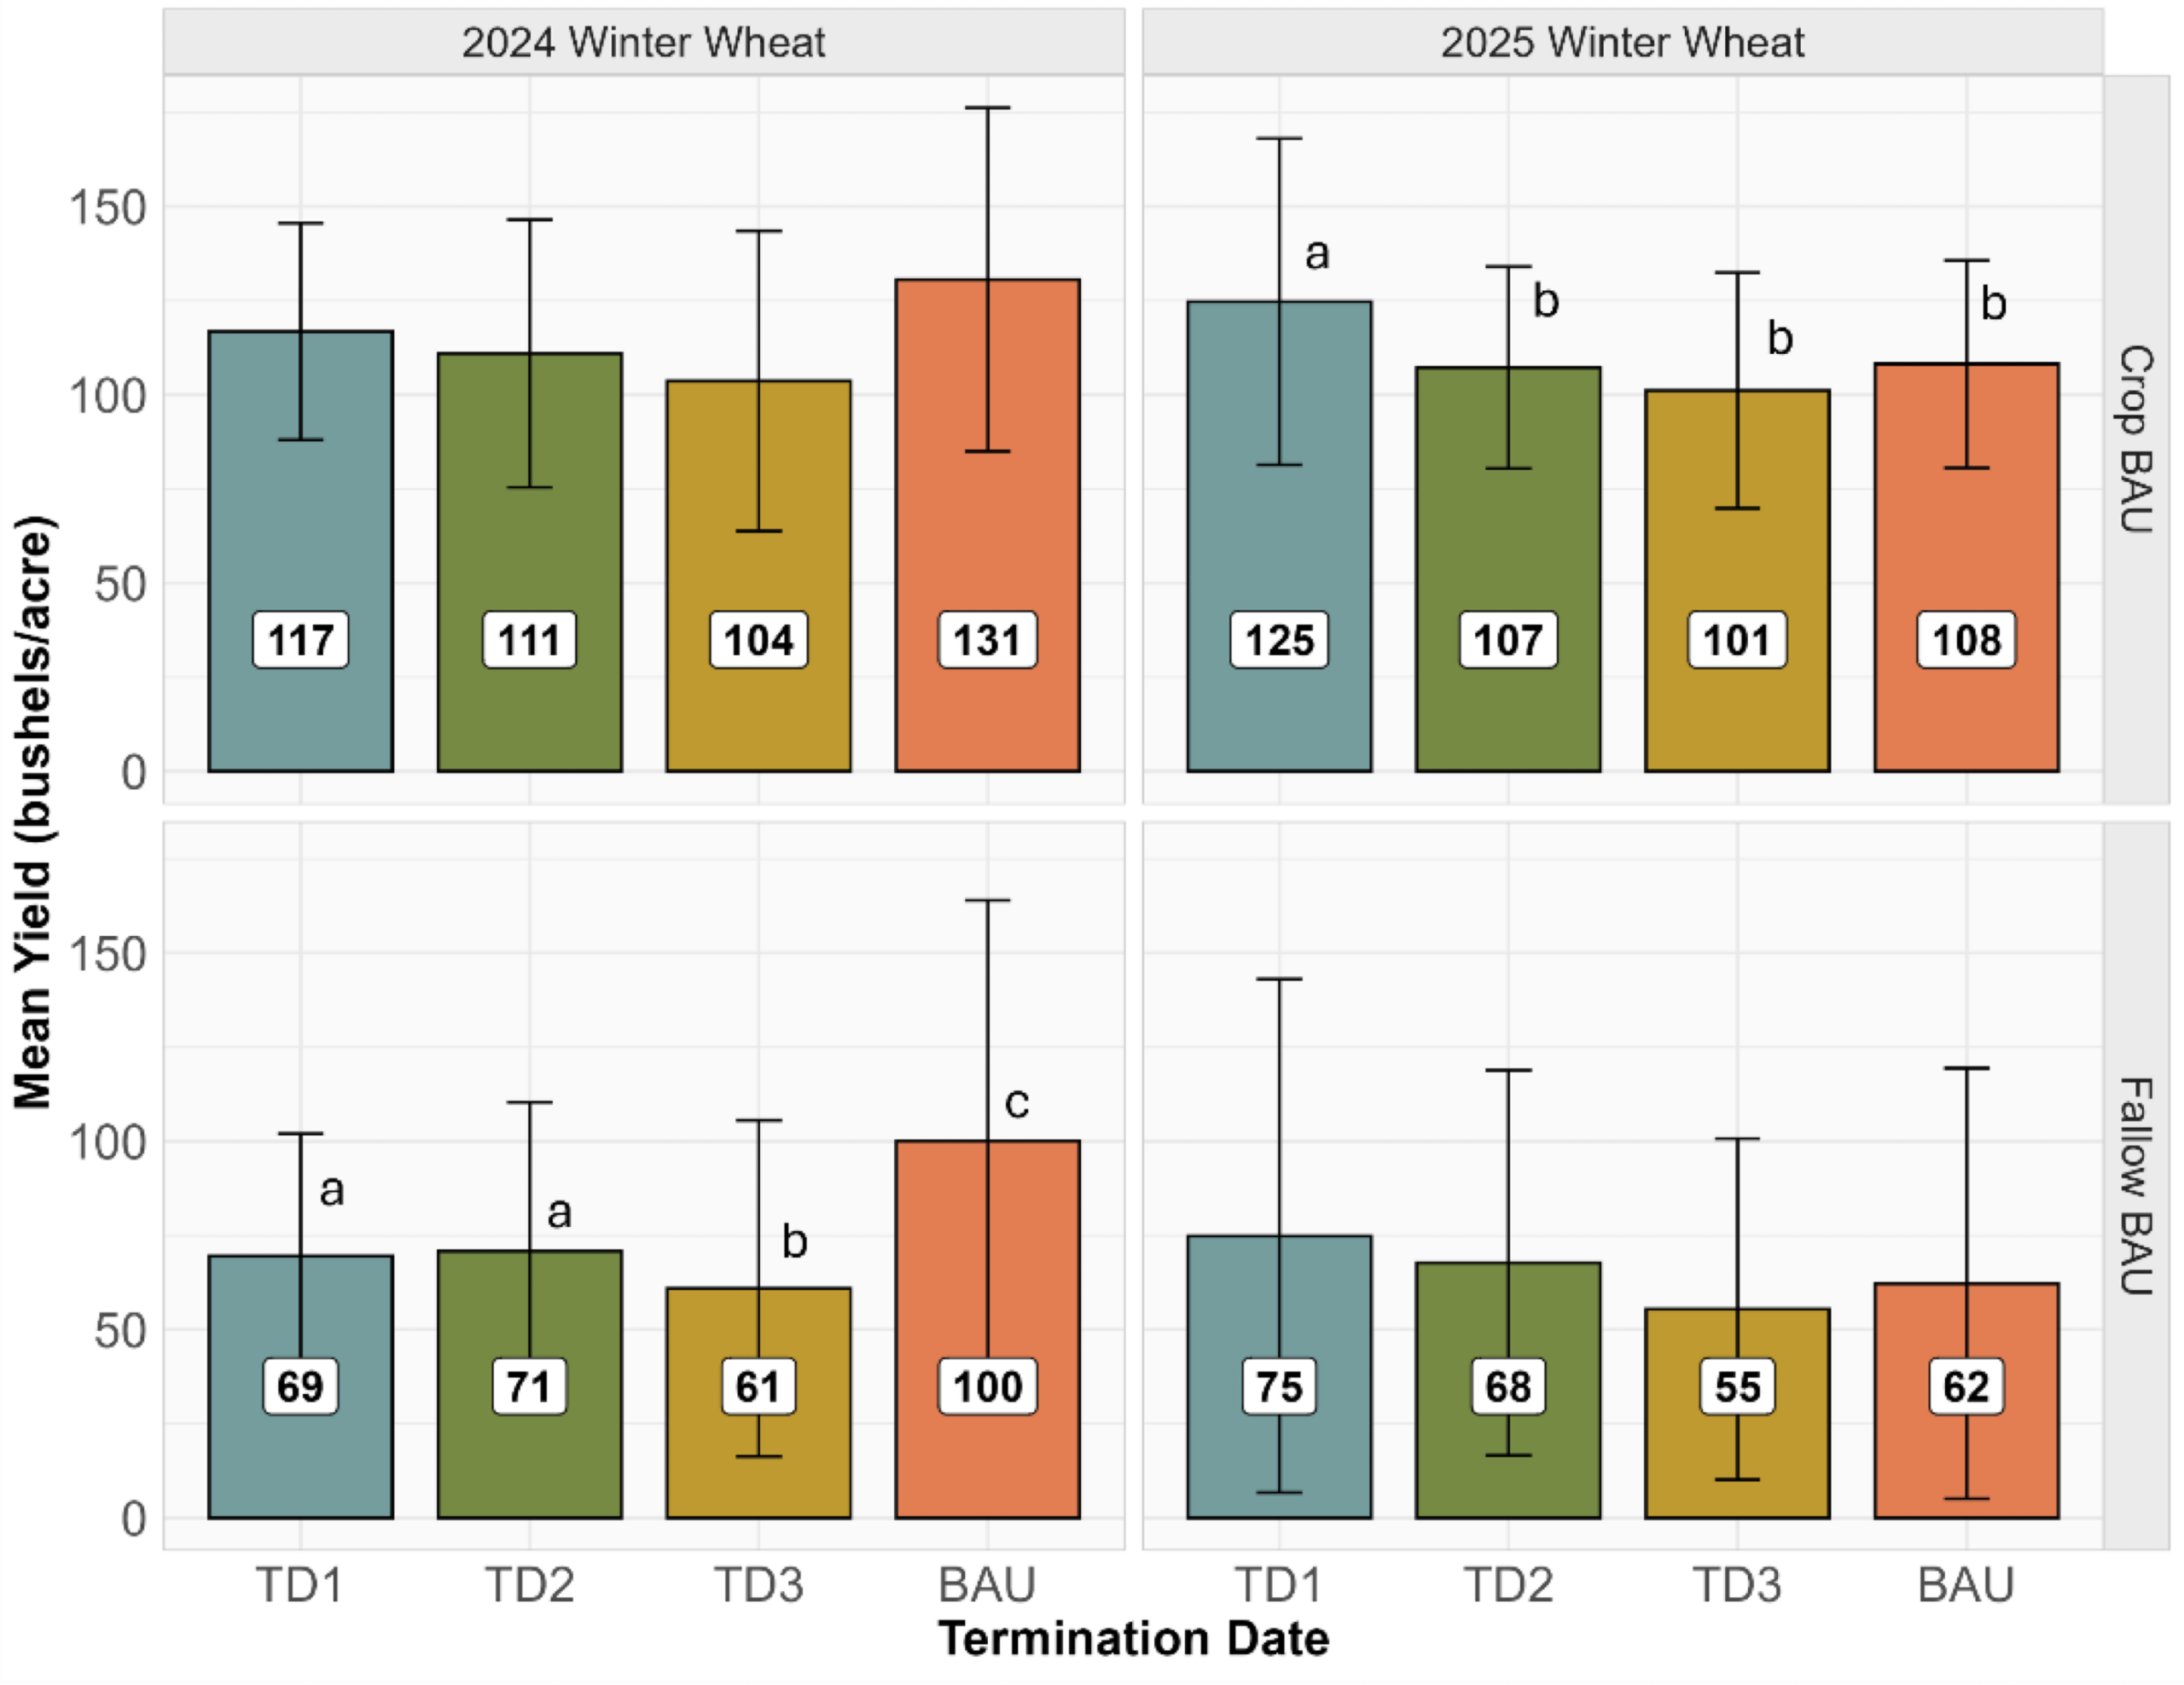
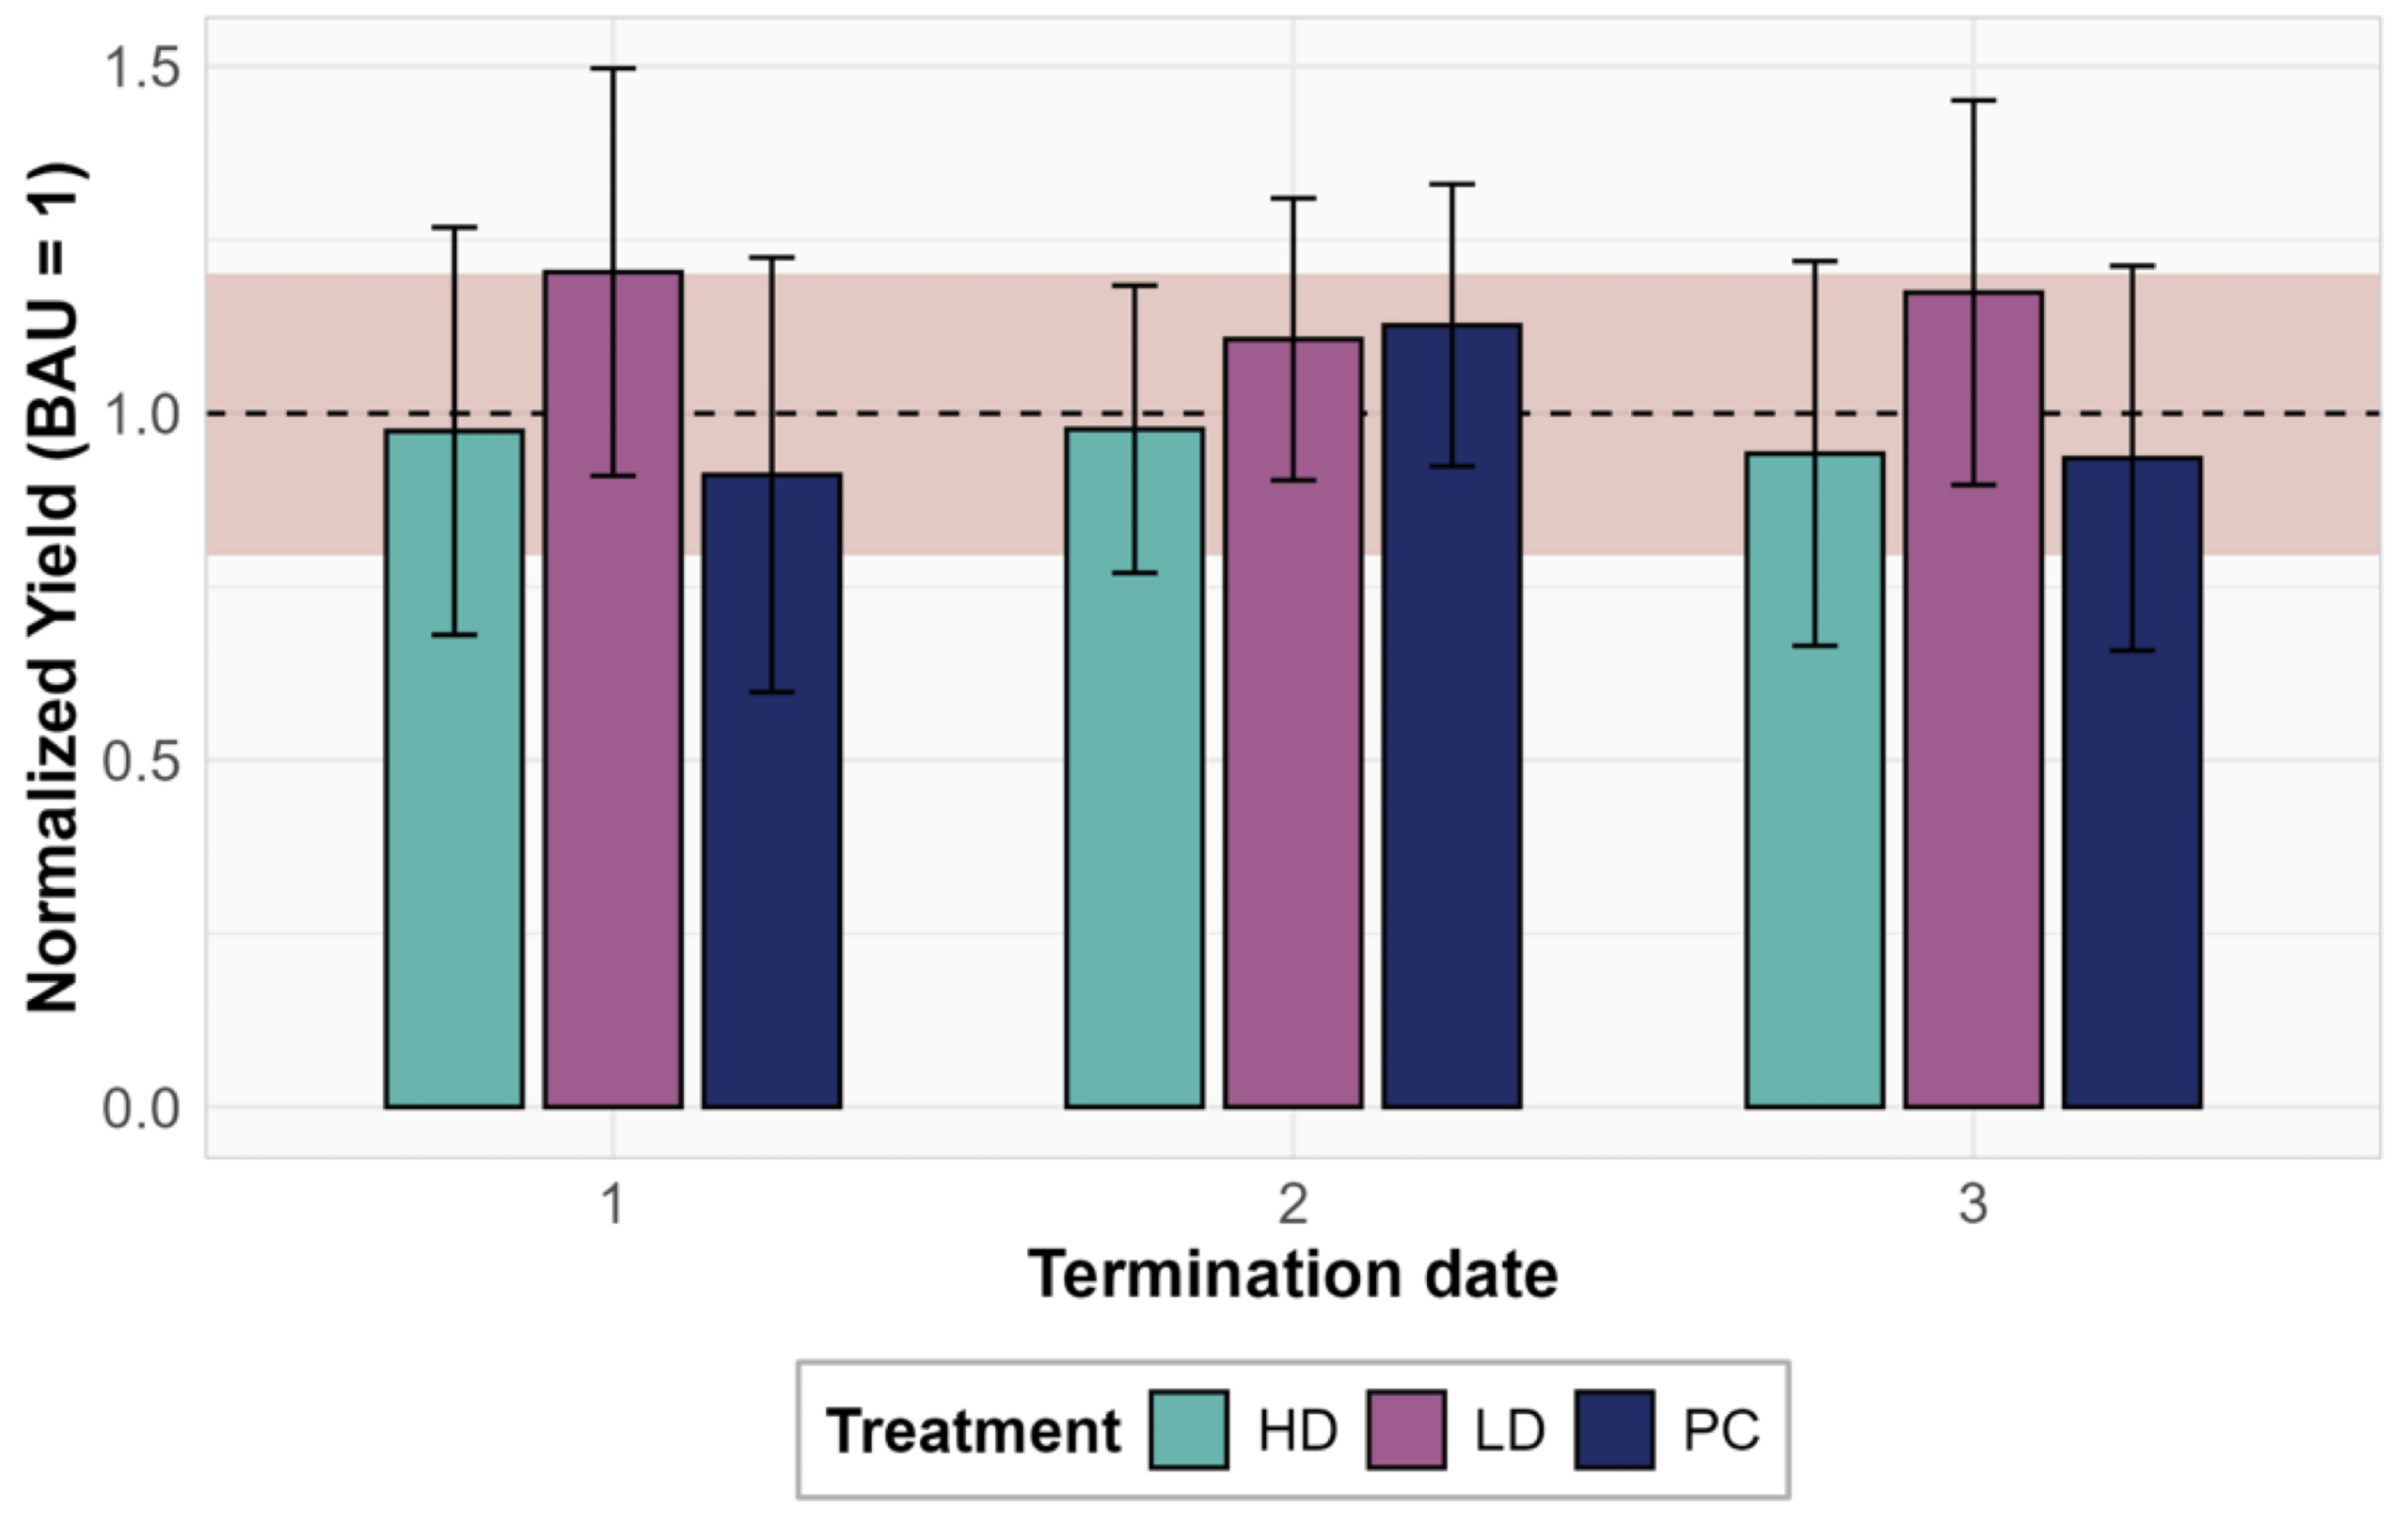
Performance of winter wheat following cover crops differed slightly and variably among cover crop treatments. At the 5 sites where the comparable BAU included a crop (primarily garbanzo’s in the AC zone), winter wheat grain yield did not differ between BAU and any cover crop TD in 2024 (Fig. 8) and was slightly and significantly greater in TD1 than BAU in 2025. At the 3 sites where BAU was summer fallow (in the FT zone), winter wheat yield following fallow exceeded yield following cover crops at all three TDs in 2024. There was no difference in winter wheat yield in 2025 following any of the treatments at the three sites compared to BAU fallow (Fig. 8).
Crop yield two years following cover crops were not different from BAU yield suggesting the legacy impact of cover crops on yield did not extend beyond one year (Fig. 9). This was only measured in 2025 for the 2023 cover crop treatments. Wheat was planted in 2025 over the 2024 cover crop plots, but evaluation of the legacy effect will be after the termination of this project.
Objective 1 Conclusions
- Above-ground cover crop biomass in both zones and years increased with TD, so without considering soil moisture (Objective 2), or potential for cover crop reseeding, longer growth before termination allowed more cover crop biomass to accumulate. This pattern was evident regardless of the cover crop mixture. Brassicas and grasses contributed most to cover crop biomass.
- In systems with fallow for BAU, inorganic N storage in soil following fallow was similar to inorganic N storage in soil plus the aboveground cover crop biomass, demonstrating the cover crop capacity to store N in less mobile forms going into winter months. After winter wheat harvest the following year, N storage (soil and crop N) declined following the cover crop treatments compared to following BAU-fallow. Cover crops appear to reduce soil available N but some of this will be stored in organic forms not accessible to leaching but that may become available for future crops.
- Insects are more abundant in cover crops than in BAU treatments. The increased abundance includes pests but also beneficial groups, pollinators and predators. Overall, these findings highlight the potential value of diverse cover‑crop mixtures supporting insect communities, particularly the beneficial insects such as predators and pollinators.
- Effects of cover cropping on follow-on wheat yields was variable imposing a non-significant penalty in following the 2023 cover crops but no effect on yield after the 2024 cover crops in either zone.
Objective 2
Effects of treatments in Objective 1 on soil moisture profiles
At the AC sites, the effect of termination date on effective soil water depth varied by farm (Fig. 10a). At Farm 1 (F1), soil water recharge was faster in both TD2 and TD3 than BAU at the end of the 2023 growing season, whereas at Farm 3 (F3), cover crops terminated at TD3 used more water during the 2023 growing season and took longer to recharge over the winter than TD2 and BAU. In the Transition Fallow zone at the Cloverland sites Farms 5 and 6 (F5-F6, the driest region), there was more soil water stored in the BAU-fallow, compared to the cover crop plots throughout the 2023 growing season, and into winter months, with the most clear treatment effects between TD2 and TD3 at F6 (Fig. 10b). At the St. John sites, Farms 7 and 8 (F7-F8), cover crop affect on effective soil water depth was only observed at F7, where cover crops terminated at both TD2 and TD3 used similar amounts of soil water, leaving approximately 2 inches or less soil water compared to the quantity stored in BAU-fallow. This difference persisted until February of 2024, throughout the beginning months of winter wheat growth.

Effects of treatments in Objective 1 on soil physical properties - penetration resistance
Penetration resistance (PR) was measured in 0-45 cm soil in April-May of winter wheat crops in 2024 and 2025. There were no differences in PR averaged over the 0-45cm soil depth, or 0-15cm soil depths among treatments compared to BAU. More specific depth comparisons throughout the profile will be investigated before including results in final publications.
Infiltration was measured in late summer 2023 following cover crop treatments at one AC and one FT site, using both a single ring infiltrometer and an automated duel head infiltrometer (Saturo, Meter group). Due to time limitations, no additional infiltration measurements were taken. Average infiltration trended higher following cover crop treatments compared to BAU, but results were highly variable.
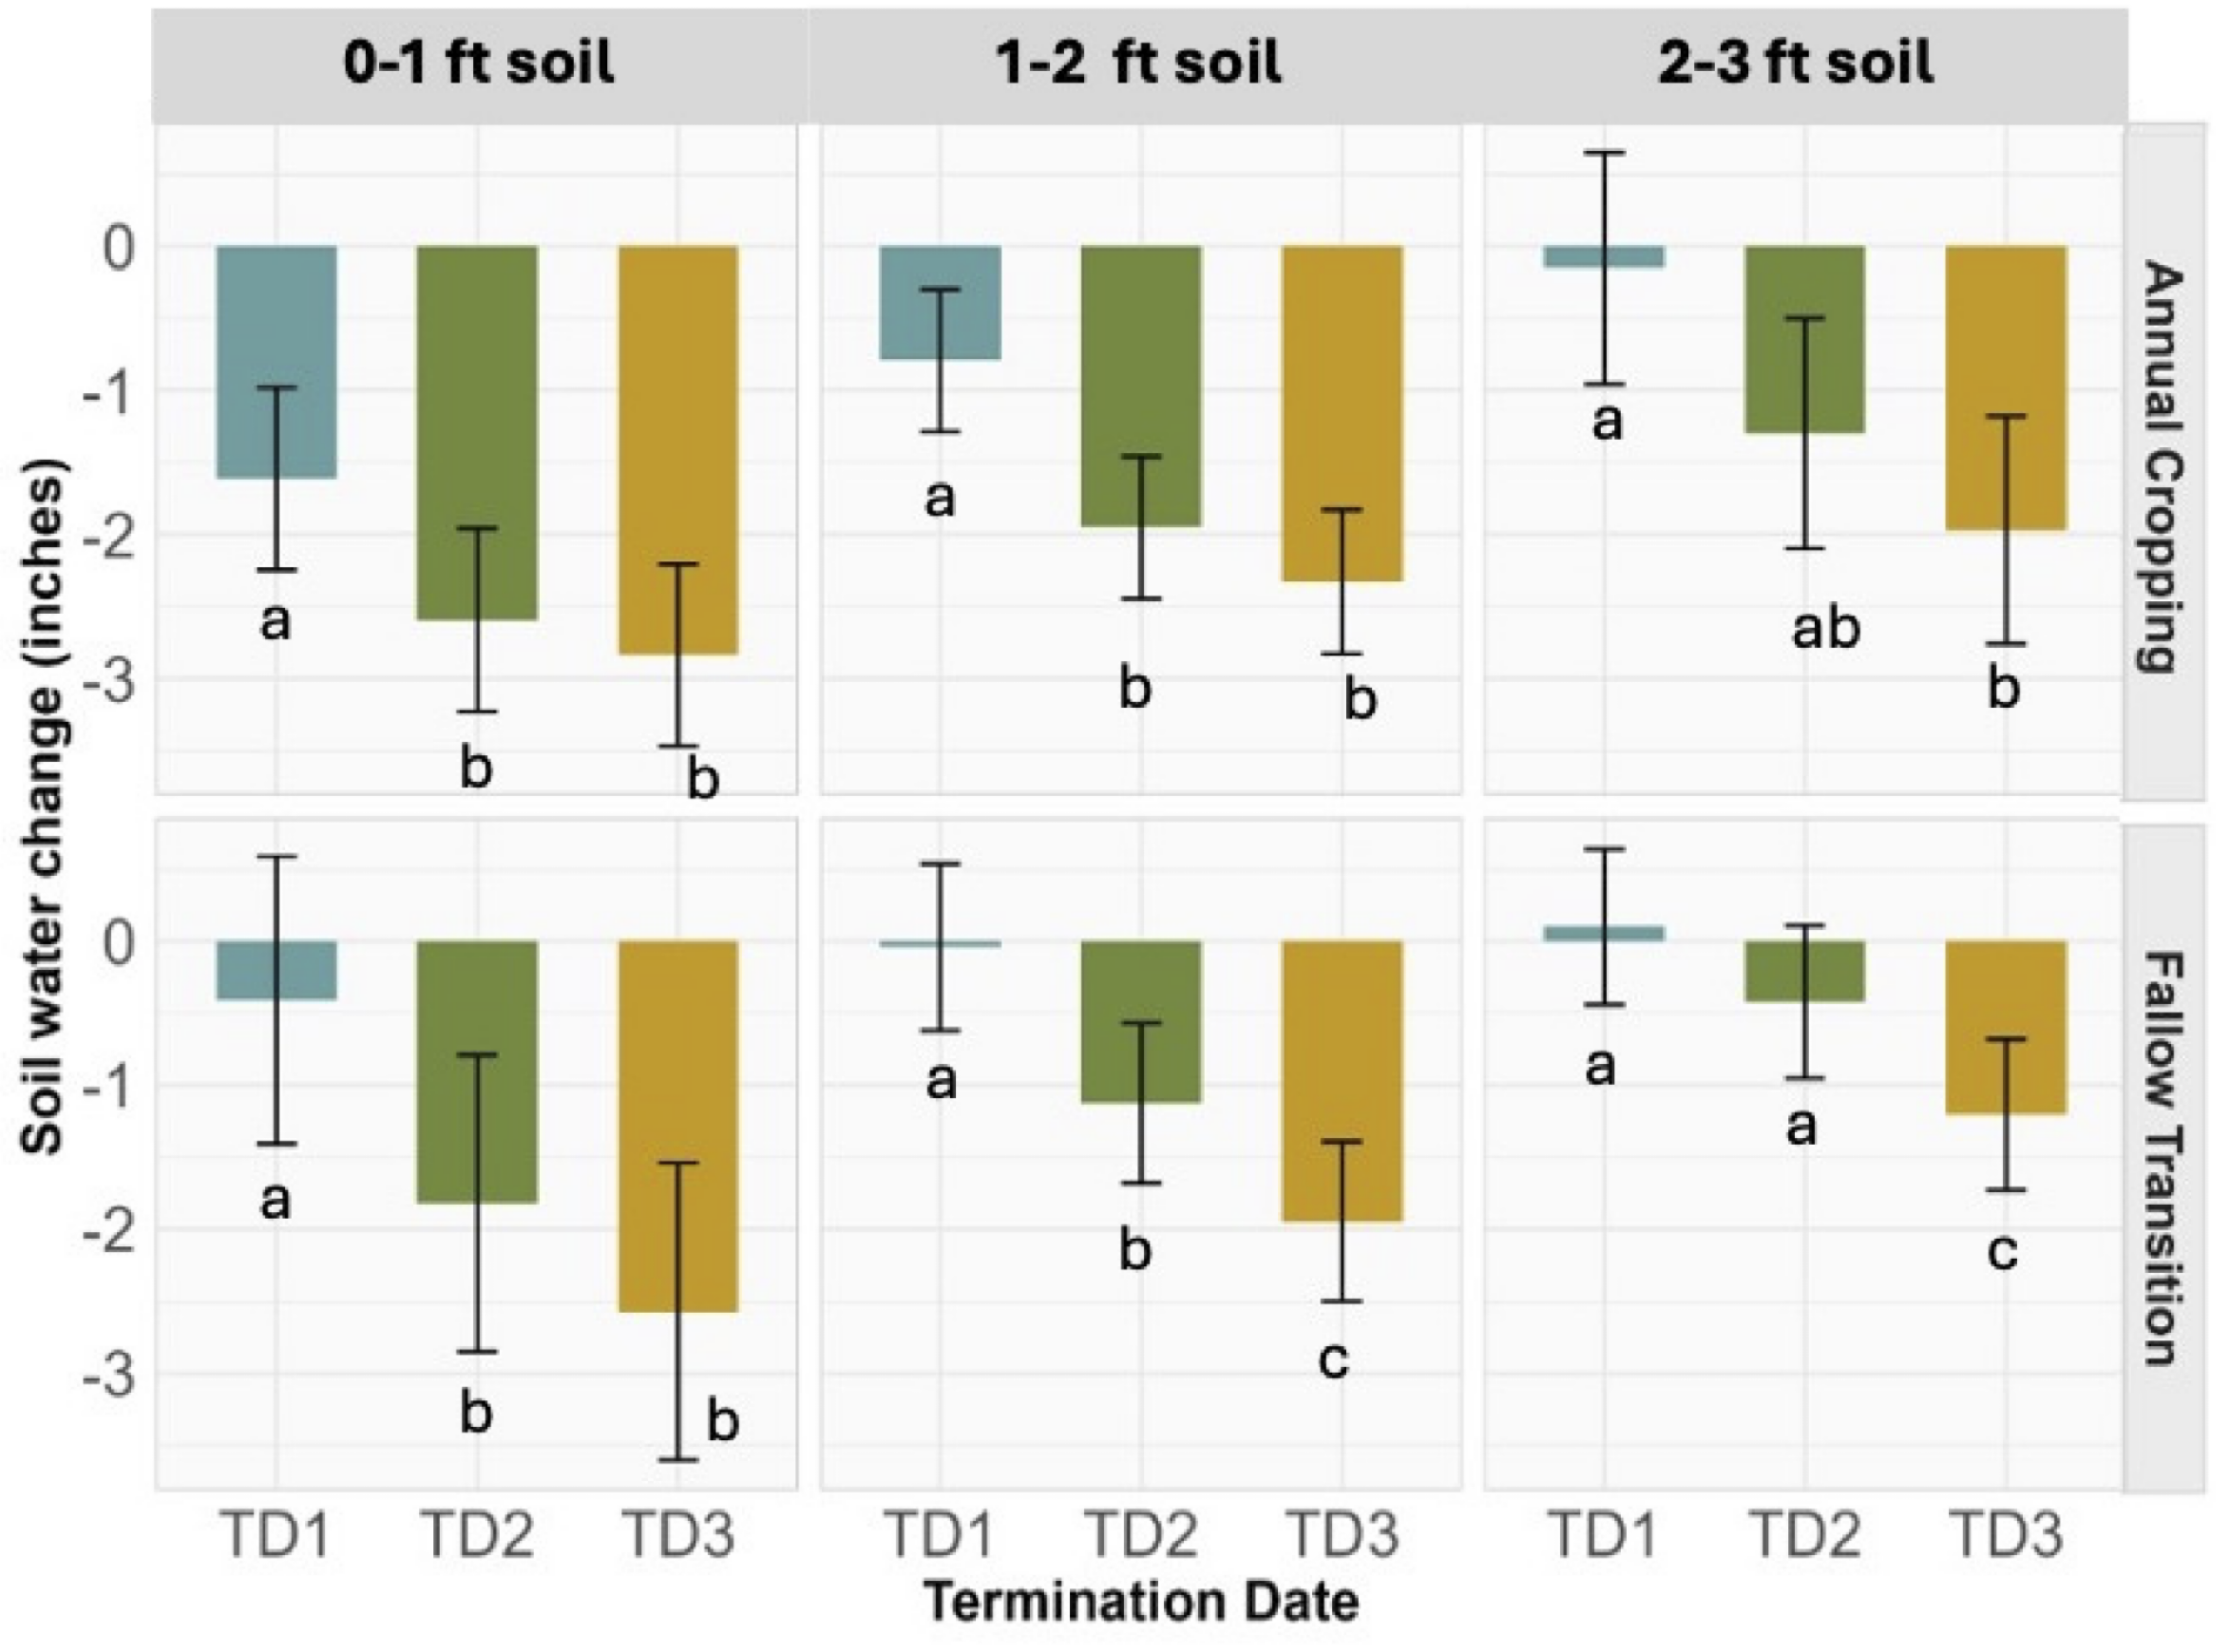
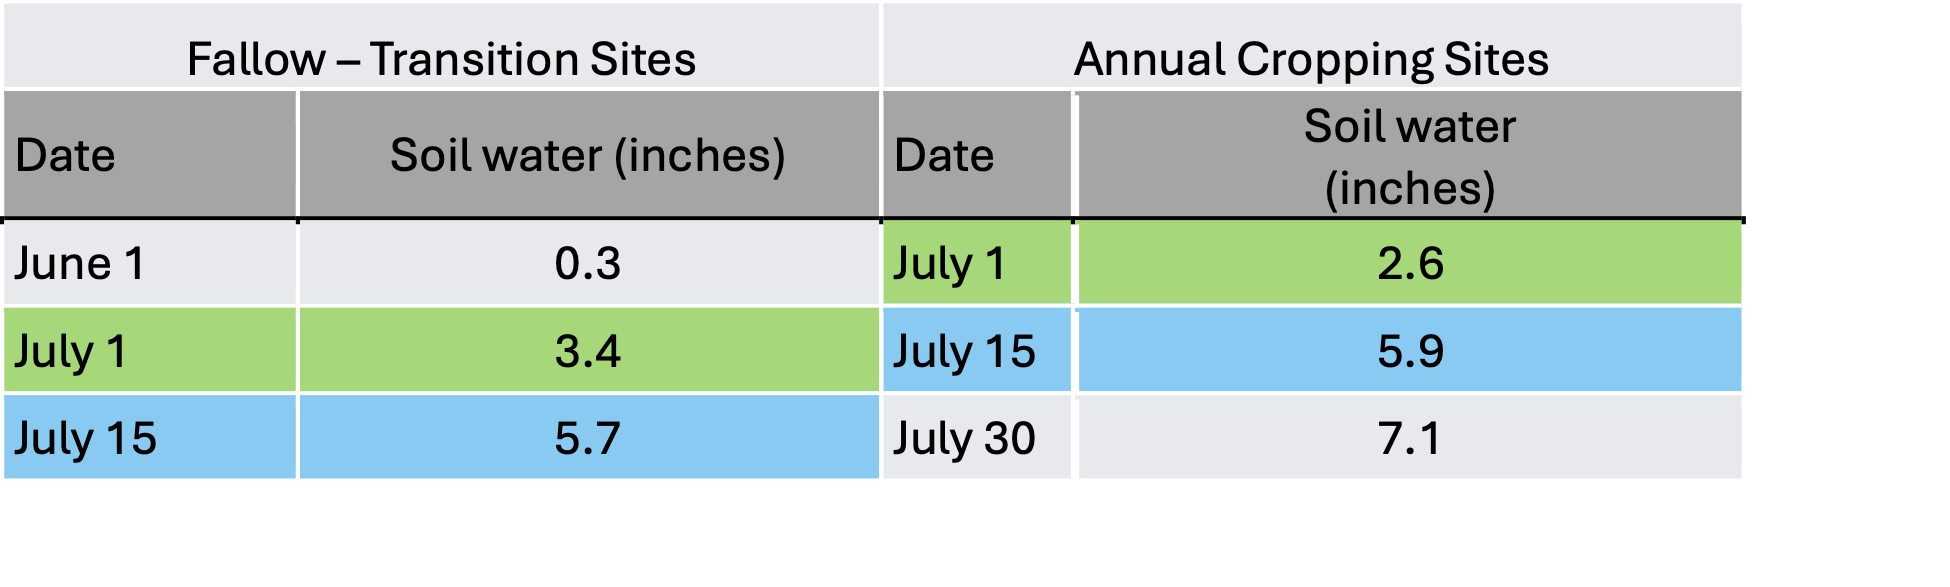
Soil water use by cover crops increased with later termination dates at all soil depths measured (Figure 11) although significance of differences varied. In the top 1 ft of soil, soil water use for TD 1 was significantly less than for TD2 and TD3 in both the AC and FT zones. TD2 and TD3 only differed significantly from one another in the top 1-2 ft in the FT zone. At 2-3 foot soil depth, TD1 differed significantly only from TD3 and not from TD2. Average soil water use in the entire profile followed the same trend (Table 1). On sites in the FT zone, TD1 on June 1 used very little soil water (mean of 0.3 inches), while the second termination date (around July 1) used a mean of 3.4 inches of soil water. On sites in the AC zone, a similar trend was observed with the overall greater soil water prevalent in that zone. In both zones, the preferred TD by grower Co-PI’s was near July 1, maximizing cover crop growth before maturation and self-seeding (green cells in Table 4).
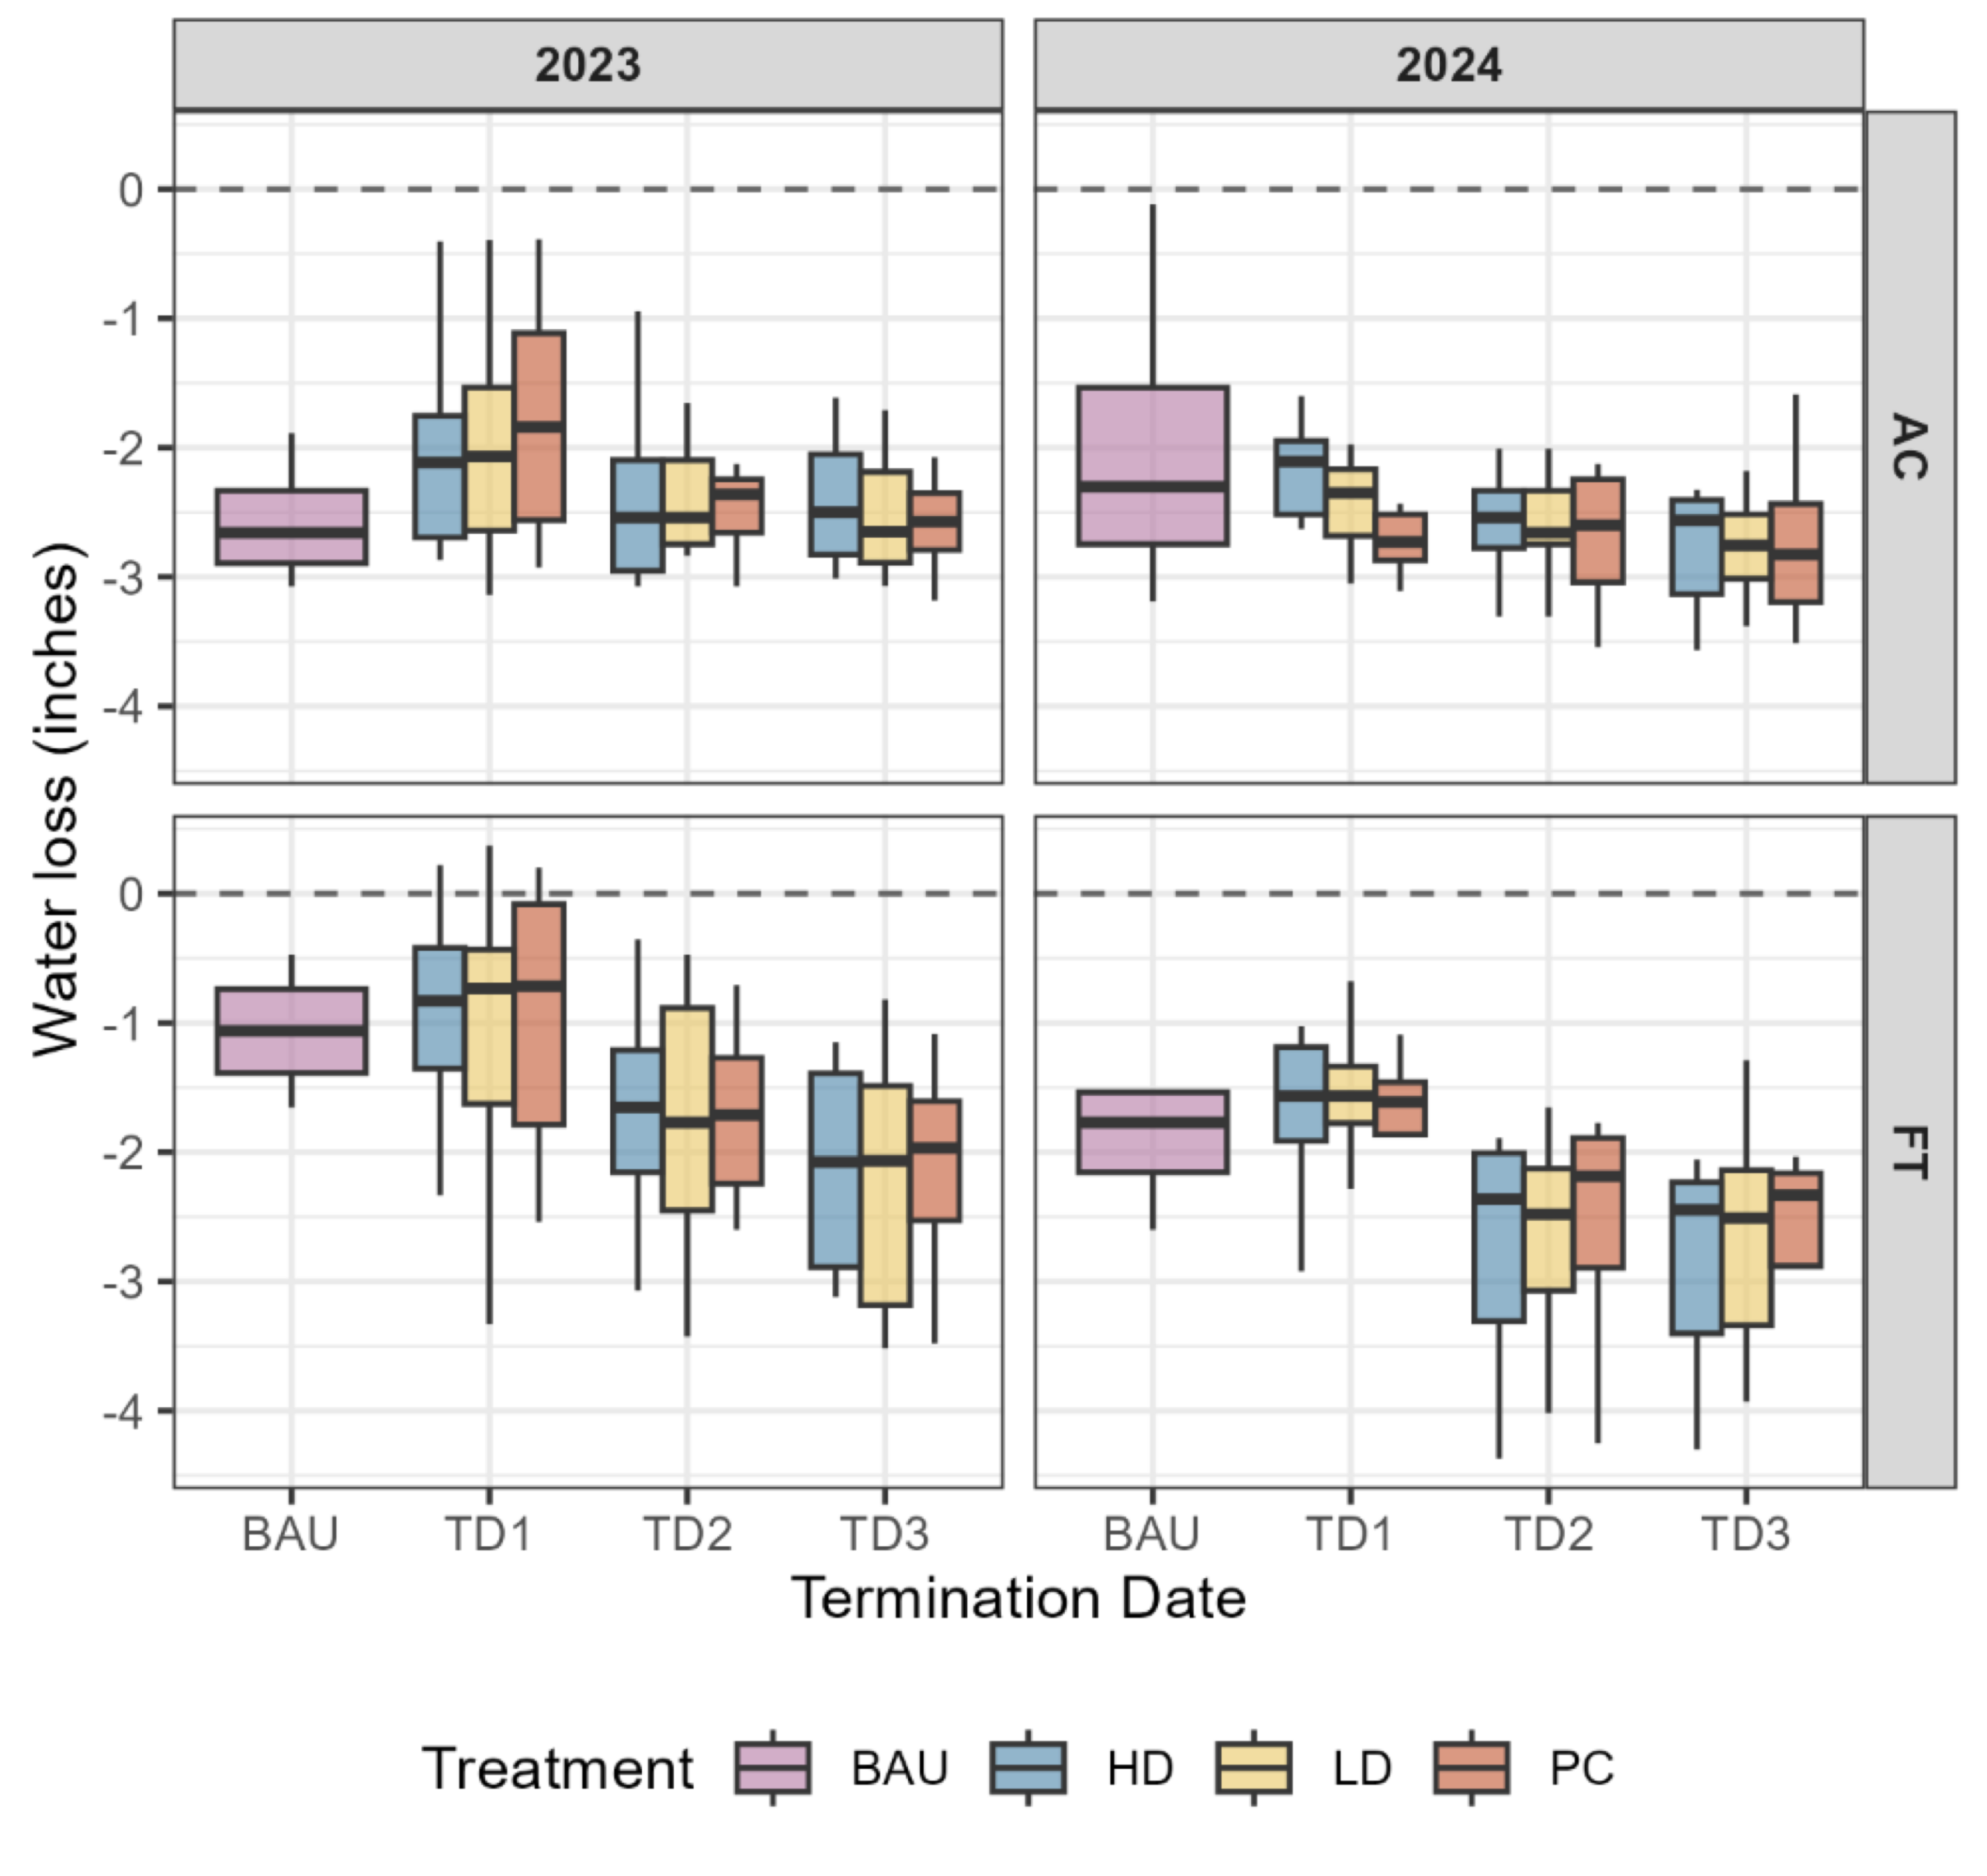
At sites in the AC zone in both years, there was little difference in water use among cover crop types and as compared with BAU (garbanzo bean) (Fig. 12). At sites in the FT zone in both years, there was little difference in water use among cover crop types and as compared with BAU (summer-fallow) water use by cover crops terminated at TD1, while water use by cover crops terminated at TD2 and TD3 was ~ 1 inch more than BAU (Fig. 12).
Objective 2 Conclusions
- In the more water limited areas (FT sites), TD2 provided the best balance between producing substantial cover crop biomass and minimizing water loss compared to fallow.
- In the Annual Cropping sites, TD2 was also the optimal timing (though occurred generally 2 weeks later than FT sites) for producing cover crop biomass with low CN ratio and not risking mature seed development.
- In one of the study years, later termination date corresponded to further reductions in following winter wheat yield, indicating that earlier termination dates are an effective method for moderating soil water storage and the impacts to cash crop yield. Cover crop replacement of fallow resulted in drier soils during fall winter wheat planting, but by mid-winter, soil moisture was generally similar among cover crop and fallow treatments (data not shown).
- 2025 winter wheat yields were low in general due to dry summer growing conditions, but preceeding cover crop treatments did not reduce yields compared to preceeding summer fallow.
- Cover crop diversity did not impact cover crop N uptake, or following winter wheat yield. A simple 3-way mix may provide an economical option for growers interested in cover crops to gain nutrient cycling and soil health benefits.
Research outcomes
Overall recommendations for sustainable agricultural productivity going forward are summarized here and were also provided in a non-technical summary developed for the project's target audience.
- Termination timing of spring cover crops matters more than cover crop diversity for balancing biomass production and soil water use.
- Mid-season termination (around early July, varying by zone) provided the best balance between biomass production and manageable soil water use.
- Termination timing is best determined on average growth stage across species to optimize growth while avoiding development of mature seed.
-
Following wheat crop yields were generally unaffected by cover crop, though decreases were observed in TD3 in some instances in the low rainfall areas.
- Soil N levels were either unaffected or enhanced by cover crops
- Cover crops, particularly high diversity mix, host more abundant and diverse insects than BAU.
- Next phase priorities
- Evaluate fall-planted cover crops
- Expand research on soil biological processes and diversity including arthropods
- Refine termination timing tools
- Continue PaNDAS decision support platform development
These next phase priorities were developed by scientists and producer co-PIs in a final assessment of the project. Members of this team, including all of the producer co-PIs will be seeking funding to pursue these priorities. Since this project was funded with the possibility of continuation through Western SARE, a proposal is being developed for that purpose. In addition, given the interest in learning more about fall-seeded cover crops, the producer co-PIs for this project have planted fall-seeded cover crops in 2025 to enable the needed research should funding be obtained.
Education and Outreach
Participation summary:
Objective 3
The project developed decision support resources for producers adopting cover crops in PNW cereal systems. The methods for achieving this included creating a website with vetted resources for cover crop adopters, including outputs from this project. The website is designed as a continuing asset to support cover crop management and adoption beyond the project. Project scientists and University of Idaho computing resources personnel contributed. The website was reviewed and revised in response to producer co-PI inputs. The project and its findings were also shared at field days, cereal schools, and grower symposia throughout the project. To understand the barriers and motivations for cover crop adoption, the project has had a social component in which participating producers were interviewed to determine their views on cover cropping, perceived barriers to adoption and challenges to implementing cover cropping in the cereal production systems of the inland PNW. In Dec. 2022, a semi-structured interview guide was designed with open-ended questions around: each operation context, producers' previous experiences with cover crops, expectations on the WSARE research project, cover crops benefits and concerns, and ideas for scaling up cover crop adoption in the inland Pacific Northwest. Follow-up surveys were conducted until the project's conclusion.
Initial Interviews and Survey
The 8 in-person interviews were performed between December 2022 and January 2023. Each interview lasted approximately 1 hour, totaling 8h40m of content recorded. The 33-page report consists primarily of extracted quotes from subjects on a range of topics pertaining to cover cropping.
- Perceived benefits of cover crops
- Cover crop concerns
- Livestock on cover crops
- Producer expectations related to WSARE project
- Needs for scaling up cover crop in the inland Pacific Northwest
Palouse Alternative Cropping Symposia, 2023-2025
2023 - Palouse Alternative Cropping Symposium held on Feb. 24, in Colfax Washington. A presentation and data -gathering activity were conducted as a component of the Approximately 40 producers and 20 other persons were in attendance. These participants were provided with a quick overview of the interview based document followed by a data gathering activity using Menti-meter and prompts to garner views on cover crop challenges and benefits. Prompts included:
- How do you rate each of the following factors as a ‘+’ to ‘-‘ tradeoff you would (or are) experience by using cover crops?
- Which of the following best describes your view on the relation of livestock to cover cropping for this region?
- What factors need to be in the economic equation to assess cover crops? (7 words or less)
- How could your community benefit from expanding the use of cover crops?
- In your view, when do you expect to be the best time during the crop year to BOTH plant AND terminate a cover crop? (choose one)
2024 - Palouse Alternative Cropping Symposium held on Feb. 22 in Colfax WA - Preliminary results and lesson’s learned from the 2023 season were shared by project members Kendall Kahl and Subodh Adhikari. Other project members and participants were there and engaged in discussions with stakeholders. The PACS had 70 participants: 15 producers and 55 from industry, agencies, the general public.
2025 - Palouse Alternative Cropping Symposium held on Feb. 27, in Colfax Washington. One project researcher and one grower-PI presented on "Impacts of cover crop mix and termination date on following cash crop". Presenters: Camilla Ditton and Bruce Petty. Audience - 100 participants, including growers, ag professionals, agency, and University employees. During the 2025 PACS, seven of the projects producer co-PIs met with researchers to refine plans for the 2025 field season and consider possible research questions for a continuation of this project.
Palouse Conservation District/University of Idaho Extension Soil Health and Cropping Systems Tours
2024 - Soil Health and Cropping Systems Tour, June 24 - Project members contributed to a presentation at one of the project's on-farm trials. A brochure is attached. Kendal Kahl and Subodh Adhikari, project PIs at the University of Idaho and Frank Wolf, producer project co-PI presented at project research site on Wolf's farm.
2025 - Soil Health and Cropping Systems Tour, June 25 - Project members Kendall Kahl and Cami Ditton contributed to a presentation that highlighted results from two of the cover crop plot trials. The tour had 75 participants: 13 producers and 62 from industry, agencies, and the general public.
University of Idaho Extension Cereal Schools
2025 - Summary results of PaNDSAS research activities were presented at three locations in northern Idaho between January 27-29 at Greencreek, Lewiston and Bonners Fery, ID by PI Subodh Adhikari & project member Cami Ditton through a presentation titled “Spring Cover Crop Effects On Weeds, Insects And Crop Production In Pacific”. One hundred and twelve producers and agricultural industry professionals attended.
2026 - Presentations with the title "WSARE Pacific Northwest Cover Crop Decision Aid System" with information about effects of cover crop mixes and termination dates on soil moisture, insects and weeds were made at Cereal Schools in northern Idaho: Greencreek ID, Jan. 27, Lewiston ID, Jan 28, Bonners Ferry ID, Jan. 31.
Pacific Northwest Direct Seeders Association Cropping Systems Conference Break-Out Session 2026
The PaNDAS project was invited to make presentation at the 2026 Cropping Systems Conference in Kennewick WA on January 13, 2026. Project member Kendall Kahl presented, “Does Cover Cropping Help our Cropping System in the Northwest” and led a PaNDAS producer panel including growers Mark Greene, Clint Zenner and Doug Schuster before an audience of 120 conference attendees.
Website
A website was created that houses a resource hub for cover cropping in the inland PNW, a synopsis of the project design and objectives, a link to a page with project updates, a link to a registration to enter a discussion board with threads on cover cropping issues, currently: "Seeding spring cover crops"; "Diversifying farm operations", "Cover cropping", "Other topics for the project". This website was stood up and beta tested during early 2023, after which it was fully activated. It has been operational since early February 2023. In 2025, the website underwent a redesign based on feedback from project personnel, producer co-PIs, and users. The site’s vetted resources on cover cropping and portions of our WSARE annual report have been posted there. A final non-technical summary of project findings was posted. Anticipating continued work on this resource, a project logo was designed and added to the site.
Podcasts
Two episodes of researcher and grower collaborators experience with PaNDAS project have been recorded and links are provided as outputs as part of this report. One episode features a conversation with researcher Subodh Adhikari and producer Frank Wolk, and the other features researcher Kendall Kahl and producer Clint Zenner.
Annual Project Meetings
2023 - November 29, at the University of Idaho. Seven out of eight grower co-PI’s and project PI/Co-PIs (scientific team) were in attendance, as well as all other project partners and contributors. Preliminary results and lesson’s learned from the first field season of research and insights from all attending growers were shared and discussed. Plans and adjustments to procedures for 2024 field season were discussed
2024, December 5, at the University of Idaho. All eight grower-PI's project PI/Co-PIs (scientific team) attended, as well as other project partners and contributors. The meeting included an update from the research team and discussion and reflection from the grower PI’s perspectives. General consensus from growers that the second termination date seemed to be the ‘sweet spot’ for when to terminate. All grower PI’s committed to continuing the project with a second round of cover crop treatments in the current plots to provide valuable information. Research team committed to seek funding to keep this project going beyond the initial 3 years. Curiosity around cause of the lower winter wheat yields in 2024 following cover crops the previous year, but producers were not overly concerned. Growers are interested in the cover crops for long-term soil health benefits, and hope to see a benefit in yield. Growers expressed interest in using fall seeded cover crops in future treatments.
2025, December 12, at the University of Idaho. The final project meeting brought together producer-collaborators and researchers to reflect on multi-year on-farm cover crop trials, share experiential insights, and identify implications for future research, extension, and project design. Discussion emphasized practical outcomes, economic realities, biological processes, and directions for a potential PANDAS 2.0 phase.
Data were gathered pertaining to the costs of cultivation of spring cover crops as informed by the field trials and producer perspectives provided in the project annual meetings. These included costs of seed mixes, custom rates for planting and spraying operations, and costs of herbicides used for termination. Cost of Cultivation of Spring Cover Crops for North ID reports are in development with planned publication on the University of Idaho Ag Biz website (https://www.uidaho.edu/extension/food/idaho-agbiz/crop-budgets) in March 2026. These reports will be useful references for producers who are considering cultivating spring cover crops for making budgeting and cash flow management decisions.
Reports of results of the producer interviews and the data gathered at the Palouse Alternative Cropping Symposium in 2023 were generated and posted to the project website: https://pnwcovercrops.org. In all years, PACS presentations were well received. The podcasts generated 279 and 206 listeners. Resources can be found at this link: https://www.pnwfarmersnetwork.org.
Key themes and observations based on the final project meeting with producer co-PIs in Dec. 2025
Cover crop performance and management
Termination timing emerged as the most critical management factor, consistently viewed as more important than specific species mixtures. Mid-range termination was widely perceived as the most workable compromise between biomass, moisture conservation, and weed control. Later termination increased risks of seed set and management complications. Participants emphasized that termination decisions must remain adaptive to weather and field conditions rather than calendar dates.
Species diversity and mix composition
Most producers felt that mix diversity had limited short-term yield effects relative to the presence or absence of a cover crop itself. Lower-diversity, lower-cost mixes were often viewed as economically preferable. Some niche benefits of specific species were noted, particularly for grazing or soil structure, but not as universal solutions.
Spring vs. fall-seeded cover crops
Spring-seeded cover crops were viewed skeptically due to limited growth, moisture competition, and uncertain yield benefits. Fall-seeded cover crops generated more optimism, especially for extending periods of active roots, supporting below-ground biology, and improving logistical flexibility.
Soil moisture, weeds, and yield impacts
Soil moisture tradeoffs remain a central concern. Yield impacts were variable and often confounded by landscape position, termination method, and weather. Some localized weed suppression and visual yield differences were observed, though not always captured quantitatively.
Below-ground biology and insects
There was strong interest in understanding soil biology, arthropods, and nutrient cycling, with recognition that benefits may lag beyond a single season. Participants were particularly interested in persistence of soil organisms following termination and interactions with residue quality.
Livestock integration
Grazing cover crops was identified as one of the clearest pathways to economic return, though infrastructure and management constraints remain. Collaboration with livestock operators was seen as a viable approach.
Producer perceptions and barriers
Participants reported increased knowledge and moderate likelihood of changing management practices. Major barriers to wider adoption included time constraints, cost, and uncertainty, as well as concern that research questions sometimes lag producer needs.
Implications for PANDAS 2.0
Suggested priorities include greater emphasis on fall-seeded systems, soil biology, termination methods, economic analysis, and more flexible, producer-driven trial designs.
Overall conclusion
Cover cropping in dryland systems is highly context-dependent, with modest short-term agronomic gains but potentially meaningful longer-term system benefits. The PANDAS project’s collaborative model was viewed as especially valuable for generating insights grounded in real-world farming conditions.
A survey or producer co-PIs administered during this final project meeting:
Social impact – end of project and producer Co-PI’s future interests.
Based on a survey at our final meeting with producer Co-PI’s in December 2025, producers indicated strong likeliness to change their cover crop management practices based on their participation in the project (average 4.4 out of 5 ranking), and that their knowledge has increased through participation in this project (average 4.8 out of 5). Additionally, 4 out of 6 producer Co-PI’s indicated soil health benefits were observed from the use of cover crops, 5 out of 6 indicated erosion control, and 3 out of 6 indicated weed suppression benefits. Two out of 6 indicated intention to increase the cover crop acreage on their farm, two indicated maintaining the current level of acreage, and one was undecided.
Producers indicated that cost-share or financial support, more information about economic returns, livestock infrastructure and better RMA (crop insurance) protection would help them adopt cover crops at a larger scale. The potential to reduce costs of inputs, or breakeven on costs are important to their current economic evaluation of integrating cover crops on their farms.
All eight producer Co-PI’s have indicated their interest in continuing cover crop treatments in the plots we established in this study to understand the longer-term impacts of cover crop integration on their soils and cropping systems. The majority indicated interest in soil biological analysis and more focus on belowground processes in the next research proposal. They have also indicated interest in evaluating best management practices for winter cover crops. Because we were aware of this interest, producer co-PIs seeded winter cover crops in fall 2025 into plot set 1 trials (where cover crops were seeded in 2023), and will be evaluating spring termination timing and spring crop yield in spring and summer 2026.
Based on discussions with producer collaborators at annual meetings, a longer-term economic analysis plan was developed for quantifying the soil nutrient value obtained from planting spring cover crops. The field trial data indicated that substantial soil nutrient adjustments were not realized by the time of the project end, so we plan to implement the nutrient value calculations after longer-term field trial data become available.
This project was highlighted in the University of Idaho's Land-Grant Impacts statement for 2026:
Education and Outreach Outcomes
Adoption of cover crops in Pacific Northwest cereal systems has lagged largely because of unique climatic challenges and lack of scientifically based information addressing critical decisions that must be made by producers adopting these systems. A central resource providing information they need and a collaborative framework to address the most pressing questions they have is essential. Our project illustrates the value of producer-guided research that tackles these issues systematically, evaluates the information and adjusts research and outreach going forward. This project addressed the water and management implications of terminating spring cover crops at different stages to optimize cover crop growth while avoiding undue depletion of soil water and preventing cover crops from maturing to seeding, which can result in weedy infestation by cover crop species in the subsequent crop. This information has been valuable to our producer co-PIs and has garnered interest among their peers who have attended field days and workshops. The website developed in this project should be maintained to serve as a continuing forum and repository for research results and producer experience with cover crops.
Certainly challenges and opportunities for cover cropping will evolve over time. A dynamic response framework will be essential. Specifically for our theme, producers are now interested in more information about fall-seeded cover crops, which will be increasingly attractive with changing climates in our production zones. Responding to that interest will ensure producer interest and engagement.
Often we hear that agricultural research tends to lag producer innovation and interests. A nimble response to address this lag can be built from scientist-producer partnerships to generate and disseminate the needed information.
- cover crop planning and management
- value of replicated on-farm trials
- systems thinking
cover crop planning and management
value of replicated on-farm trials