2016 Annual Report for FS14-282
Correlating Nitrogen Application Rates in Sugarcane With Low-Cost Normalized Difference Vegetation Index (NDVI)
Summary
As FS14-282 enters it’s second year (2016-2017) our effort is focused on preparing for a period of data collection. We have been working with our partners and with the local cane farming community to define the most useful outcome of research from the perspective of the working farmer.
In the coming months – June through December 2016 – we will focus attention on two separate plots. 1) A 2.7 acre plot of ‘plant’ cane; and 2) A 1.8 acre area of 2nd year ‘stubble’ cane. Each is due to receive N fertilizer in the next two weeks. Our efforts have been hampered recently by rain.
Our original plan was to apply variable amounts of nitrogen to the 2.7 acre parcel via automated means with help of the Cane Research Unit in Houma, LA. Due to an unusually mild winter and rain delay our plant cane crop is currently at a height where getting the required equipment into the field without damage is no longer practical. As a back-up we have been granted an additional area of 2nd year stubble which will be used in a scaled-down fertilization area. The stubble crop will be fertilized in separate trials ranging from 0 to ~160 kg/ha (1 kg/ha = 0.1 g/m²). This area will be fertilized using variable rate equipment. The 2.7 acre ‘plant’ cane section will be scaled down to about 1/4 its original size and hand-fertilized.
Objectives/Performance Targets
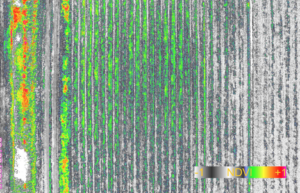 Figure 1
Our objective is to test the viability of low-cost methods of acquiring and processing aerial NDVI imagery. Early in the season we used a capture system developed with partners, along with several suspension methods using kites and balloons. The challenges facing any aerial photography system based on wind power are variability in the control of height and nadir position of the cameras; weight of the camera rig; getting consistent results over time.
Figure 1 demonstrates output of a kite-suspension system using two consumer-grade cameras modified for NDVI. The images are JPEG-compressed and white-balanced prior to capture according to a methodology which will be fully reported. We will describe elsewhere the importance of calibration in NDVI photography along with this method. While these results are useful for determining general patterns over time they are hard to replicate. One of our goals is to accurately determine trends over time using low cost methods.
In the period that we have been engaged in considering low-cost aerial NDVI options, those available at the lower end have proliferated. A year ago certain approaches were beyond the grasp of a study of our scope but are now within reach. These include use of consumer-grade UAVs.
Accomplishments/Milestones
Using a simple system (an 11′ foot Delta kite, two consumer grade cameras, and a 3D printed harness) we have achieved accurately calibrated NDVI results. The following figures provide a sample:
 Figure 2
Figure 2 is an RGB image of a section of early-growth sugar cane (capture area is 220ft x 350ft) viewed from an altitude of 125ft. Visible are a number of ground control points (GCPs) that allow us to stitch images together when a section is large. GCPs are useful when a high degree of resolution is desired or when altitude must be lower in order to achieve a particular result.
 Figure 3
Figure 3 is the corresponding NDVI image of the same section in Figure 2. On the left is a colored LUT (look-up table) that indicates relative levels of photosynthetic activity in the field. Red (in lower right of main image) indicates a small value with less relative activity while green represent a higher value. The black sections along the bottom indicate the presence of water. The blue in the upper left of the main image represents an artifact. Plant life generally does not indicate NDVI values this high thus it is likely that these regions exhibit ‘shadow’ artifact.
NDVI is an index calculated by applying a simple equation to bands of captured visible and near-infrared light. The basic idea behind NDVI relies on fundamental properties of plant physiology. Plants tend to reflect more in the near- infrared band in contrast to non-plant objects. When a plant becomes stressed or dehydrated the spongy under-layer of its leaf tends to collapse and reflect less NIR while still reflecting the same amount of visible light. By mathematically combining these two signals we can distinguish plant from non-plant and healthy from distressed vegetation.
In addition, by altering the altitude we achieve results that can be used to highlight different aspects of a field’s condition. As an example in Figure 4 we have flown at an altitude of 75ft over the same section as in Figure 3. In Figure 4 we get a different reflectance characteristic altogether. Since the sensors we use are low-cost consumer-grade ones (they aren’t intended for scientific use) learning how to adjust parameters such as flight altitude, and to take advantage of these simple adjustments, is an important goal.
 Figure 4
Impacts and Contributions/Outcomes
While aerial NDVI may be used as a general indicator of photosynthetic activity it is important to point out that it is not a direct measure of chlorophyll content, water content, or anything else. NDVI is simply a ratio of near infrared (NIR) reflectivity minus red reflectivity (VIS) over NIR plus VIS:
NDVI=(NIR-VIS)/(NIR+VIS)
Historically, dividing through by NIR+VIS has provided an excellent normalization factor for comparing large areas of terrain under constant illumination. However in our case we capture smaller areas using less sensitive sensor equipment (inherently more difficult to calibrate) under changing illuminant conditions. As mentioned regarding the ‘shadow’ effect, a small denominator change in the above equation can make the vegetation index highly variable, pushing the index near infinity in cases. This means that objects of low visible and NIR reflectance may paradoxically produce strong NDVI signals.
Another source of artifact is the image compression that occurs in most consumer-grade cameras, known as Digital Image Compression (DIC). DIC is commonly used to address issues of storage and transmission of images when the availability of resources is limited. Compression of such data in DIC pre-processing can substantially impact the utilization of bandwidths in post-processing. JPEG (Joint Photographic Expert Group) is one of the most reliable and popular image compression methods that exist. While our camera systems do support RAW image format, these images are much larger in size than their compressed JPEG counterparts. For this reason our results are all based on JPEG imagery. How to accurately calibrate for reflectance under changing illuminant conditions while still being limited to JPEG compression for practical reasons is a subject that we are actively addressing through this work.
During post-processing, NDVI values are individually determined for each pixel in the photograph. Given that we have a value for every pixel, we can assign a different color to different ranges of values and create a false-color map. In the above image this indicates how NDVI varies spatially. A LUT is used to describe relative differences in the NDVI index (which itself is unit-less). High photosynthetic activity is represented by warmer-colored NDVI values. (This type of color map may not helpful for people with red/green color blindness, such as protanopia, thus we also use ‘color-blind’ LUTs.)
The LUT used to described relative photosynthetic activity in Figure 1 is shown below. In this figure the range of values between -1 and +1 indicates relative levels of activity: higher values are indicated by warmer colors. The LUT below was created by Ned Horning and is described in greater detail here.
![]()
Figure 5
The vertical LUTs below (Figure 6) are further examples of using heat maps to describe photosynthetic activity. In each a value is attached for every pixel based on prior calibration. The LUT to the left is intended for normal vision while the one to the right is a ‘color-blind’ LUT.
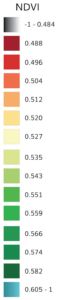

Figure 6
As mentioned, next steps are to apply N-fertilizer to two separate plots of sugar cane. The first is a 2.7 acre area of first year ‘plant’ variety, the second is a 1.8 acres area of 2nd year ‘stubble’. Our initial plans have had to adjust due to weather conditions. Our focus for the growing season (from now until December) will be on the stubble variety as this crop is likely to absorb the applied nitrogen more efficiently than the first year crop. We expect this parcel to provide a better signal-to-noise ratio than the first-year variety. However, the original plot is still of use as we can consider development of this crop over a longer period of time.
In addition to the proposed methods of suspending our cameras we also plan to investigate the use of low cost consumer UAVs.
Collaborators:
Department of Biology, Middlebury College
14 Old Chapel Rd
Middlebury, VT 05753
Sugarcane Research Laboratory 5883 USDA Rd
HOUMA, LA 70360