2012 Annual Report for GW11-012
Facilitating Integrated Weed Management in California Rice: Predicting E. spp. and C. difformis emergence across heterogeneous growing environments
Summary
The overarching goal of this research is to develop a site-specific, web-based decision support tool that assists rice growers in planning for and implementing alternative stand establishment systems for weed control by predicting the minimum time to emergence for Echinochloa spp. and Cyperus difformis (smallflower umbrella sedge). Our hypothesis is that early-season temperatures within the Sacramento Valley are spatially and temporally dependent; therefore site-specific, real-time temperatures will improve regional emergence predictions for Echinochloa spp. and C. difformis.
In 2010 and 2011 we:
1) quantified the spatial variability of species-specific physiological temperatures for the historical period of rice establishment in the Sacramento Valley;
2) produced empirical, temperature-based emergence models for each species;
3) quantified the field-scale variability of weed emergence predictions (variability between years, between locations and within a single field) in stale-seedbed and drill-seeded fields;
4) communicated the initial findings to growers via field day and extension networks; and
5) initiated construction of an online interface that will deliver the information from these particular emergence models to rice growers and serve as a platform for the delivery of information from future rice-related models.
Objectives/Performance Targets
Physiological temperatures refer to a range of temperatures that optimizes growth for a particular plant species. Each species (and biotype) has a distinct range of optimum temperatures. Using preliminary base temperatures for California biotypes of Echinochloa spp. and C. difformis (8C for Echinochloa spp. and 15.5C for C. difformis; A. Fischer, personal communication) in combination with daily maximum and minimum air temperatures accurate to 4km2 (Coast to Mountain Environmental Transect, COMET; comet.ucdavis.edu), we produced average, site-specific (4km2) thermal unit accumulation for the period of rice establishment (4/15-5/31) between 2004-2010 in the Sacramento Valley (Figure 1).
Average physiological temperatures for both Echinochloa spp. and C. difformis were spatially heterogeneous between 4/15 and 5/31 for the years 2004-2010, with 2.60 and 2.52 standard deviations (respectively) separating the warmest and coolest areas of the rice growing region (Figure 1). However, the distribution of the heterogeneity differed between species. The higher base temperature of C. difformis relative to Echinochloa spp. had the effect of increasing the relative thermal unit accumulation NNE of Sutter Buttes (as depicted by the increased red shading in Figure 1) due to higher average minimum temperatures in this area. In addition to being species-bound, it is likely that the spatial distribution of physiological temperatures is also temporally sensitive. Weed emergence occurs within a much smaller period of time than the multiple year, multiple day average depicted in Figure 1. Thus, the spatial heterogeneity of physiological temperatures is likely to change both within and between years. The extent of these interactions and the degree to which they influence the accuracy of model predictions will be determined via multi-year simulations using the emergence models presented below. However, this work is not yet complete. While it is important to emphasize that the relationships are not as static as indicated by the averages in Figure 1, the spatial relationships presented, nonetheless, do provide a rationale for using site-specific temperatures to improve the accuracy of species-specific weed emergence predictions.
During the 2010 and 2011 field seasons we observed Echinochloa spp. and C. difformis emergence in three fields: a spring-tilled, stale seedbed field located in Glenn County and two drill-seeded fields located in Sutter County, for a total of four year-field combinations. The water in each field was managed similarly, with two to three flushes of irrigation over the course of a 20-30 day period to create a saturated but aerobic seedbed. Emergence was observed in five – seven plots per field from the first day of flooding until no further emergence had occurred in a field for four days. Each plot contained four 0.09m2 subplots, and the plots were located to maximize both the within field variability in water depth and timing as well as the number of observable weeds based on historical occurrence. The emergence observations were expressed as the average proportional emergence of the four subplots. They were fit to a non-linear mixed model of the form:
emergence = 1 / 1 + exp-[ ((T – Tbase) – (t50))/ Erate ] + REyear + RElocation + REfield + Residual, where:
T – Tbase = site-specific cumulative air temperature above a physiological base temperature (8C and 15.5C for Echinochloa spp. and C. difformis, respectively); t50 = time to 50% emergence; Erate = slope; and RE = normally distributed, random error.
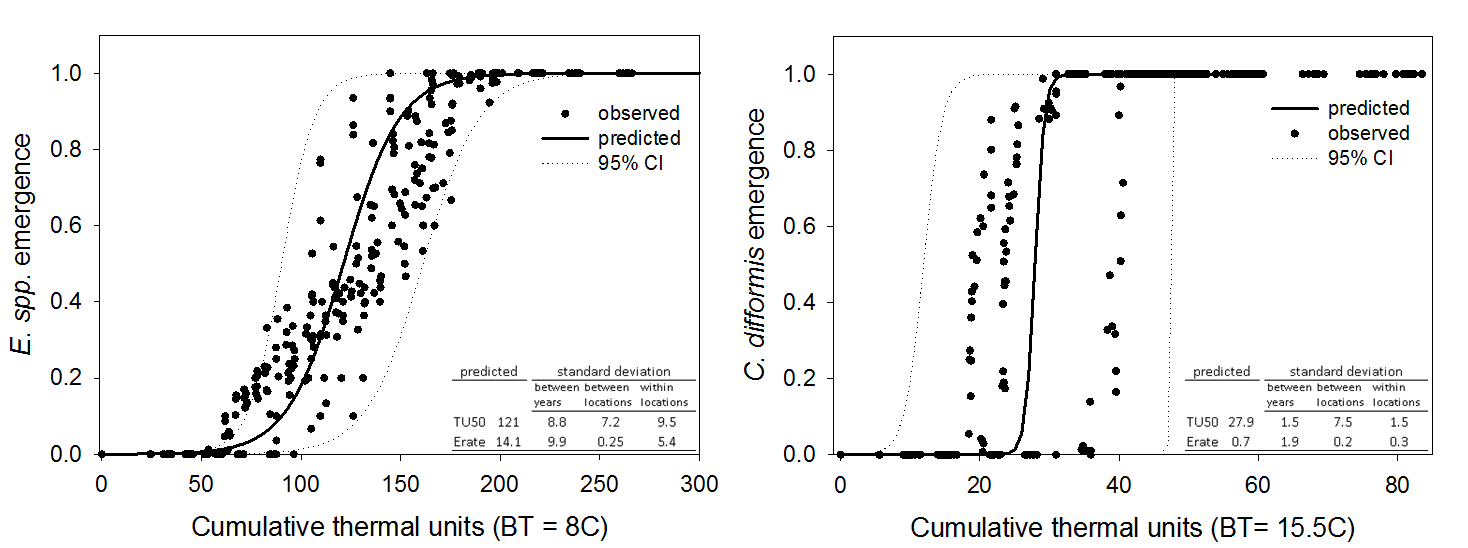
For Echinochloa spp., variability in the time to 50% emergence was relatively small (6-8% of the predicted time) and consistent between years, locations and within fields (Figure 2). In contrast, the rate of emergence for Echinochloa spp. was much more variable between years and between locations within the same year (70% and 38% of predicted rate, respectively). Similarly, the predicted rate of emergence for C. difformis was more variable across years, locations and within fields than was the time to 50% emergence (Figure 2). Predicted time to 50% emergence was much more variable between locations (27% of predicted time) than between years and within fields (6%) for C. difformis. Multi-year simulations run using the above models will quantify spatial, inter- and intra-annual variability of rate of emergence and time to 50% emergence for these two species. Identifying the magnitude of spatio-temporal variation of these parameters will enable us to determine how much accuracy is added to the emergence predictions by using site-specific temperatures. As the accuracy of the models improves, the importance of site-specific temperatures will increase.
- Figure 2. Echinochloa spp. and C. difformis emergence over two seasons (2010, 2011) in fields that were managed as spring-till stale seedbeds or drill-seeded. Sources of error as modeled via mixed nonlinear regression.
- Figure 1. Average cumulative thermal unit accumulation for Echinochloa spp. and C. difformis for the period of rice establishment (4/15-5/31) between 2004-2010 using base temperatures of 8C and 15.5C (respectively) and maximum and minimum air temperatures accurate to 4kim2. SD = standard deviation.
Accomplishments/Milestones
- Determined the spatial resolution at which air temperature can be predicted across the Sacramento Valley between April 15 and June 1. Confirmed the accuracy of spatio-temporal interpolations of air temperature via in-field temperature measurements. Produced empirical models that predict the emergence of Echinochloa spp. and C. difformis as a function of air temperature. Determined the accuracy of the emergence models at various spatial and temporal scales. Began construction of a web-based decision support tool that communicates site-specific historical and real-time emergence predictions to rice growers using alternative stand establishment systems (Figure 3). Communicated preliminary findings of work to growers at field day and via UC extension networks (Figure 4).
- Figure 3. Beta version of web-based decision support tool for predicting Echinochloa spp. and C. difformis emergence using site-specific air temperatures.
- Figure 4. Poster presented to rice growers at the 2011 Annual Rice Field Day in Biggs California.
Impacts and Contributions/Outcomes
As these models are further refined and their predictions are validated, we will begin using them to relate information on weed emergence patterns via a web-based tool. The tool would enable growers to choose their location within the valley, their weed of interest and the date of the first post-tillage flush of water. The tool would then return the real-time percent emergence (with confidence intervals) as well as a historical average time to 100% emergence (in days) for the chosen date. Although the tool is still under development, Figure 3 is included to roughly approximate how an interface might appear. Eventually, this interface could serve as a platform to deliver other temperature-based modeling related to California rice, whether weed-related or not.
Collaborators:
Chair, Dept. Plant Sciences
University of California, Davis
Plant Sciences Department
One Shields Avenue
Davis, CA 95616
Office Phone: 5307527323
Website: http://www.plantsciences.ucdavis.edu/vankessel/