Final report for FNC17-1081
Project Information
Abby and Nick Johnson have owned Ox Heights farm for 9 years and are proud owners of 170 acres in Molkte Township, Presque Isle County, MI, five miles south of Lake Huron. Our acreage is split between tree farming and row cropping. Forty-five acres are row cropped with a rotation of corn, soybeans, and wheat. Historically the tillable acres have been farmed with traditional row crop practices and in the past 5 years no-till agriculture has been implemented. The remaining acres are dedicated to timber production. The deep well drained soils provide a perfect substrate for producing high quality hardwood timber. In 2017 we enrolled in the Michigan Agriculture Environmental Assurance Program (MAEAP) and were verified in Cropping, Farmstead, Livestock and Forest, Wetland & Habitat systems.
Problem Addressed:
(1) Farming in many ares of the Midwest is of low sustainability and our farm region of Northeast Lower Michigan provides a case in point. Low Profitability: Yields of corn and soybeans averaged 100 bu/acre and 29 bu/acre respectively during the past 10 years in Presque Isle County, MI (USDA, NASS). Cattle ranching is threaten by Bovine Tuberculosis. High Environmental impact: Row cropping in Presque Isle County has more environmental impact per bushel produced than other areas in the Midwest because of relatively high inputs and relative isolation from other farm communities. Farming has not supported Community growth: The population of Presque Isle County has been stagnant since 1960 at ~13,000. Per capita income in the county is only $22,000, the poverty rate 13%, and the unemployment rate third highest in Michigan at 10%.
(2) Domestically grown chestnuts are in high demand, but production is limited in the Midwest region, in part, by not knowing where they can be grown - hardiness of currently grown varieties is zone 6 or greater. An article published by Michigan State University Agrobioresearch highlights this problem (see story)
(3) Even if chestnuts grow well in Presque Isle County and other places in the North Central region, many local farmers can’t afford to take land out of production for 5 years before getting a return on investment. For existing family farmers to convert to a specialty crop like chestnuts, they need to earn money while the chestnut orchard is developing.
Research Approach:
(1) Determine if cold hardy and traditional cultivars of Japaneses/European hybrid grafted chestnuts can be grown in Northeast Michigan, a nontraditional area for fruit and nut production, by comparing growth and survival of cold hardy varieties to traditional varieties. (2) Determine if forage crops can be harvested between rows of chestnut trees such that the field can still be productive during orchard establishment years.
Research Conclusions:
During fall 2017, 442 Japanese/European hybrid grafted chestnut trees consisting of 6 different cultivars were planted. Trees from all varieties survived and grew well. Survival from fall 2017 to fall 2018 was 99%, terminal growth averaged 13 inches, and percent change in diameter 24 inches from the ground averaged 60%. About 25 lbs of chestnuts were harvested from the trees during year 1.
A forage crop of clover and orchard grass was established and harvested between the rows of establishing chestnut trees. The total acreage of the field with chestnut trees was about 7 acres and about 3.5 acres could be hayed. The total time to hay the field with chestnuts was about 25% longer than a field without chestnuts that was about 3.0 acres. Forage quality of the grass/clover hay was relatively high. Haying will continue in future years because it provides forage for our goats and oxen and accomplishes an important orchard maintenance task - mowing.
A slide show with many pictures highlighting the project can be accessed by clicking here. A blog that continues to highlight the project and can be accessed by clicking here.
Farmer Adoption Actions:
A field day was hosted during September 2018 with about 20 local farmers attending. Several farmers within a few miles are considering planting a chestnut crop in future years. We are planning to expand our acreage. However, we strongly warn that our success is likely related to our farm's microclimate, which was studied extensively prior to starting this project. Although we are much further north and east than any other orchard in Michigan or the Midwest, our farm sits on the highest ridge in Presque Isle County about 5 miles from Lake Huron. Temperature monitoring data suggest our farm can be 10-15 degrees F warmer on the coldest winter nights than lower elevation farmland a few miles further inland. Information about our temperature monitoring can be found by clicking here. Site selection will be extremely important for those considering to plant chestnuts in nontraditional regions. Finding land at high elevation that is well drained will be critical. However, within 5 miles of our farm, we estimate that over 1,000 acres of tillable land could sit in this micro-climate, so the potential for future expansion of chestnut orchards in our community is significant.
A story about how and why our orchard received a '5-star award' can be found by clicking here.
Objectives
(1) Determine if cold hardy and traditional cultivars of Japaneses/European hybrid grafted chestnuts can be grown in Northeast Michigan, a nontraditional area for fruit and nut production, by comparing growth and survival of cold hardy varieties to traditional varieties.
(2) Determine if forage crops can be harvested between rows of chestnut trees such that the field can still be productive during orchard establishment years.
Cooperators
Research
2017: Establishment of forage crop and chestnut orchard
Chestnut planting and protection: During September, we planted 442 Japanese/European grafted chestnut trees (Table 1) and protected them from (1) deer browse (fencing installed), (2) drought (irrigation installed), (3) rodents (mouse guards installed), (4) high wind (staking installed), (5) weeds (weed guards installed), and (6) sunscald (painted stems). All trees have unique metal labels so that individual trees can be easily identified and measured in the future.
Soil health: We improved soil health around the trees by (1) planting a cover crop of tillage radish within 5 ft of the trees, (2) planting a forage crop of clover and orchard grass elsewhere, (3) amending the soils with recommended rates of potash and gypsum, and (4) inoculating the new trees with mycorrhiza collected from our woodlot.
Data collection: We measured the initial height and diameter of the trees so that we can determine if survival and future growth is correlated with the cultivar and size of trees when planted.
Outreach: Our work was highlighted in the local community through newspaper stories and radio announcements.
In-kind support: We were able to plant 442 trees, instead of the 216 we proposed, because we received matching funds from the Michigan Department of Natural Resource.
2018: Maintenance of chestnut orchard and forage crop harvest
Chestnut care: January: Shovel snow around trees to insulate the ground during harsh winter temperatures. April: Remove mouse guards. May-August: Spray for roseshaffer and leafhopper (2 times), adjust staking around trees (5 times), spray for weeds (2 times). Water trees about once every 10 days. October: Harvest chestnuts.
Forage crop harvest: Harvest clover/orchard grass hay between the rows of trees during June. A drought precluded us from harvesting additional cuttings.
Soil health: Plant winter rye around each tree during September as cover crop during fall and winter, 2018-2019.
Data collection: Measured terminal growth and diameter of tree 24 inches from the ground of each surviving tree during September. Conduct hay forage quality analysis during October. Conduct soil tests around trees in October. Collect, weigh, and eat chestnut harvest in November.
Outreach: Three articles about the project in local newspaper. Develop and post to www.oxheights.com (a blog about our orchard). Host field day in September. Developed a comprehensive presentation and slide show for field day. Slides available to the public on our blog (click here).
Fall 2018 planting: Another 123 chestnut trees were planted during 2018, but the focus of this report will be the 442 trees planted during 2017.
Chestnut starting conditions when planted during fall 2017 :
Fall 2017 we completed the establishment phase of the project where the forage crop between the rows of trees was planted, trees were planted, and starting height and diameter were collected (Table 1). Trees were sourced from Forest Keeling and were potted. Pictures of the initial planting can be found here: 2017-Chestnut-Planting_Ox-Heights_Moltke-MI
Table 1. The average height and diameter (measured 24 inches off ground) of Japanese/European grafted chestnut trees planted during September 2017 according to cultivar. Numbers in parentheses are standard deviation of the mean.
|
Cultivar |
N |
Height - Inches |
Diameter - Inches |
|
Bouche de Betizac |
175 |
35 (8) |
0.32 (0.06) |
|
Colossal |
179 |
53 (11) |
0.38 (0.08) |
|
Labor Day |
14 |
39 (14) |
0.30 (0.09) |
|
Marigoule |
20 |
41 (15) |
0.34 (0.11) |
|
Marsol |
28 |
52 (12) |
0.39 (0.08) |
|
Precoce Migoule |
26 |
46 (24) |
0.38 (0.07) |
|
442 |
Chestnut survival and growth through fall 2018:
Survival: Survival exceeded expectations and was among the highest of any planting in Michigan during (see story). Survival through the harsh winter of 2017-2018 and 2018 summer drought was 99% and did not differ among cultivars (Table 2). 30 other orchards in Michigan planted the same stock of trees from Forest Keeling during fall 2017. Of the 30 farmers planting trees, 10 reported survival rates to Midwest Chestnut Producers Council. Of the 10 reporting orchards, the average survival from fall 2017 to June 2018 was 79%. Orchards not reporting may have experienced survival rates lower than 80% (see story).
Growth: All cultivars grew well during 2018 with no cultivars standing out as exceptionally good or exceptionally bad. Terminal growth during 2018 averaged about 13 inches and did not differ substantially among cultivars (Figure 1). Bouche de Betizac, Labor Day, and Marigoule cultivars on average saw slightly greater gains in trunk diameter and trunk area than Colossal, Marsol, or Precoce Migoule (Figures 2 and 3). Therefore, Bouche de Betizac and Marigoule seemed to perform best at our site during 2018, but the differences among cultivars were not drastic.
Table 2. Six cultivars of Japanese/European grafted chestnut trees were planted during fall 2017 and survival, terminal growth, percent change in diameter 24 inches from the ground (diameter fall 2018 - diameter fall 2017/diameter fall 2017 *100), and percent change in trunk cross-sectional area 24 inches from the ground (area of trunk 2018 - area of trunk 2017/ area of trunk 2017 *100) were measured during fall 2018. Bb (Bouche de Betizac), C (Colossal), Ld (Labor Day), Mg (Marigoule), Ms (Marsol), Pm (Precoce Migioule). Number in parentheses is coefficient of variation defined as the standard deviation of the mean divided by the mean.
| Cultivar | n | % Survival | Terminal Growth in Inches | % Change in Diameter | % Change in Area |
| Bb | 175 | 99% | 13.5 (0.31) | 77 (0.45) | 224 (0.59) |
| C | 179 | 99% | 12.4 (0.32) | 52 (0.57) | 140 (0.64) |
| Ld | 14 | 100% | 12.0 (0.50) | 71 (0.77) | 220 (1.01) |
| Mg | 20 | 100% | 13.6 (0.55) | 67 (0.48) | 188 (0.57) |
| Ms | 28 | 100% | 13.4 (0.48) | 47 (0.50) | 121 (0.56) |
| Pm | 26 | 100% | 11.8 (0.23) | 49 (0.47) | 127 (0.57) |
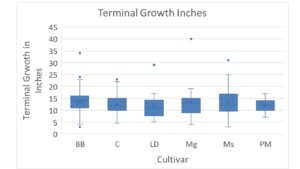
Figure 1. Six cultivars of Japanese/European grafted chestnut trees were planted during fall 2017 and terminal growth of each tree was measured during fall 2018. Data are presented as a box and whisker plot displaying the average (‘X’), median (middle line), third quartile (upper line), first quartile (bottom line), 95% confidence intervals (upper and lower whiskers), and outliers (above or below whiskers). Bb = Bouche de Betizac. C = Colossal. Ld = Labor day. Mg = Marigoule. Ms = Marsol. Pm = Precoce Migioule.
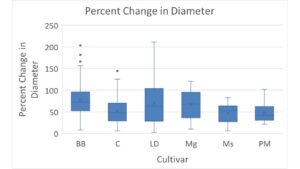
Figure 2. Six cultivars of Japanese/European grafted chestnut trees were planted during fall 2017 and percent change in diameter 24 inches from the ground (diameter fall 2018 – diameter fall 2017/diameter fall 2017 *100) was measured during fall 2018. Data are presented as a box and whisker plot displaying the average (‘X’), median (middle line), third quartile (upper line), first quartile (bottom line), 95% confidence intervals (upper and lower whiskers), and outliers (above or below whiskers). Bb = Bouche de Betizac. C = Colossal. Ld = Labor day. Mg = Marigoule. Ms = Marsol. Pm = Precoce Migioule.
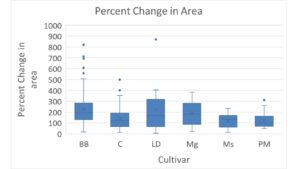
Figure 3. Six cultivars of Japanese/European grafted chestnut trees were planted during fall 2017 and percent change in trunk area 24 inches from the ground (area of trunk 2018 – area of trunk 2017/ area of trunk 2017 *100) were measured during fall 2018. Data are presented as a box and whisker plot displaying the average (‘X’), median (middle line), third quartile (upper line), first quartile (bottom line), 95% confidence intervals (upper and lower whiskers), and outliers (above or below whiskers). Bb = Bouche de Betizac. C = Colossal. Ld = Labor day. Mg = Marigoule. Ms = Marsol. Pm = Precoce Migioule.
Differences in growth based on position in the orchard
Because all cultivars performed similarly on average, but individual trees with in a cultivar varied substantially, we wondered if differences in growth of individual trees within a cultivar may be explained by where on our field the tree was planted. Our field varies in elevation by about 60 ft. Trees at higher elevation would be warmer at night during the winter than trees at lower elevation because the air mixes more at high elevation (see blog post about this). However, trees at higher elevation would have less water during the growing season, because the soils are sandier than at lower elevation. To evaluate if trees performed better in specific areas of the field, we first did a visual inspection of maps illustrating terminal growth and change in diameter of each tree across the orchard (Figures 4 and 5).
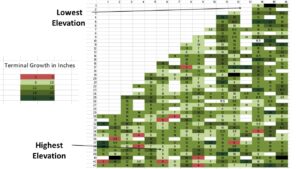
Figure 4. Six cultivars of Japanese/European grafted chestnut trees were planted during fall 2017 and terminal growth of each tree was measured during fall 2018. Dark green illustrates a tree with large amounts of terminal growth, whereas brown illustrates a tree with very little terminal growth. North is at the top of the figure. A cursory evaluation of the colors indicates slightly less growth on the SW side of the orchard where elevation is highest.
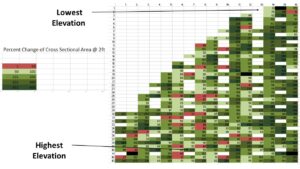
Figure 5. Six cultivars of Japanese/European grafted chestnut trees were planted during fall 2017 and percent change in diameter 24 inches from the ground (diameter fall 2018 – diameter fall 2017/diameter fall 2017 *100) was measured during fall 2018. Dark green illustrates a tree with large percent increase in diameter, whereas brown illustrates a tree with very little percent increase in diameter. North is at the top of the figure. A cursory evaluation of the colors indicates slightly less growth on the SW side of the orchard where elevation is highest.
Cursory examination of Figures 4 and 5 suggest that growth may have been best at lower elevations of our orchard (south and east sides). Indeed, when terminal growth of individual trees within a cultivar are plotted according to elevation, there is a slight correlation with elevation, where trees lower in the orchard grew more on average that trees higher in the orchard (Figures 6 and 7). We suspected that trees at lower elevation generally had higher soil moisture during the drought of 2018 and hence grew more, but is also possible that soil nutrients were better at lower elevation because they experienced less soil erosion during past farming (see soil test results below). We will need to continue working on improving organic matter and nutrient content in our loamy sand soils to see the greatest returns from the orchard. Introduction of organic fertilizers like aged manure, rather than inorganic fertilizers, may be an sustainable solution for improving soil organic matter and may be a focus of future study.
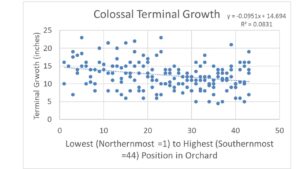
Figure 6. Terminal growth of individual chestnut trees of the Colossal cultivar plotted against elevation in the orchard. In general, Colossal trees at lower elevation grew more than those at high elevation.
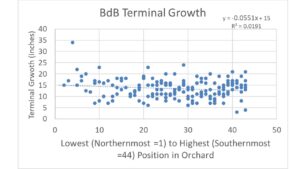
Figure 7. Terminal growth of individual chestnut trees of the Bouche de Betizac cultivar plotted against elevation in the orchard. In general, Bouche de Betizac trees at lower elevation grew more than those at high elevation.
Differences in growth based on initial size when planted
We also wondered if the size of the tree when planted during fall 2017 influenced how much it grew during 2018? Interestingly, we found that taller than average trees when planted during fall 2017 generally had less terminal growth during 2018 than shorter than average trees (Figure 8). We suspect the differences may be related to how tall and short trees allocate energy into tissue development; taller trees may need to invest more energy into roots or trunk development rather than terminal growth during their establishment year, but that hypothesis was not directly tested here.
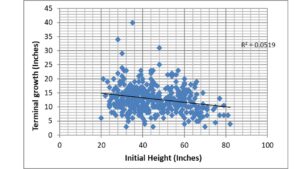
Figure 8. Terminal growth of Japanese/European grafted chestnut trees during their first year of establishment as related to initial height of the tree when planted. Taller trees showed less terminal growth than shorter trees.
Furthermore, trees that were small diameter than average when planted, showed larger percent increases in diameter than trees that were larger diameter than average (Figure 9). Taken together, the results indicate that smaller than average trees may have established more quickly and grew more vigorously than large trees in our orchard during year 1 (on average; not the rule, however). This doesn’t mean we recommend planting only small trees in an establishing orchard, but instead, that some smaller than average trees may ‘catch up’ to larger than average trees over the course of several years. In other words, there may not be a substantial disadvantage to planting a few smaller than average trees in establishing chestnut orchards, especially if not planting a few small trees means you would need to wait an extra year to establish your orchard. We will continue to monitor individual growth and survival in future years to address these questions.
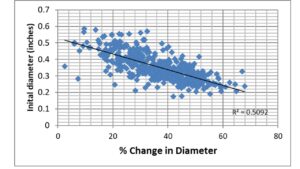
Figure 9. Percent change in diameter 24 inches from the ground (diameter fall 2018 – diameter fall 2017/diameter fall 2017 *100) of Japanese/European grafted chestnut trees during their first year of growth in a new orchard as related to initial diameter when planted. Trees with small diameter saw the greatest % increases in diameter during their first year in our orchard meaning that small trees were catching up to large trees.
Forage crop harvest and feed value
Harvest
We cut hay between the trees on 07June18. The total acreage of the field was about 7 acres and approximately 3.5 acres between the chestnut trees was cut. Cutting hay between the chestnut trees required 2 hours and that we moved about 50% slower than normal to make sure no trees were damaged. An adjacent 3.5 acre field without chestnuts was also hayed (control field), but only required about 1 hour to cut because we could cut at full speed without fear of haying up any chestnut trees. The hay was raked on 10June18. Raking went very well, with little delay caused by the planting and the rake being the correct width. Raking required about 45 minutes on the field with the chestnuts and the control field where no chestnuts were planted. Pictures of the haying process are located in this slideshow.
The control 3 acre field was bailed on 10June18, with about 100 bails coming off the field. The hay on the chestnut field was not bailed on 10June18 because it was still too wet given that it had a higher percentage of red clover. The chestnut field was raked again on 11June18 and bailed on 11June18. No issues with bailing were caused by the chestnuts. Yield of hay from chestnut field was 135 square bails. A severe drought occurred between June 2018 and September 2018 (as classified by NOAA), and as such, the second cutting of hay never grew. We were very happy with the haying because it accomplished two goals for our farm: (1) provided feed for our cattle and goats and (2) mowed the chestnut orchard (required orchard maintenance). We fully intend to continue haying in future years. Eventually, the manure produced from goats eating the hay will likely be returned to the orchard in the form of aged manure/compost.
Feed value
The grass/clover hay taken between chestnut trees was average to above average for clover-grass hay. The average bale weight was 51.42 lbs X 135 bales X 83.76% DM = 5,814 lbs DM / 3.5 acres = 1,661 lbs DM/acre. The averages and ranges given in Figure 10 are for pure alfalfa, so skewed a bit relative to grass/clover hay.
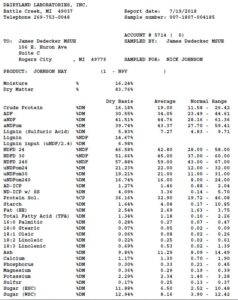
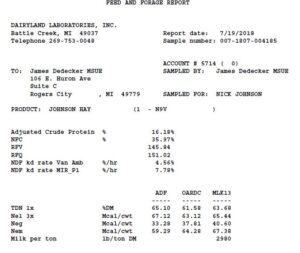
Figure 10. Forage report for grass/clover hay harvested between rows of chestnut trees.
Soil Testing
Soil tests were conducted during Fall 2018 at 4 locations in the chestnut field (Figure 11): The 'lowest' point is where soil moved by past water erosion would have deposited (flat topography); the 'Middle' where slopes are Class C and water erosion occurred historically; the 'high' point is where we have observed wind erosion in the past; the 'new' area is where chestnuts were planted during fall 2018, but no soil amendments were added or cover crops were planted during fall 2017. New served as a 'control' site where no tillage radish or cover crops were planted during 2017.
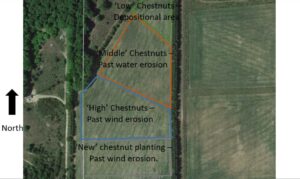
Figure 11. Locations where soil was collected and tested during October 2018.
Results of soil test are presented in Figure 12. Organic matter was highest at the 'low sampling' location which is likely depositional area for water erosion from the 'middle' region. Organic matter was lowest in the 'middle' sampling location, where water erosion occurred historically. Interestingly, phosphorous was very high in the 'middle' sampling location and could be a symptom of previous farmers trying to repair water erosion with application of manure. Phosphorous was generally low elsewhere. The 'high' and the 'new' soil samples were very similar, meaning that the planting of the cover crop and forage crop where the chestnut trees were planted during 2017 did not substantially improve soils. This result was not completely unexpected because soil improvements can take years and may become evident at 5-10+ year time scales. We look forward to continuing to monitor and improve soil health especially in the middle zone. Now that the field has converted to chestnuts, wind or water erosion will likely not occur in the future.

Educational & Outreach Activities
Participation summary:
2017 Outreach: We worked with MSUE to issue a press release throughout Michigan. The press release generated a large story in our local newspaper (Presque Isle Advance). Fifteen people from the local community helped establish the orchard or visited the farm to learn more about the project. We worked closely with Dennis Fulbright (MSU – Professor, chestnut specialty), Erin Lizotte (MSUE – Educator, chestnut specialty), James DeDecker (MSUE – Educator, Presque Isle County), Virginia Wrinkle (Chestnut Growners Inc.), and Josh Springer (Chestnut Orchard Solutions). A link to the 2017 news paper article can be found here: Chestnut-Article-in-PIADVANCE
2018 Outreach: We hosted 6 tours of the farm including one from Dennis Fulbright who gave us a 5-star chestnut orchard award (see story). A press release was issued for our field day in September and the local newspaper wrote three articles about the field day:
Chestnut-Article-in-PIADVANCE-30-Aug-2018
Chestnut-Article-in-PIADVANCE-13-Sep-2018
Chestnut-Article-in-PIADVANCE-20-Sep-2018
About 20 farmers attended the field day and a couple neighbors are seriously considering establishing some chestnuts on their farm. During the field day, comprehensive presentation was delivered and can be viewed on our blog. The blog continues to provide updates on what is required to establish a chestnut orchard (blog link).
Learning Outcomes
This grant demonstrated to us and others that, in concept, one of the highest value crops in the Midwest region could be grown on relatively marginal farmland in a depressed community if careful consideration is given to site selection and orchard care. Furthermore, this high value crop could complement current livestock farming in our area because high quality forage can still be harvested off 60-70% of the field while the chestnuts are establishing. In concept, composed manure from livestock could be reapplied to the establishing orchard to build soils, although this has not been formally tested yet.
However, key uncertainties still exist. While winter of 2017-2018 was harsh and many chestnut orchards in Michigan experienced significant losses, the winter of 2013-2014 was worse. Will our chestnuts survive through the harshest winters experienced in Northeast Michigan? Furthermore, we have no data on what yields of chestnuts to expect and what their quality will be. Our harvest of 25lbs of nuts during 2018 is a good start, but not the end of the story. Without long term data on yields and quality, we have no way to predict exactly how profitable a chestnut orchard in our area could be and how long is required to become profitable. Markets are also uncertain. While domestically grown chestnuts are profitable now, will they be in the next 10 years, 20 years, or 100 years. Chestnuts could survive for 100-200 years, so profitability across very long time-scales is also uncertain. These are all important research questions to address on our farm in future years in partnership with Michigan State University and SARE.
Project Outcomes
We were especially honored to earn the first '5-Star Chestnut Orchard Award' from Chestnut Orchard Solutions. The story can be found here. We also receive many positive comments about our blog posts, which has reached farmers throughout the Midwest region.
Study your planting site well beforehand, paying close attention to how water and air drains across the land. During the establishment stage, do not take any shortcuts. Get grafted trees from a respected nursery. Protect them from rodents, sunscold, deer, wind, and drought. Anticipate that each tree you plant will cost at least $35 for the tree and infrastructure. Plan on spending 3-5 hours per week per acre caring for your orchard the first year of establishment.