Final report for FNC19-1186
Project Information
Our beef cooperative is made up of four farming families; Adam and Aubrey Bolender, Eric and Lori Nethero, Ben and Tricyn Parker, and Adam and Alli Hamilton. The cooperative markets and processes the steers on behalf of all the members. Once a sale occurs, a portion of the income from the sale of the steer is retained to offset administrative costs, e.g. insurance, advertising, supplies. The cooperative was formed to create a more consistent and voluminous product for vendors that members could not fulfill independently. We pride ourselves on our all Ohio model where the animals are born, raised, and processed completely in the State of Ohio.
Adam and Aubrey Bolender live and work on the family’s third generation farm with their three children. Their operation consists of 255 acres of owned/leased pasture, 105 mommy cows, 42 weaned calves, and 8 steers. Along with cattle, Adam and Aubrey raise soybeans, corn, wheat and hay in eastern Brown County.
Eric, and his wife Lori, help manage a second generation family farm. Nethero Farms located in Mt. Orab, Ohio. The farm’s revenue comes mostly from crop production on approximately 700 acres (rented and owned), but a portion of the revenue also comes from pork and beef sales. Since the cooperative’s inception, the number of head on their farm has increased from approximately 12 to 30. The Netheros have been raising freezer beef for the consumer for over 30 years. Cattle are bought off a local farmer at weaning and are fed to finished weight.
Parker Red Angus, a third generation family farm, is managed by Ben Parker and his wife Tricyn. It is situated in Russellville, Ohio on 450 acres with approximately 102 mommy cows, 77 calves, 5 bulls, 19 steers, and 40 feeders. Ben has taken the responsibility of caring for the cattle on his family's farm on a full-time basis. Tricyn holds an off-the-farm job as a veterinarian.
Our newest farmer-member, Hamilton Farms is located in Russellville, Ohio. Adam Hamilton is a fourth-generation farmer and Alli grew up on a cattle operation. Together, they purchased a 100 acre farm in 2012. They focus on raising wheat, hay, soybeans and corn as well as operate a cow/calf operation.
Agricultural Cooperatives use a different business model than traditional businesses. It is a medium for producers to channel their product to local distributors and directly to consumers. Since the main purpose of a cooperative is not in generating a profit for the entity alone, it is often run using very little working capital. With limited resources, members of a cooperative must be efficient with their marking strategies to generate the most revenue from the least amount of resources. Choosing the correct advertising methods could mean the difference between the survival or dissolution of a cooperative – a medium that is ecologically sound, socially-responsible, and economically viable. Cooperatives promote stewardship by increasing farmer-members – not by increasing cattle on each pasture. It creates an avenue to farmers who wouldn’t otherwise be able to channel products to larger distributors. Finally, cooperatives strengthen the local economy by increasing revenue for farmer-members and providing a safe, healthy and all-natural product to surrounding communities. In this study, the Buckeye Valley Beef Cooperative hopes to gain insight on the effectiveness of several advertising channels. Each method will be evaluated on its effectiveness by measuring sales growth, customer reach and demographics, and self-reported exposure.
-
- Introduce four new advertising methods to the cooperative, namely support media such as billboard displays, broadcast media such as radio ads, social media such as Facebook, and internet advertisement such as Google AdWords.
- Measure the impact of those methods by evaluating the following variables before and after implementation: sales growth, customer reach, self-reported exposure.
- Share the strategies used in this project and the outcomes via a written report and working with the Ohio State University Extension Direct Agricultural Marketing team to share insights about our progress and short-comings as a cooperative.
Cooperators
- - Producer
- - Producer
- - Producer
- - Producer
- - Producer
- - Producer
- - Producer
Research
We implemented each advertising method on its own so that we could measure the impact of each one individually. We allowed three months per method and then measured its impact on our sales. The measurements used depended on the advertising method implemented. For example, with a billboard, we recorded the cities and locations of our new customers and determined if they are from those areas. We asked each customer where they heard about us via a verbal or written survey (depending on how they purchase from us). With Google Adwords and social media we recorded our sales based on the insights provided by google analytics and the social media platforms. For radio ads, we recorded new sales during those three months and asked each customer where they heard about us via a verbal or written survey (depending on their purchase method). At the end of the study, we wrote a paper which explains our methods, results, discussion, and conclusions so that future cooperatives can learn what advertising methods were most effective. When working with limited capital and time, as most cooperatives do, it is important to invest in proven advertisement methods that give the best return on investment.
Internet advertisements - GoogleAds
Definitions
Campaign - A set of ad groups (which are keywords you select, bids you make on keywords, or ads you create) that share a budget, location targeting, or other commonalities.
Conversions - The number of impressions to actions on our website such as click to call, newsletter sign up, and sales.
Click through rate - The number of times a customer actually clicked on our ad.
Cost per click (CPC) - The number of clicks divided by the cost spent on the campaign.
Conversation rate - The number of conversations divided by the number of total ad interactions during that ad campaign.
Keywords - Are words that you select which match your ads to sites in the Google Network.
Impressions - How often your ad is show on a Google search result or other site on the Google Network.
Method
Before we could begin our ad campaign there were a number of things we had to do. We had to collect our baseline data which were our current sales per month, number of customers per month, and current customer reach. We also needed to set up a Google ads account. We had a gmail account for the business already set up so this wasn't too difficult. There were a number of guides available on the internet to help with this process. We found this one particularly helpful.
The next step was to familiar ourselves with Google ads. We chose to do this by taking a few Lynda.com courses; it has since been purchased by LinkedIn and is now referred to as LinkedIn Learning. If you don't have access to these learning tools, there is a plethora of videos on the internet you can watch.
Finally, before we could get started, we needed to set a few goals for our ads. Did we want to bring more traffic to our website? Make more sales? Get more newsletter sign-ups? Get more calls? Each goal has a different purpose; some are aimed to create a larger following for future purchases, some are merely for branding purposes, and some are strictly targeted at making new sales.
Depending on your decisions, you will select a different campaign for each. There are display campaigns and search campaigns. Let's go through a quick comparison between the two:
- Display campaigns are ads that display on sites that attract those who are more likely to be interested in your product. Have you ever been to a blog or Facebook and noticed ads appear on the page? Those are display ads and are often used for branding and remarketing purposes where the user isn't necessarily looking for your product.
- Search campaigns are targeting those who actually search for your product or something similar. In our instance, if you searched for "beef in bulk" or "local beef near me", depending on how popular the keywords we selected were, and our bid on those keywords, we would show up near the top of the search as an ad. This campaign type is effective for capturing those who have a direct need for your product or services.
We decided to create two different search campaigns. One of our campaigns advertised our small bundles and direct-to-door delivery, and the other advertised our quarter, half, and whole beef sides.
Each month we evaluated our results and adjusted our ads as needed. It is very common to lose money in your first month as you experiment with keywords, ad campaign types, and other variables. In the second month, the results from month one gives you better insight so you are better able to dial in on traffic by pausing keywords that aren't working efficiently and lowing bids on others. In the last month you will start to see your return on investment.
After the testing period was over, we collected our data on new customer reach, new number of customers, sales during those months, and analyzed the results of the self-reported exposure to the Google Ads. We compared the results to our baseline data.
Results
Google Ad Data: We ran two search engine campaigns from May 1, 2019 - July 31, 2019. During this time we had over 99,667 impressions. We had a click-through rate of 2.39% and our cost per click was $1.84. We spend $3,260.63, had 1,350 conversions, and our conversation rate was 67.47%.
Sales Data: During our Google Ad campaign we did not see a significant increase in sales, customer numbers, or customer location. However, we did have 15 customers purchase a quarter, half, or whole beef after seeing our Google Ad -- according to their survey responses completed during their ordering process. We saw a 50% Return on Investment (ROI).
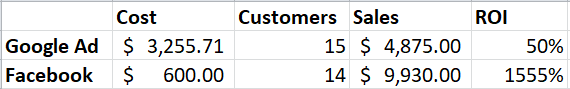
Table 1: Return on Investment per Advertising Method
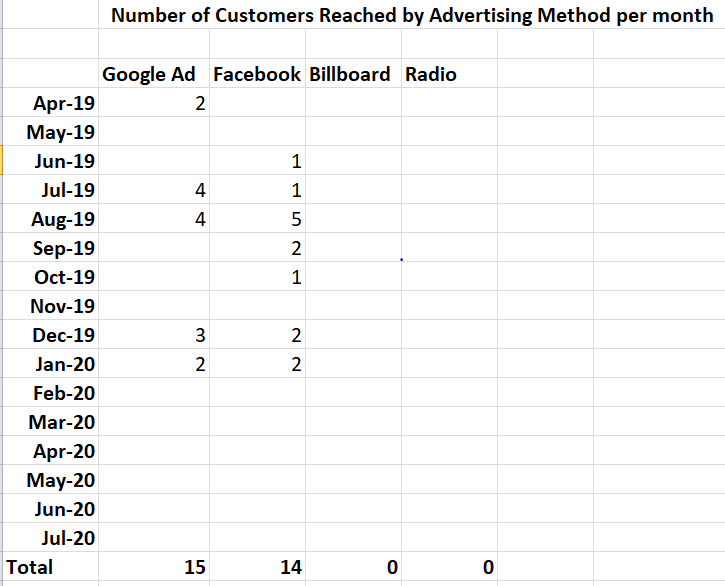 Table 2: Number of Customers Reached per Advertising Method per Month
Lessons Learned
Time Spent: Besides the time it took to learn Google Ads and all the terms that went along with this platform, we also had to learn about Google Analytics and how to use it to understand and track the new traffic we created from Google Ads. We also took a LinkedIn Learning course on Google Analytics. This course teaches you how to set up your account, set up conversions for Google Analytics to track, and how to understand the reports available to you in Google Analytics. There was a considerable amount of time spent on just learning how to use these services before implementation.
Advertising Length: In future cases, we recommend a longer testing period. As stated above, it takes about three months to really get a feel for your target audience, and this likely had an effect on our results.
Conclusions and Future Recommendations
When considering our time, money spent, and our return on investment, our analysis determined that this advertising method was not effective for our cooperative. Future studies could benefit from looking at confounding variables that may have effected our results such as website efficiency, ad efficiency, or better analytics evaluation; therefore, our recommendation to other cooperatives would be to hire a marketing expert when using these services. If we were able to hire a marketing expert to help create more efficient ads, help with SEO management, and help improve the efficiency of our website (such as loading times and user-interface), our results may have been different. However, the purpose of this study was to find methods that don't deplete the limited working capital and resources most cooperatives struggle with and this method did not meet those standards.
Support Media - Billboards
Method
We reached out to our local billboard company, Lamar Companies, for our billboard solutions. They were fantastic to work with. About one month from our target implementation date, we gave them our budget and target demographics and they helped us design a billboard display that met those needs. We placed our billboard in the Loveland area on a major artery highway from July 15, 2019 - September 22, 2019 for $6,000. Their company also analyzed our demographics and compared it to their data to help us determine the perfect location for the billboard. To make our return we had to sell at least 3 steers.
We collected our baseline data before implementation (number of customers per month, sales in dollars per month, and customer reach). We collected the same data after the testing period had ended, along with the self-reported exposure results by our new sales during that period, and compared to gather our results.
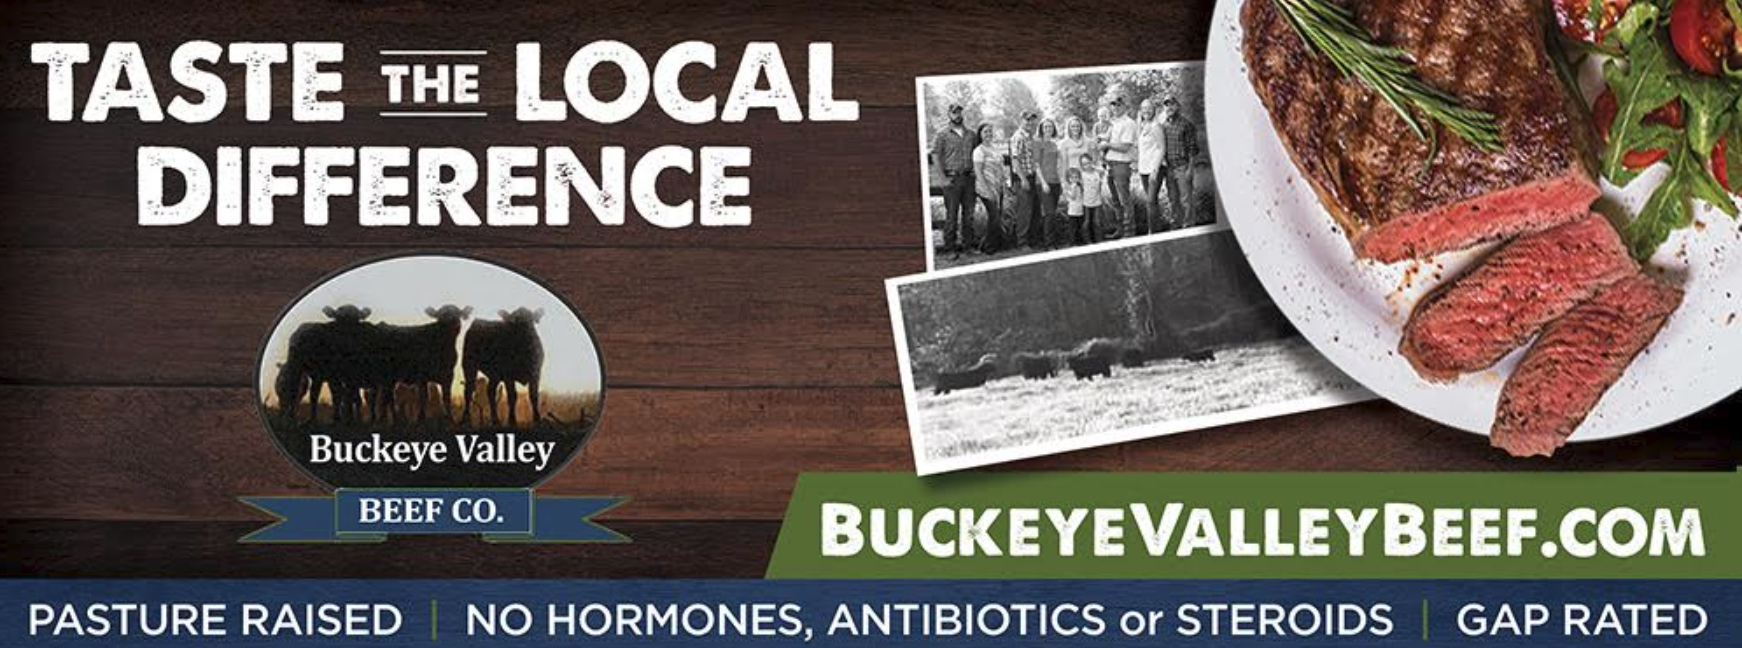 Picture 1: Our Billboard Advertisement
Results
We used Google Analytics, sales inquiries, and customer survey responses and location to track our website traffic during this period.
Google Analytics Data: Google Analytics allows you to track your website traffic search locations; it can pick up where your customers are searching for your product. We did see an increase in traffic for the Loveland area (see Table 3) during this time, but no customers selected billboard advertisements as the method they heard about us from during their purchasing process, nor did anyone call stating they saw our billboard and had additional questions. Our direct search traffic for the Cincinnati area during our testing period made up 8 percent of our overall direct search traffic.
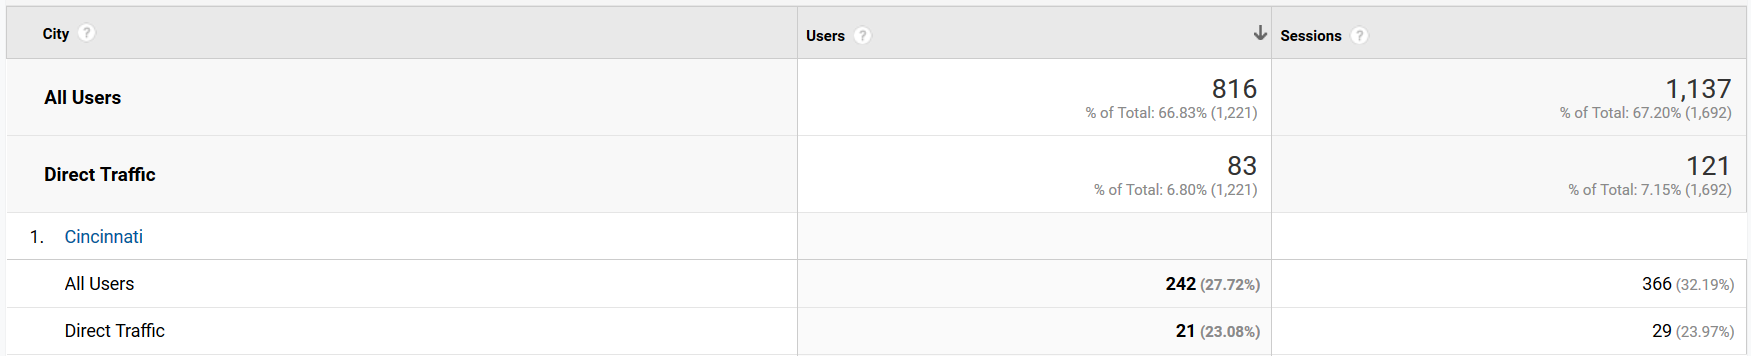
Table 3: Number of Direct Traffic Users from our Target Location to our Website from July 15 - September 22, 2019
Sales Data*: From July 15 - September 22, 2019, we had 22 beef shares purchased. Of these shares, none of the customers were from the target location and none of them chose billboard as the method they heard about us from (6 word of mouth, 2 return customers, 2 google ads, 2 direct searches, 1 referral, 7 social media referrals, 3 other website mentions).
Conclusions and Future Recommendations
Support Advertising (Billboard advertising) did not see a return on investment for our cooperative. We spoke to an acquaintance after the billboard testing period had ended who confirmed their data is finding the same conclusions. To get the biggest return for your investment with billboards, you need to flood the area with them -- which helps with re-marketing and name recognition. Later that year, we did a craft show in the same area and had several visitors tell us they had heard of us before. It would be hard to measure how our brand has gained recognition in that area, but that was a promising affirmation that it is starting to take hold. We have also noticed a steady increase in direct search traffic since starting this study. Future studies would do well studying the use of several billboards in a target area over a longer period of time to determine if this increases its effectiveness. Distributing a short survey to those in that target market to measure company recognition would also help determine if brand recognition was gained during the study.
*Update: Later in the study, after COVID-19, we captured 4 sales relating to the billboard advertisement. This resulted in $3,780 in sales for a final ROI of -37%.
Social Media - Facebook
Methods
There are a few ways to advertise using Facebook. You can spend money to boost your posts and you can also create display ads that will show up on newsfeeds for potential new customers. We choose to boost our Facebook posts. To prep for our 12 week social media campaign one of our co-op members (who just happens to be a teacher) created a wonderful 12 week story time-line. We planned to post five days a week for twelve weeks with a budget of $600 to accomplish our experiment. We created a shared space on our cloud for our members to share their pictures and help create the content for our upcoming posts. Our timeline for this piece of our research was December 1, 2019- April 1, 2020.
Results
We used Google Analytics, Facebook analytics, sales inquiries, and customer survey responses and location to track our website traffic and sales during this period.
Google Analytics Data: During our 12 week experiment, 4800 people visited our website. Of those, 2,223 found us through Facebook (46%).
Facebook Analytics: Facebook has an ad manager page that will show you all your boosted post and the performance of each of those posts. There you can see how much of your budget you have spent and which type of posts work the best for you.
Sales Data: 78 out of 476 new customers selected Facebook as the method in which they heard about us. This resulted in $66,000 in sales for an ROI of 10900%.
Conclusions and Future Recommendations
Our Facebook campaign was a resounding success. It was the easiest, simplest, and quickest of the four advertising methods to implement. We didn't have to work with an expert as we did with radio and billboard advertisements and we didn't have to spend countless hours learning how to use programs as we did with Google Ads to use. We spent $600 and made $66,000 in sales. We would highly recommend this method to anyone starting off in advertising. Future studies would do well to replicate this study in another period to validate the results particularly since COVID-19 hit during the middle of the campaign. However, we were seeing success prior to the pandemic with this advertising method. COVID-19 may have caused our customers to buy quicker than normal and because it happened during the middle of this experiment we were able to capture sales that might not have taken place until later and therefore capture which advertising method brought them to us.
Broadcast Media - Radio
Method
Before implementing this experiment, our cooperative did some demographic research and received some quotes from local radio stations. We had to first determine the demographics that best described our current customers and what we felt would best describe new customers. Then, we received quotes from NPR, B105, and 700 WLW along with their customer demographics. We went with the company that had the best price and demographics that best aligned with our own -- NPR. Our radio advertisement study was conducted from April - June 2020. We had a budget of $15,000 and were able to get it a little cheaper. NPR helped us to create 20 second ads, 22 sessions per week for a total of 348 sessions.
Results
We used sales inquiries and customer survey responses and location to track our website traffic and sales during this period.
Sale Data: During this period, we had 30 customers select radio ads as the method in which they heard about us. This resulted in $27,090 in sales for an ROI of 85%.
Conclusions and Future Recommendations
Radio ads were also surprising successful for us. We selected this method because we had used a local radio company on a much smaller budget in the past and it worked well for us. However, when we saw the cost to advertise on a larger radio station, we were pessimistic that we would see a positive ROI. We nearly doubled our investment costs. For us, as a cooperative, we use retains on each product sold through the cooperative to pay for advertising costs; the sales gained from this method resulted in $541 in retains and therefore not enough to sustain advertising with this method in the future. However, for a farm or another type of organization, it may work well. Future studies would do well replicating this study in another period to validate our results as our study was conducted during the COVID-19 pandemic.
Summary of Findings
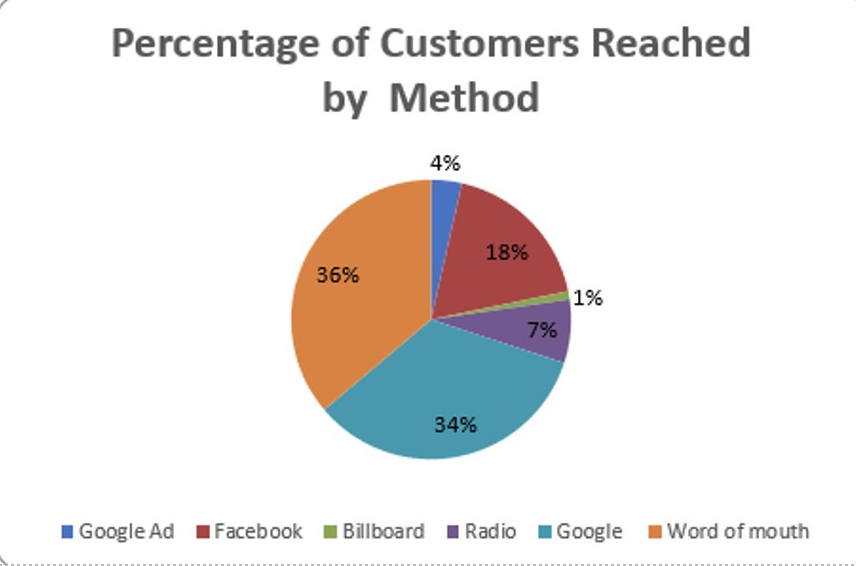
Table 4: Percentage of Customers Reached by Method
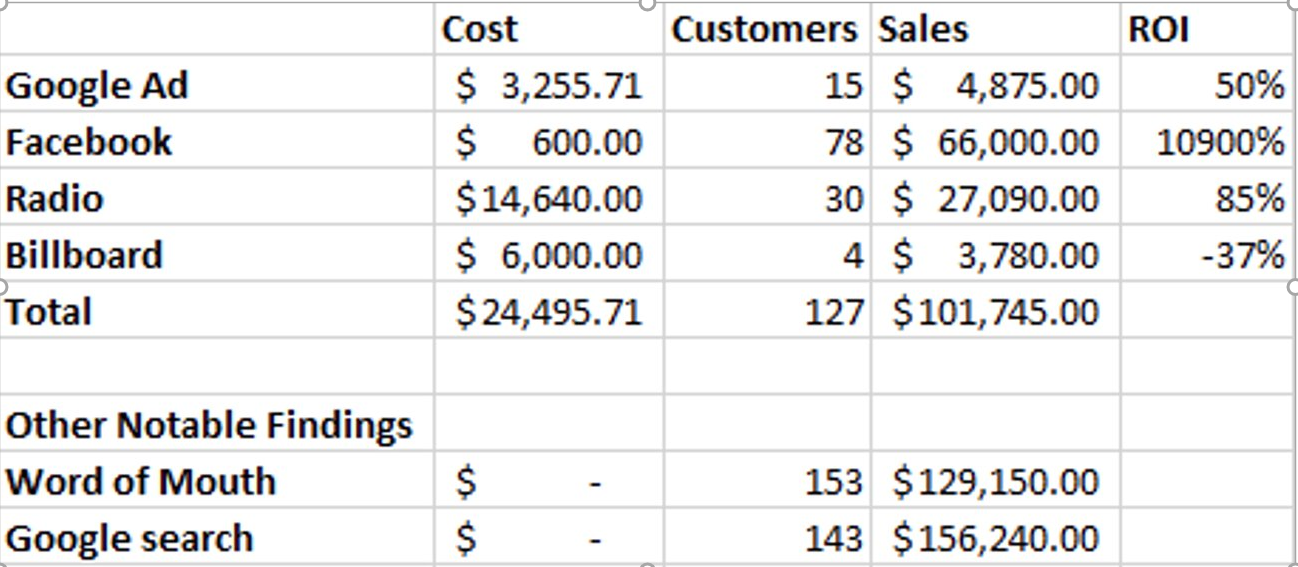
Table 5: Summary Return on Investment for Each Method Implemented
Overall, the best advertising method in our experiment was Facebook ads followed by Radio ads, Google Ads, and Billboards. Going forward we will likely utilize Facebook ads for advertising.
Another notable finding was that word of mouth eventually surpassed all methods used during this experiment and accounted for 36% of all the sales during this time period (greater than all the methods combined). Research has shown time and time again that word of mouth is the most powerful method in advertising and our study validates those claims. However, to harness the true power of word of mouth you have to invest in some advertising methods to kick off the cycle.
A simple Google search accounted for 34% of our sales during this study, also surpassing all methods used during this experiment. This confirmed for us the importance of Search Engine Optimization (SEO) when creating your websites, blogs, and other relevant content. Your entire online presence has a purpose so make sure you are taking advantage of it when you can. Quick tip: Did you know alt text in pictures helps your SEO? Take advantage of any free webinar, YouTube video, or LinkedIn Learning course you can to learn how to manage your SEO.
Educational & Outreach Activities
Participation summary:
We presented our NC SARE grant findings at OSU CFAES Foodpreneur program. This was later shared on OSU's CFAES Farm Science Review as an online webinar and also shared through two blog articles here and here.
The Foodpreneur program was created, managed, and hosted by OSU CFAES Direct Marketing Team and Ohio Farm Bureau.
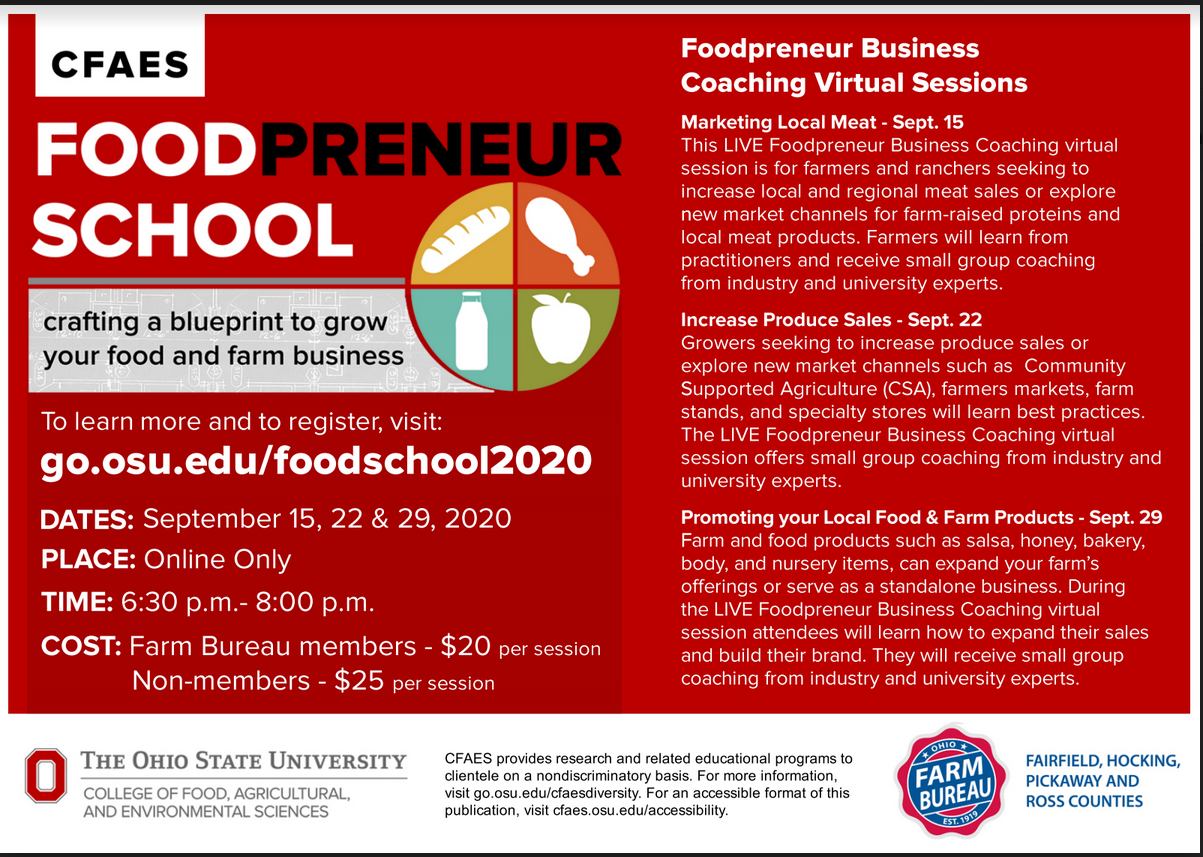
Picture 2: Flyer for Promotion of the Foodpreneur School
The flyer was disbursed on our social media platforms as well by Ohio Farm Bureau and OSU CFAES.
Due to COVID-19, we presented our findings via Zoom to those who registered for the Foodpreneur School. Our presentation can be found here. The benefit to the online presentation is that it was recorded and shared online in OSU's Virtual Farm Science Review and can be viewed at anytime in the future along with this report and the blogs that were created to share our results.
Learning Outcomes
At the onset of this project, we set out to find methods of advertising that were both easy to implement and had a positive ROI. Since many farms operate on little working capital it is important to utilize our advertising dollars as efficiently as possible. I believe we have adequately measured several of the advertising methods that many will look to to advertise for their farming operations.
Hypotheses vs. Findings
Our results were a bit surprising to us. We had spoken to several marketing experts prior to this implementation and had hypothesized which methods we expected to be the most successful. For instance, we expected Google Ads to be very efficient after speaking to the Ohio Beef Council; they actually decreased their social media advertising and increased their usage of Google Ads (specifically using display ads on YouTube and other similar sites).
We also hypothesized that support media, such as billboard advertising would do well. We have used yard signs in the past and those did really well at attracting new customers. Since this billboard was much larger, designed by experts, and placed in a heavily popular area, we expected our initial cost to be easily recovered. We suspect the reason the yard signs might have worked well was because it flooded the target market with our name and this constantly reminded drivers about our product -- rather than just one passing thought on a billboard.
We hypothesized that social media advertising wouldn't be as successful due to advice we had previously noted above. However, this showed extraordinary results for us and was very easy to implement. To date, our website traffic, social media following, and sales have seen uncharacteristic growth. This surprised us because we had been cautioned by marketing experts and research (Danaher and Dagger 2013) about the effectiveness of social media marketing. COVID-19 hit during the middle of the our campaign, but the growth trends started before this time and sky-rocketed from there.
Finally, we hypothesized that broadcast media wouldn't bring a positive return on investment and yet it actually almost doubled our investment.
Advantages and Disadvantages of a Marketing Study
Some advantages of this project were that we were able to benefit from the successful advertising methods. Cumulatively, we made positive strides in our brand recognition. Our word of mouth customers grew tremendously and we can't help but believe they had origins in some of the advertising methods we experimented with in this study. Finally, we enjoy connecting and sharing best practices with other farmers and ranchers and conducting this study has led to many networking opportunities we otherwise wouldn't have had.
Some disadvantages of this project were not being able to conduct other advertising methods during times when we were testing one. We had several things we did in past years that we passed on this year so we could minimize confounding variables when calculating our results. The other disadvantage was sticking to the timeframes we originally created and budgets we estimated in the beginning.
Looking Forward and Your Next Steps
This study was a great way to see what advertising methods work well for small farms and cooperatives just like us. We plan to routinely use social media advertising for our cooperative going forward. However, due to the COVID-19 pandemic striking during the middle of the study, please be cautious in implementing these methods into your own businesses until further research is completed to validate the results. We recommend starting off small and working your way into the more expensive, yet potentially highly effective advertising methods such as radio advertisements. As you begin to grow your own businesses, be sure to take advantage of the free ways to reach customers. Make sure your website maximizes SEOs. Ours has a wizard tool that will help you with this process and grade the strength of your SEO use. Be sure to create blogs and take advantage of interviews, newspaper write-ups, and magazine articles that will redirect customers back to your website. Each of these things refreshes traffic to your site and helps you rank higher on a Google Search. Be sure to create business pages on all the popular search engines and maintain your presence on social media platforms. I know all of these things take you away from the job you enjoy the most — working on your farms — but it really makes a huge difference in your bottom line and allows your customers an insight into a day in our lives — a win-win for all.