Final report for FNC21-1286
Project Information
We vary in size from a 65 acre mini-farm to several hundred acres used for raising cattle or seed crops.
One of our farm team members is an organic farmer, and two others are looking to transition. Several of us are beginning to work cover crops into our rotations, and two of us are adapting reduced tillage methods into our operations. This grant may help several of us work into seed crops if we are successful and find an economic alternative that is well adapted to our operations.
Corn prices are low, input costs are high. We know rotation, cover crops, and reduced tillage can improve this and our environment, but reduced seed costs and seed sales could also improve economic viability in a socially responsible manner. Open pollinated (OP) corn is cheap and great for silage, but rarely for grain due to low yields. We have a good OP (Dairyland) corn variety that deserves improvement for yield. The fastest way to improve corn is hybridization, so we used modern and exotic lines identified from reported genomic and new field-testing to potentially boost the performance of Dairyland. We made and tested topcross hybrids in 2019-2021 from North Dakota to Vermont, and have also formed a new synthetic OP population (by intermating the best of these crosses) in 2022 with the hope to increase yields and seed sale opportunities. We measured grain nutritional quality and other factors to evaluate the economics of on-farm seed production (reviewer suggestion), and have found students from UW-Madison to help with those evaluations in 2023 and 2024. We posted a video online to promote the project, and held a field day in Minnesota in fall of 2022. Information and seeds will be released to the public in 2023 and beyond. We intend to do more public outreach in 2024.
- Evaluate 30 corn testcrosses and check varieties in university trials and on our farms. (Completed in 2021)
- Hold field events in MN, WI, and MI to discuss sustainable corn and seed production. (Event held in Minnesota in 2022)
- Evaluate changes in knowledge and predicted changes in behavior among attendees. (2 attendees already grow OP corn)
- Evaluate the economics of on-farm seed production with a collaborating students. (Completed in 2023 and 2024)
- Post our methods and findings to the internet and Extension/NGO cooperators. (Started in 2022, more planned for 2023 and 2024)
- Hold a webinar about our methods and findings, evaluate changes among audience as above. (Planned for 2024)
- Increase and release seeds so farmers can grow their own superior topcross hybrids or OP corn varieties. (Started in 2022 and onward)
Cooperators
- (Researcher)
- - Producer (Researcher)
- - Producer (Researcher)
- (Researcher)
- (Researcher)
- (Researcher)
- (Researcher)
- - Producer (Researcher)
- (Researcher)
- - Technical Advisor (Researcher)
- - Technical Advisor (Researcher)
- - Technical Advisor (Researcher)
Research
A superior OP corn variety, Dairyland (Guelph Stiff Stalk Synthetic x Wisconsin Quality Silage), was crossed with sister crosses of inbred lines from USDA, inbreds from North Dakota State University (NDSU), old OPs from the Midwest, and inbreds with exotic ancestry selected by Frank Kutka. Recent genomic studies allowed us to choose inbreds from the USDA collection that could add hybrid vigor to crosses with Dairyland, especially lines with Minnesota 13, Iodent, Pioneer Mixed, Flint, and exotic backgrounds. Frank Kutka crossed lines/populations with Dairyland in 2019-2020 using hand pollination.
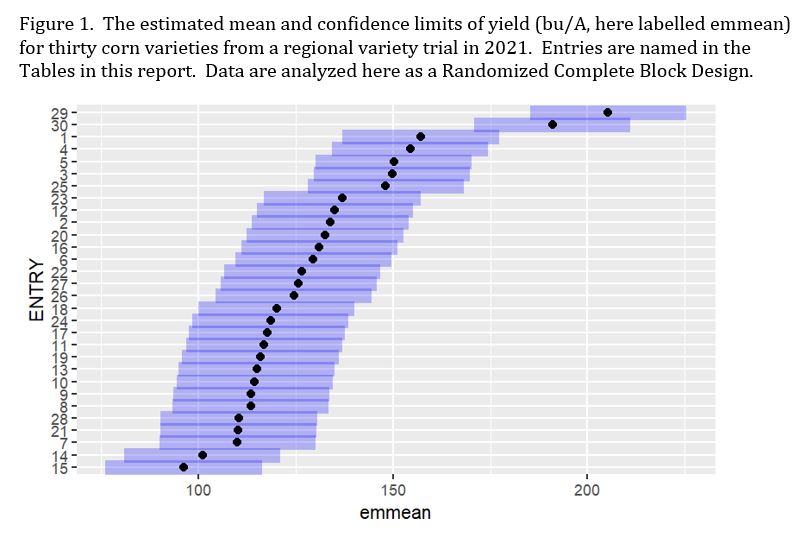
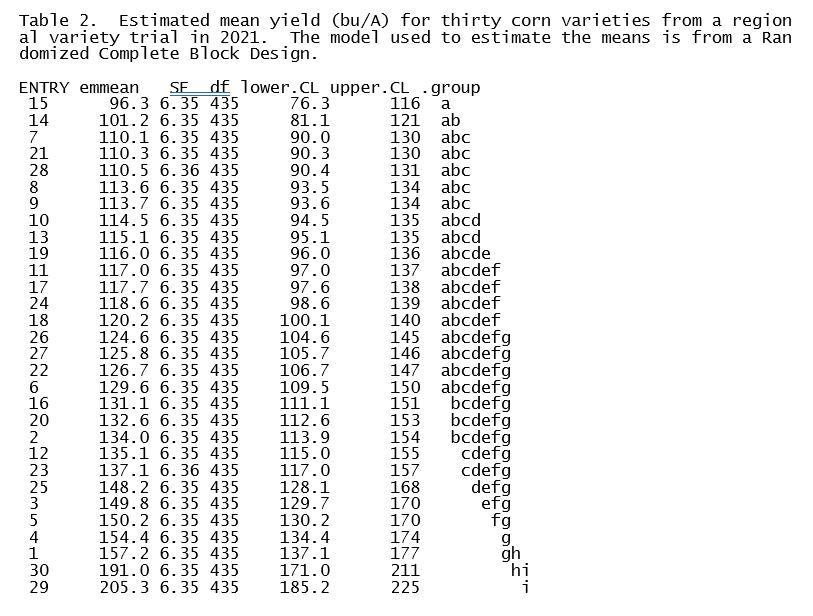
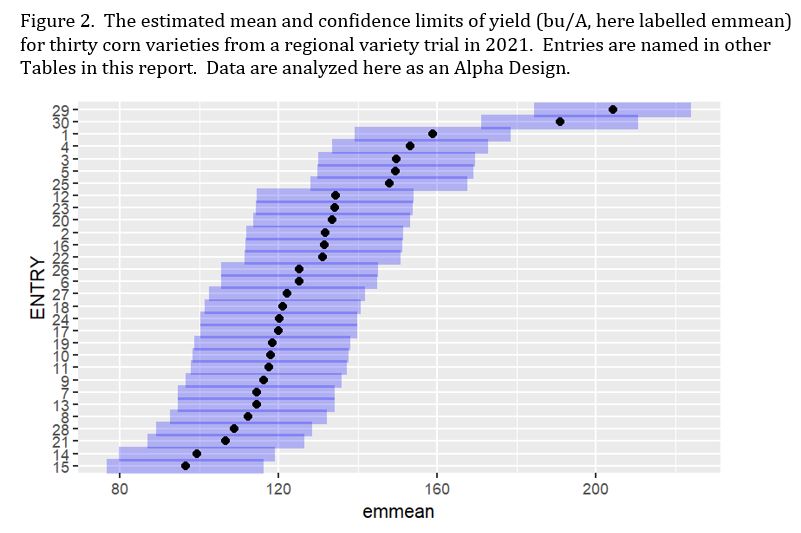
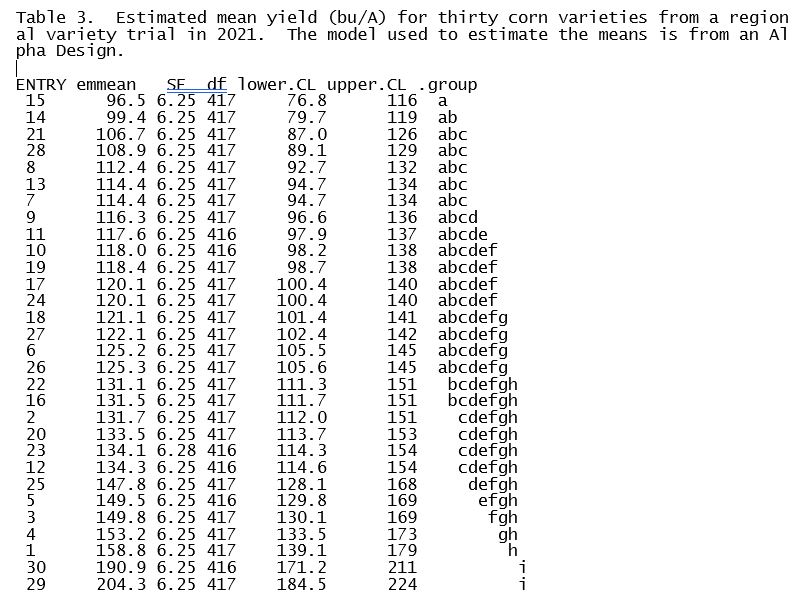
Kutka sent seed of twenty-two testcrosses, two hybrid check varieties from Foundation Direct Organics, and six OP checks from our team of farmers and from Green Haven OP Seed Group to university cooperators in ND, WI, MI, NY, and VT in April 2021 for evaluation of yield, lodging, and grain moisture in replicated trials. Kutka and Daniel Hayden, one of our graduate student research partners, organized and analyzed the data for yield to help evaluate experimental methods and to choose parents for future breeding. These analyses were carried out from 2022 to 2024.
Each collaborating farmer also planted out a single replicate of each of the thirty experimental entries on their farms in 2021. Plots were two rows and @18’ long, planted in a block with an OP corn border. Plots on one farm were demolished by weather before full growth, but the other four came through with enough grain for evaluation of nutritional quality. The on-farm plots were featured in a video, with field events cancelled due to the pandemic. We collected grain from the farmer plots and sent it to the Dairy One lab in Ithaca, NY for NIR analysis of major nutrients. Plots were also be scored for plant form and lodging. These data and the data from university yield trials were summarized and shared with Extension, Non-governmental organizations, and via Facebook.
Kutka and Smith collected management data from our regular seed production, and several other farmers across the region also provided data on the time and effort involved in seed production. These data were shared with Elena Hill, one of our graduate student research partners, in summer of 2023. Late in 2023 Kutka also pulled together average costs of production from State Extension publications in order to more fully consider the costs of producing corn for seed. An updated version of the CornPro3 spreadsheet model used for the Heritage Maize project twenty years ago, was used again to predict the potential value of corn protein levels and corn variety characteristics given current costs and prices in the market late in 2023.
In 2022, we increased and crossed seeds of the best testcrosses to form an improved version of Dairyland. In 2023 Roger Coulter grew out the F1 generation to generate F2 seeds and to increase the supply. As of early 2024 we have released it publicly via the USDA North Central Plant Introduction Station in Ames, IA. It was also sent in for NIR analysis.
A short video about making and using synthetic varieties was updated and will be submitted with this report. It will also be shared via social media. A ZOOM webinar about the project is still planned for 2024, but is outside the time frame of this study. Additional yield evaluations of the new population are being carried out in ND, SD, MN, WI, MI, NY, VT, and PA in 2024. Those results will be released later via Facebook and our intended webinar.
Seeds of our thirty experimental varieties (test crosses, OP varieties, check hybrids) were counted out, packed, and shipped to all project participants in spring of 2021. We thank Bill Tracy of the University of Wisconsin-Madison for allowing us to use his seed counter! Replicated trials were planted by NDSU, UW-Madison, MSU, Cornell, and UVM. Farmers in Minnesota, Wisconsin, Michigan, and New York planted single replicates to grow grain for nutritional analyses and to provide a backdrop for field events. However, the planting in Michigan was destroyed by flooding, and the pandemic continued so we cancelled all field events. Instead, on 18 October we posted a project introductory video on the Corn Culture blog on Facebook (https://www.facebook.com/cornculture.info/). Huge thanks to our university partners! This section of our budget cost more than originally planned because we were able to be included in so many replicated trials, but we are very happy to have reached so many university partners.
As of January 2023, all the universities had submitted their data to us. Preliminary summaries of these were posted to the Corn Culture blog on Facebook early in 2022 and they also featured in our fall 2022 field event at Stan Smith's farm in Minnesota. All nutrient data have been collected and analyzed. These were summarized and posted on the Corn Culture blog on Facebook as well. They were mentioned during our fall field event and will also be explained in our last video and webinar in 2024.
The degree to which several of the test cross combinations pushed the relatively low yielding Dairyland parent to yields above the other open-pollinated varieties is noteworthy (Table 1). Further evaluation of crosses among the B73, Iodent, Pioneer Mixed, and Mo17 two-line populations directly seems valuable given the use of these match ups in the seed industry. The B37 population may also be of interest, although its test cross yield was lower, in part due to poor germination. The two-line populations we tested were significantly easier to work with than the single inbreds themselves. In 2019 the inbreds were generally short and low in vigor, certainly not very competitive with weeds. On the other hand, the two-line populations are sister line crosses, and were as tall as most hybrid corn during test crossing in 2020. These would be far easier for farmers to grow and hybridize than the single inbreds themselves. They are also likely to be higher yielding as parents for hybrid seed production, which could increase seed yields, although this has not yet been investigated. Also worthy of further investigation could be test crossing onto the better open-pollinated populations like Minnesota 13, Stan’s OP, or Tommy Boy to see if they could be pushed farther than the much lower yielding Dairyland population.
Our comparison of currently available, relatively early, open-pollinated varieties showed that our newer Dairyland parent population was not competitive for yield, although it dried down nearly as well as Minnesota 13 and Stan’s new variety. It also stood quite well. By comparison, Stan’s population was quite impressive in the regional trials, and does appear to be a leap forward for open-pollinated varieties in the area. It dried down as well as the 90-day hybrids, and lodging was also comparable. Scott’s Tommy Boy was also a clear improvement on Victor Kucyk’s Wapsie Valley, one of its parents, given its improved standing abilities. However, the yields of the check hybrids were still 43-56 bu/A better than our best open-pollinated varieties (Table 1). The open-pollinated varieties still look stronger for silage than for grain. Seed saving and on farm breeding are our heritage, but they are not without cost.
| Averages across Sites from North Dakota to Vermont | |||||||
| PEDIGREE | YIELD | RANK | LODGING | % MOIST | Y/M | %Cpro | %Cfat |
| B73s/Dairyland | 155 | 6 | 4.0 | 20.4 | 7.52 | 9.45 | 5.23 |
| B37s/Dairyland | 133 | 12 | 2.3 | 21.0 | 6.39 | 9.68 | 5.55 |
| Iodents/Dairyland | 149 | 8 | 1.4 | 21.3 | 6.94 | 10.03 | 5.70 |
| Pioneer Mixed/Dairyland | 153 | 7 | 3.8 | 20.6 | 7.13 | 9.10 | 5.35 |
| Mo17s/Dairyland | 149 | 8 | 2.7 | 20.1 | 7.17 | 9.45 | 5.50 |
| MN13s/Dairyland | 129 | 16 | 3.9 | 19.7 | 5.99 | 9.48 | 5.13 |
| EP1/CO255//Dairyland | 109 | 22 | 3.8 | 20.1 | 5.31 | 10.43 | 5.68 |
| 80-1/No. 380//Dairyland | 113 | 23 | 11.4 | 21.1 | 5.25 | 10.33 | 6.30 |
| Pete Seeger Cross/Dairyland | 114 | 22 | 5.7 | 19.9 | 5.35 | 9.85 | 6.13 |
| Wachichu/Compton's Early//Dairyland | 115 | 19 | 11.8 | 21.1 | 5.72 | 9.90 | 6.35 |
| Dairyland/(FBHJ/Euro Flint S3) | 116 | 19 | 3.8 | 19.6 | 5.66 | 10.15 | 6.23 |
| ND2004/Dairyland | 133 | 13 | 0.9 | 20.3 | 6.55 | 9.45 | 5.25 |
| ND2006/Dairyland | 115 | 20 | 7.9 | 19.3 | 5.70 | 9.93 | 5.25 |
| (CG-BS16/Syn A-NL)/Dairyland | 102 | 25 | 8.0 | 19.4 | 5.11 | 9.90 | 5.90 |
| Cateto Cross/Dairyland | 97 | 27 | 4.6 | 20.9 | 4.29 | 9.75 | 5.83 |
| NDBSK/Dairyland | 130 | 14 | 4.6 | 22.1 | 5.70 | 9.63 | 5.90 |
| Silver King/Dairyland | 116 | 20 | 14.9 | 20.7 | 6.02 | 9.75 | 5.98 |
| Dairyland/Cuzco Cross | 118 | 18 | 12.7 | 25.8 | 4.75 | 9.68 | 5.50 |
| Dairyland/Cacahuacintle Cross | 115 | 20 | 16.1 | 22.6 | 5.40 | 10.40 | 6.10 |
| Dairyland/Conico Cross | 132 | 13 | 6.8 | 21.9 | 6.02 | 10.10 | 5.70 |
| Sequia/Dairyland | 111 | 22 | 7.4 | 20.7 | 4.84 | 9.40 | 5.80 |
| Dairyland/Coroico Cross | 125 | 15 | 2.1 | 22.8 | 5.92 | 10.25 | 6.50 |
| Minnesota 13 | 137 | 11 | 8.0 | 19.0 | 7.27 | 9.63 | 5.03 |
| Dublin | 118 | 19 | 23.6 | 22.6 | 5.57 | 10.38 | 5.10 |
| Stan's OP | 147 | 8 | 5.9 | 19.7 | 7.75 | 9.15 | 4.85 |
| Wapsie Valley | 125 | 15 | 28.5 | 21.1 | 6.80 | 10.10 | 5.65 |
| Tommy Boy | 125 | 16 | 14.1 | 21.6 | 6.15 | 10.20 | 5.28 |
| Dairyland | 109 | 24 | 3.6 | 20.7 | 5.14 | 10.03 | 5.70 |
| FDO 8833 | 203 | 1 | 1.6 | 19.6 | 10.64 | 8.13 | 4.50 |
| FDO 8924 | 190 | 2 | 1.5 | 19.4 | 9.92 | 7.98 | 4.55 |
| PEDIGREE | YIELD | LODGING | STAND |
| B73s/Dairyland | 161 | 1 | 70 |
| B37s/Dairyland | 130 | 0 | 45 |
| Iodents/Dairyland | 164 | 1 | 73 |
| Pioneer Mixed/Dairyland | 181 | 1 | 70 |
| Mo17s/Dairyland | 169 | 0 | 71 |
| MN13s/Dairyland | 174 | 1 | 71 |
| EP1/CO255//Dairyland | 117 | 2 | 73 |
| 80-1/No. 380//Dairyland | 119 | 9 | 70 |
| Pete Seeger Cross/Dairyland | 145 | 1 | 69 |
| Wachichu/Compton's Early//Dairyland | 93 | 17 | 61 |
| Dairyland/(FBHJ/Euro Flint S3) | 137 | 2 | 69 |
| ND2004/Dairyland | 131 | 0 | 69 |
| ND2006/Dairyland | 138 | 1 | 69 |
| (CG-BS16/Syn A-NL)/Dairyland | 115 | 1 | 70 |
| Cateto Cross/Dairyland | 126 | 2 | 71 |
| NDBSK/Dairyland | 147 | 2 | 68 |
| Silver King/Dairyland | 86 | 32 | 51 |
| Dairyland/Cuzco Cross | 97 | 23 | 57 |
| Dairyland/Cacahuacintle Cross | 84 | 29 | 54 |
| Dairyland/Conico Cross | 132 | 6 | 68 |
| Sequia/Dairyland | 150 | 0 | 70 |
| Dairyland/Coroico Cross | 86 | 2 | 64 |
| Minnesota 13 | 135 | 8 | 65 |
| Dublin | 89 | 36 | 46 |
| Stan's OP | 128 | 4 | 59 |
| Wapsie Valley | 54 | 49 | 45 |
| Tommy Boy | 97 | 19 | 41 |
| Dairyland | 119 | 4 | 62 |
| FDO 8833 | 184 | 0 | 70 |
| FDO 8924 | 194 | 0 | 71 |
| Pedigree | Yield | Lodging | Moisture |
| B73s/Dairyland | 173 | 3 | 20.1 |
| B37s/Dairyland | 147 | 7 | 20.9 |
| Iodents/Dairyland | 186 | 2 | 21.6 |
| Pioneer Mixed/Dairyland | 161 | 5 | 19.9 |
| Mo17s/Dairyland | 160 | 8 | 19.9 |
| MN13s/Dairyland | 136 | 5 | 19 |
| EP1/CO255//Dairyland | 146 | 3 | 20.6 |
| 80-1/No. 380//Dairyland | 133 | 13 | 21.2 |
| Pete Seeger Cross/Dairyland | 134 | 8 | 20 |
| Wachichu/Compton's Early//Dairyland | 152 | 10 | 20.9 |
| Dairyland/(FBHJ/Euro Flint S3) | 134 | 6 | 19.8 |
| ND2004/Dairyland | 168 | 1 | 20.2 |
| ND2006/Dairyland | 139 | 6 | 20.7 |
| (CG-BS16/Syn A-NL)/Dairyland | 127 | 7 | 18.3 |
| Cateto Cross/Dairyland | 124 | 6 | 21.5 |
| NDBSK/Dairyland | 158 | 4 | 22 |
| Silver King/Dairyland | 131 | 15 | 20.6 |
| Dairyland/Cuzco Cross | 144 | 10 | 30 |
| Dairyland/Cacahuacintle Cross | 136 | 10 | 23.2 |
| Dairyland/Conico Cross | 164 | 10 | 22.7 |
| Sequia/Dairyland | 134 | 5 | 21 |
| Dairyland/Coroico Cross | 144 | 3 | 23.8 |
| Minnesota 13 | 146 | 9 | 17.8 |
| Dublin | 119 | 23 | 24.1 |
| Stan's OP | 175 | 6 | 19.1 |
| Wapsie Valley | 142 | 18 | 21.6 |
| Tommy Boy | 138 | 20 | 22.3 |
| Dairyland | 129 | 2 | 19.9 |
| FDO 8833 | 238 | 2 | 19.4 |
| FDO 8924 | 223 | 3 | 17 |
| PEDIGREE | YIELD | LODGING | MOISTURE |
| B73s/Dairyland | 182 | 4.6 | 23 |
| B37s/Dairyland | 150 | 0.3 | 23 |
| Iodents/Dairyland | 158 | 1.8 | 22 |
| Pioneer Mixed/Dairyland | 171 | 1.2 | 23 |
| Mo17s/Dairyland | 169 | 0.9 | 22 |
| MN13s/Dairyland | 139 | 0 | 22 |
| EP1/CO255//Dairyland | 118 | 5.3 | 22 |
| 80-1/No. 380//Dairyland | 127 | 10 | 23 |
| Pete Seeger Cross/Dairyland | 110 | 5.8 | 22 |
| Wachichu/Compton's Early//Dairyland | 108 | 9.5 | 23 |
| Dairyland/(FBHJ/Euro Flint S3) | 137 | 3.3 | 21 |
| ND2004/Dairyland | 163 | 0 | 22 |
| ND2006/Dairyland | 110 | 16.4 | 19 |
| (CG-BS16/Syn A-NL)/Dairyland | 94 | 12.8 | 22 |
| Cateto Cross/Dairyland | 88 | 6 | 21 |
| NDBSK/Dairyland | 145 | 1.2 | 24 |
| Silver King/Dairyland | 136 | 6 | 23 |
| Dairyland/Cuzco Cross | 153 | 8.2 | 26 |
| Dairyland/Cacahuacintle Cross | 131 | 4.9 | 24 |
| Dairyland/Conico Cross | 143 | 4.2 | 24 |
| Sequia/Dairyland | 105 | 15.4 | 21 |
| Dairyland/Coroico Cross | 153 | 0 | 24 |
| Minnesota 13 | 148 | 9.3 | 21 |
| Dublin | 127 | 17.5 | 24 |
| Stan's OP | 161 | 5.2 | 21 |
| Wapsie Valley | 127 | 25.4 | 23 |
| Tommy Boy | 135 | 6.7 | 23 |
| Dairyland | 128 | 0.6 | 23 |
| FDO 8833 | 235 | 0 | 22 |
| FDO 8924 | 208 | 2.1 | 22 |
| PEDIGREE | YIELD | LODGING | MOISTURE |
| B73s/Dairyland | 130 | 7 | 18 |
| B37s/Dairyland | 140 | 2 | 19 |
| Iodents/Dairyland | 142 | 1 | 18 |
| Pioneer Mixed/Dairyland | 134 | 8 | 18 |
| Mo17s/Dairyland | 126 | 2 | 18 |
| MN13s/Dairyland | 105 | 10 | 18 |
| EP1/CO255//Dairyland | 98 | 5 | 18 |
| 80-1/No. 380//Dairyland | 95 | 14 | 19 |
| Pete Seeger Cross/Dairyland | 93 | 8 | 18 |
| Wachichu/Compton's Early//Dairyland | 107 | 11 | 19 |
| Dairyland/(FBHJ/Euro Flint S3) | 114 | 4 | 18 |
| ND2004/Dairyland | 96 | 3 | 19 |
| ND2006/Dairyland | 102 | 8 | 17 |
| (CG-BS16/Syn A-NL)/Dairyland | 77 | 12 | 18 |
| Cateto Cross/Dairyland | 75 | 4 | 19 |
| NDBSK/Dairyland | 111 | 11 | 20 |
| Silver King/Dairyland | 111 | 6 | 18 |
| Dairyland/Cuzco Cross | 102 | 9 | 22 |
| Dairyland/Cacahuacintle Cross | 91 | 21 | 20 |
| Dairyland/Conico Cross | 118 | 7 | 19 |
| Sequia/Dairyland | 68 | 9 | 19 |
| Dairyland/Coroico Cross | 130 | 4 | 21 |
| Minnesota 13 | 134 | 6 | 18 |
| Dublin | 127 | 18 | 20 |
| Stan's OP | 137 | 9 | 19 |
| Wapsie Valley | 148 | 21 | 19 |
| Tommy Boy | 139 | 10 | 20 |
| Dairyland | 90 | 8 | 18 |
| FDO 8833 | 201 | 4 | 18 |
| FDO 8924 | 181 | 1 | 18 |
| Pedigree | Yield | %Moist |
| B73s/Dairyland | 131.6 | 20.3 |
| B37s/Dairyland | 96.4 | 20.9 |
| Iodents/Dairyland | 95.4 | 23.7 |
| Pioneer Mixed/Dairyland | 119.8 | 20.9 |
| Mo17s/Dairyland | 122.1 | 20.7 |
| MN13s/Dairyland | 90.8 | 20.0 |
| EP1/CO255//Dairyland | 67.4 | 19.8 |
| 80-1/No. 380//Dairyland | 90.0 | 21.4 |
| Pete Seeger Cross/Dairyland | 88.3 | 19.6 |
| Wachichu/Compton's Early//Dairyland | 113.6 | 21.2 |
| Dairyland/(FBHJ/Euro Flint S3) | 56.6 | 20.1 |
| ND2004/Dairyland | 109.0 | 20.5 |
| ND2006/Dairyland | 88.5 | 20.2 |
| (CG-BS16/Syn A-NL)/Dairyland | 95.8 | 19.6 |
| Cateto Cross/Dairyland | 71.8 | 22.4 |
| NDBSK/Dairyland | 90.6 | 22.5 |
| Silver King/Dairyland | 117.5 | 21.1 |
| Dairyland/Cuzco Cross | 92.5 | 24.8 |
| Dairyland/Cacahuacintle Cross | 133.8 | 23.2 |
| Dairyland/Conico Cross | 102.6 | 22.0 |
| Sequia/Dairyland | 96.0 | 22.2 |
| Dairyland/Coroico Cross | 111.8 | 22.6 |
| Minnesota 13 | 122.0 | 19.1 |
| Dublin | 127.5 | 22.8 |
| Stan's OP | 135.7 | 20.1 |
| Wapsie Valley | 152.0 | 20.8 |
| Tommy Boy | 116.3 | 21.3 |
| Dairyland | 77.2 | 21.3 |
| FDO-8833 | 159.0 | 19.6 |
| FDO-8924 | 142.7 | 21.0 |
| Entry | %AdjCP | Degr %CP | %Lignin | %Starch | %Cfat | %Ash | %TDN | NEG | %P | %K | %Lysine | %Methio |
| B73s/Dairyland | 9.45 | 36.50 | 0.78 | 70.18 | 5.23 | 1.49 | 90.50 | 0.72 | 0.36 | 0.45 | 0.27 | 0.20 |
| B37s/Dairyland | 9.68 | 35.25 | 0.88 | 67.48 | 5.55 | 1.66 | 90.25 | 0.72 | 0.38 | 0.49 | 0.27 | 0.21 |
| Iodents/Dairyland | 10.03 | 36.50 | 0.83 | 65.78 | 5.70 | 1.61 | 90.50 | 0.73 | 0.40 | 0.49 | 0.29 | 0.22 |
| Pioneer Mixed/Dairyland | 9.10 | 40.00 | 0.78 | 69.23 | 5.35 | 1.55 | 90.25 | 0.72 | 0.39 | 0.47 | 0.26 | 0.19 |
| Mo17s/Dairyland | 9.45 | 37.75 | 0.85 | 68.20 | 5.50 | 1.54 | 90.25 | 0.72 | 0.39 | 0.48 | 0.27 | 0.20 |
| MN13s/Dairyland | 9.48 | 35.00 | 0.98 | 69.05 | 5.13 | 1.56 | 90.00 | 0.72 | 0.38 | 0.46 | 0.27 | 0.21 |
| EP1/CO255//Dairyland | 10.43 | 35.00 | 0.98 | 65.80 | 5.68 | 1.63 | 90.50 | 0.73 | 0.41 | 0.49 | 0.30 | 0.22 |
| 80-1/No. 380//Dairyland | 10.33 | 37.75 | 0.90 | 65.58 | 6.30 | 1.74 | 91.25 | 0.74 | 0.44 | 0.52 | 0.29 | 0.22 |
| Pete Seeger Cross/Dairyland | 9.85 | 36.25 | 0.88 | 67.35 | 6.13 | 1.60 | 91.00 | 0.73 | 0.41 | 0.50 | 0.28 | 0.21 |
| Wachichu/Compton's Early//Dairyland | 9.90 | 37.25 | 0.93 | 66.63 | 6.35 | 1.54 | 91.25 | 0.74 | 0.41 | 0.51 | 0.28 | 0.21 |
| Dairyland/(FBHJ/Euro Flint S3) | 10.15 | 36.50 | 0.85 | 65.93 | 6.23 | 1.62 | 91.50 | 0.74 | 0.43 | 0.51 | 0.29 | 0.22 |
| ND2004/Dairyland | 9.45 | 37.00 | 0.70 | 67.98 | 5.25 | 1.52 | 90.25 | 0.72 | 0.39 | 0.48 | 0.27 | 0.20 |
| ND2006/Dairyland | 9.93 | 35.75 | 0.80 | 67.50 | 5.25 | 1.60 | 90.00 | 0.72 | 0.40 | 0.49 | 0.28 | 0.21 |
| (CG-BS16/Syn A-NL)/Dairyland | 9.90 | 39.25 | 0.78 | 66.30 | 5.90 | 1.56 | 91.25 | 0.74 | 0.41 | 0.51 | 0.28 | 0.21 |
| Cateto Cross/Dairyland | 9.75 | 38.75 | 0.83 | 67.88 | 5.83 | 1.55 | 91.00 | 0.73 | 0.41 | 0.49 | 0.28 | 0.21 |
| NDBSK/Dairyland | 9.63 | 37.75 | 0.63 | 67.50 | 5.90 | 1.55 | 91.25 | 0.74 | 0.39 | 0.49 | 0.27 | 0.20 |
| Silver King/Dairyland | 9.75 | 38.00 | 0.85 | 67.35 | 5.98 | 1.59 | 91.00 | 0.73 | 0.43 | 0.52 | 0.28 | 0.21 |
| Dairyland/Cuzco Cross | 9.68 | 38.75 | 0.85 | 67.73 | 5.50 | 1.71 | 90.25 | 0.72 | 0.39 | 0.49 | 0.28 | 0.21 |
| Dairyland/Cacahuacintle Cross | 10.40 | 38.00 | 0.73 | 64.90 | 6.10 | 1.65 | 91.50 | 0.74 | 0.41 | 0.49 | 0.30 | 0.22 |
| Dairyland/Conico Cross | 10.10 | 38.75 | 0.68 | 65.93 | 5.70 | 1.60 | 90.75 | 0.73 | 0.39 | 0.48 | 0.29 | 0.22 |
| Sequia/Dairyland | 9.40 | 39.67 | 0.87 | 67.33 | 5.80 | 1.62 | 90.67 | 0.73 | 0.39 | 0.49 | 0.27 | 0.20 |
| Dairyland/Coroico Cross | 10.25 | 38.50 | 0.78 | 65.20 | 6.50 | 1.71 | 91.75 | 0.75 | 0.43 | 0.53 | 0.29 | 0.22 |
| Minnesota 13 | 9.63 | 37.00 | 0.88 | 67.20 | 5.03 | 1.60 | 89.75 | 0.71 | 0.39 | 0.48 | 0.28 | 0.21 |
| Dublin | 10.38 | 36.75 | 0.95 | 65.08 | 5.10 | 1.63 | 89.75 | 0.71 | 0.38 | 0.49 | 0.29 | 0.22 |
| Stan's OP | 9.15 | 36.25 | 0.73 | 70.18 | 4.85 | 1.53 | 90.00 | 0.71 | 0.35 | 0.46 | 0.26 | 0.19 |
| Wapsie Valley | 10.10 | 37.50 | 0.90 | 65.95 | 5.65 | 1.76 | 90.25 | 0.72 | 0.42 | 0.51 | 0.29 | 0.22 |
| Tommy Boy | 10.20 | 37.25 | 1.03 | 65.03 | 5.28 | 1.64 | 89.75 | 0.72 | 0.40 | 0.49 | 0.29 | 0.22 |
| Dairyland | 10.03 | 36.50 | 0.78 | 66.35 | 5.70 | 1.67 | 90.50 | 0.73 | 0.34 | 0.49 | 0.29 | 0.22 |
| FDO 8833 | 8.13 | 40.00 | 0.70 | 72.60 | 4.50 | 1.53 | 89.75 | 0.71 | 0.34 | 0.42 | 0.23 | 0.17 |
| FDO 8924 | 7.98 | 41.50 | 0.70 | 73.63 | 4.55 | 1.64 | 89.50 | 0.71 | 0.35 | 0.44 | 0.23 | 0.17 |
The potential for open-pollinated corn varieties to have higher nutrient density than most current hybrids is well known and clear. It is a potentially important set of traits. Higher protein and fat can make up for lower yields in corn varieties used for feed because this nutrient density can substitute for some of the more expensive soy that may be purchased or grown to fill out a ration. However, these traits are quite variable in their expression: every open-pollinated variety is not significantly higher in specific nutrients. In our data above, based on grow outs on our farms, one can see that most of the open-pollinated varieties and test crosses had higher protein and fat levels than the check hybrids which were fairly low by comparison. One to two percentage points higher in protein and fat were common features. Of the current open-pollinated varieties, Stan’s OP was only higher than the hybrids for protein by about a percentage point, and only slightly higher for fat. This may be due to Minnesota 13 being part of its parentage as Minnesota 13 is not a very nutrient dense variety. Varieties and test-crosses with Northern Flint or Wapsie Valley parentage often had both much higher protein and fat. However, the Northern Flint test-crosses were generally not very high yielding. Of the exotic parents, only the Conico test-cross had somewhat reasonable yields and higher nutrient density. Although slower to dry, these lines may offer something useful to breeders looking for higher yielding and nutrient dense populations for grain production. The commercial Iodent lines also were quite impressive for pushing yield while maintaining nutrient density in test-crosses with Dairyland. Crude protein in our new synthetic variety was 8.7%, which is a very mild improvement over the hybrids reported here.
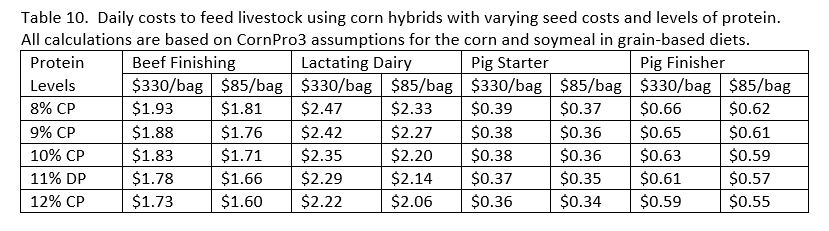
Using our updated version of CornPro3, a corn protein and yield assessment spreadsheet developed during the SARE-funded Heritage Maize Project in 2004, we were able to identify the dollar value of increasing corn protein for use as feed on farm. If a farmer were to grow an expensive hybrid that yielded as well as ours did, about 196 bu/A, costs of production followed the 2023 average cost estimates from Iowa State University, and soymeal is $440/ton, we see clear, but modest reductions in feeding costs with increasing corn protein (Table 10). A hybrid, like our check varieties with 8% protein, could be mixed into a ration for finishing beef cattle that would cost $1.93 per head daily. With higher protein allowing for the substitution of higher quantities of cheaper corn in the ration, the costs for feed falls modestly by about 2.4-3% for each percentage increase in protein for the expensive hybrid, and by about 2.7-3.4% for the inexpensive hybrid. Similar trends occur with the other animal diets.
Table 10. Daily costs to feed livestock using corn hybrids with varying seed costs and levels of protein. All calculations are based on CornPro3 assumptions for the corn and soymeal in grain-based diets.
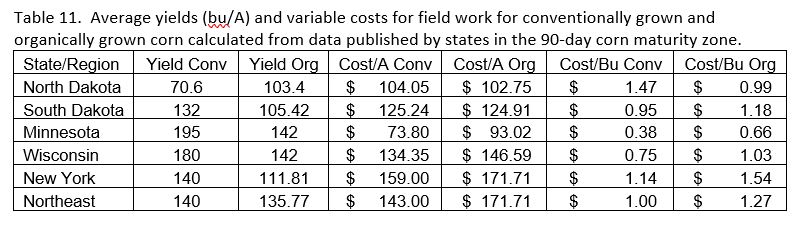
Our student economist, Elena Hill, processed a great deal of data from across multiple states to gain a better understanding of the costs of corn production, and the time needed to carry it out. Data on yield and costs that is published by states in the 90-day corn region show these averages for yields and variable costs related to field work (Table 11). The general trend is that organic growing provides slightly lower yields, except in North Dakota where the concentration of organic growers in the best corn growing areas of that state likely bias those data. Organic corn production was about 72-97% of local, conventionally grown corn if we ignore the North Dakota data. This reduction in yield increased the costs of production on a per bushel basis as well. However, estimated variable field costs per bushel of grain (or potentially seed) are fairly similar using either system anywhere across this region. Calculations for the average number of hours spent with field activities concerning growing an acre of corn were about half an hour per acre for conventional growing and about two hours per acre for organic growers. Part of this is due to cultivation passes, and part of it may be due to scale of production which can be quite large for many conventional operations. USDA estimates that total organic corn production costs are $83-$98 higher per acre in general, but in December 2023 organic corn prices in the Midwest averaged $8.05/bu, as compared to the $4.75/bu price for other corn.
Table 11. Average yields (bu/A) and variable costs for field work for conventionally grown and organically grown corn calculated from data published by states in the 90-day corn maturity zone.
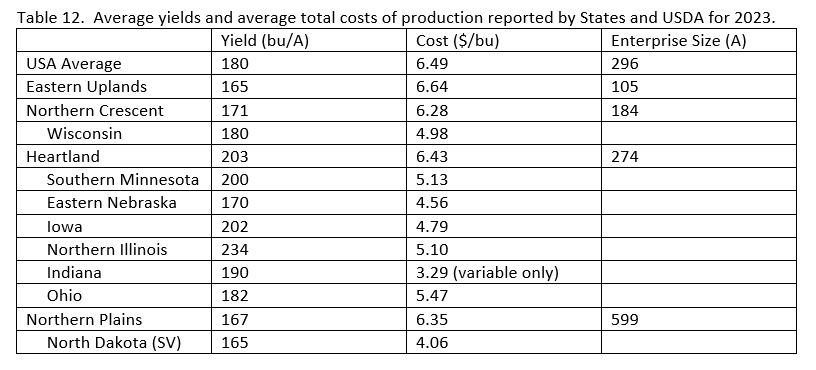
If we consider all costs from crop production budgets prepared by USDA and Extension economists in several states, we see that the costs of production often push corn for grain into a not profitable situation. Per bushel costs for corn are significantly higher when land costs are included (Table 12). On-farm prices to grow each bushel are still quite low compared to seed costs, so if we could grow our own seeds, there is space potentially for advantageous cost savings.
Table 12. Average yields and average total costs of production reported by States and USDA for 2023.
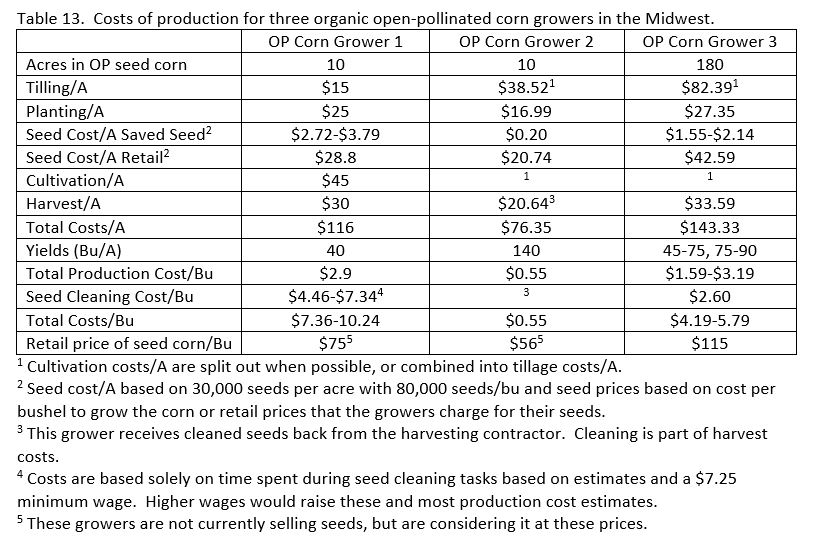
One of the critical calculations worked through by Elena is the costs and returns from growing open-pollinated corn for seed by three organic farmers who are already producing seed in the Midwest. Data in Table 13 below are based on reported time, expenses, and yields from these farmers. State averages released by Extension Services were used to fill out the table with our best estimates when our cooperating farmers could not supply all of the numbers. If we assume all are planting about 30,000 seeds per acre, and about 80,000 seeds per bushel, then farmers can plant about 2.7 acres per bushel. Using this estimate we can also estimate the cost for seed when these farmers plant their own seeds back as compared to the likely prices if they were to purchase these same varieties. While the yields of open-pollinated varieties are still considerably lower than commercial hybrids in most cases, it appears that saved seeds could reduce the costs of seed by $21-$40/A each year over purchasing fresh open-pollinated corn seeds each year. The costs of hybrid seeds range from $85 up to $330 and more per bag, and $31-$122/A for planting at 30,000 seeds to the acre. Low costs of open-pollinated seed corn seed grown on farm could reduce seed costs compared to some hybrids depending on one’s production and seed cleaning system, and on the variety grown.
Table 13. Costs of production for three organic open-pollinated corn growers in the Midwest.
Although two of our three organic, open-pollinated corn seed growers use combines to harvest, many seed corn growers use corn pickers to harvest ears for drying and later shelling. Often this allows a harvest at higher moisture and it is used to help maintain high rates of germination. Not all standard custom rates publications mention costs for picking ear corn anymore, but of those that do, we see a range of costs starting at $17.3/A from a South Dakota publication in 2004 to $28.10/A in Pennsylvania and $31.9/A in Michigan in more recent years. Our second open-pollinated corn grower uses a picker and those expenses are considered in the second data column. High yields reported from the synthetic variety grown on that farm (Revolt) help reduce variable production costs on a per bushel basis.
The costs for forced drying, shelling, fanning, and other cleaning would have to be considered by anyone intending to grow their own seeds. Our first grower who uses small scale equipment puts in just over an hour for each bushel of dried and cleaned seeds. If we pay ourselves $15/hr for that work, and we consider the general cost per bushel to grow corn in the USA (Table 12), then the price of our own seed on farm could reasonably be priced at around $20/bushel. Larger scale cleaning can reduce this to as little as $2.60/bushel as we see for the third grower, so for some farmers it may be possible to produce their own corn seeds for as little as $7-9/bu. One of our research team estimates the full costs of cleaning at closer to $25/bu, so more data on small scale seed production may be needed to arrive at a robust estimate and range of costs. The current markets for seed of open-pollinated seed corn are apparently relatively small, with retailers saying many varieties are selling less than 300 bu annually.
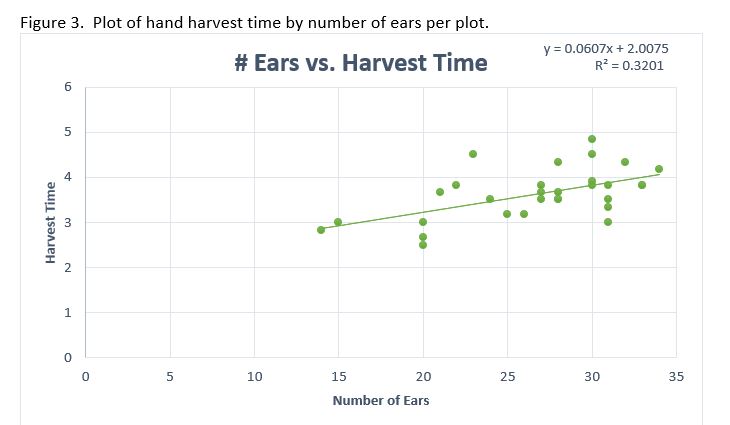
Some growers are starting out at an even smaller scale – hand harvesting from large gardens. This is the ancient tradition with this wonderful crop, and it brings some a great deal of satisfaction to maintain traditional varieties or to breed new ones in this same manner. What might the economics of such seed look like, and how could hand harvest be done more economically? During our on-farm evaluations in 2021, Frank Kutka timed his hand harvest of each of our 1/1000th of an acre plots for each of the thirty experimental varieties. The grain was then dried, shelled, and weighed. These data were analyzed and plotted by Elena Hill (Figure 3). On average, 6.6 pounds of dry grain could be harvested every 3.62 minutes, or 1.95 bushels per hour. If we value labor at $15/hr, then hand harvest would cost about $7.62 per bushel just for picking. The results also show remarkably weak relationships for most any factor about the plots (% lodging, number of ears, total ear weight, average ear weight, total grain weight) and harvest time. The factor with the strongest relationship, number of ears in the plot, had only an R2 value of 0.32 with harvest time. Clearly this is a complex, multifactor issue. More data could possibly help to determine ways to make hand harvest more efficient and to arrive at a better estimate of costs, but the picker in this case certainly appreciated large ears at a convenient height, with loose husks, on plants that were standing upright. These are the sorts of plants recommended by USDA a century ago.
Figure 3. Plot of hand harvest time by number of ears per plot.
Very small-scale producers also would have to dry the corn, and this can be done in a number of ways. The easiest way to just set the ears on a wire rack, but ears can also be hung on holders, hung by string, braided in the husks, etc. There would be some as yet unknown time input to drying. Shelling comes next after drying. Frank hand shelled three samples of ears from a flour corn population and arrived at an estimate of 0.94 bu/hr. Three samples of a mixture of floury, flinty, and dent ears were also shelled through an antique John Deere 1b hand cranked sheller. With this machine 8.7 bu/hr could be shelled, although there would also be some time to clear cobs and remove cobs from the shelled corn. Winnowing to clean the corn for planting or eating comes next, and this is fairly quick as well, just pouring grain from a bucket into another bucket three times. Frank’s estimate is winnowing at a rate of about 7.7 bu/hr, although there would be some set up time since one can winnow about 15-25 lbs at a time in each batch. With labor at $15/hr, cleaning up the grain at this scale adds at least another $3.66-$17.90 per bushel depending on tools, variety, and other factors. Even with these costs, home seed production could be relatively affordable depending on one’s scale and the commercial availability of the variety one wishes to grow. Rare varieties, if they are otherwise important to grow, are rarely available commercially at any price.
We can model any potential savings from using seeds with different costs and from using varieties with different yields or nutrient densities. Once more, we returned to CornPro3, which has been updated with current crop budgets from the USDA and from several states. Given the current corn price of $4.75/bu and soymeal price of $440/ton, the open-pollinated corn varieties we grew in our trial are not competitive for growing grain for sale. Even the more expensive hybrids are only marginally profitable or not profitable to grow in this scenario as the cost of production is close to or exceeds the current price (Table 14). However, we predict that synthetic varieties grown as open-pollinated corn that achieve 176 bu/A could currently meet or beat the profitability of hybrids grown for grain when the hybrids cost $170 or more per bag. This relationship is still close even if it cost $30/bu to clean the open-pollinated corn seeds. Currently there are no such open-pollinated varieties with such high yields, but they are theoretically possible. The search continues.
Table 14. Feed costs based on corn varieties with different population structure, seed cost, and nutrient density. Predictions for corn costs and costs of daily animal rations are based on CornPro3 with crop production budgets from Iowa State University from January, 2023.
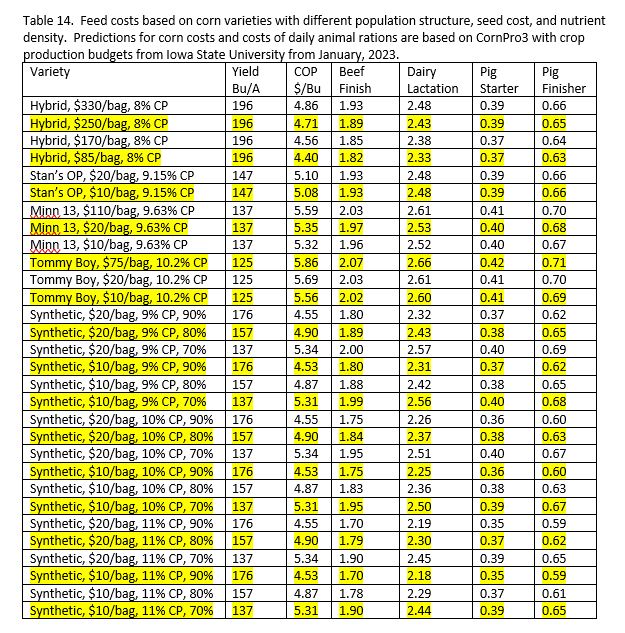
Another way to gain value from grain is to feed it to animals on farm. CornPro3 allows the modelling of feed prices based on cost of production including seed prices, the value of grain based on total cost of production, and the price for soymeal which can be replaced with corn protein to some degree (Table 14). Across all diets, Stan’s OP variety is currently competitive for making feed when compared to the highest priced hybrids ($330/bag). Other than that, the other open-pollinated varieties are not competitive given our results. However, when Tommy Boy reaches 150 bu/A yields as it sometimes does, its total cost per bushel falls to $5.01 if one can produce one’s own seeds at $10/bu, and the cost of finishing beef animals with it in the ration drops to $1.86 per day, greatly improving its competitiveness. Clearly, anyone who wishes to grow open-pollinated corn in a profitable manner still needs to be mindful of yield too even when nutrient density is high.
Is there any other situation where an open-pollinated variety might be economically competitive in the future? Our modelling from Table 14 shows that a synthetic variety or greatly improved open-pollinated population that yields 90% of our hybrid average (176 bu/A) would be competitive for grain prices with all but the cheapest hybrids at $4.53-$4.55/bu break even prices. Varieties that could yield 80% of the hybrid average (157 bu/A) would be fairly competitive with the most expensive hybrids for grain production costs, and any yielding less would not be competitive with the hybrids. When the corn is fed on farm as feed, the value-added option improves possibilities for these hypothetical varieties. Any synthetic variety that could yield 90% of the hybrid average would compete with or be slightly cheaper to feed than any of the hybrids given current cost estimates and prices (Table 14). This is true across all levels of protein and is largely due to the seed cost savings, although increasing protein levels would clearly improve the situation. Differences in costs for cleaning the seeds at home, whether small or large scale, were small enough that this may not be a big consideration for those interested in growing their own seeds. They just did not greatly influence predicted feed costs here.
The predicted varieties that could yield 80% of the hybrid average are also competitive for feed prices with the more expensive hybrid seed. If protein levels could be 10%, two points higher than most hybrids, these that yield 157 bu/A would also be competitive with moderate priced hybrids, and if protein levels could be 11%, on the high end for maize generally, these varieties would also be competitive with any 8% protein hybrids for feed price (Table 14). Developing synthetic varieties that yield 80% of good hybrids is predicted to be fairly readily attainable, and even those yielding 90% are theoretically possible. However, research in this area by government agencies and seed companies is limited or non-existent.
Given this situation, another hope of our research project was to identify parents that could come together to form a new, synthetic open-pollinated population that would out yield the currently available open-pollinated varieties. The first six testcrosses appear to have some potential in this way, with ND2004 and the Conico lines also potentially of interest given average yield alone. If our premise of using a mixed population to find general combining ability among the test cross parents is correct, then some of these likely have better general combining ability than others. They may have some potential for pushing yields via hybridization and maintenance of much of that hybrid vigor by increasing the number of parents, the way that good synthetics do. Whether it is possible to form a synthetic that could perform as well as Stan’s OP or closer to 90% of the hybrid checks remains to be seen.
To this end, in 2022 we advanced the intermating of promising lines to develop a potential synthetic variety of dent corn for the region. Parents included the B73/Dairyland cross and a four-way cross of other parents from our experiment (B37s/Iodents//Pioneer Mixed/Mo17s). We also made a cross between B73s/Dairyland and the Dairyland/Conico Cross for future expansion with a slightly broader mix of lines. In 2023, Roger Coulter grew out the initial synthetic at his farm in New York State to expand the seed supply and move the population to F2 for use as an OP variety and for further evaluation. In 2024 NIR showed the variety produced about 8.7% CP in New York last summer, a very modest gain over the hybrids. Seeds from this grow out were sent to USDA Plant Introduction Station in Ames, IA for public distribution. Photographs show that some of the plants from this new mixture appear to be healthy and productive. Only ongoing evaluation can determine whether this population can carry through as a new and higher yielding variety with better standing ability than the existing open-pollinated varieties. However, given the moisture levels observed in the test crosses, it is probably likely that this new population would still need further selection for early maturity to meet what Minnesota 13 can currently do. In 2023, Frank Kutka also crossed the B37/Iodent//Pioneer Mixed/Mo17 cross with the B73s/Dairyland//Dairyland/Conico cross to generate the F1 of a second, very closely related synthetic population with slightly broader parentage. This will also be grown out to the F2 and beyond with hope of finding higher yield maintained in the later generations.
Figure 4. Roots and stalks of our new synthetic variety.
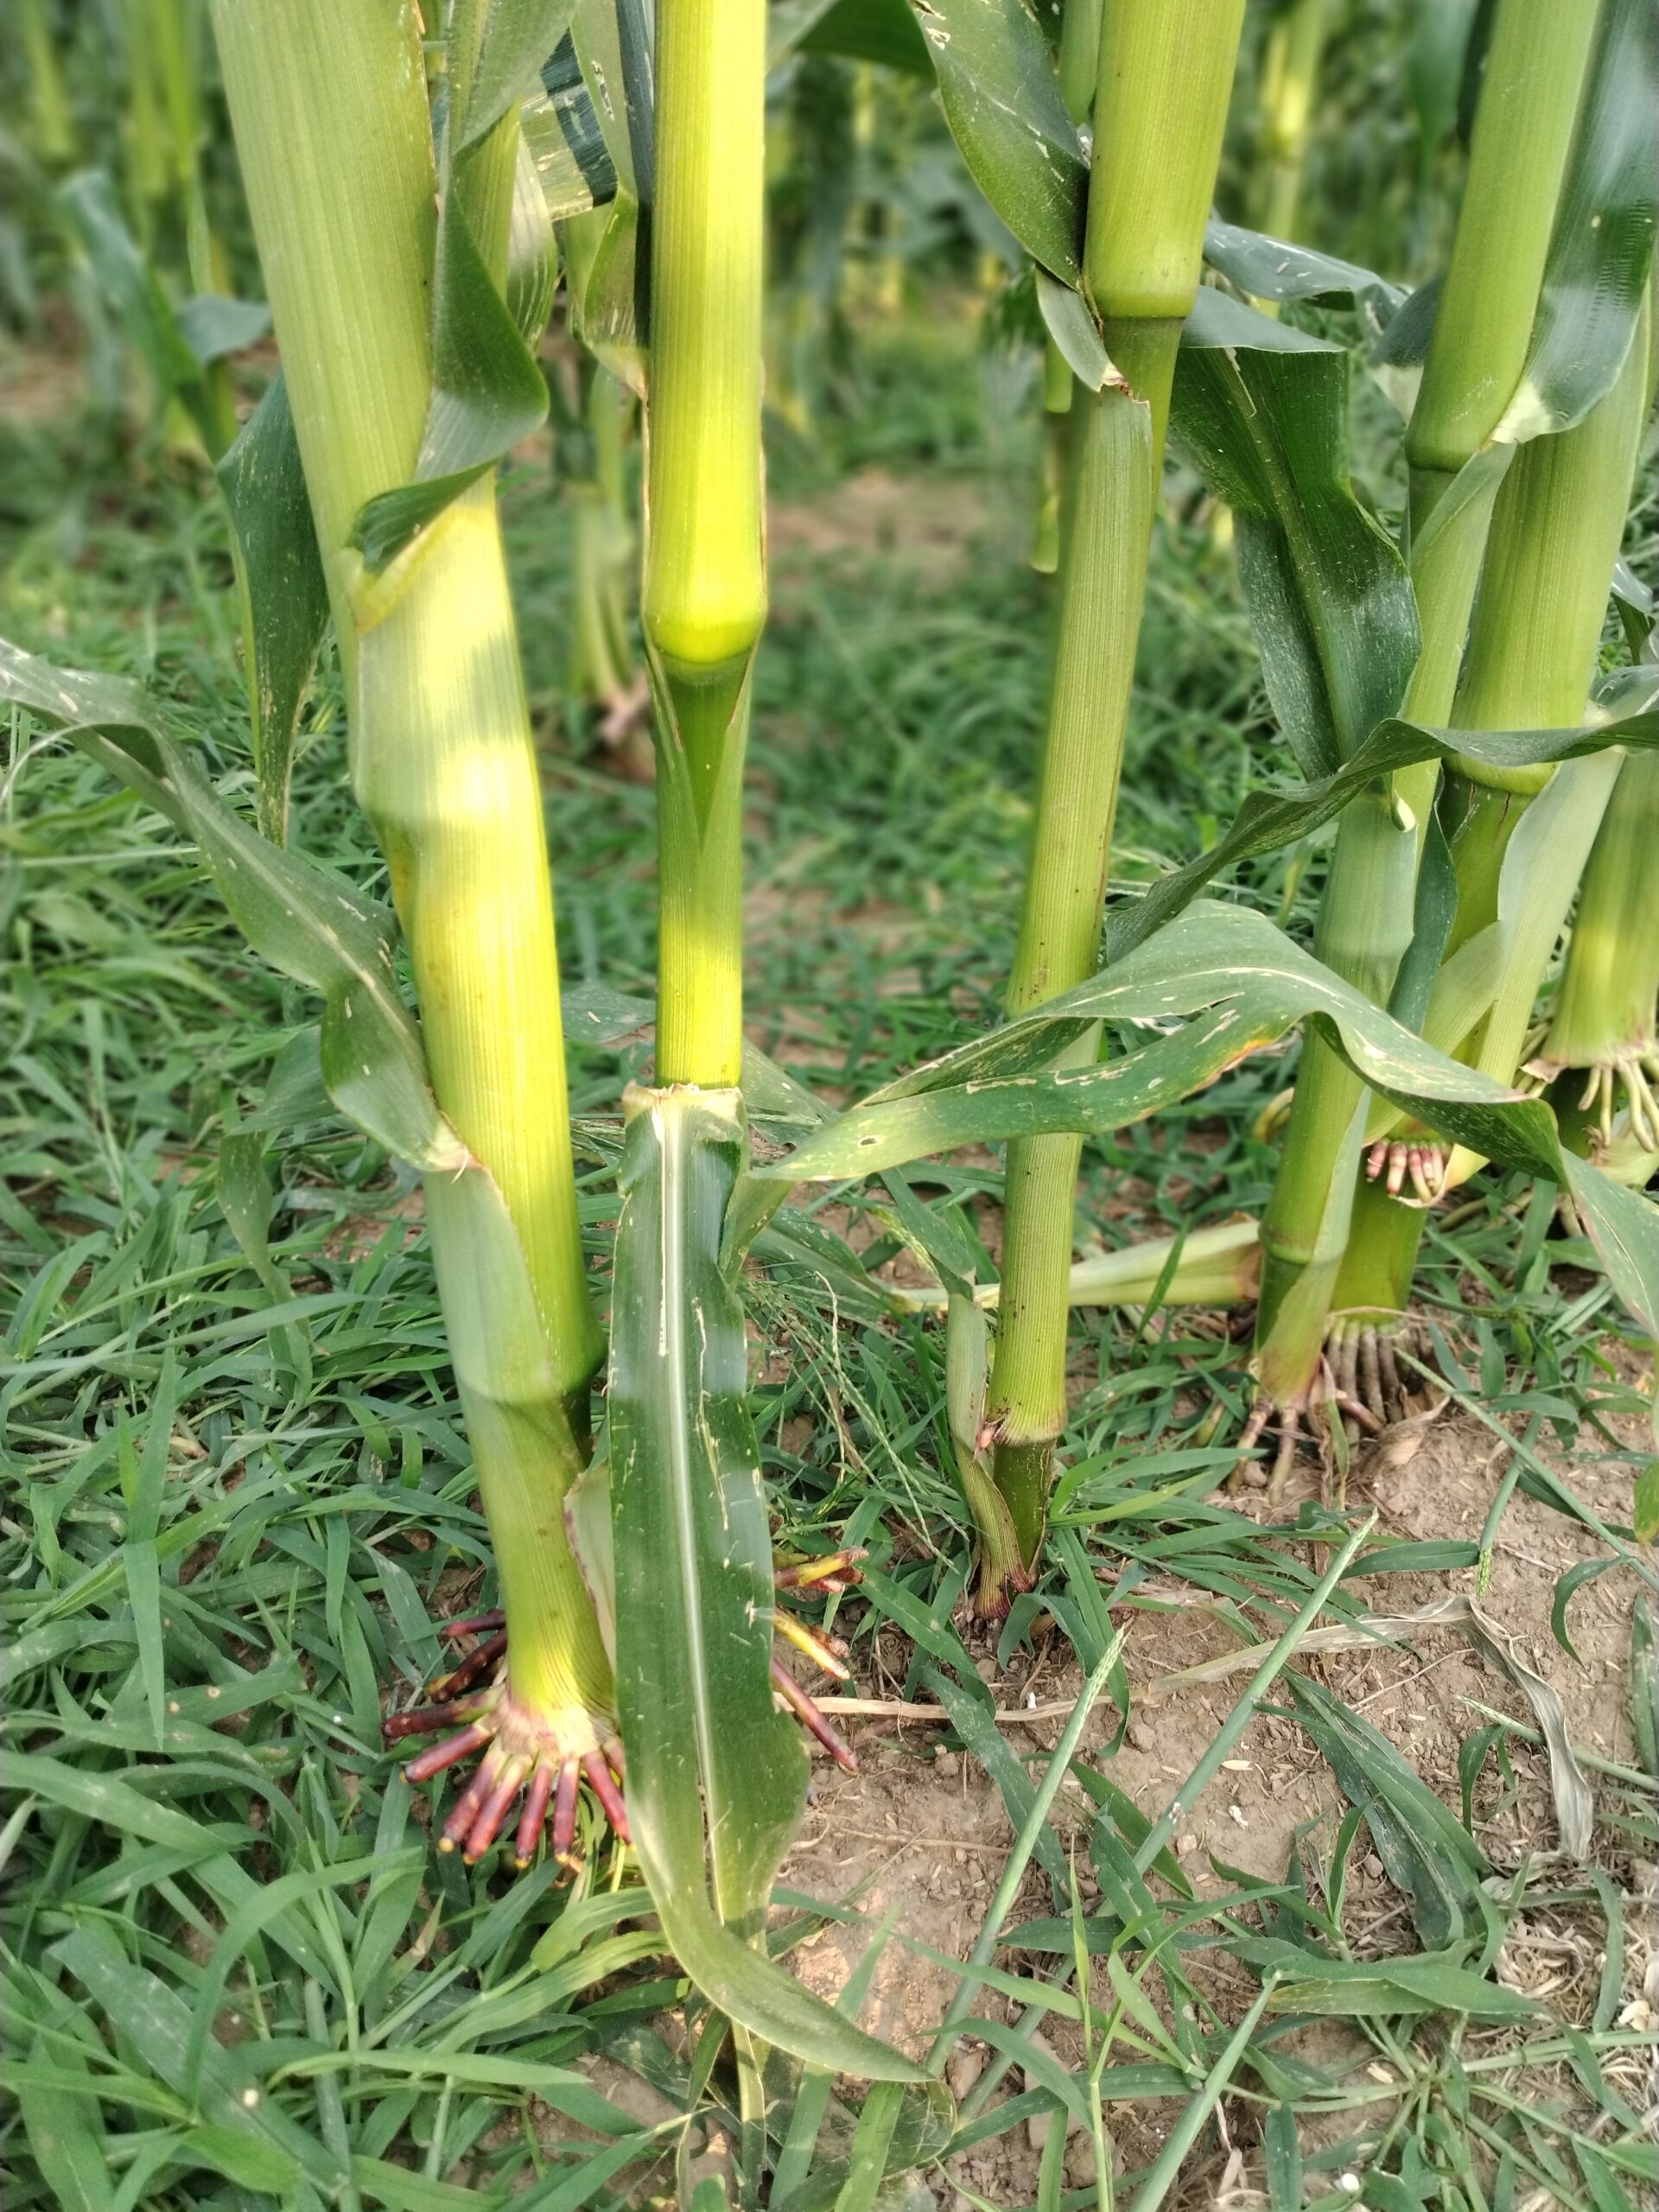
Figure 5. A fine ear of our new synthetic variety still on the stalk.
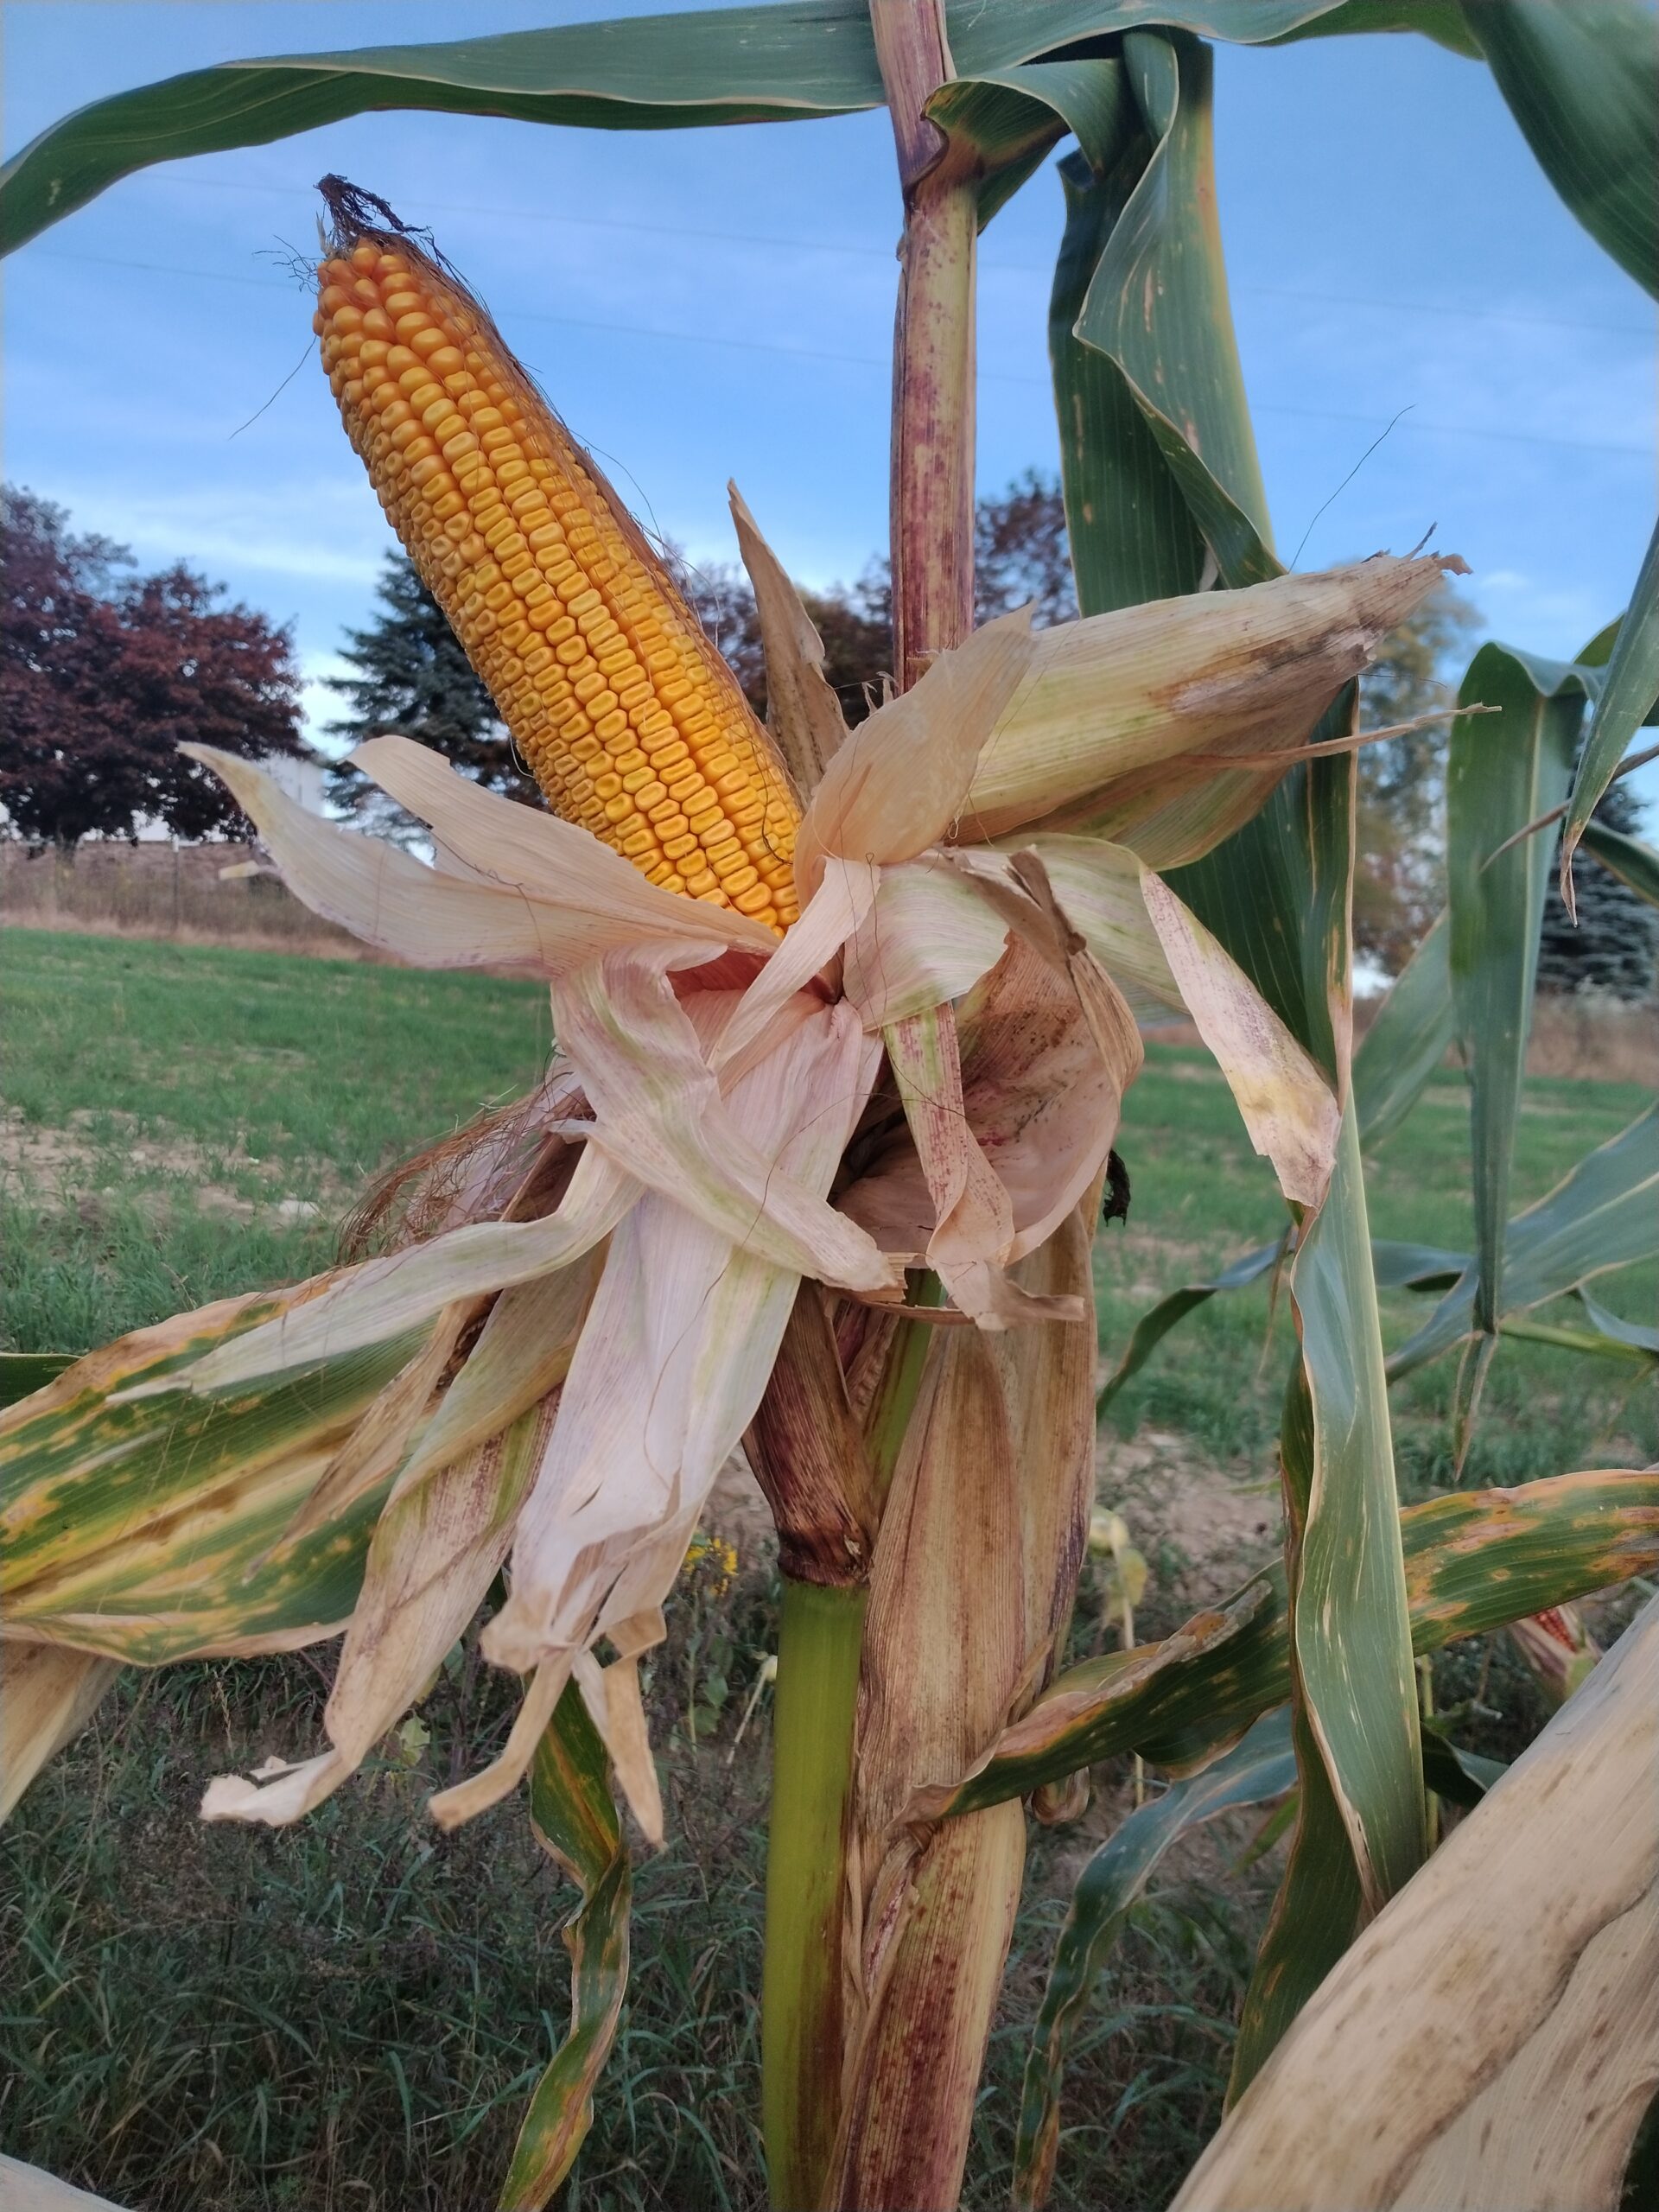
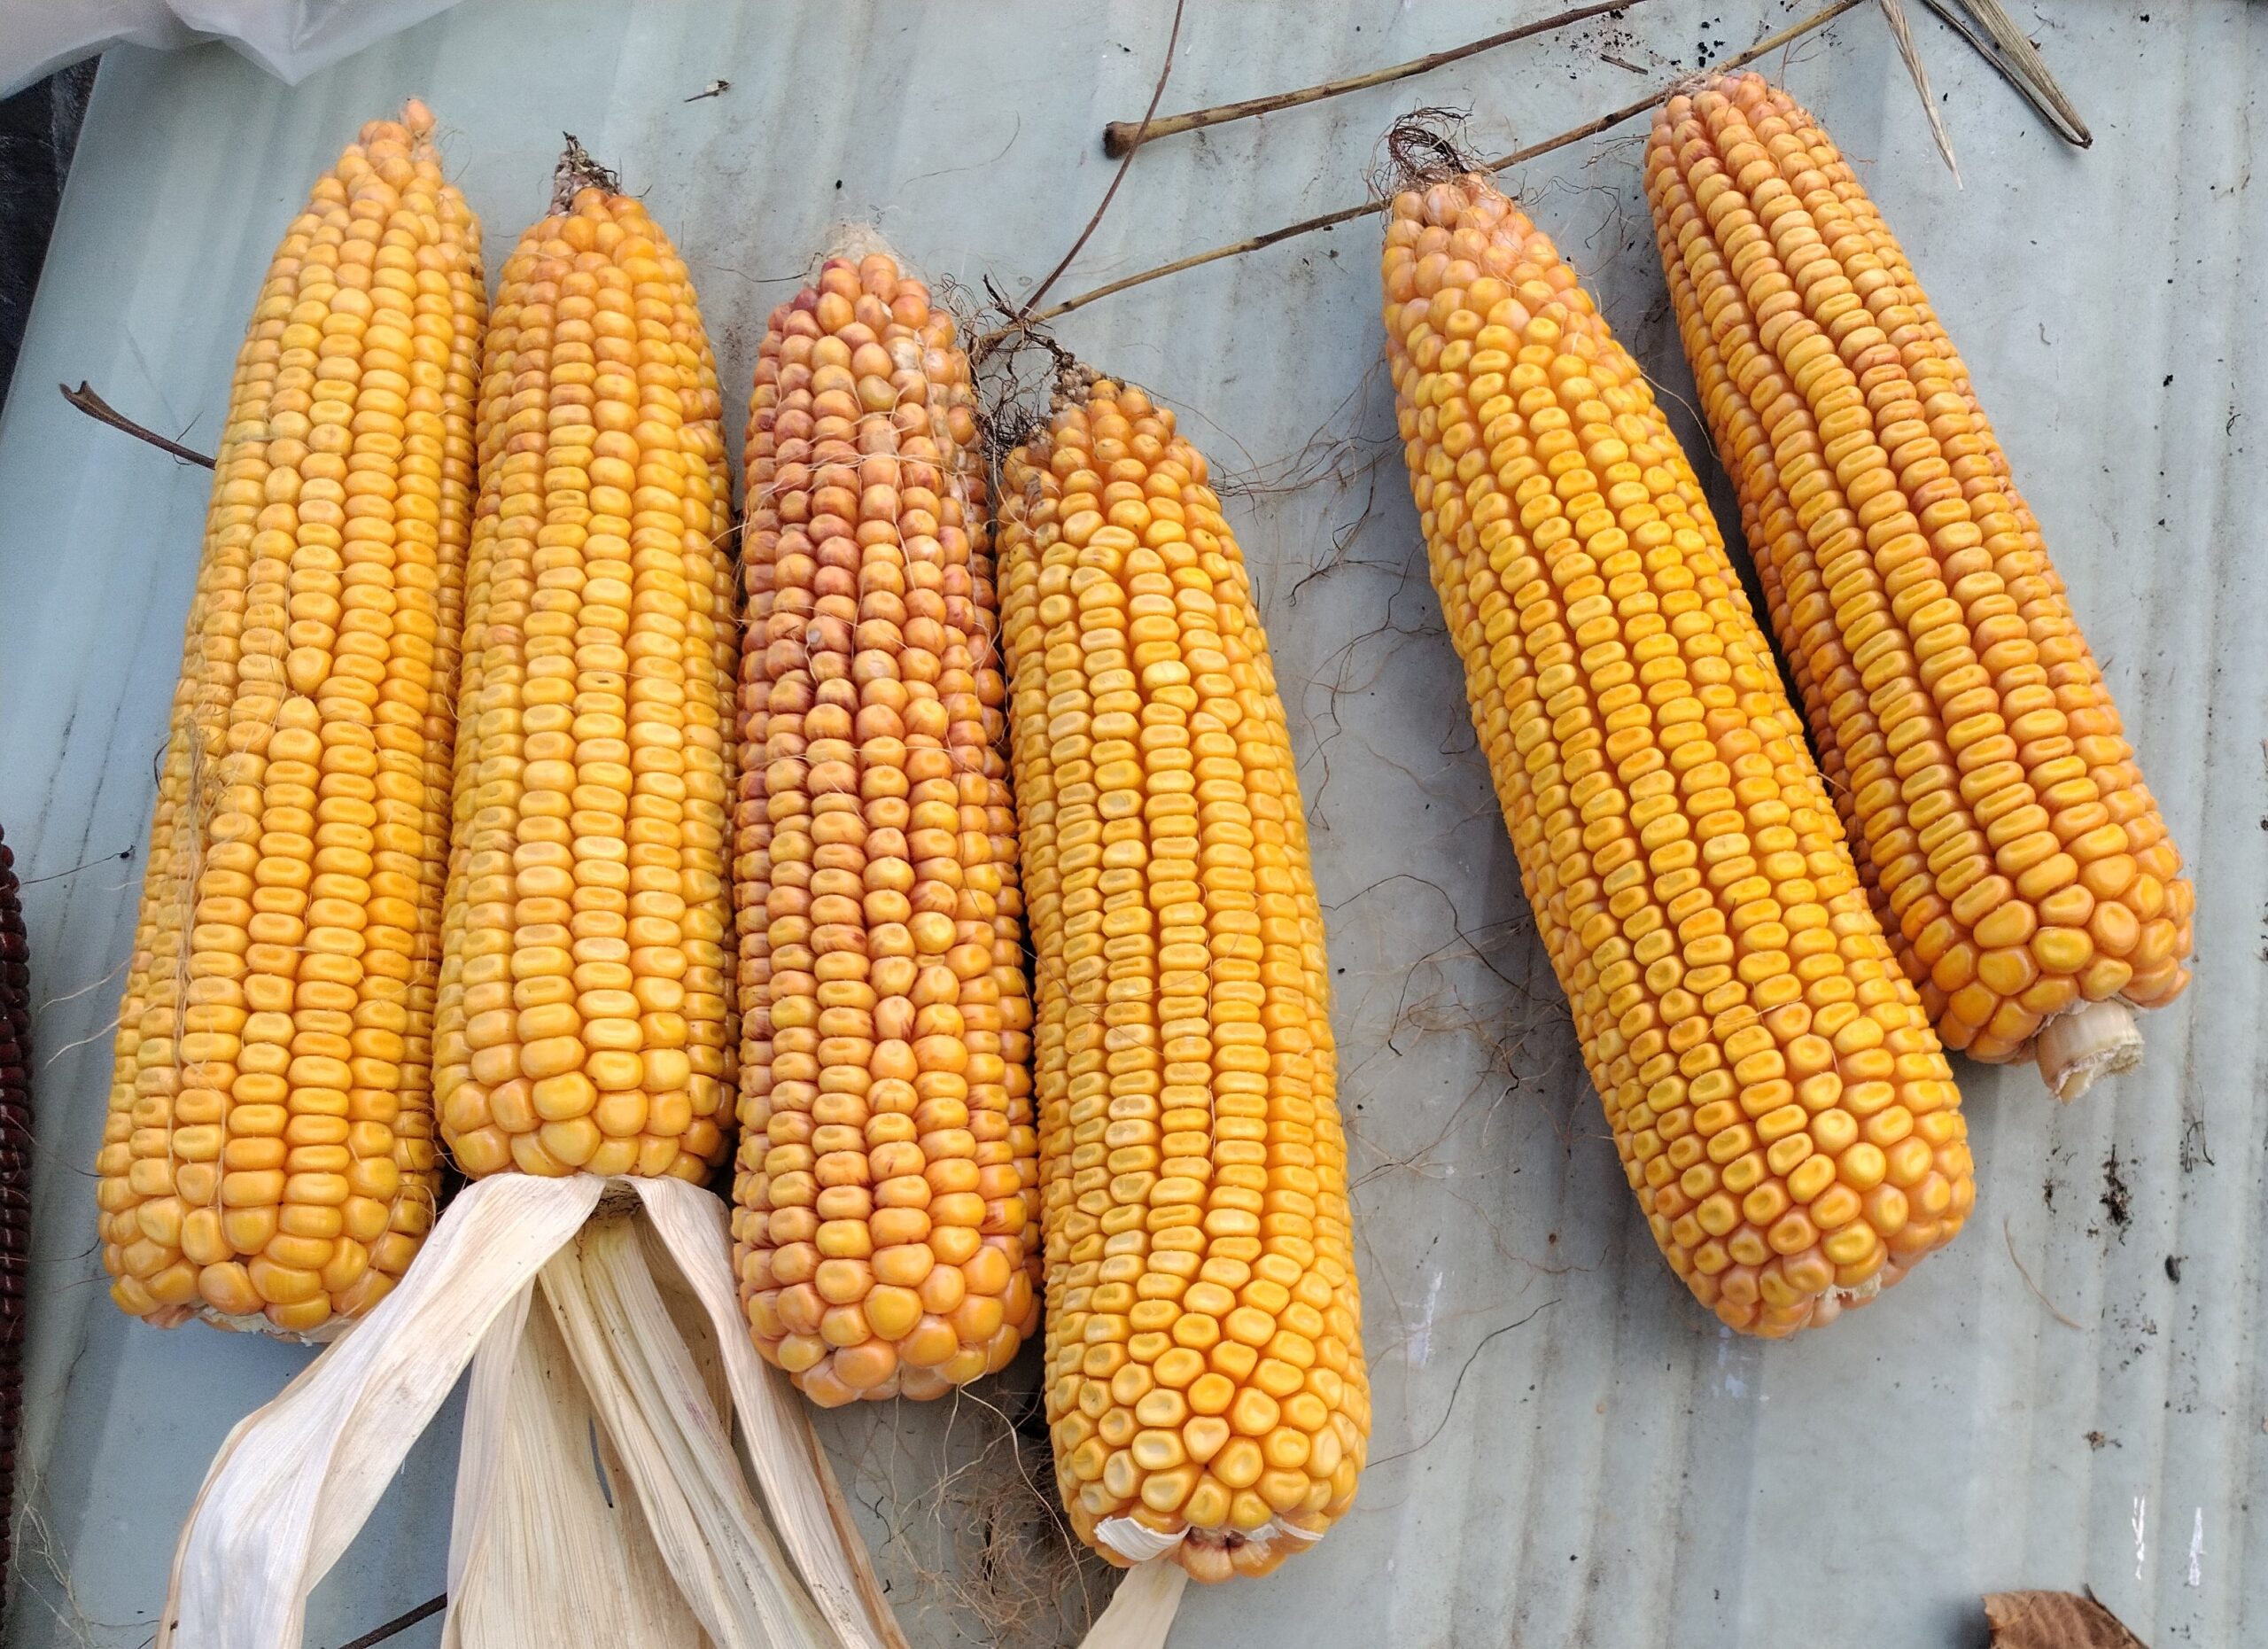
Figure 6. A nice selection of ears from of our new synthetic variety after harvest.
Growing corn for grain and seed, as most of us do, is a pleasant part of our lives. We enjoy the challenges and rewards even in our current economic situation, and we enjoy sharing the task and the idea with others. Seed saving and crop breeding are traditional farmer occupations here and around the world, and we would like to see these continue. In 1920, the USDA said this in Better Seed Corn, Farmers’ Bulletin 1175: “At corn-ripening time, drop all other business and select an abundance of seed corn. The work is too important to be conducted incidentally while husking. When selecting seed corn give it your entire attention and select for the one most important character, the power to yield well. Get the very best that is to be had and dry it promptly, and your increased yields will return you more profit than any other work you can do on your farm.” With the right breeding, this tradition could possibly continue in an economically competitive manner.
To summarize, we learned these things during this project:
- Test crosses of various types of corn with the Dairyland population showed us possibilities for forming new synthetic varieties that might potentially and modestly out yield current open-pollinated varieties. They did not show us ways to form competitive topcross hybrid seed that would be cheap to produce on farm and useful across the region, although a Pioneer Mixed/Dairyland testcross could possibly be an effective top cross hybrid to make and grow in North Dakota.
- Some of the sister-line populations we used might be used to explore other farm-based hybrids with further research.
- Many test crosses and open-pollinated varieties do have higher protein than our check hybrids. The value of this protein for replacing expensive soy meal increases the economic value of one variety, Stan’s OP, to the point that if fed on farm it could be competitive with more expensive hybrids due to the protein value and the low seed cost.
- The costs of growing open-pollinated corn for seed are fairly low. They are essentially the same as any other corn for overall production, with a slightly higher cost per bushel due to lower yield. The costs for cleaning the seeds for use are modest, a few dollars per bushel for larger scale production and perhaps about $15 per bushel for small scale production. Work at very small scale would increase seed cleaning costs, but seed would likely still cost less than retail.
- Given current costs of feed, seed, and crop production, open-pollinated varieties that could yield 90% of current hybrids in our tests would be economically competitive with them for grain production when hybrid seed costs were average to high. If fed on farm, they would be competitive with any hybrids for feed costs when the open-pollinated varieties had 9% or higher protein levels. Currently there are no open-pollinated varieties like this of which we are aware. Our new synthetic is close to this level of protein, and we will find out how it yields in trials in 2024.
- Given current costs of feed, seed, and crop production, open-pollinated varieties that could yield 80% of current hybrids in our tests would be competitive with hybrids for feed costs if the open-pollinated varieties had higher protein, especially 10-11% vs. 8% or less for the hybrids. Currently there are no open-pollinated varieties like this of which we are aware.
Seed of our new synthetic variety has been released to USDA, and will be shared with the public. An updated version of CornPro3 is also available to anyone who would like to request it. Copies will also be shared via SARE.
Educational & Outreach Activities
Participation summary:
The pandemic squashed our use of traditional field events and meetings with fellow farmers in 2021. We did post a video on the Corn Culture blog on Facebook (https://www.facebook.com/cornculture.info/), along with some tables of preliminary data. As of 29 January 2023, 366 people had noticed our introductory video and 72+ had taken notice of the video, our data, photo, and other postings.
In October, 2022 we held a traditional field event at Stan Smith's Farm in southeastern Minnesota. Another couple interested in OP corn joined the Smiths and Frank Kutka, and a photo was posted to Corn Culture. A video presentation about synthetic varieties was posted onto the Corn Culture page early in 2023, and it received 118 views as of 2 March 2024. A photo of the new synthetic that Roger Coulter grew was also posted to Corn Culture and has been seen by 226 people as of 2 March 2024.
Learning Outcomes
We learned so many lessons! For instance, multiple year trials are needed to include some locations, as the rain out at Scott's place clearly demonstrated, although having trials across a wide geographic range may have helped overcome this problem. That is how the big companies do it.
There are so many records to keep even for a small breeding trial like this one! Assistance with filling packets was also invaluable, so thanks again to Bill Tracy at UW-Madison for helping us with his seed counter.
Breeding projects take years to organize and perform. This one had pre-project development and will have post-project work continue. Finding support for the key part of the process, like a multi-state evaluation as we did here, was very beneficial to this medium-term effort.
If one wants to be part of a university trial, it is best to make the connection very early in the year. Most want the seeds and funds by March so they can organize their fields and experimental designs.
It is actually very difficult to get statistical assistance! Many universities have professors and students who use these tools, but very few can offer help with these or are available to do any custom work for a fee. The two graduate students with whom we worked, Elena and Daniel, were absolutely awesome and helpful in so many ways. Partnering with bright, young people was most helpful for us, and allocating more funds for this sort of partnership would be good in future proposals.
Our very lightly attended field event raised the issue as to whether these are effective for reaching the public with highly specialized topics like ours. Social media has gotten many more responses by comparison.
Our basic experimental design was a good one, but it raised many questions. We were aware of differences among organic and conventional trials, and we saw them here too, although they were also confounded with location (organic in New York and Vermont only). More testing in one system or the other may truly be needed to get the best performing varieties to farmers.
Project Outcomes
Roger and Frank have collaborated on the development of the new synthetic variety that was formed using the data from this variety trial. Frank formed the F1 population, Roger grew it out, and together they have had seeds analyzed and shared. There have been many questions about it via social media, and USDA is considering adding it to their list of accessions in the National Plant Germplasm System. Roger's enthusiasm has been clearly explained based on the photos he submitted. Both are looking forward to results from this summer's fields both at home and in university trials.
It was truly marvelous to be able to enter this synthetic variety in trials across the northern states. This opened up new collaborations with agronomists in South Dakota, Minnesota, Wisconsin, Michigan, and Pennsylvania. With existing collaborations in North Dakota, New York, and Vermont, we should be able to get a good idea of where this synthetic variety is adapted, its faults, and its potential.
Clearly, using a broad-based tester is an advantageous approach to testing lines for potential topcross hybrids and for testing general combining ability (GCA) for the formation of synthetic varieties of maize and other species. This approach made our tests much smaller and more affordable, allowing us to test across a broader geographic region. Given this result, our new synthetic variety, which has a broad base of commercial maize germplasm in it, would probably make a great tester for future work with maize in the 90-95 day maturity range, and perhaps a bit more broadly.