Final report for FW21-386
Project Information
The use of biochar in agriculture has been considered to be a “win-win” proposition as it can improve agriculture sustainability by enhancing soil health while mitigating climate change via carbon sequestration in the soil (Filiberto and Gaunt, 2013). Even though biochar has been used in crop production for several decades, it has not been widely adopted due to inconsistent crop yield responses (Jeffery et al, 2011) and to several economic obstacles, including high costs and lack of a consistent return on investment (Bach et al, 2016; Filiberto and Gaunt, 2013). Recent trials on biochar application in vineyards have also shown inconsistent yield responses as well, with several reports of positive yield responses up to 50% during the first four years after application (Genesio et al 2015, Monterey 2021), while others report (Garcia-Jaramillo et al 2021) no positive yield response at all to biochar applications at two vineyard sites the year after application. Before biochar can be more widely adopted in vineyards in general, and in the North Coast of California in particular, there needs to be a better understanding whether biochar application may result in improved yields.
The lack of consistent yield response may be due to several factors including source of biochar feedstock material and processing, initial soil conditions, and crop (Guo, 2020). A recent meta-data analysis (Jefferey et al 2011) of previous biochar trials indicated that positive crop yield responses were more likely to occur on soils with an acidic or neutral pH or on soils with a coarse or medium texture, which suggests that the mechanisms for yield improvements that are the often observed include a liming effect on the soil or an improved water holding capacity with biochar applications. Indeed, biochar amendments will likely improve overall soil health (Guo, 2020) by improving soil physical (reduce bulk density, increase soil porosity and hydraulic conductivity, increase soil aggregate stability and available water holding capacity), chemical (reduce soil acidity, raise soil cation exchange capacity or CEC) and biological (increase available organic carbon and favorable habitat for microbial activity) characteristics of the soil.
Although Biochar amendments to soil alone may not lead to a positive yield increase for some crops, they can improve yield responses from inorganic (NPK) and organic fertilizer (Schulz and Glaser, 2012) due to improved nutrient retention as measured with higher CEC. Combining biochar and compost can lead to a synergistic response in plant growth and productivity (Fischer and Glaser 2012, Schulz and Glaser 2012). Therefore, even if a biochar application alone does not improve crop yield it may provide positive yield response if accompanied by compost addition.
The vineyards in the North Coast may require biochar or compost amendments. A recent trial (Wilson et al 2021) investigating the response of vineyards to compost applications in North Coast showed a positive yield response when rates were greater than 10 tons per acre. The soils in that trial were acidic and characterized as being degraded with very low concentrations of total carbon. The application of compost improved the carbon level significantly, raised CEC and soil pH, which was to be be anticipated with a biochar application. Therefore, there is a potential positive response in soil health and vineyard productivity to applications of biochar alone or in combination with a compost application in North Coast vineyards.
A field trial has been undertaken comparing the application of biochar (at 10 tons per acre) to an application of compost (20 tons per acre) and a combined application of biochar and compost. These applications were made in the fall of 2021. The impacts of these amendments on soil health, vine nutrient status, vine water status, vine yield and fruit composition will be determined during the next two vintages. A cost analysis and a break-even analysis has been completed and the economic threshold for adoption of biochar applications in North Coast vineyards is lower than the threshold for field crops.
The first objective of this trial was to determine the impact of biochar and compost alone or in combination on soil health parameters in North Coast Soils utilizing the Cornell Comprehensive Assessment of Soil Health (CASH) (Moebius-Clune et al., 2016). The second objective was to determine if there is a potential yield increase due to an application of biochar, compost or a combination of biochar and compost that would justify adoption of these practices in North Coast vineyards.
Objectives of the Trial. The specific objectives of the trial can be summarized as follows.
- To assess the potential for biochar and compost separately or in combination to improve soil health parameters of North Coast Vineyard soils.
- To assess the impact of biochar and compost application on vine nutrition.
- To assess the impact of biochar and compost application on vine growth and yield.
- To assess the potential impact of biochar and compost applications on the grape composition.
- To assess the potential economic return from applications of biochar and compost separately or in combination for vineyards in North Coast.
| Su 21 | Fa 21 | W 21 | Spr 22 | Su 22 | Fa 22 | W 22 | Spr 23 | Su 23 | Fa 23 | W 23 | Spr 24 | Su 24 | |
| Beginning of project (7/1/2021) | x | ||||||||||||
| Preparation of trial sites | x | ||||||||||||
| Compost/biochar applications | x | ||||||||||||
| Initial soil sampling | x | ||||||||||||
| 1st Soil health workshop | x | ||||||||||||
| Follow up soil sampling | x | ||||||||||||
| 2nd Soil Health workshop | x | ||||||||||||
| Follow up soil sampling | x | ||||||||||||
| Interpretation of results (white paper) | x | ||||||||||||
| Distribution of white paper | x | ||||||||||||
| End of project July 1st, 2024 | x |
Cooperators
- - Technical Advisor
- - Producer (Researcher)
Research
Site: The vineyard site selected for this trial was located in Rutherford, CA. This vineyard has been in production since 1920 and there is a concern that prolonged farming of the soils at this site has led to degraded soil organic matter and carbon levels. The vineyard block selected for the trial was replanted in 2018 to Cabernet Sauvignon clone 8 and 039-16 rootstock. No compost or biochar application have been made to this site during recent replant. The soils in the vineyard block are classified as a Bale Clay Loam with 0 to 2% slope (Fine-loamy, mixed, superactive, thermic Cumulic Ultic Haploxerolls) by USDA-NRCS web soil survey (Soil Survey Staff). The vineyard is being trained to a double cordon system with spur-pruning and formed on a vertically shoot positioned (VSP) trellis. Row spacing is 8 feet and vine spacing is 6 feet between vines.
Trial Layout. The trial was laid out in a randomized split plot design with 3 replicates, which will allow us to perform a statistical analysis on all the results. The main plots were biochar application versus no biochar (see Figure 1).
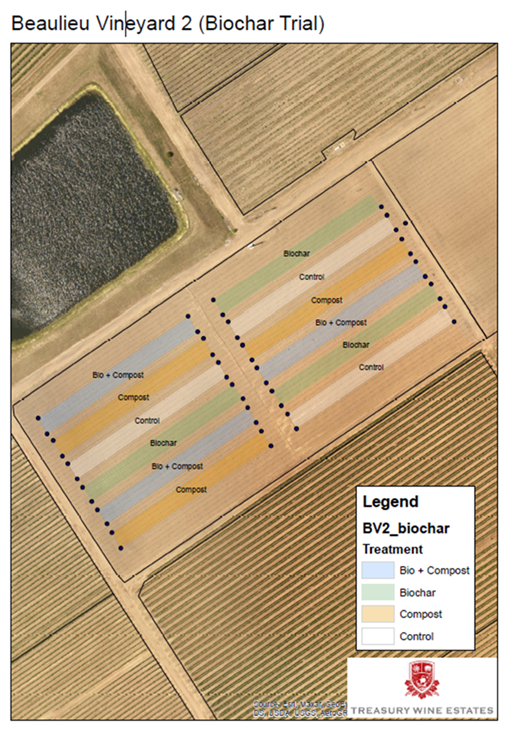
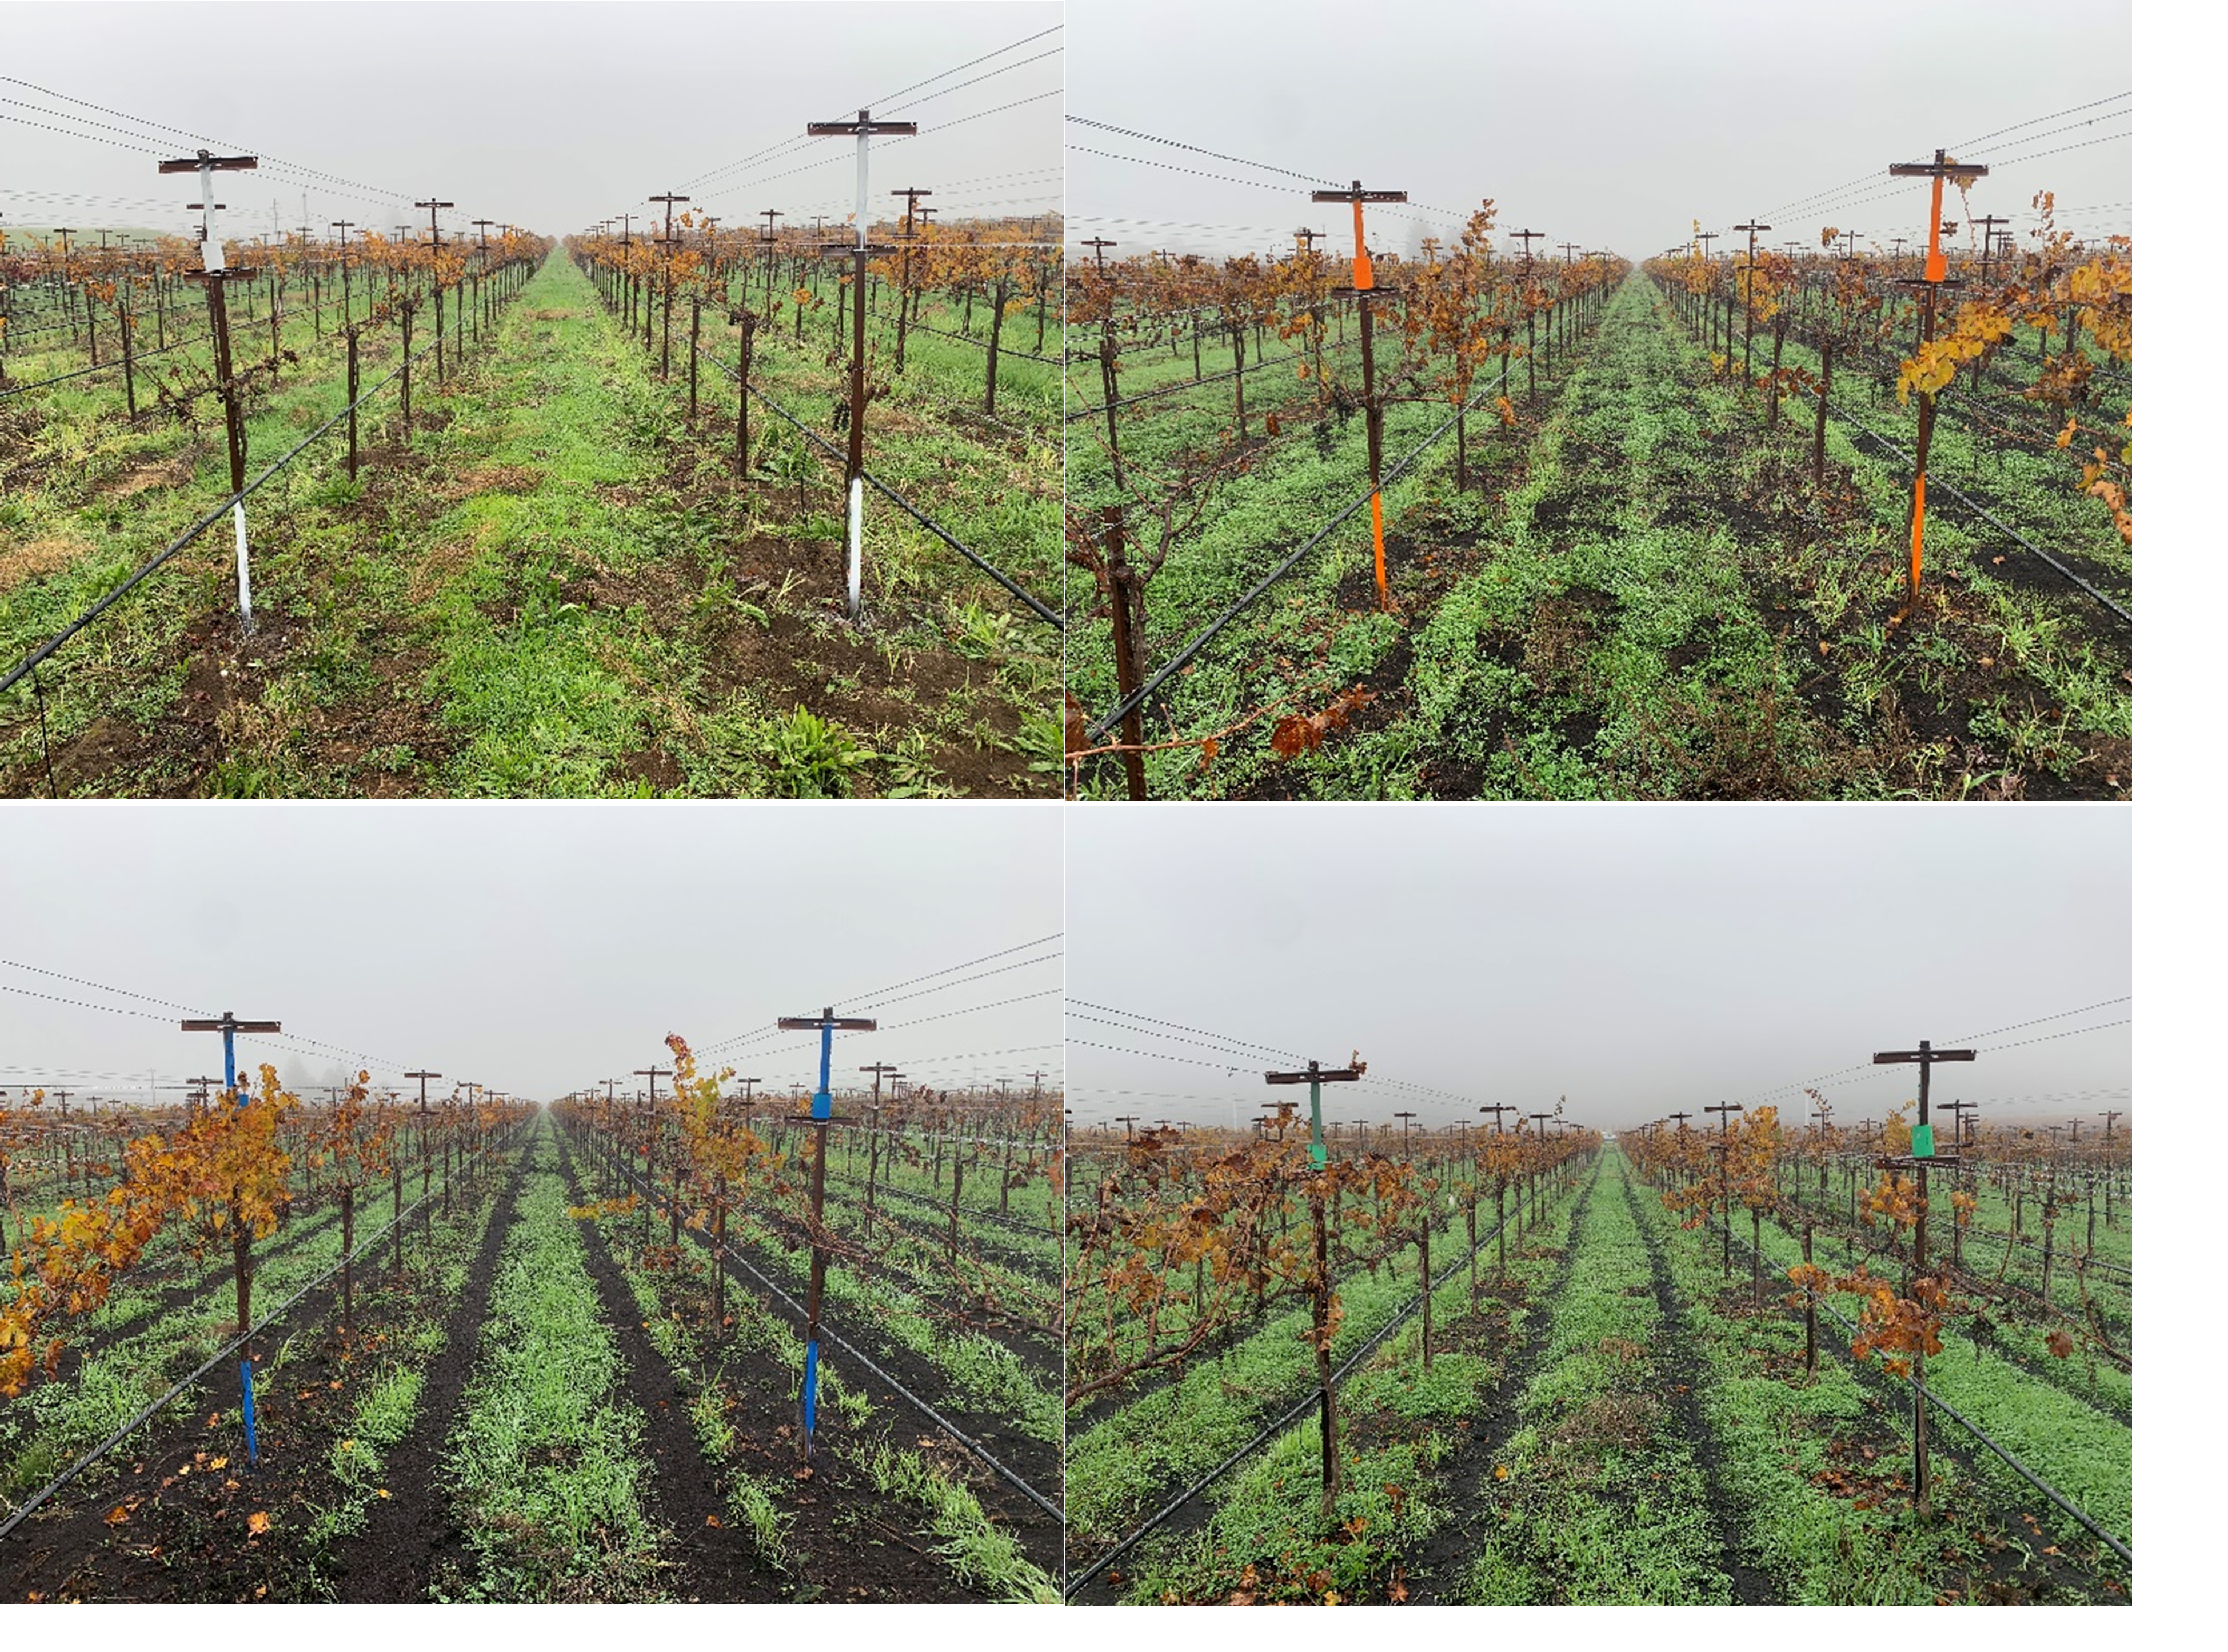
The sub plots were the application of compost or no compost. Each row contained 126 vines at a spacing of 6 feet between vines and 8 feet between rows, which is the equivalent of 0.13 acres. Each plot of 6 rows, therefore, is approximately 0.78 acres in size. The center 4 rows of each plot have been designated for data collection, leaving 2 buffer rows. The center data rows were delineated with GPS and a shapefile was generated using ArcMap. These shapefiles were shared with CERES imaging for aerial imaging of the plots (Figure 2). The plots are color coded: White (Control), Orange (Compost), Green (Biochar), and Blue (Biochar + Compost). The line posts in the vineyard have been painted with corresponding color to identify treatments in the field.
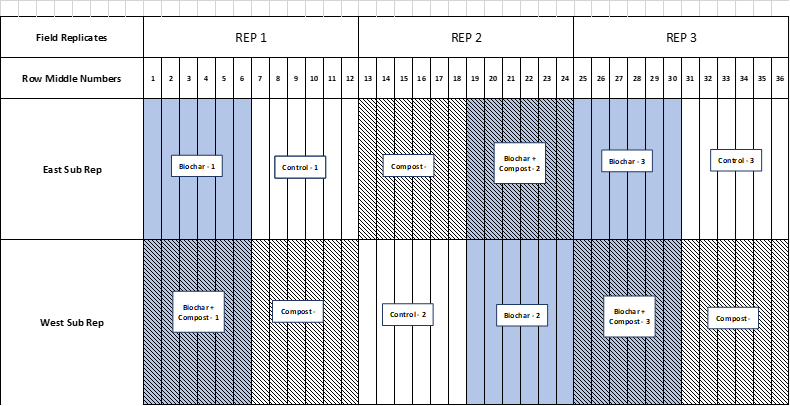
Figure 1. Trial layout of biochar and compost applications.
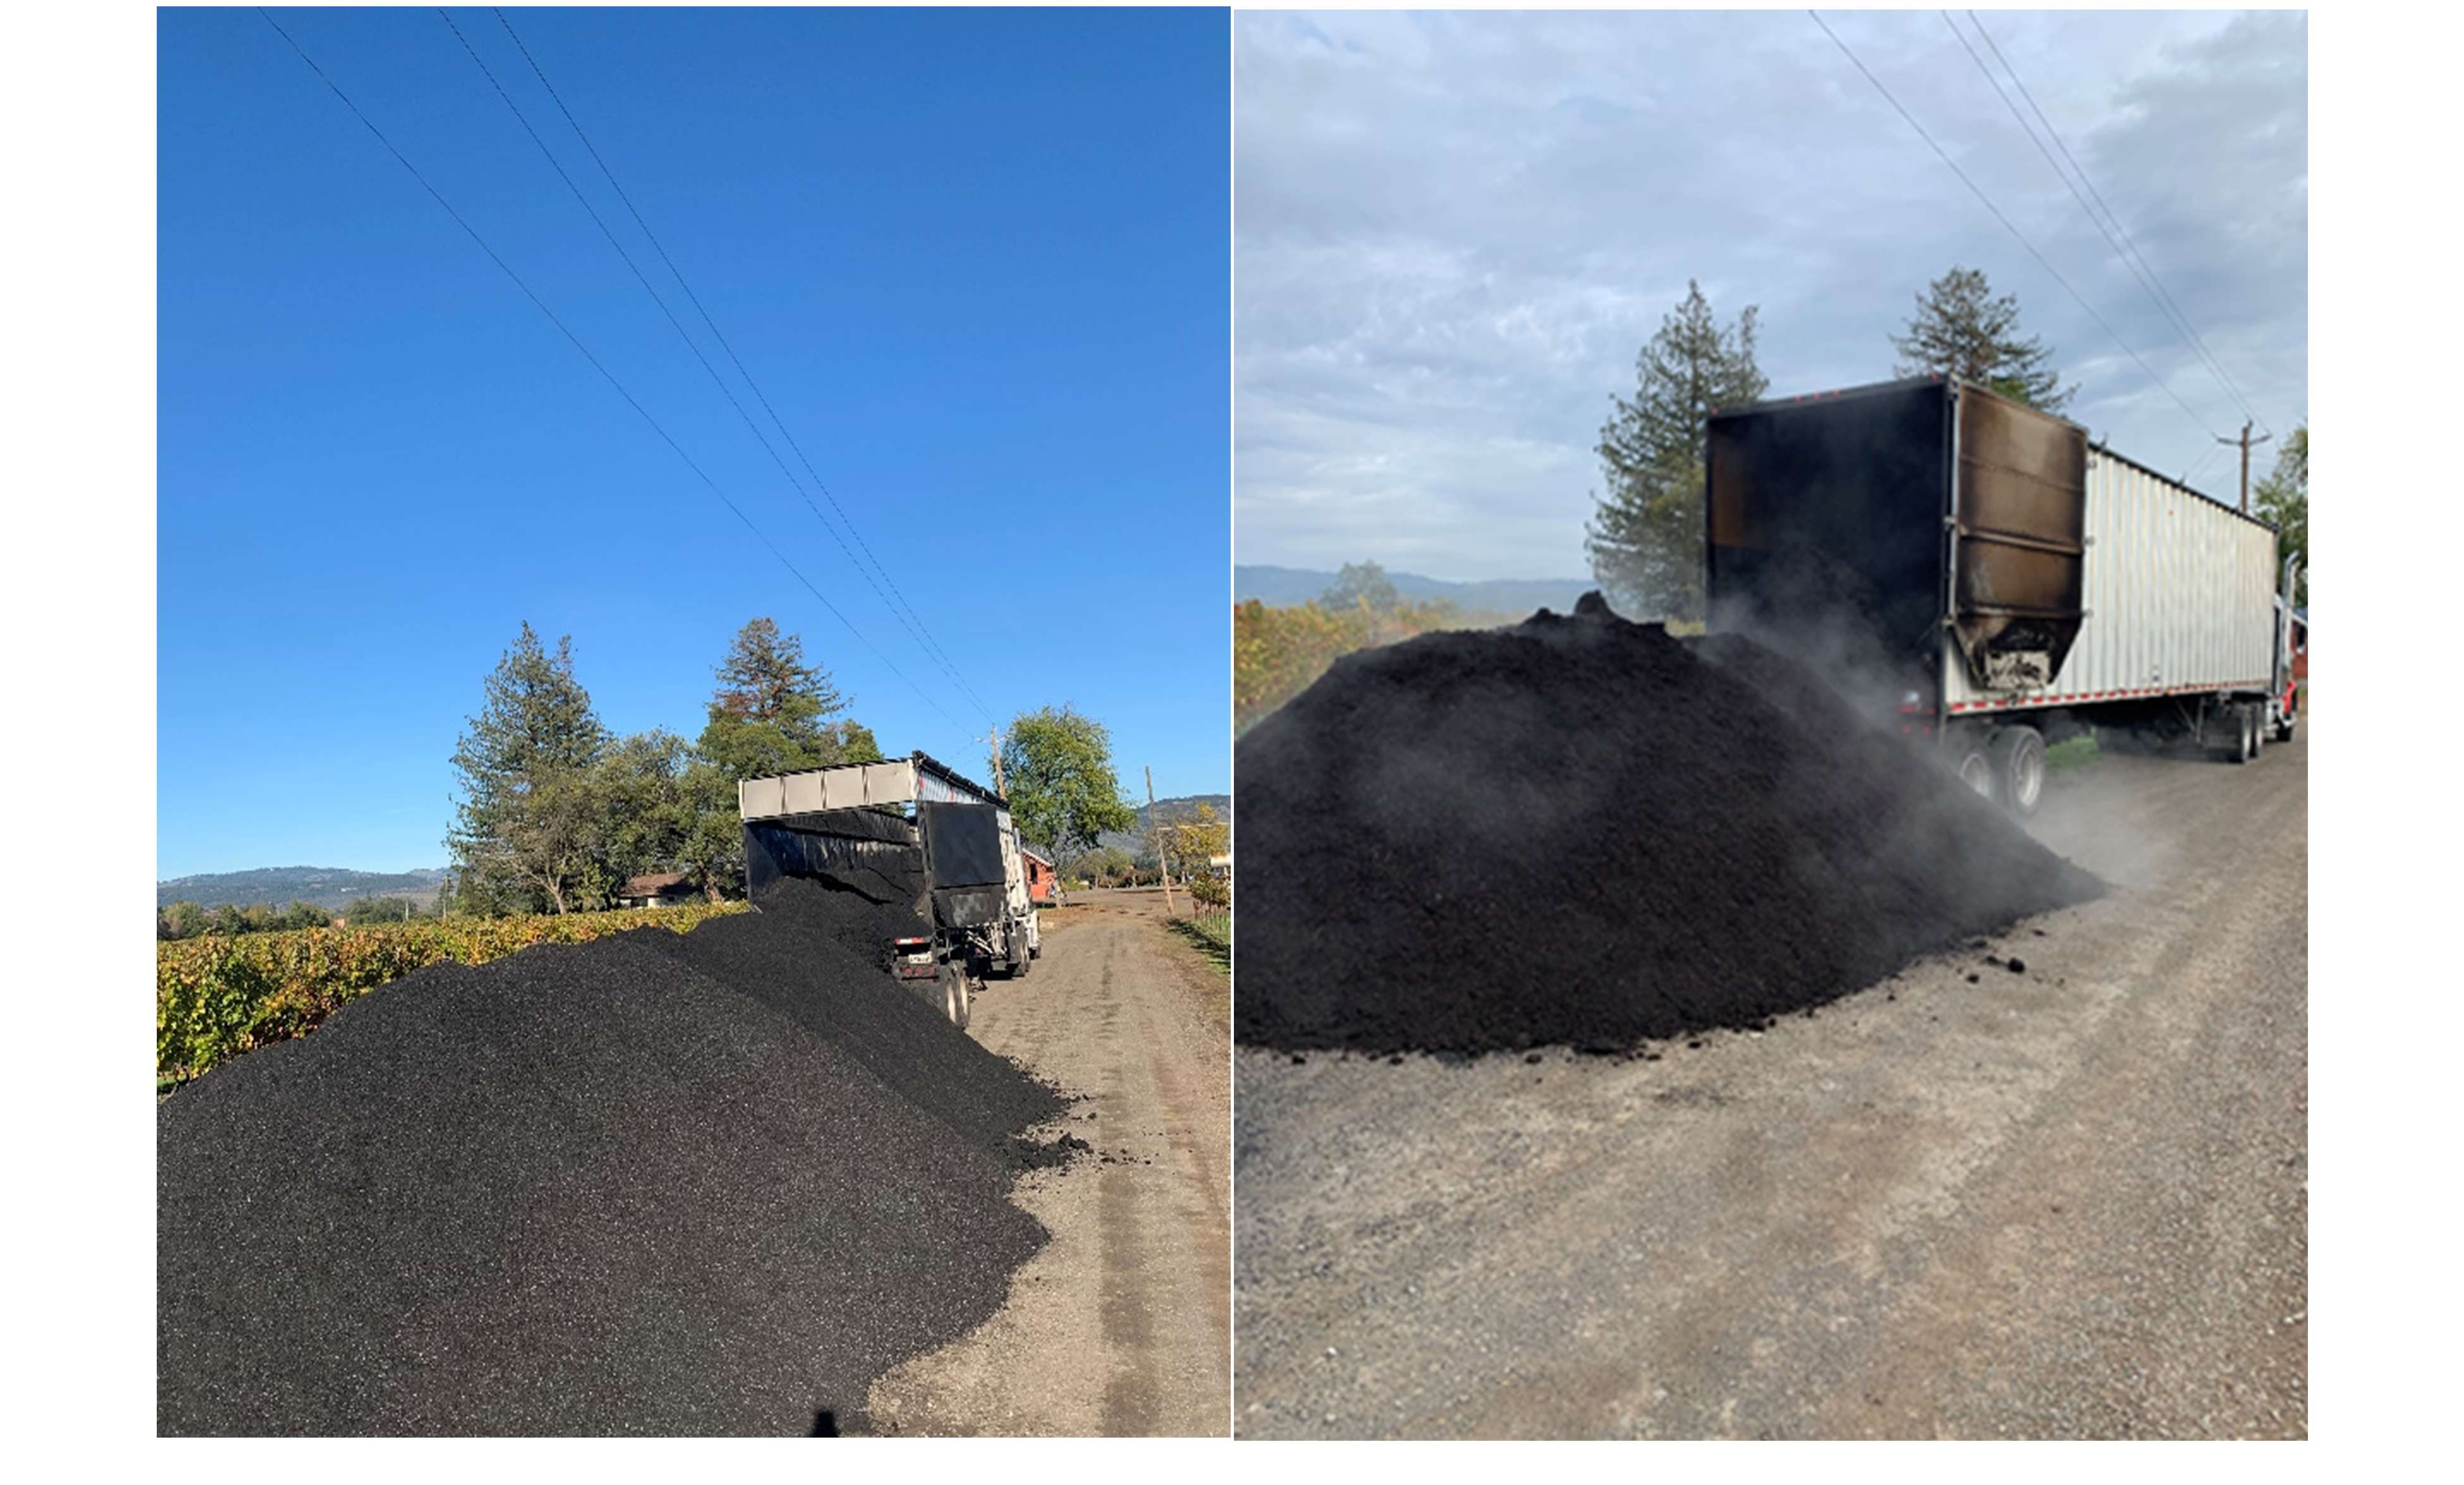
Biochar and Compost Applications. The applications of both biochar and organic compost were completed on December 1st and 2nd in 2021. The biochar was sourced from Pacific Biochar in Santa Rosa, California. The biochar delivered came from Fortuna, CA and is made from softwood products. The compost was sourced from Jepson Prairie Organics located in Dixon, CA. The compost was made from yard waste and is registered organic by OMRI (Figure 3).
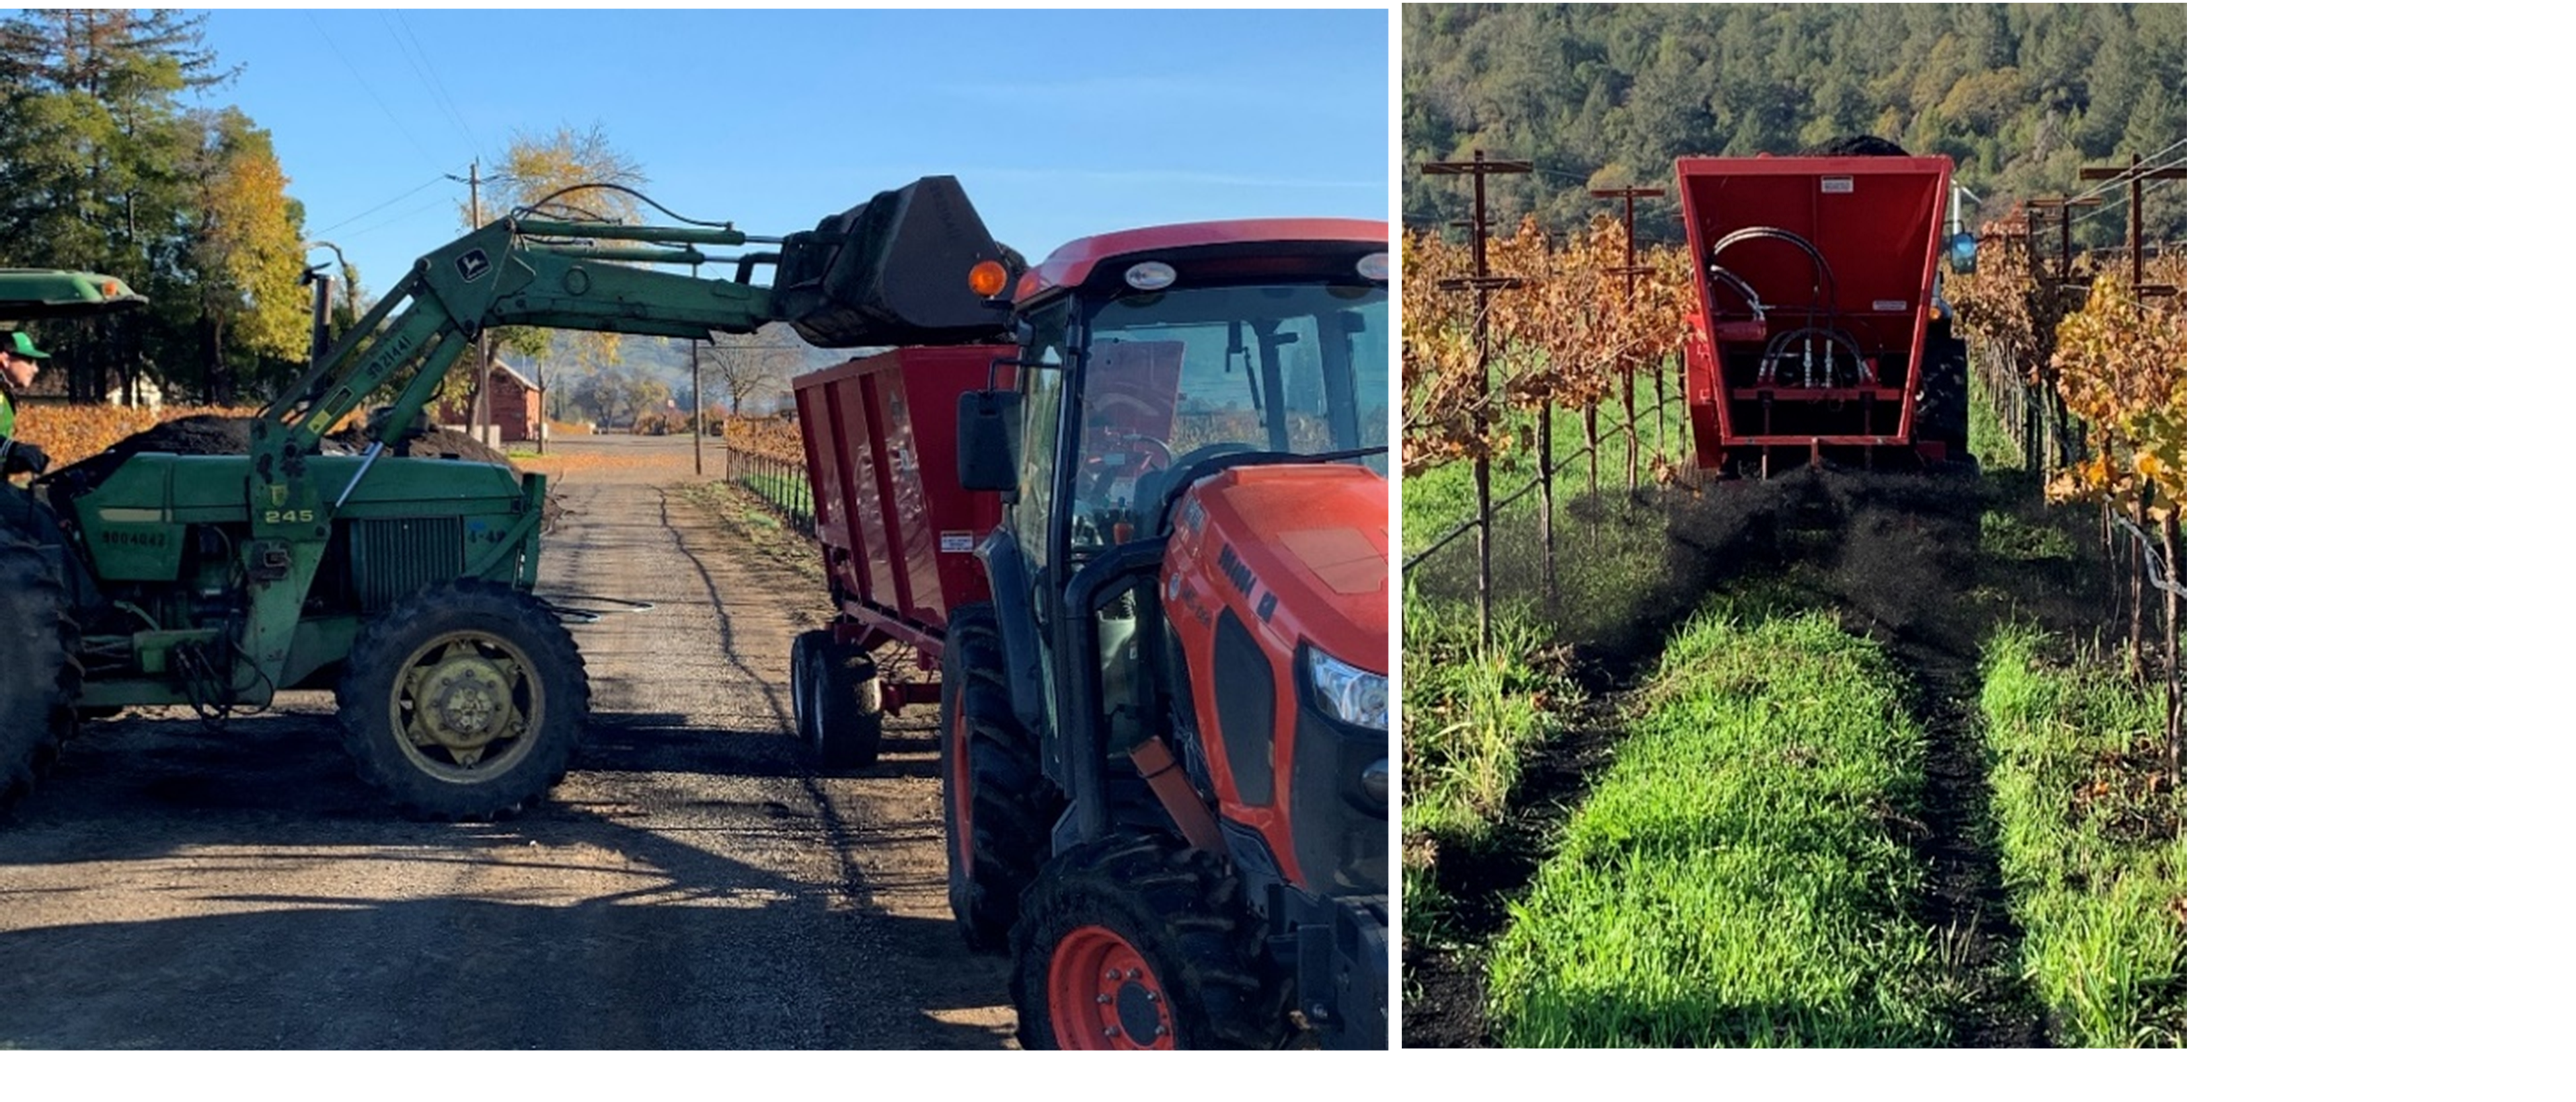
Both the compost and biochar were applied in the vineyard using a Whatcom Mulch spreader with a 5.5 cubic yard capacity. These amendments were broadcast in the vineyard from the rear of the mulch spreader and covered the whole row, including the area under the vines (Figure 4). A full spreader (5.5 cubic yards) of biochar was applied for each vineyard row in main plots. Since each row was equivalent to 0.139 acres, the application rate resulted in 39.61 cubic yards per acre. The compost was spread at the same rate of 39.16 cubic yards per acre (Table 2).
The man-hours to apply both the biochar and the compost were tracked for economic analysis. The total hours for biochar application were 6 man-hours and the total-hours for the compost application was 6.5 acres. The vineyard was also disced twice to incorporate amendments, with an addition 6 man-hours of direct labor hours.
Analysis of Compost and Biochar. A sample of both the biochar and compost was taken at delivery and sent to Soil Control Lab in Watsonville, California for analysis.
Soil Health Assessments
Soil samples were collected on May 4th, 2021, which was 7 months before application of biochar and compost. Soil samples were collected on May 5th, 2022, which was 6 months after applications, and again in May of 2023 and 2024 by either Napa Resource Conservation District staff or Treasury Wine Estates interns. Each sample was a composite of several soil core taken from vineyard row middle in each treatment replication. The samples were mixed, and one subsample was sent the Oregon State soil laboratory for analysis following Cornell Framework for Comprehensive Assessment of Soil Health. The soil samples were analyzed for characteristics of physical (texture, wet aggregate stability), biological (organic matter, active carbon, soil respiration), and chemical properties (pH, CEC, extractable P and K) at the Oregon State Soil Laboratory following protocols in Cornell Framework for CASH (Moebius-Clune et al, 2016).
Plant Health, Vine Water Status and Yield
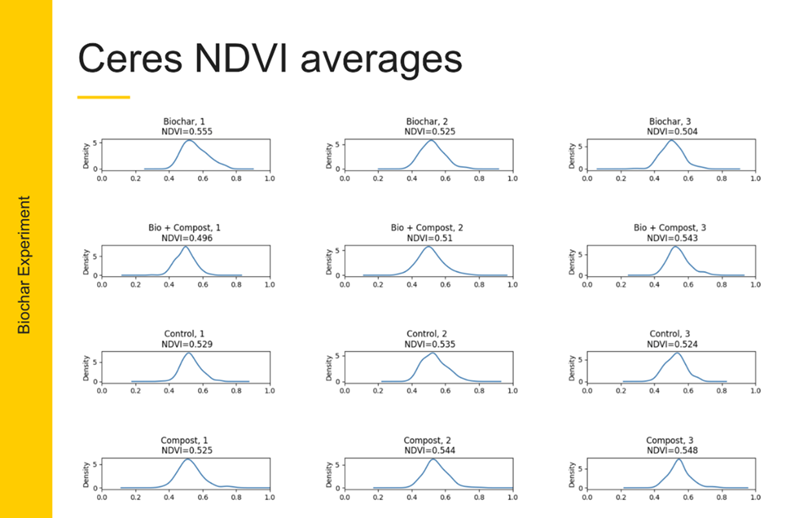
An initial (prior to application of biochar and compost) assessment of vine vigor was done on the individual plots with an NDVI (Normalized Vegetation Index) by CERES imaging on August 1, 2021. The NDVI data was calculated for each plot from central 4 vine rows with approximately 50 vines per row. The average NDVI and the distribution of individual vine NDVI was calculated for each plot prior to treatment by CERES Imaging.
Grapevine pruning weight data (number of shoots per vine, total pruning weight per vine) was collected in December of 2022 and February 2024 to determine potential impacts of compost and biochar applications on vine growth.
The effects of amendments on plan nutrient status were determined by analysis petiole samples during bloom in 2021 and leaf blade analysis in 2022 and 2023. Bloom time petioles were collected in June of 2021 and May 0f 2024 then sent to A&L Western Laboratories for analysis. Sampes of leaf blades at bloom in 2022 and 2023 were collected and sent to the same laboratory.
Measurements of plant water status (midday leaf water potential) was performed twice times during the 2022 seasons and on 5 different dates 2023 growing seasons.
For the first two growing seasons after biochar and compost applications (2022 and 2023), an analysis of yield parameters (kg per vine, clusters per vine, and average cluster weight) was determined from six random vines within each treatment annually to determine if amendments had an impact on yield.
Fruit composition at maturity was determined from clusters samples taken on September 14, 2022, and again on October 14, 2023. The samples were weighed (average of 15 clusters), crushed and analyzed for soluble solids (Brix), pH, and titratable acidity in the lab using Fourier-transform infrared spectroscopy (FTIR) with FOSS WineScan to determine if treatment had an impact on fruit ripening and composition.
Analysis of Compost and Biochar. Comparing the analysis of biochar to compost (Table 1) showed that bulk density of biochar (19.1 lbs. per cubic foot) is close to half that of the compost (37 lbs. per cubic foot). This will be important for calculating tons per acre applied, since both were applied at the same cubic yard per acre rate.
|
Table 1. Results from Biochar and Compost Analysis |
||
|
|
Biochar |
Compost |
|
Bulk Density (lbs./cu. ft) |
19.1 |
37.0 |
|
Moisture (%) |
67.8 |
36.8 |
|
Organic Matter (%) |
- |
32.7 |
|
Carbon (%) |
27.7 |
17.0 |
|
Hydrogen (%) |
0.7 |
- |
|
Nitrogen (%) |
0.2 |
1.1 |
|
Oxygen (%) |
1.6 |
- |
|
Ash (%) |
1.9 |
30.7 |
|
TOTAL |
100 |
100 |
|
C:N Ratio |
139 |
15 |
The biochar also had a higher moisture content, a higher content of carbon and a much lower ash content than the compost. The biochar had a 5-fold lower content of nitrogen than the compost. The carbon-to-nitrogen ratio of the biochar was 139, while the carbon-to-nitrogen ratio for the compost was 15.3. Due to the very high C:N ratio of biochar, there is a concern that a biochar application will increase the C:N ratio of the soils after application. The average C:N ratio of the soil in this vineyard is 11, which is considerably less than the C:N ratio of biochar, yet similar the C:N ratio of the compost. Future analysis of the soils should clarify any changes in the C:N ratio of the soils due to these applications.
Application Rates for Amendments and Carbon and Nutrients Applied.
Using the bulk density values for the biochar and compost, we were able to calculate the application rates in tons per acre (Table 2). The calculated application rate for the biochar was 10.21 tons per acre, which was slightly higher than targeted rate of 10 tons per acre. The calculate rate of application for the compost was 19.78 tons per acre, which was slightly less than the targeted 20 tons per acre. The combination of compost plus biochar was applied at 30 tons per acre (wet basis). The amount of carbon applied in the biochar only treatment was calculated to be 2.83 tons per acre. The amount carbon applied with the compost application was calculated to be slightly higher (3.36 tons per acre) than the amount in the biochar treatment (Table 2.). The carbon applied with the combined biochar and compost application was 6.19 tons per acre. An increase of at most 0.28% in soil C is expected with the biochar treatment and an increase of up to 0.34% is expected with the compost application. The combined biochar plus compost treatment has potential to raise C content of topsoil by 0.62%. Some losses are expected, and we expect to see actual C content of future soil samples to increase, but not as much as the calculated amounts. In addition, we expect the C concentration increases of soil samples to be more stable with the biochar applications than the compost application over time.
|
Table. 2. Bulk Density and application rates of Biochar and Compost and amount of Carbon and macronutrients applied per treatment. |
||||
|
|
Units |
Biochar Application |
Compost Application |
Compost + Biochar |
|
Bulk Density |
|
|
|
|
|
|
lbs/cu ft |
19 |
37 |
|
|
|
lbs/cu yd |
516 |
999 |
|
|
Application Rates |
|
|
|
|
|
|
cu yd/acre |
39.6 |
39.6 |
|
|
|
lbs / acre |
20,428 |
39,573 |
60,002 |
|
|
tons / acre |
10.21 |
19.79 |
30.00 |
|
Carbon applied |
% |
27.7 |
17.0 |
|
|
|
tons / acre |
2.83 |
3.36 |
6.19 |
|
|
lbs /acre |
5,659 |
6,727 |
12,386 |
|
Estimated Soil C increase |
|
0.28% |
0.34% |
0.62% |
|
C:N Ratio |
|
139 |
15 |
26 |
|
Nutrients Applied |
|
|
|
|
|
N |
lbs/acre |
41 |
435 |
476 |
|
P |
lbs/acre |
2 |
79 |
81 |
|
P205 |
lbs/acre |
5 |
178 |
183 |
|
K |
lbs/acre |
9 |
257 |
266 |
|
K20 |
lbs/acre |
11 |
309 |
320 |
Biochar contains a small amount of nitrogen (0.2%) and the application of biochar resulted in an application of nitrogen of 41 lbs. per acre. The compost used in this trial had a five-fold higher concentration (1.1%) of nitrogen than the biochar used and since it was applied at twice the rate by weight, the amount of nitrogen applied per acre with the compost application was 435 lbs. per acre. The amount of nitrogen applied with the combined biochar and compost application was 476 lbs. per acre. Vineyards have a low nitrogen requirement compared to other crops. Under normal conditions, this vineyard receives an annual application of nitrogen between 20 and 40 lbs. per acre. Therefore, the nitrogen applied with biochar only would only be sufficient to supply approximately one year of nutrient program, while the compost application could theoretically supply 10 years’ worth of applied nutrients. There is some concern that the amount of nitrogen applied with compost is excessive and could lead to possible losses via leaching or nitrous oxide production. Biochar may be able to stabilize the nitrogen applied and will be evaluated with soil sampling.
The phosphorus and potassium levels measured in the analysis of the biochar quite low (Table 2). The phosphorus and potassium levels in the compost were also analyzed (Table 2) and the application of compost resulted in adding 79 lbs. per acre of P and 257 lbs. per acre of K in both the compost treatments.
SOIL HEALTH ASSESSMENTS
Initial Comprehensive Assessments of Soil Health (CASH).
The initial results show that the soil in this vineyard block has a uniform loam texture with 34% to 36% sand, 39% to 40% silt, and 24% to 26% clay content (Table 3A). The water stable aggregate values for soil samples collected prior to biochar and compost application fluctuated somewhat between trial plots for 33 to 44%. The soils also have both a uniform soil pH, cation exchange capacity (CEC) and soil Electrical Conductivity (Table 3A). Biochar applications have been shown to increase soil pH and CEC both depending upon initial conditions (Garcia-Jaramillo et al 2021, Guo 2021, Schulz and Glaser, 2012) and there is interest in confirming potential impact of the treatments on these soil physical and chemical properties. The soil pH at this site is slightly alkaline and, therefore the liming effect of a biochar application may be minimal.
|
Table 3A. Soil physical (soil texture, water stable aggregate stability), chemical (Cation Exchange Capacity, pH, EC), and biological (Organic Matter, Carbon, Active Carbon, Nitrogen, C:N ratio, and microbial respiration rates) parameters from CASH analysis of soils from plots prior to application of biochar and compost (May 2021). |
||||
|
|
Biochar + Compost |
Biochar |
Compost |
Control |
|
% Sand |
34 |
35 |
36 |
35 |
|
Silt |
40 |
39 |
40 |
40 |
|
Clay |
26 |
25 |
24 |
25 |
|
Texture |
loam |
loam |
loam |
loam |
|
Water stable aggregates (%) |
33 |
44 |
37 |
39 |
|
pH |
7.40 |
7.40 |
7.45 |
7.42 |
|
EC (dS/m) |
0.19 |
0.18 |
0.27 |
0.21 |
|
CEC (meq/100g) |
17 |
17 |
18 |
17 |
|
Org. Matter (%) |
2.19 |
2.32 |
2.55 |
2.35 |
|
Total Carbon (%) |
1.10 |
1.16 |
1.27 |
1.18 |
|
Total N (%) |
0.12 |
0.11 |
0.13 |
0.11 |
|
C:N ratio |
9.0 |
10.7 |
9.7 |
10.7 |
|
Active Carbon (ppm) |
244 |
220 |
214 |
222 |
CO2 Respiration 24 hr (µg CO2-C/g dry soil/day) |
77 |
94 |
95 |
95 |
CO2 Respiration 96 hr (µg CO2-C/g dry soil/day) |
45 |
56 |
56 |
59 |
Post application results.
The CASH analysis from OSU from samples taken 30 months after application, (Table 3B) did not reveal any statistically significant effects of either biochar or compost application of water stable aggregates, soil EC, cation exchange capacity, organic matter content, total C, active C, or total N. Soil pH was significantly increased by biochar application and there and the increase was greater with additional compost application. The 24-hour soil CO2 respiration rates were significantly lower in biochar plots. The potentially mineralizable N level were also significantly lower in the biochar plots, while the C:N ratios were higher. The active or permanganate oxidizable carbon level was significantly higher in plots with compost + biochar addition the third year after application. The results of this study contrast with the results from previous studies with application of biochar (Garcia-Jaramillo et al, 2021) or compost (Dahlgren et al, 2021) have reported increases in total and active carbon, total N, and soil CEC.
|
Table 3B. Soil physical (soil texture, water stable aggregate stability), chemical (Cation Exchange Capacity, pH, EC), and biological (Organic Matter, Carbon, Active Carbon, Nitrogen, C:N ratio, and microbial respiration rates) parameters from CASH analysis of soils from plots 30 months after application of biochar and compost (May 2024). |
||||||||
|
|
|
|
|
|
Significance | |||
|
|
Biochar + Compost |
Biochar |
Compost |
Control |
Biochar |
Comp |
Bio + Compost |
Rep |
|
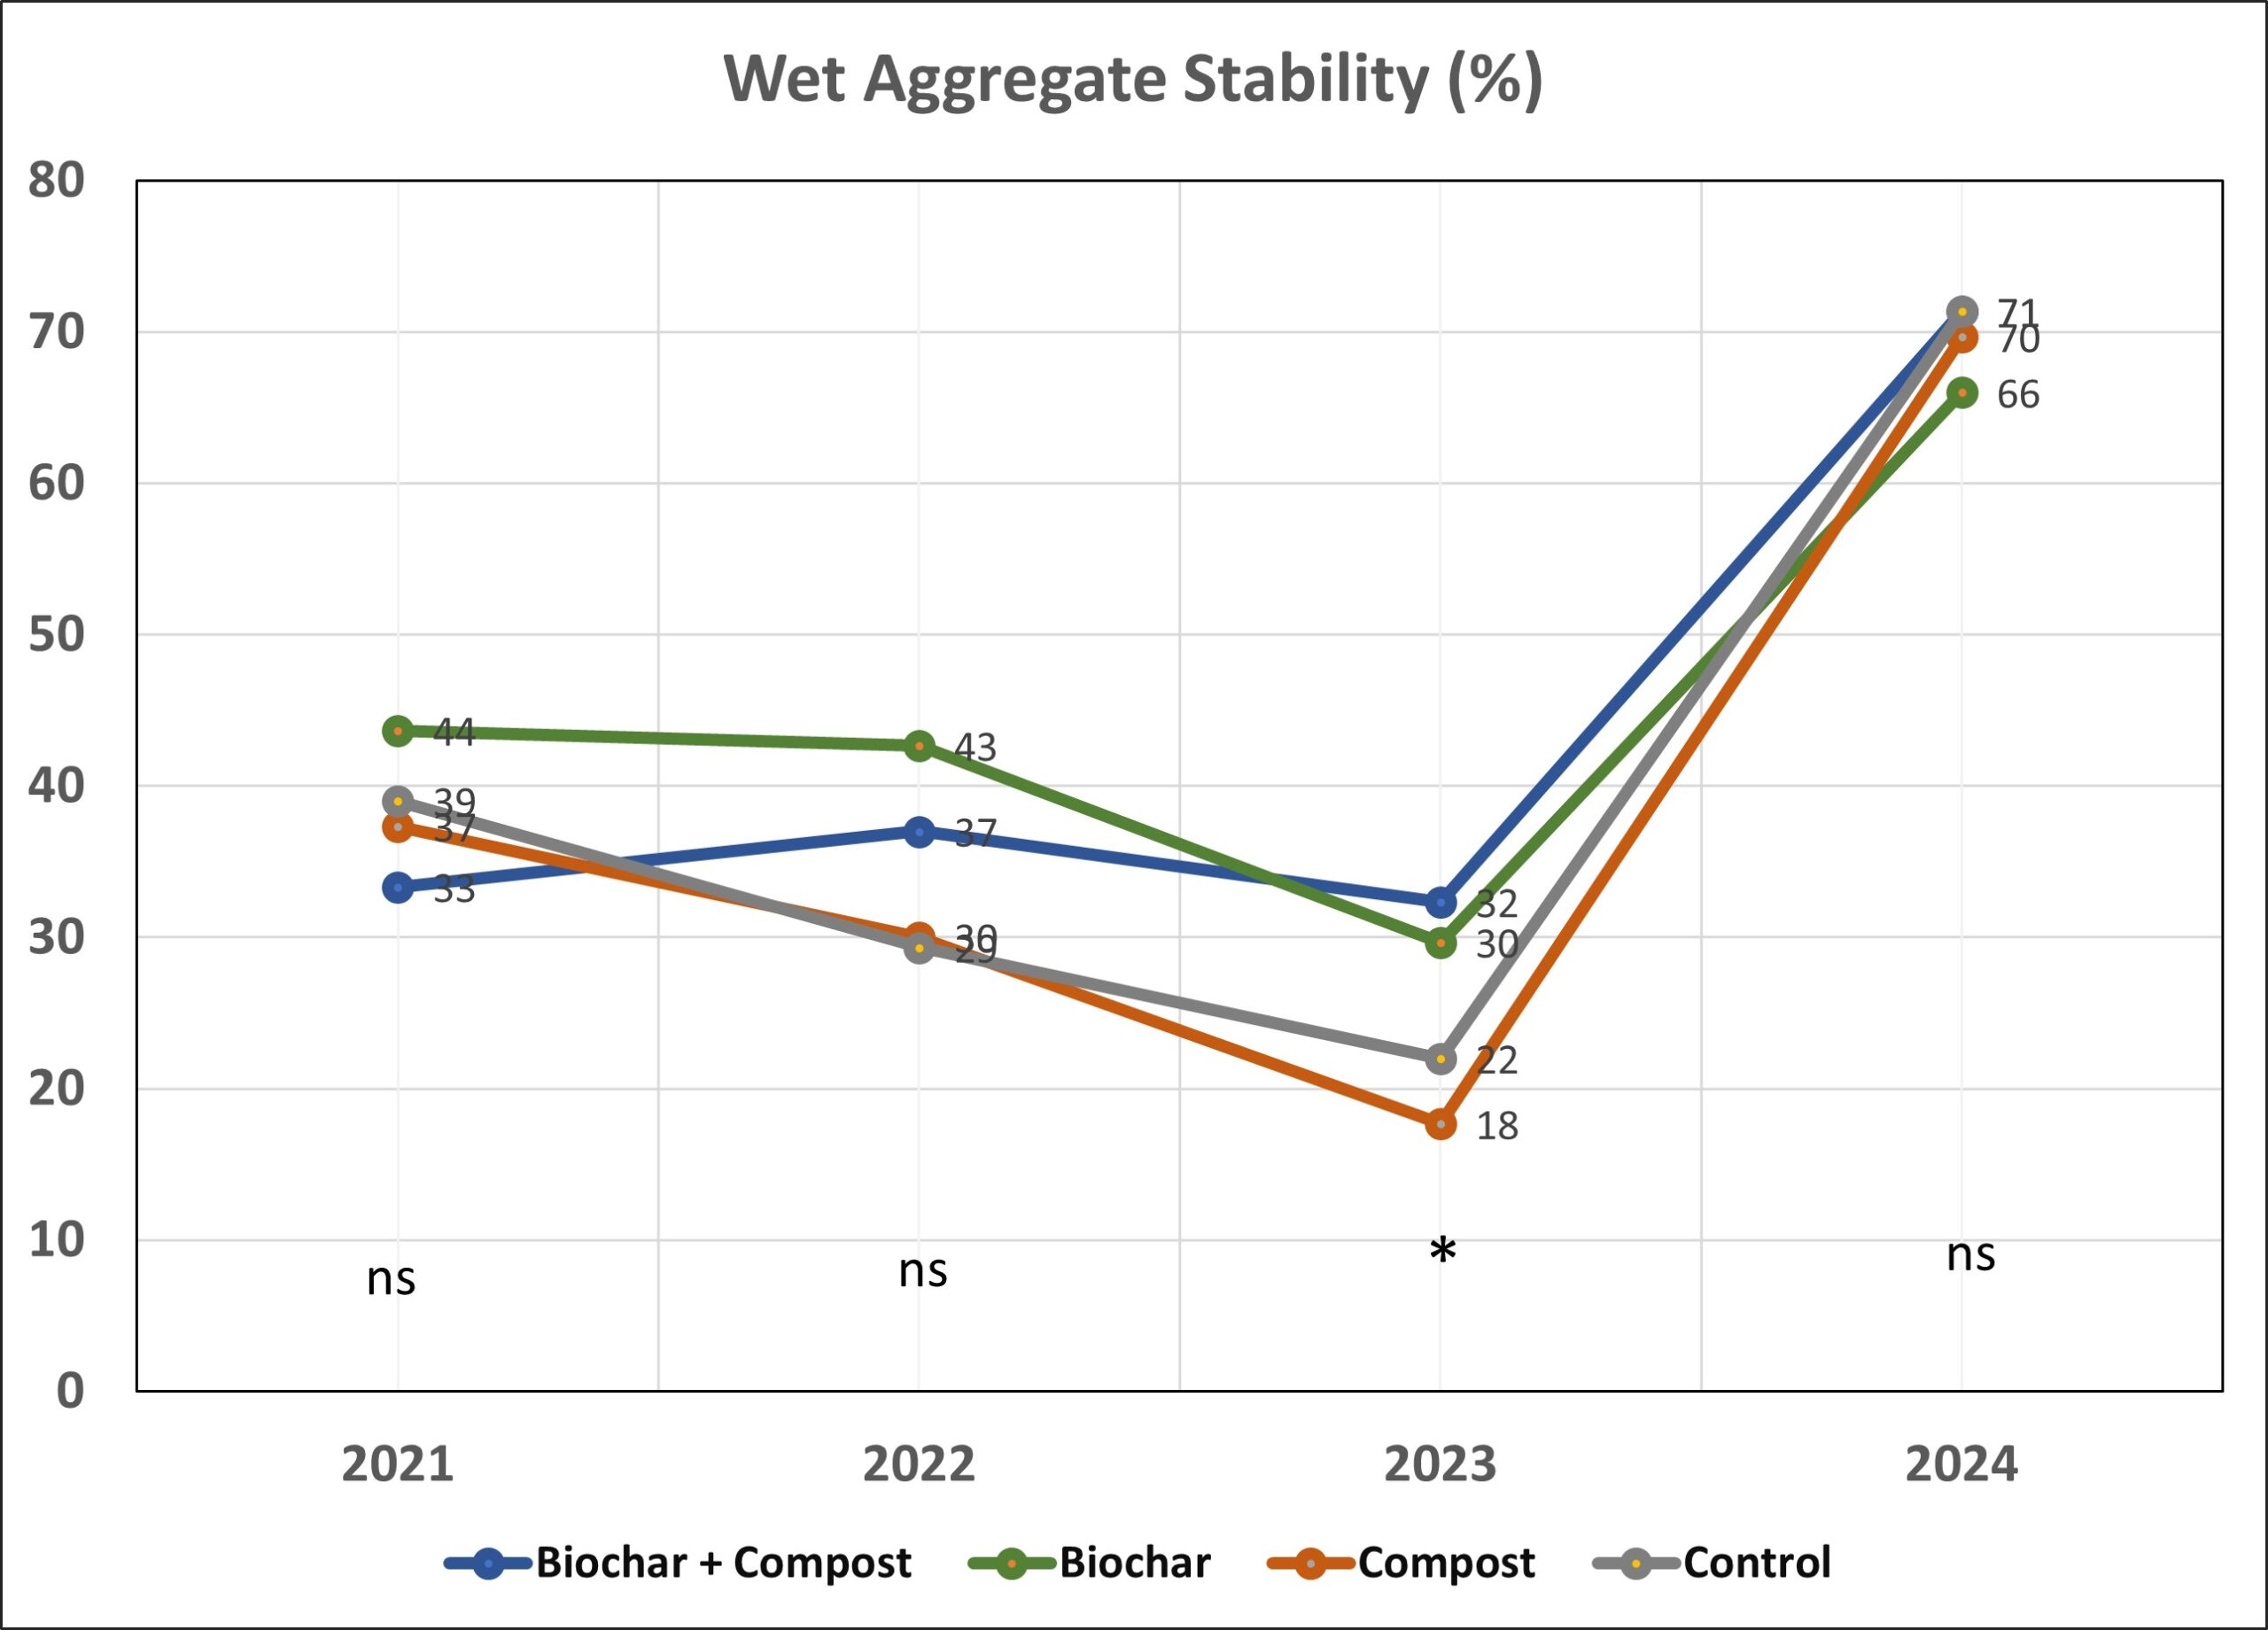
Water stable aggregates (%) |
71 |
66 |
70 |
71 |
ns |
ns |
ns |
ns |
|
pH |
7.59 |
7.36 |
7.35 |
7.28 |
p < 0.05 |
ns |
p < 0.05 |
ns |
|
EC (dS/m) |
0.11 |
0.14 |
0.12 |
0.10 |
ns |
ns |
ns |
ns |
|
CEC (meq/100g) |
28 |
24 |
33 |
26 |
ns |
ns |
ns |
ns |
|
Org. Matter (%) |
2.49 |
2.56 |
2.85 |
2.11 |
ns |
ns |
ns |
ns |
|
Total Carbon (%) |
1.24 |
1.28 |
1.42 |
1.05 |
ns |
ns |
ns |
ns |
|
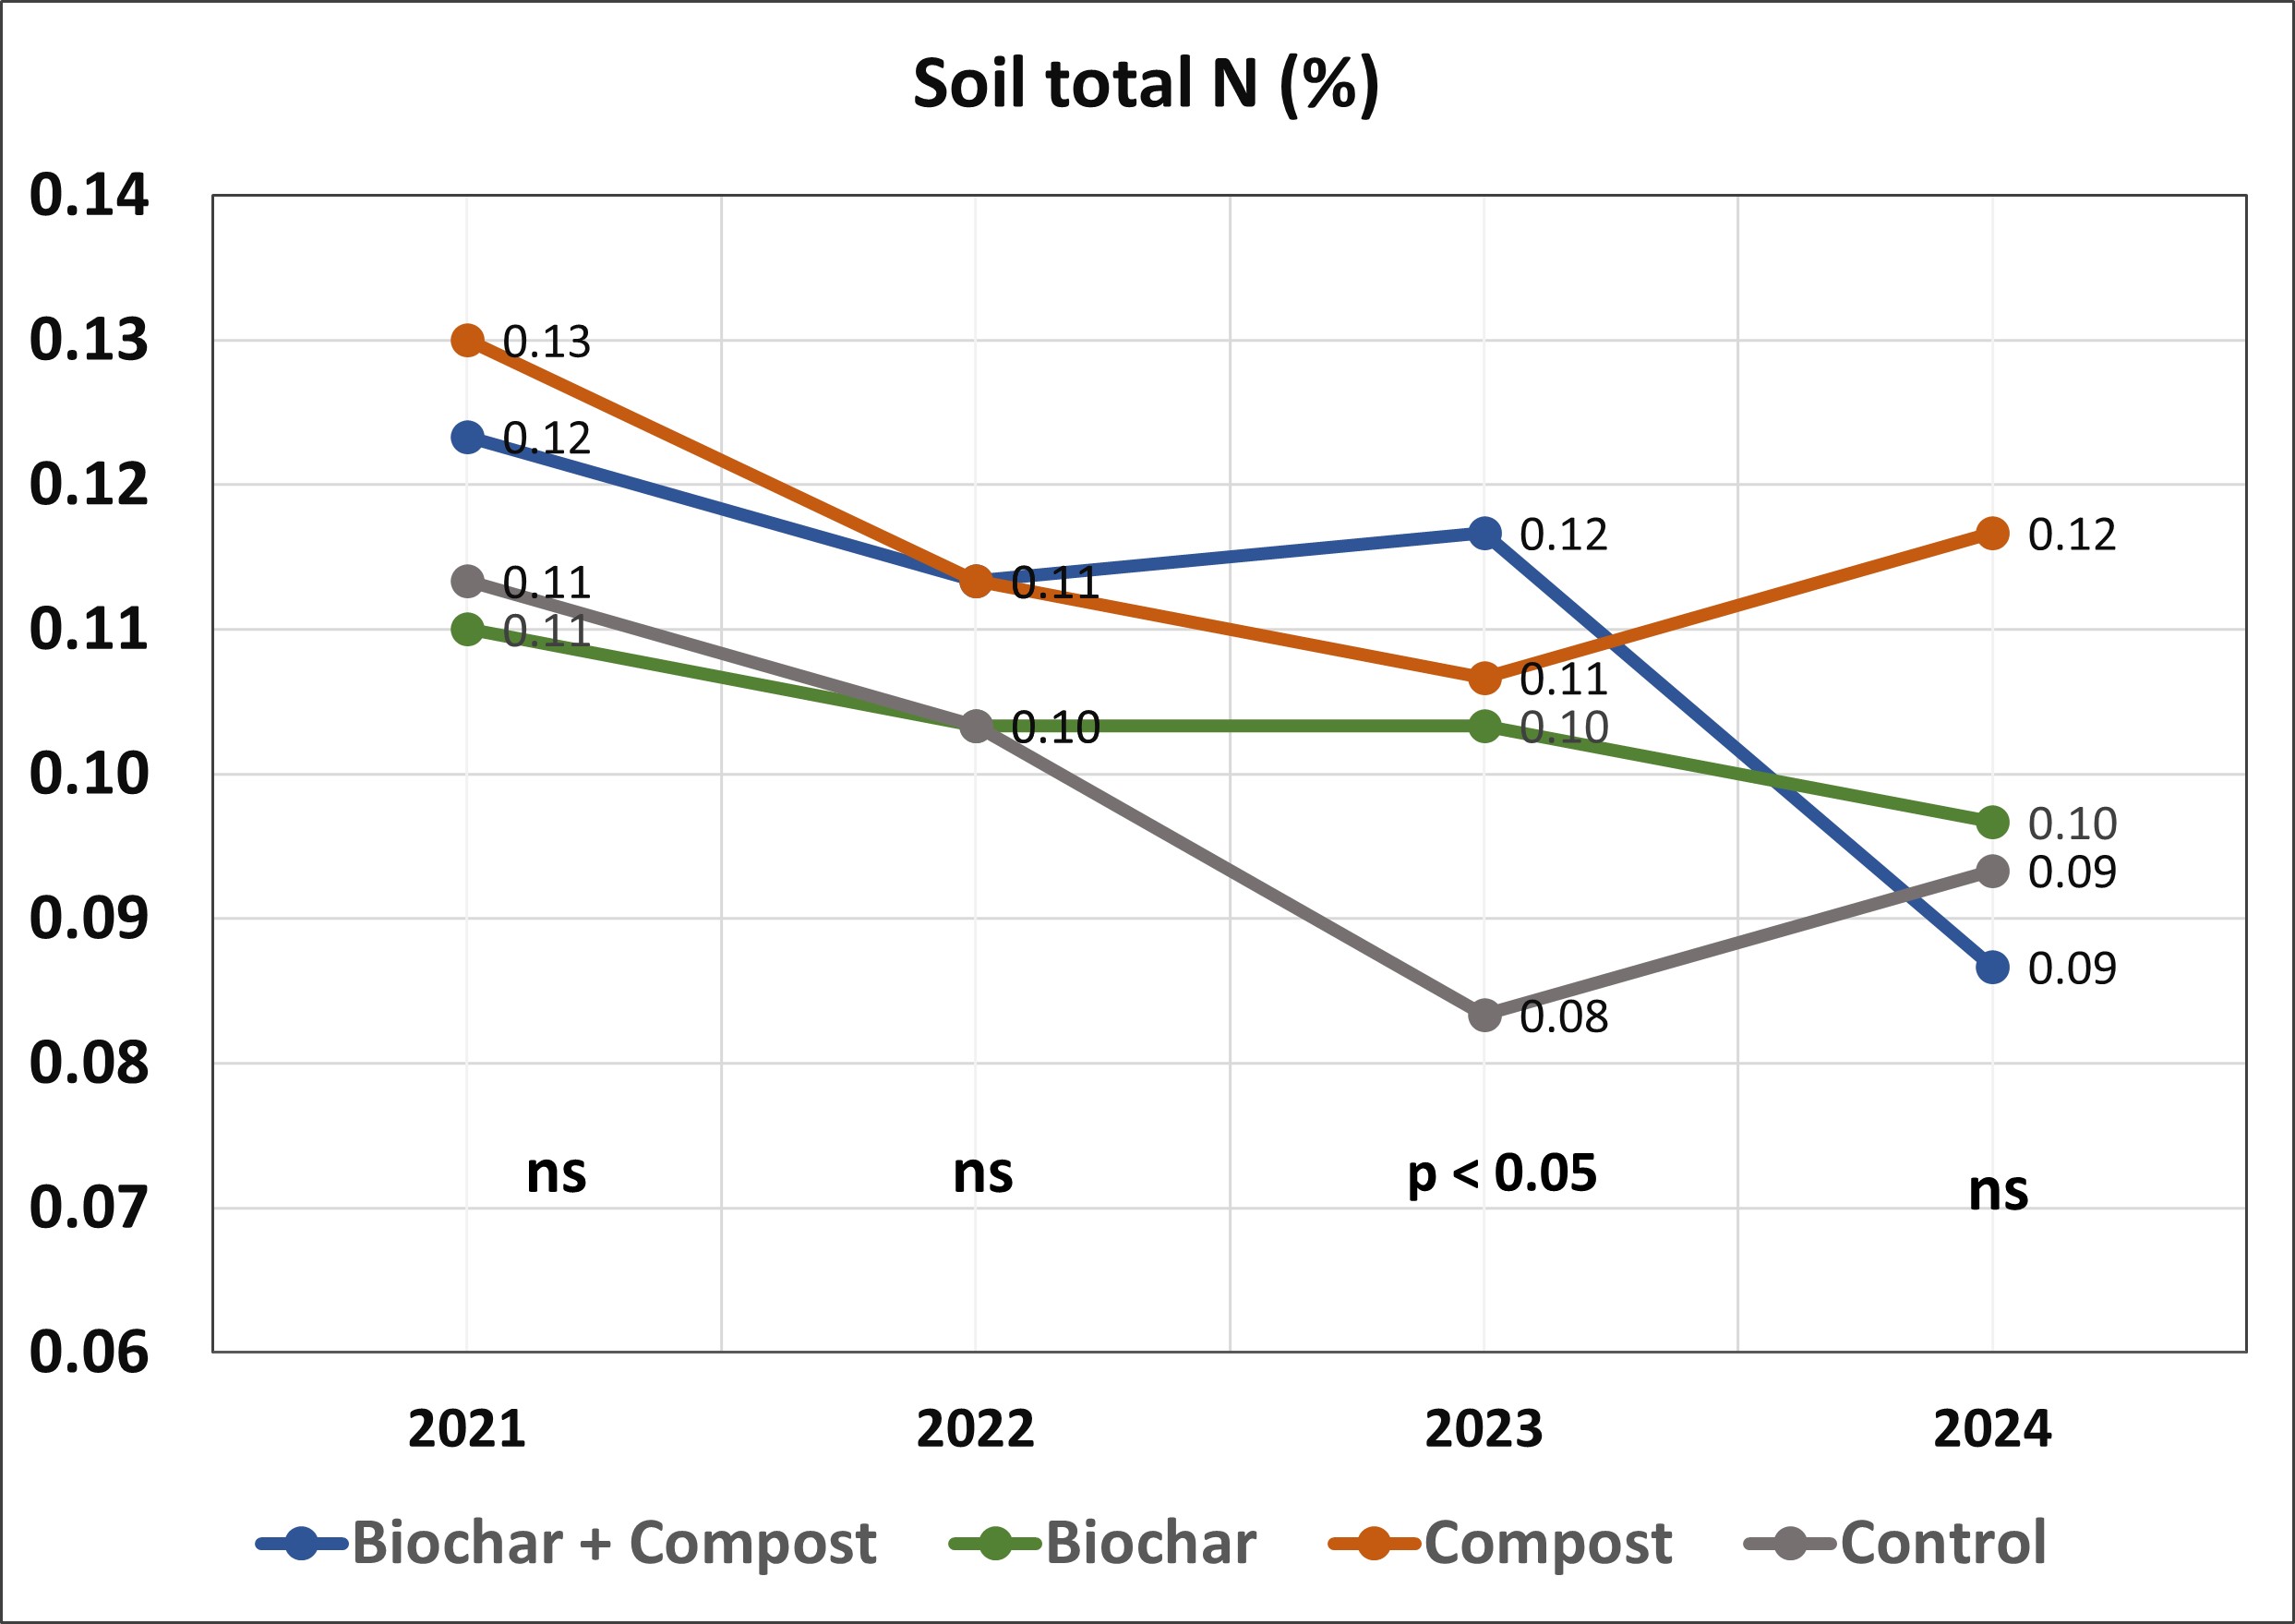
Total N (%) |
0.09 |
0.10 |
0.12 |
0.09 |
ns |
ns |
ns |
ns |
|
C:N ratio |
13.1 |
13.3 |
12.1 |
11.3 |
p < 0.05 |
ns |
ns |
ns |
|
Active Carbon (ppm) |
264 |
255 |
315 |
249 |
ns |
p < 0.05 |
ns |
ns |
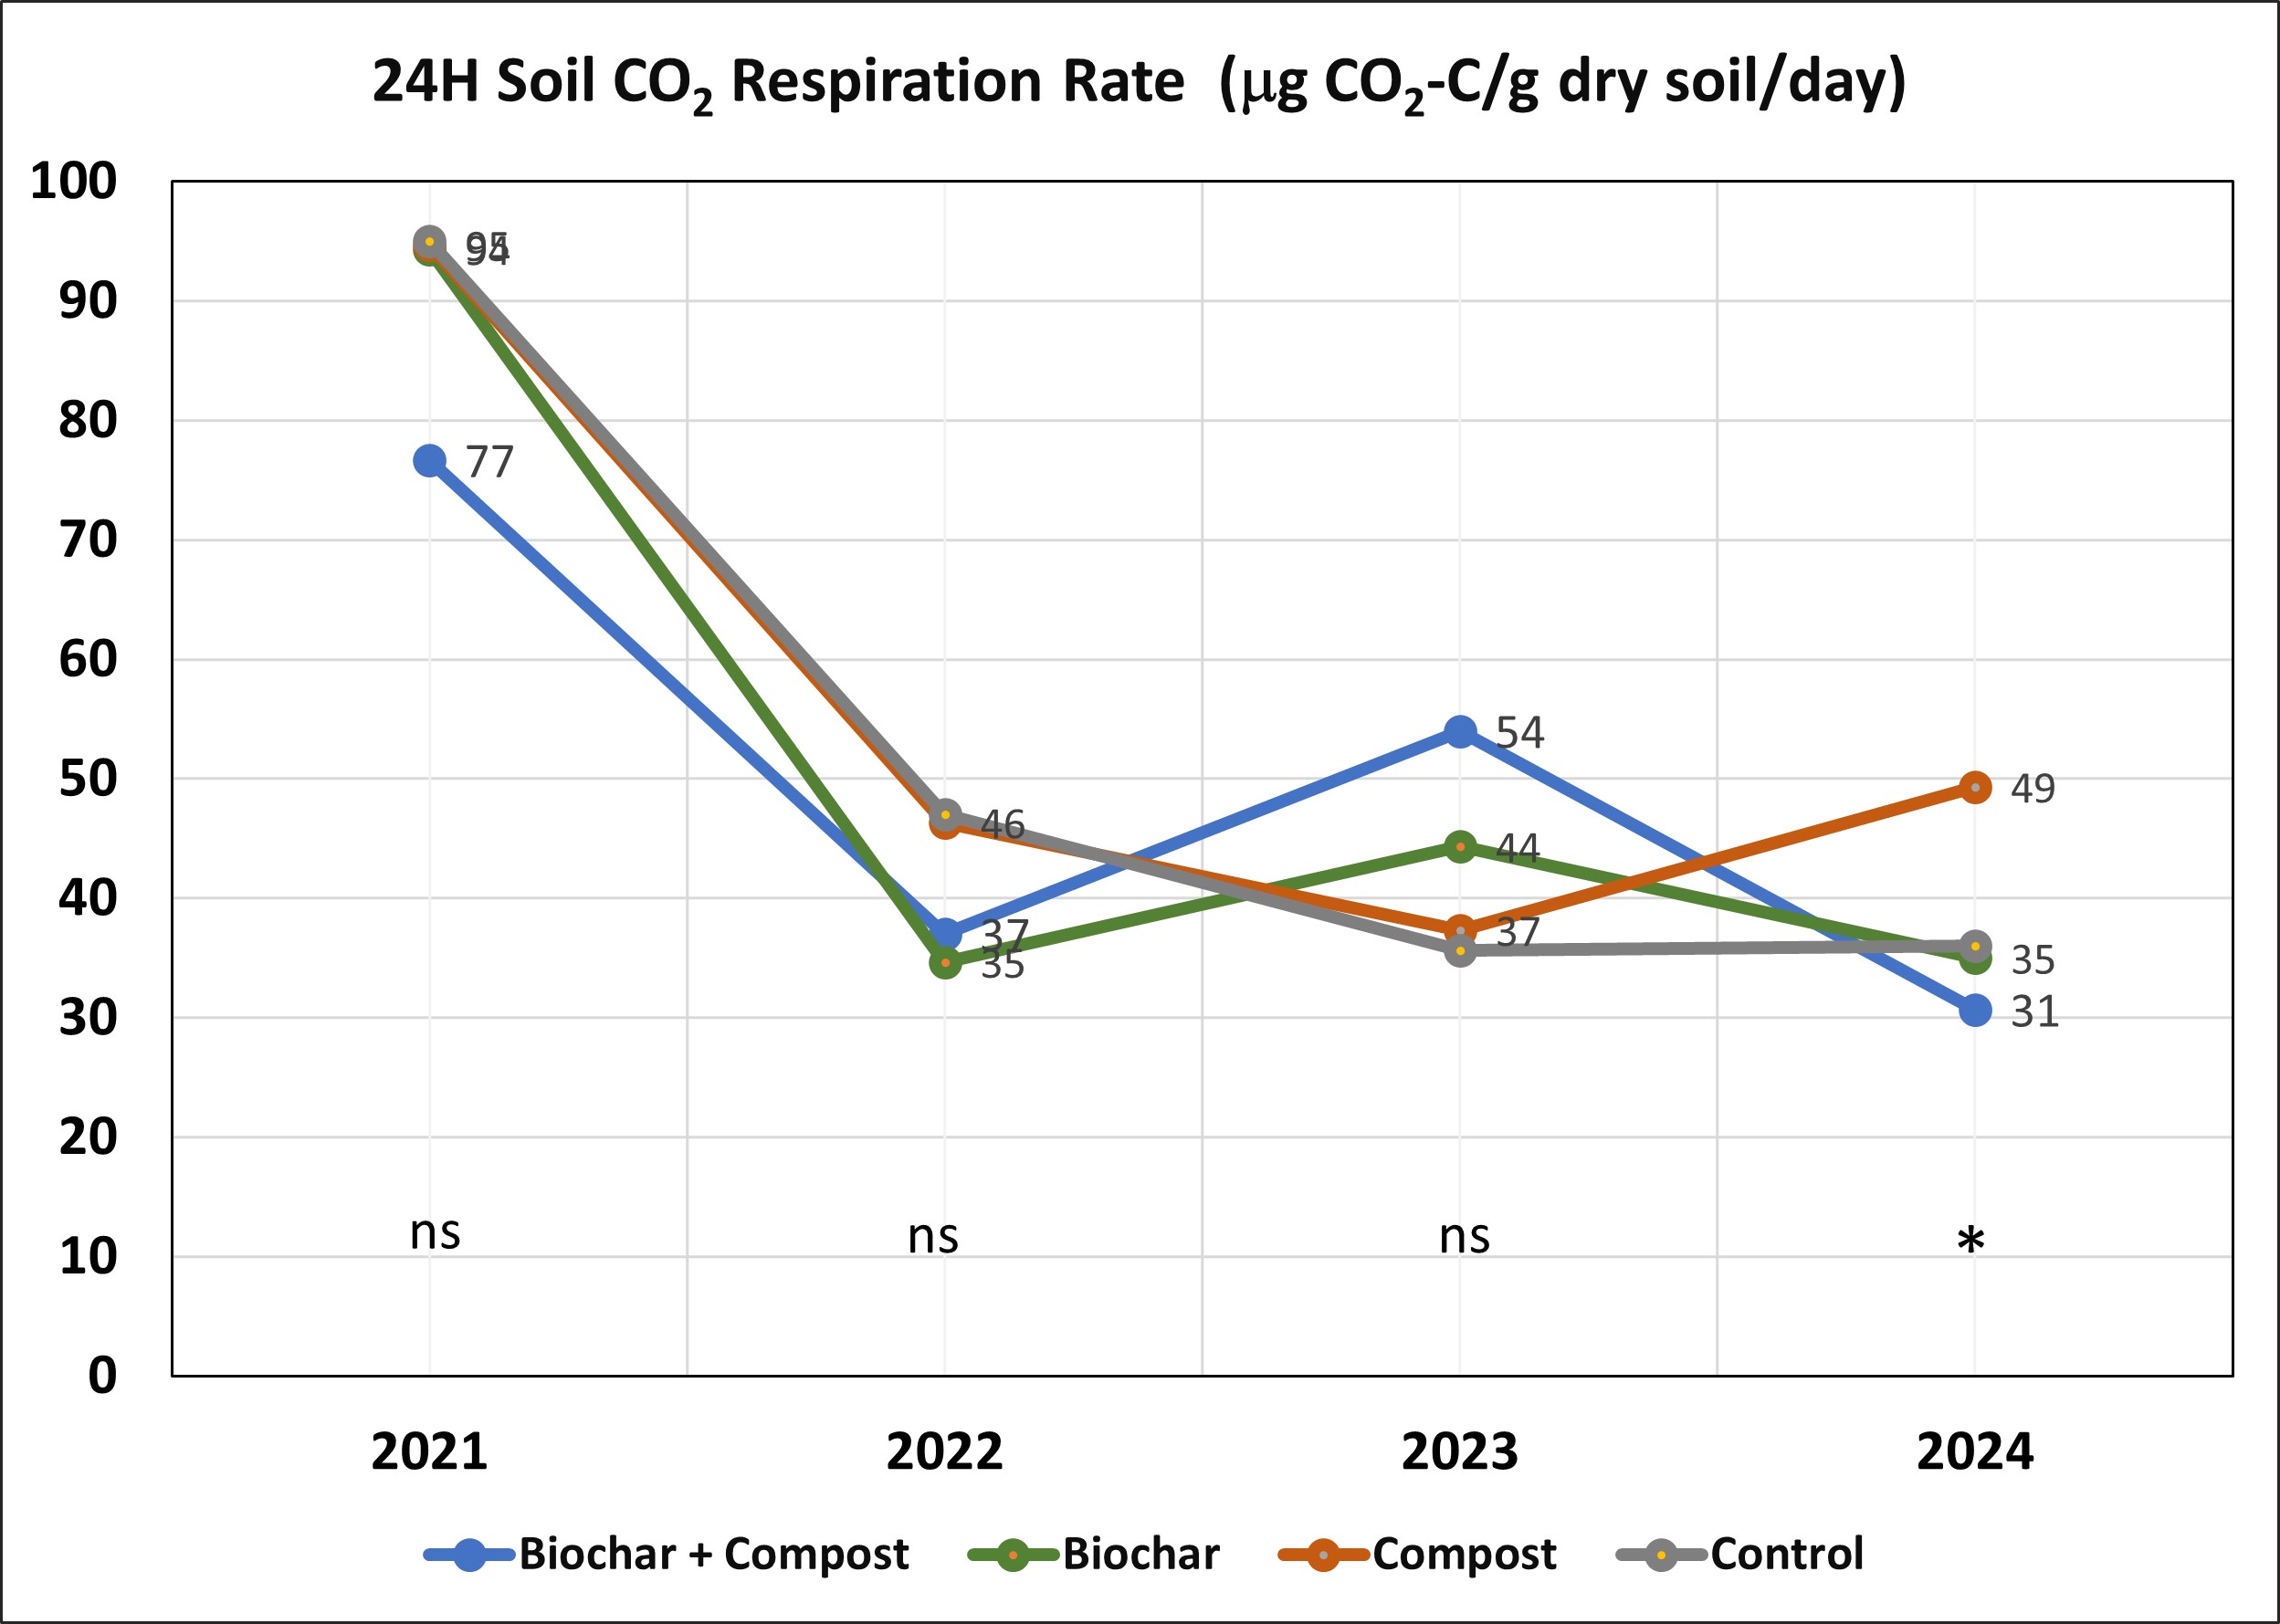
CO2 Respiration 24 hr (µg CO2-C/g dry soil/day) |
31 |
35 |
49 |
36 |
p < 0.05 |
ns |
ns |
ns |
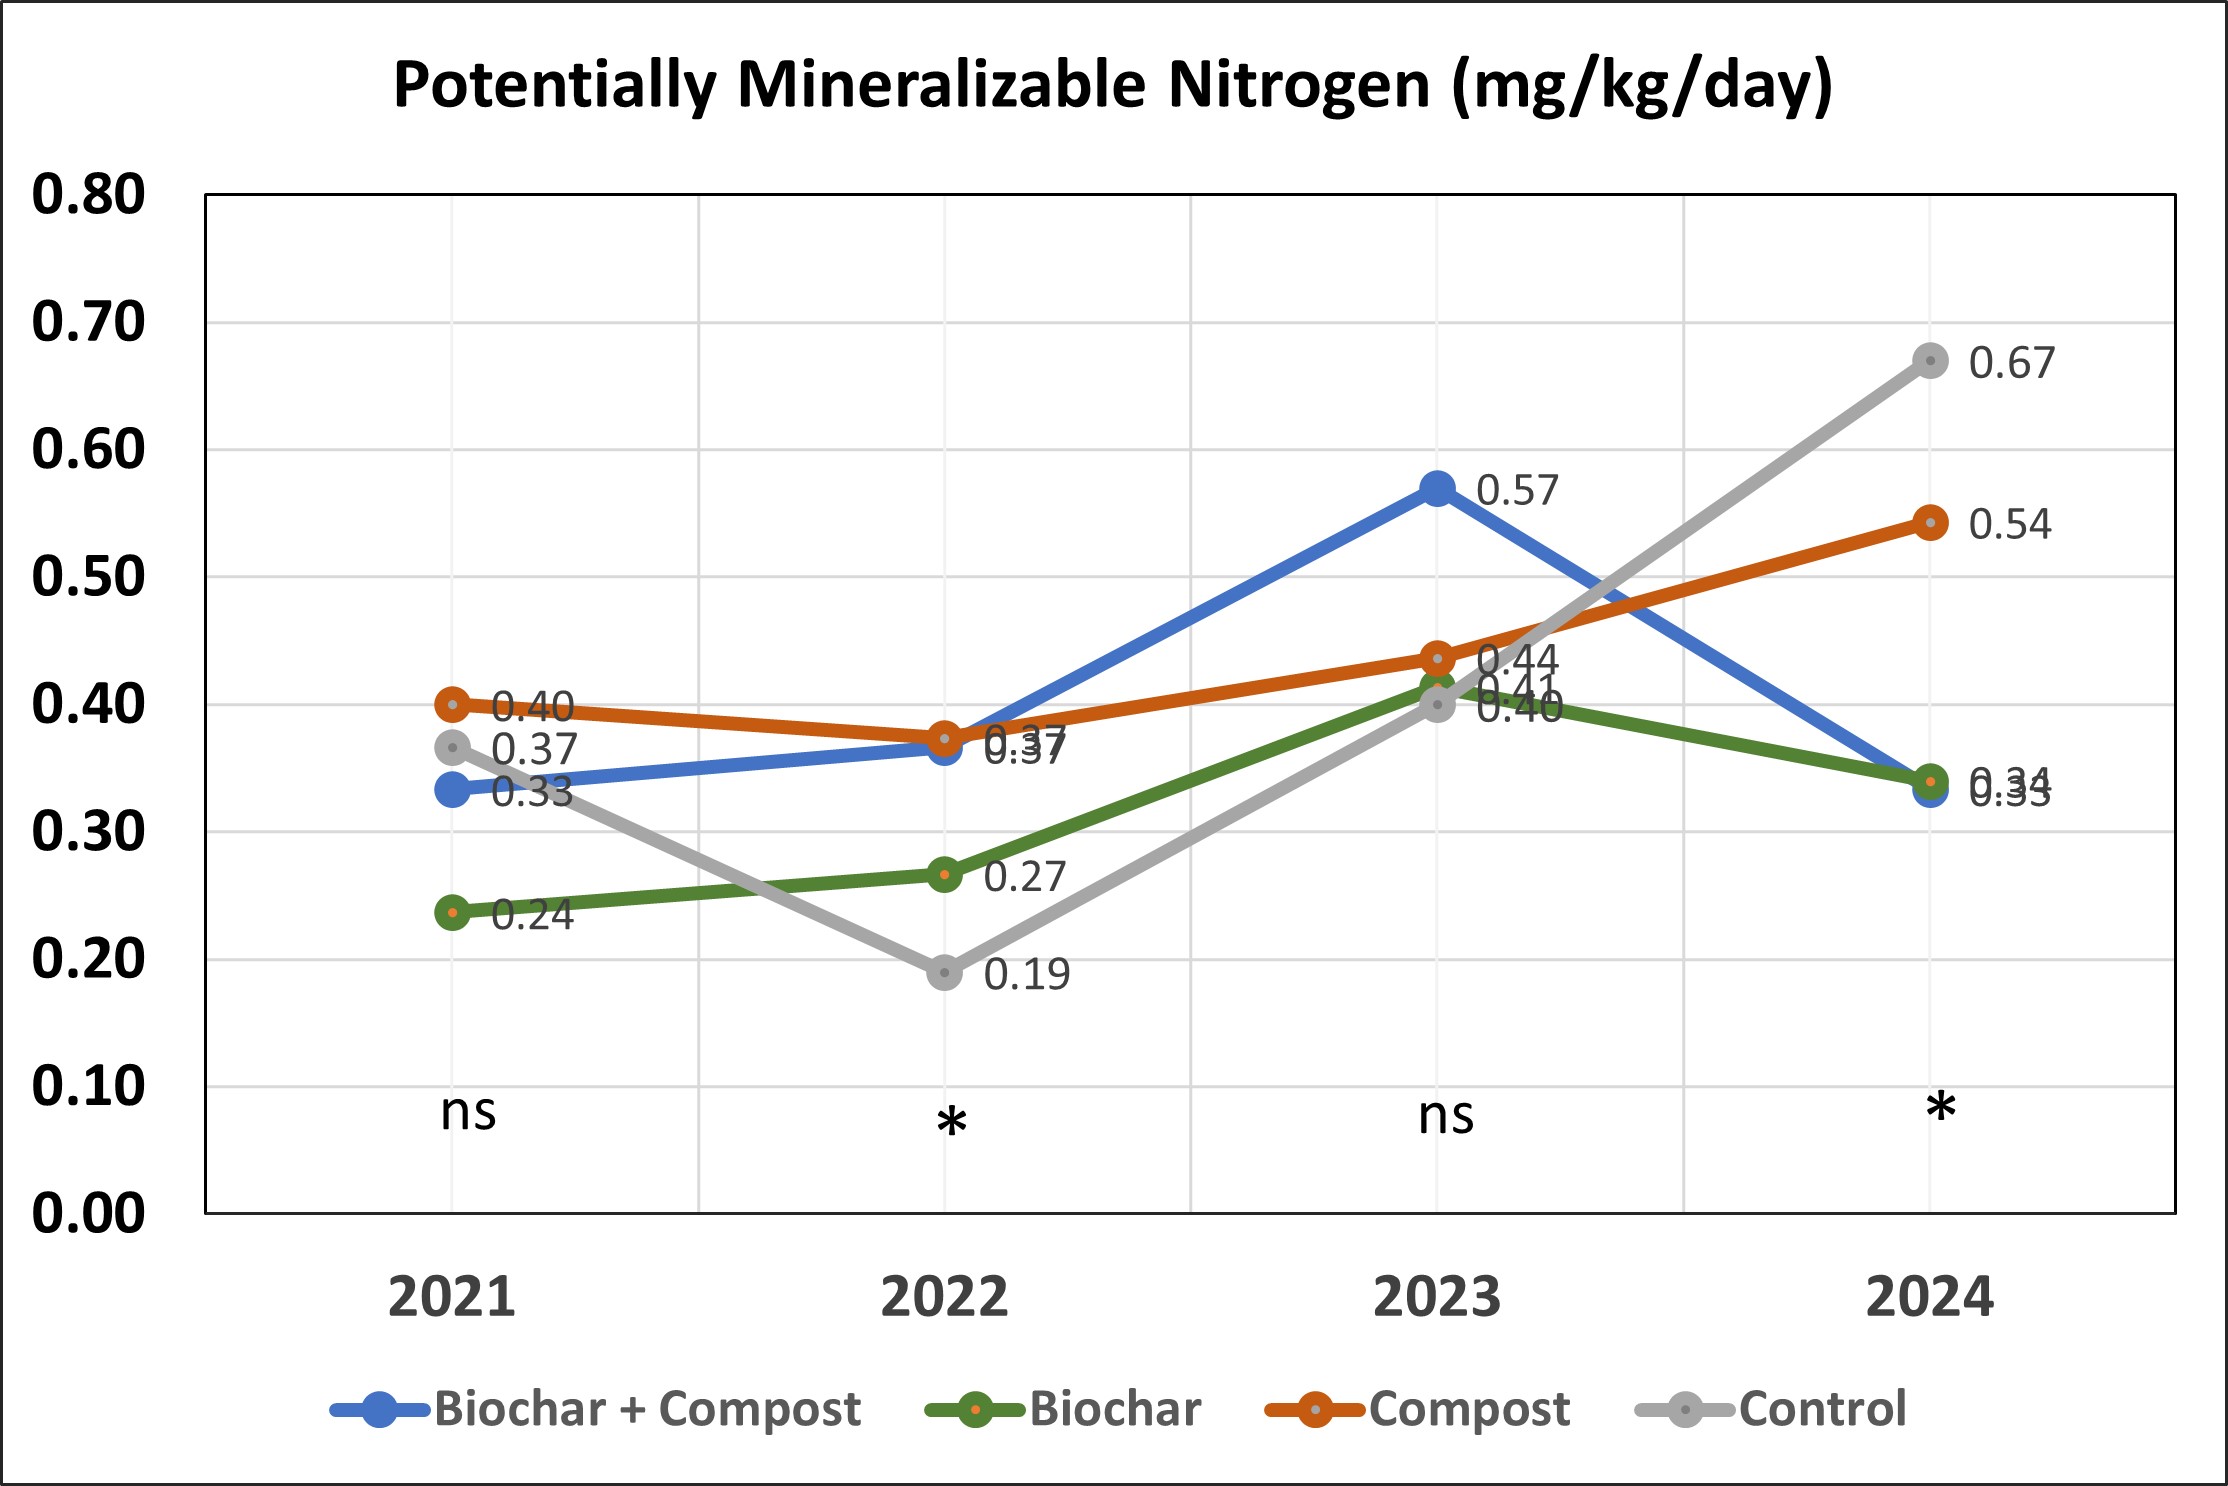
Potentially Mineralizable N (mg N/kg soil/day) |
0.33 |
0.34 |
0.54 |
0.67 |
p < 0.05 |
ns |
ns |
ns |
Comparative Soil Analysis of Site
This site was chosen since it has been in production since 1920 and the continuous farming of this vineyard since then has likely led to degradation of soil organic matter. Previous soil analysis indicated that soil organic matter was low at this site. In 2021, the Napa RCD collected an additional 24 samples from 4 other vineyard sites operated by Treasury Wine Estates for a CASH analysis. Comparison of the results from the other Treasury Wine Estates vineyard sites (Table 4) to the results from trial site that the soil at this trial site has a similar texture but a much lower wet aggregate stability and cation exchange capacity (CEC). The average levels of % carbon, % nitrogen, % organic matter, and active carbon confirmed the suspicion that this site had low levels of carbon (both total percent and active), organic matter, and nitrogen. The applications of both biochar and compost are likely to improve both water aggregate stability and CEC, which are important physical and chemical indicators of soil health. Interestingly, the soil respiration rates were slightly higher from this site compared to the average soil respiration rates form the other vineyard sites tested in 2021.
|
Table 4. Comparison of the CASH soil physical, chemical, and biological parameters at trial site to the averages from 4 other sites in Napa Valley (2021) |
|||
|
|
Trial Site |
Average 4 Napa Sites (2021) |
% of average |
|
% Sand |
35 |
40 |
88% |
|
% Silt |
40 |
36 |
111% |
|
% Clay |
25 |
24 |
104% |
|
Texture |
loam |
loam |
|
|
Water stable aggregates (%) |
38 |
57 |
67% |
|
pH |
7.42 |
7.05 |
105% |
|
EC (dS/m) |
0.21 |
0.18 |
117% |
|
CEC (meq/100g) |
17 |
23 |
74% |
|
Org. Matter (%) |
2.35 |
4.05 |
58% |
|
Total C (%) |
1.18 |
2.02 |
58% |
|
Total N (%) |
0.12 |
0.18 |
67% |
|
C:N ratio |
10 |
11 |
91% |
|
Active C (ppm) |
225 |
348 |
65% |
CO2 Respiration 24 hr (µg CO2-C/g dry soil/day) |
90 |
78 |
115% |
CO2 Respiration 96 hr (µg CO2-C/g dry soil/day) |
54 |
51 |
106% |
Previous trials with biochar application in vineyards have been done on sites with low carbon (0.47%) (Genesio et al, 2015) or organic matter (0.7%) (Sonoma Ecology Center, 2021) to moderate total soil carbon;(1.5 to 2.0%) (Garcia-Jaramillo et al, 2021). This site may have low organic matter relative to the soils in the region, but it is higher than other regions where biochar trials have been carried out in vineyards.
Initial Haney Soil Health Assessments
The results from the pre-application soil health assessment with the Haney test showed little variance in organic matter content (Table 5A). The concentration of OM measured by loss on ignition was roughly 25% higher than the organic matter reported in the CASH (Table 5A), which was determined by multiplying the total carbon (%) by 2. The water extractable organic carbon in these soil samples ranged from 85 ppm to 109 ppm (Table 5A) and these values are about half of the amount of the active carbon levels observed in the CASH (Table 4). Both the active carbon from the CASH protocol and the water extractable carbon concentrations are used to assess the available carbon for microbes in the soil. The average C:N ratio in the water extract was between 11 and 12 for the plots.
|
Table. 5A. Results from Haney Soil test from plots prior to application of biochar and compost (May 2021). |
||||
|
|
Biochar + Compost |
Biochar |
Compost |
Control |
|
Soil pH |
7.47 |
7.40 |
7.47 |
7.43 |
|
EC (dS/m) |
0.13 |
0.14 |
0.15 |
0.16 |
|
H3A Inorganic Nitrogen (ppm) |
1.8 |
1.8 |
2.0 |
2.0 |
|
H3A Total Phosphorus (ppm) |
48 |
40 |
50 |
44 |
|
H3A ICAP Potassium (ppm) |
108 |
86 |
129 |
107 |
|
Organic Matter (% LOI) |
2.90 |
2.83 |
2.93 |
2.90 |
|
Water Extractable Organic C (ppm) |
95 |
109 |
85 |
96 |
|
Water Extractable Organic N (ppm) |
9 |
11 |
8 |
8 |
|
Organic C: N |
11 |
11 |
11 |
12 |
|
24-hr Respiration CO2-C (ppm) |
56 |
76 |
71 |
77 |
|
% Microbial Active Carbon |
59 |
70 |
85 |
80 |
|
Soil Health Score |
8.4 |
10.9 |
9.6 |
10.4 |
The 24-hour respiration rates from the Haney test were slightly lower than the 24-hour respiration rate from the CASH. In both assessments, the 24-hour respiration rate in the biochar + compost plots were lower than in the other plots. The percentage of the water extractable organic carbon (WEOC) that is respired in 24-hours is deemed the “% microbial active carbon” in the Haney test. The % microbial active carbon ranged on average from 59% to 85% (table 6) in the samples prior to treatment applications. There is keen interest in comparing the biochar and compost amendments influences on total carbon, microbial active carbon (active carbon or WEOC) and soil respiration rates in this trial as biochar is considered to be a more stable (Guo 2021, Schulz and Glaser, 2012) form of carbon in soils.
Haney Soil Health Test after application of biochar and compost.
The results from the Haney analysis of samples collected 6 months after application of biochar and compost (Table 5B) showed that the application of compost had a significant effect on soil organic matter, water extractable C, water extractable N, and the organic C:N ration in soil solution, while it did not influence soil pH, soil EC, the soil respiration rate, the percent microbial active C, or the Haney soil health test score. The application of biochar did not have a significant effect on any of the soil parameters in the Haney soil health test six month after application, which was an unexpected result. Interestingly the soil health score, soil respiration rate over 24 hours and percent microbial active carbon decreased for all treatments between sampled taken before application (Table 5A) and six months after application (Table 5B).
|
Table. 5B. Results from Haney Soil test from plots after application of biochar and compost (May 2024). |
||||||||
|
Significance |
||||||||
|
|
Biochar + Compost |
Biochar |
Compost |
Control |
Biochar |
Compost |
Bio x Comp |
Rep |
|
Soil pH |
7.67 |
7.57 |
7.20 |
7.43 |
ns |
ns |
ns |
ns |
|
EC (dS/m) |
0.12 |
0.13 |
0.12 |
0.12 |
ns |
ns |
ns |
ns |
|
H3A Inorganic Nitrogen (ppm) |
4.2 |
4.2 |
4.3 |
5.0 |
ns |
ns |
ns |
ns |
|
H3A Total Phosphorus (ppm) |
40 |
39 |
52 |
40 |
ns |
ns |
ns |
ns |
|
H3A ICAP Potassium (ppm) |
134 |
128 |
169 |
141 |
p<0.05 |
ns |
ns |
ns |
|
Organic Matter (% LOI) |
2.53 |
2.40 |
2.97 |
2.50 |
ns |
ns |
ns |
ns |
|
Water Extractable Organic C (ppm) |
134 |
135 |
140 |
136 |
ns |
ns |
ns |
ns |
|
Water Extractable Organic N (ppm) |
12.3 |
11.8 |
11.3 |
11.8 |
ns |
ns |
ns |
ns |
|
Organic C: N |
14 |
25 |
14 |
17 |
ns |
ns |
ns |
ns |
|
24-hr Respiration CO2-C (ppm) |
39 |
55 |
66 |
62 |
p<0.05 |
ns |
ns |
ns |
|
% Microbial Active Carbon |
29 |
41 |
48 |
46 |
ns |
ns |
ns |
ns |
|
Soil Health Score |
7.8 |
9.4 |
10.5 |
10.1 |
p<0.05 |
ns |
ns |
ns |
Changes in CASH Soil Health Parameters over Years of Trial
Each spring (in May) soil samples were collected from vineyard row middles and sent to the Oregon State University soil health laboratory. Each sample sent was a composite sample from at least 6 subsamples taken from the treatment plots. The total C, total organic matter, total N, permanganate oxidizable C, potentially mineralizable N, soil CO2-2 respiration rate, and wet aggregate stability were determined on individual samples for each plot.
Total Soil Carbon
The levels of total soil C (%) were not statistically significant among samples from treatment plots prior to application of biochar and compost (2021). The average values ranged from 1.10% to 1.27% percent (Figure 6. Total Soil C). Total Soil C declined between 2021 and 2023 in the Control plots from 1.18% to 0.90 %, then increase slightly to 1.05% in 2024 after permanent cover crop was established. There was an overall net loss of total C in control plots of about 0.13%.
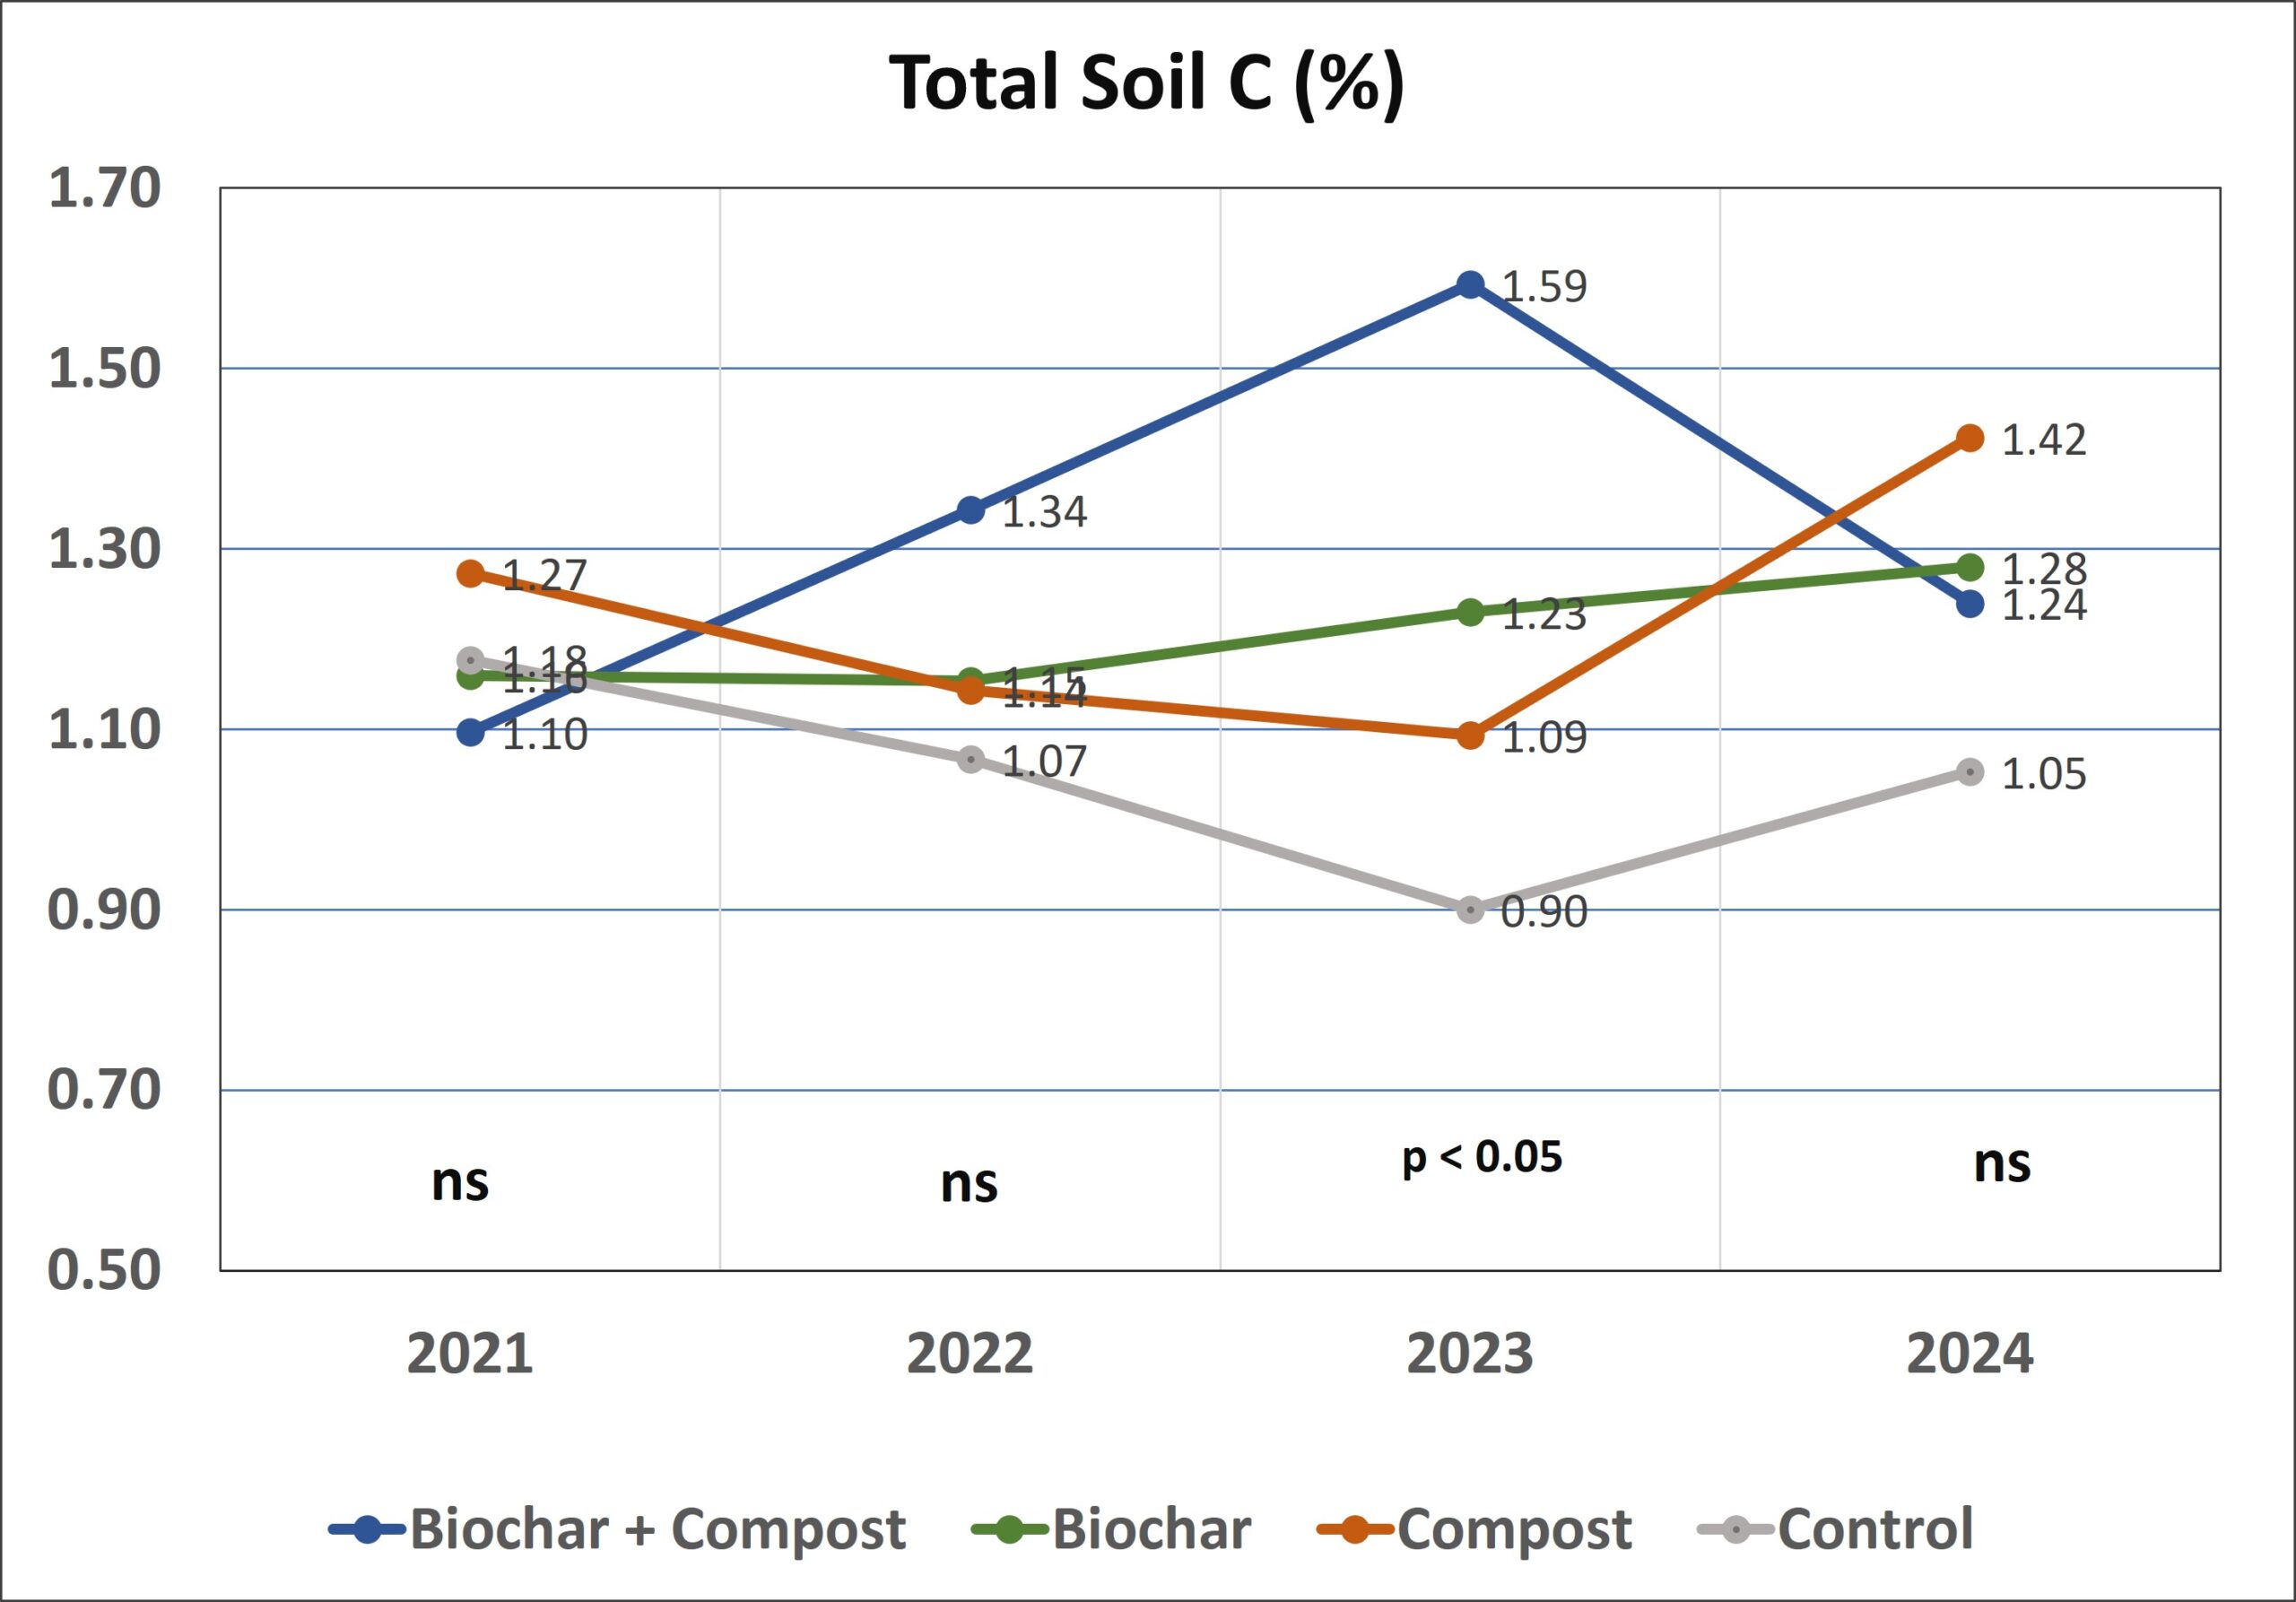
Total soil C was maintained fairly constant in from 2021 to 2024 with application of biochar only. Over this period, there was a slight increase in total soil C from 1.16% to 1.28%. The measured increase of 0.12% in total soil C in the topsoil over three years was about half of the estimated increase of 0.28% from applied C with biochar (Table 2). A measured decrease in total C was also observed in compost only plots between 2021 and 2023 from 1.27% to 1.09%, followed by a significant increase to 1.42% in 2024 after the permanent cover crop had been established. There was an overall observed increase of 0.15% in the plot with only compost, which was less than half the estimated 0.34% increase in topsoil total C for this treatment (Table 2). The total soil C in the biochar-plus-compost treatment plots rose significantly by spring of 2023 going from 1.10 % to 1.59%, which was an increase of 0.49%. This increase was still less than the 0.62% calculated increase in topsoil total C in the combined treatment plots. There was an unexpected decrease in total soil C in the biochar-plus-compost plots in 2024 on the order of 0.25%. By the third-year spring after application of biochar-plus-compost, total soil C was only 0.13% higher than the results from 2021, which was much less than the estimated increase of 0.62% from application of both biochar and compost (Table 2). The total soil C in the Control treatment decreased from the original concentration of 1.18% in 2021 to 1.07% in 2022, and further to 0.9% in 2023 during the years when the row middles were cultivated to reduce competition from weeds. As the vineyard row middles were transitioned to no-till between 2023 and 2024, the total C in control increased by 0.15%.
In summation, at the end of the 3-year study there was an overall increase in total soil C (%) in the biochar treatment (0.12%), compost treatment (0.15%), and biochar-plus-compost treatment (0.14%), while there was a net decrease of 0.12% in the control treatment. Transitioning the vineyard to a no-till system with the establishment of a permanent cover crop seems to have contributed to increases in total carbon across all treatments.
Soil Organic matter
The Oregon State University Soil Health Lab calculates the total soil organic matter in soil by multiplying the total soil C results by two. The biochar and compost applications increased or stabilized soil organic matter over the course of the study, while the soil organic matter of the control decreased, due to tillage in 2022 and 2023, while it increased in 2024 due to conversion to no-till in vineyard avenues (Figure 7). The organic matter content of the soils was significantly higher in biochar and compost treatments by the 2nd year after application (Figure 2). The organic matter content of the soil samples in 2024, however, was not significantly different between treatments.
The soil organic matter content of the vineyard in this trial prior to application of biochar and compost was quite variable, ranging from 2.19 to 2.55 percent, and were not significantly different statistically. The standard deviation was in organic matter of soils prior to application was 0.36%, which was quite large, and it remained so in 2024 (0.43%).
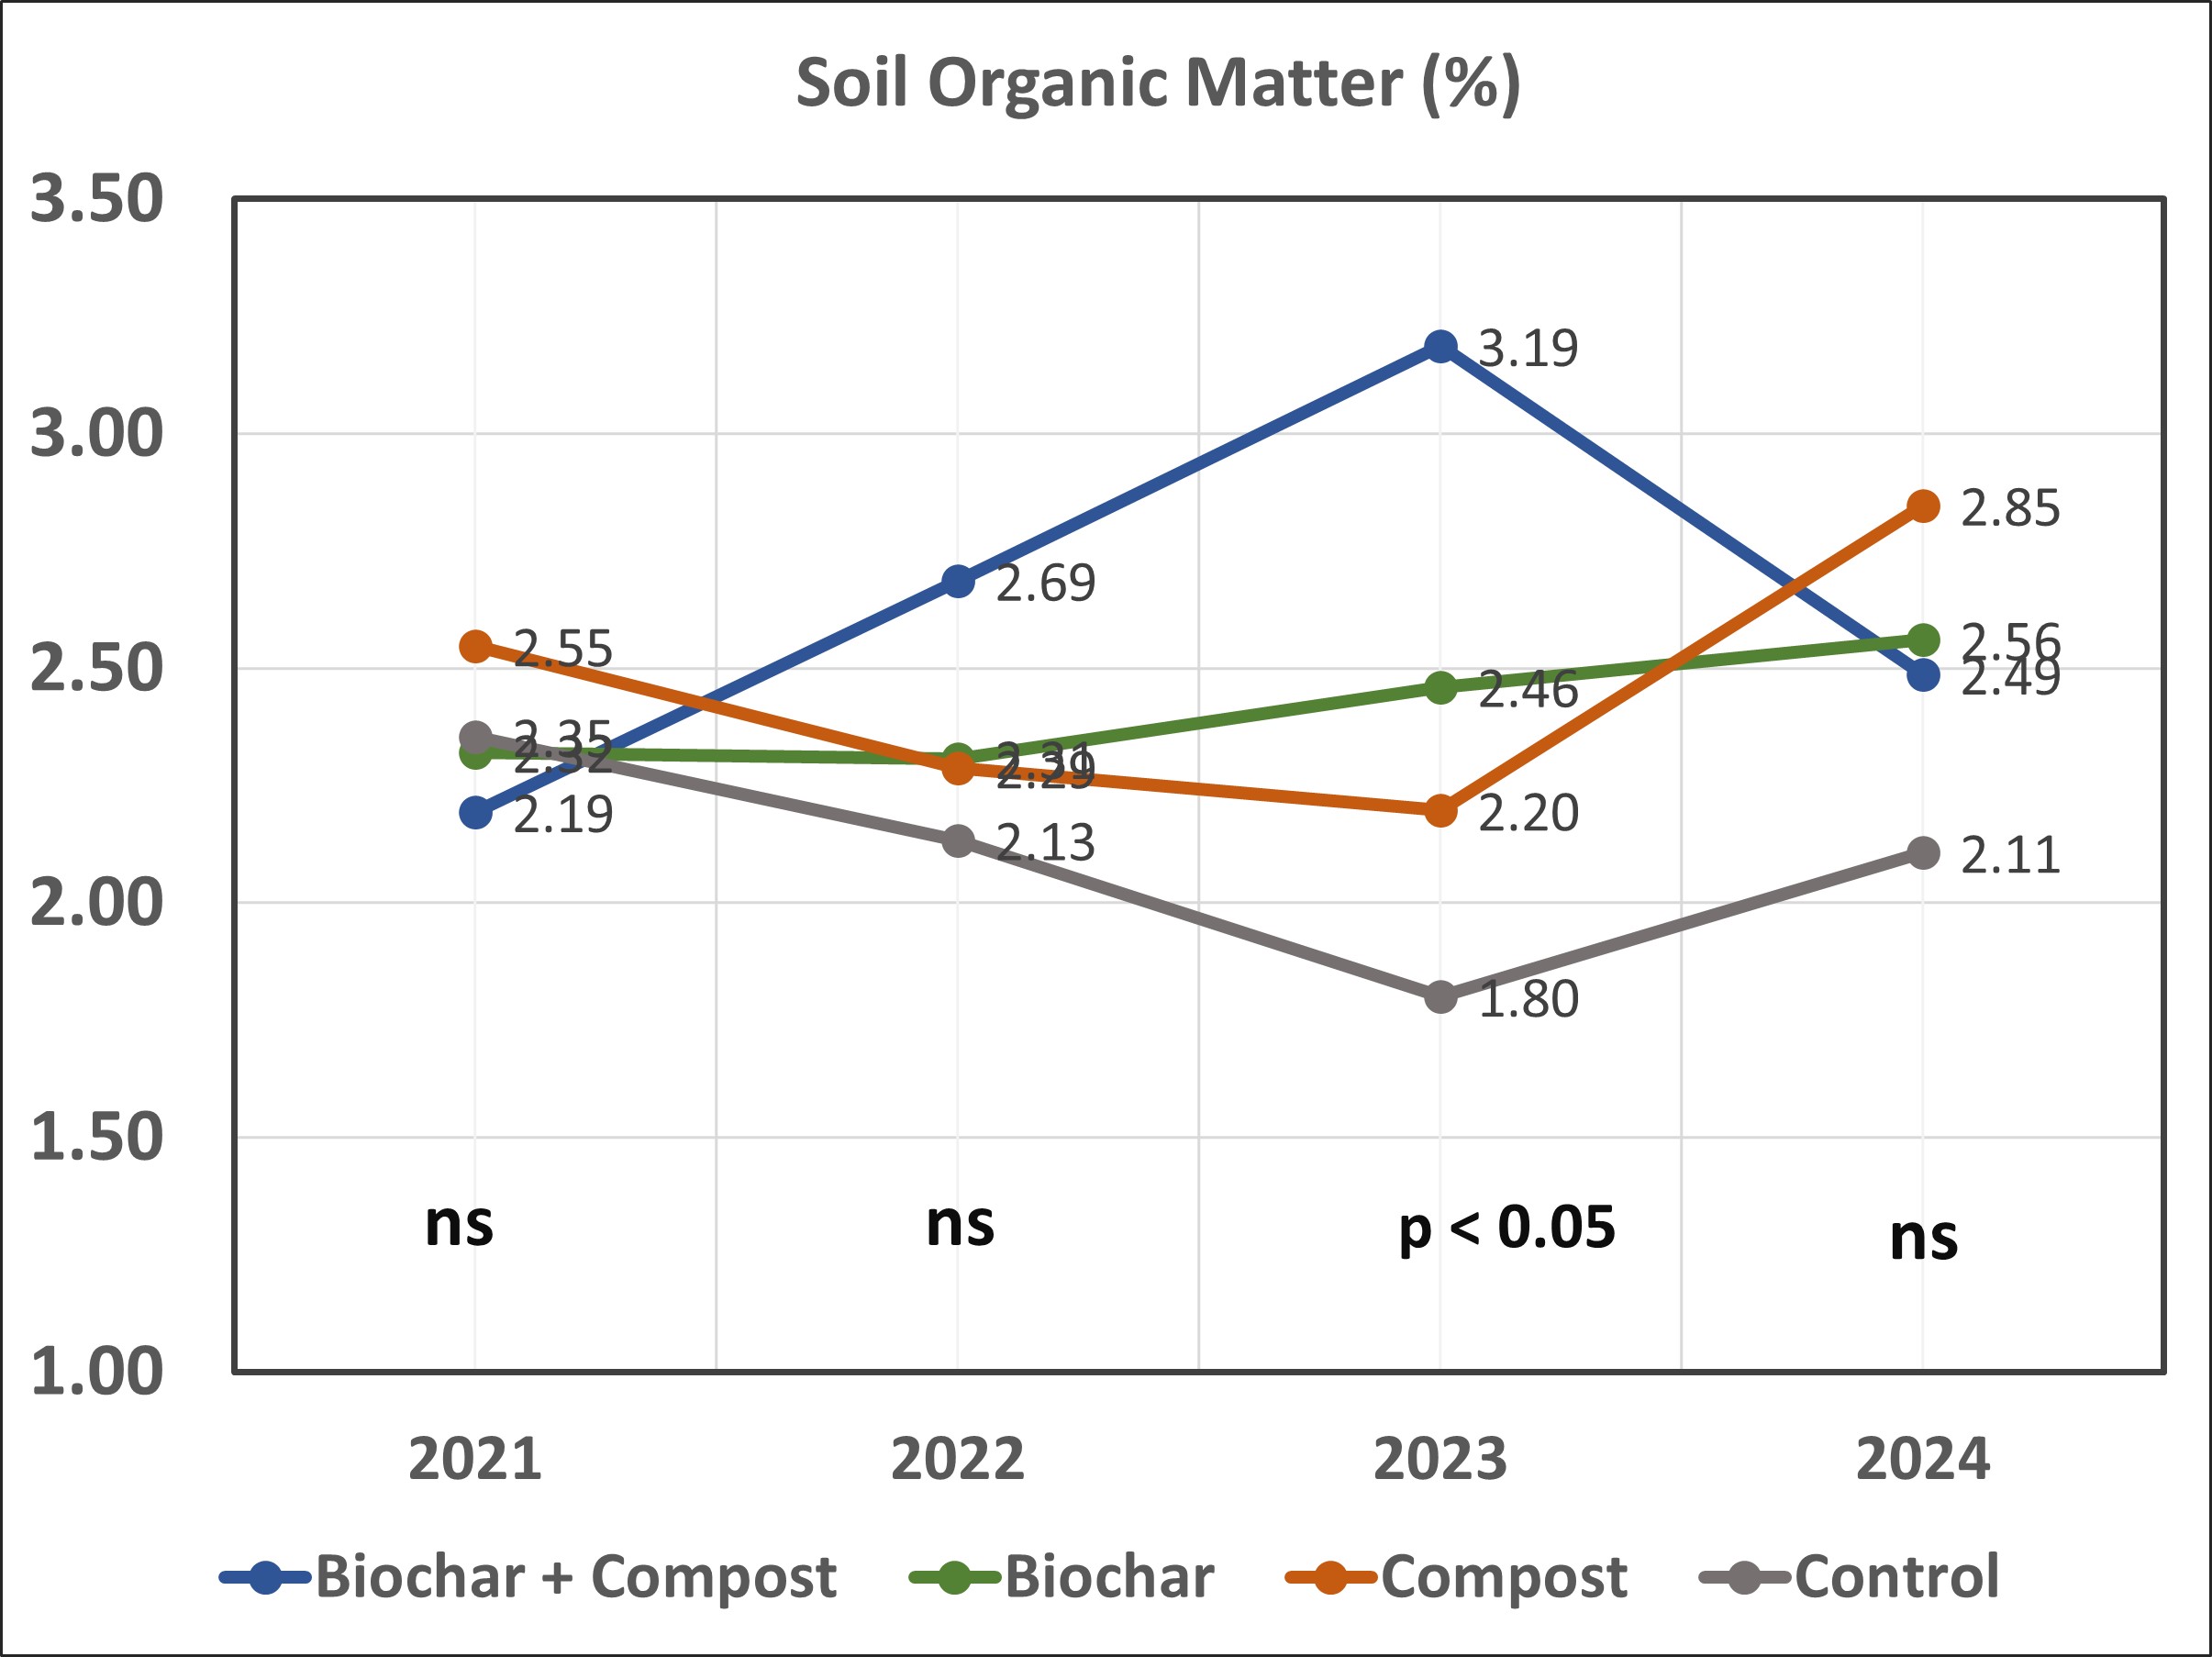
The expected increases in organic matter were 0.56% with biochar application at 10 tons per acre, 0.68% with compost application of 20 tons per acre, and 1.24% with combined biochar and compost application. In 2023, the organic matter of the combined biochar and compost application was 1.39% higher than control, which was slightly higher than expected. Similarly, the soil organic matter of the biochar only plots was 2.46% or 0.66% higher than the soil organic matter in control plots and, again slightly higher than expected. In the compost only plots, the soil organic matter was 0.40% higher than control in 2023, which was lower than expected increase and suggested that some of carbon added in compost treatment was lost. The soil organic matter results from 2024 were not significant statistically, so there appear to be a transient effect of the biochar and compost application on soil organic matter in this trial.
Soil Active Carbon
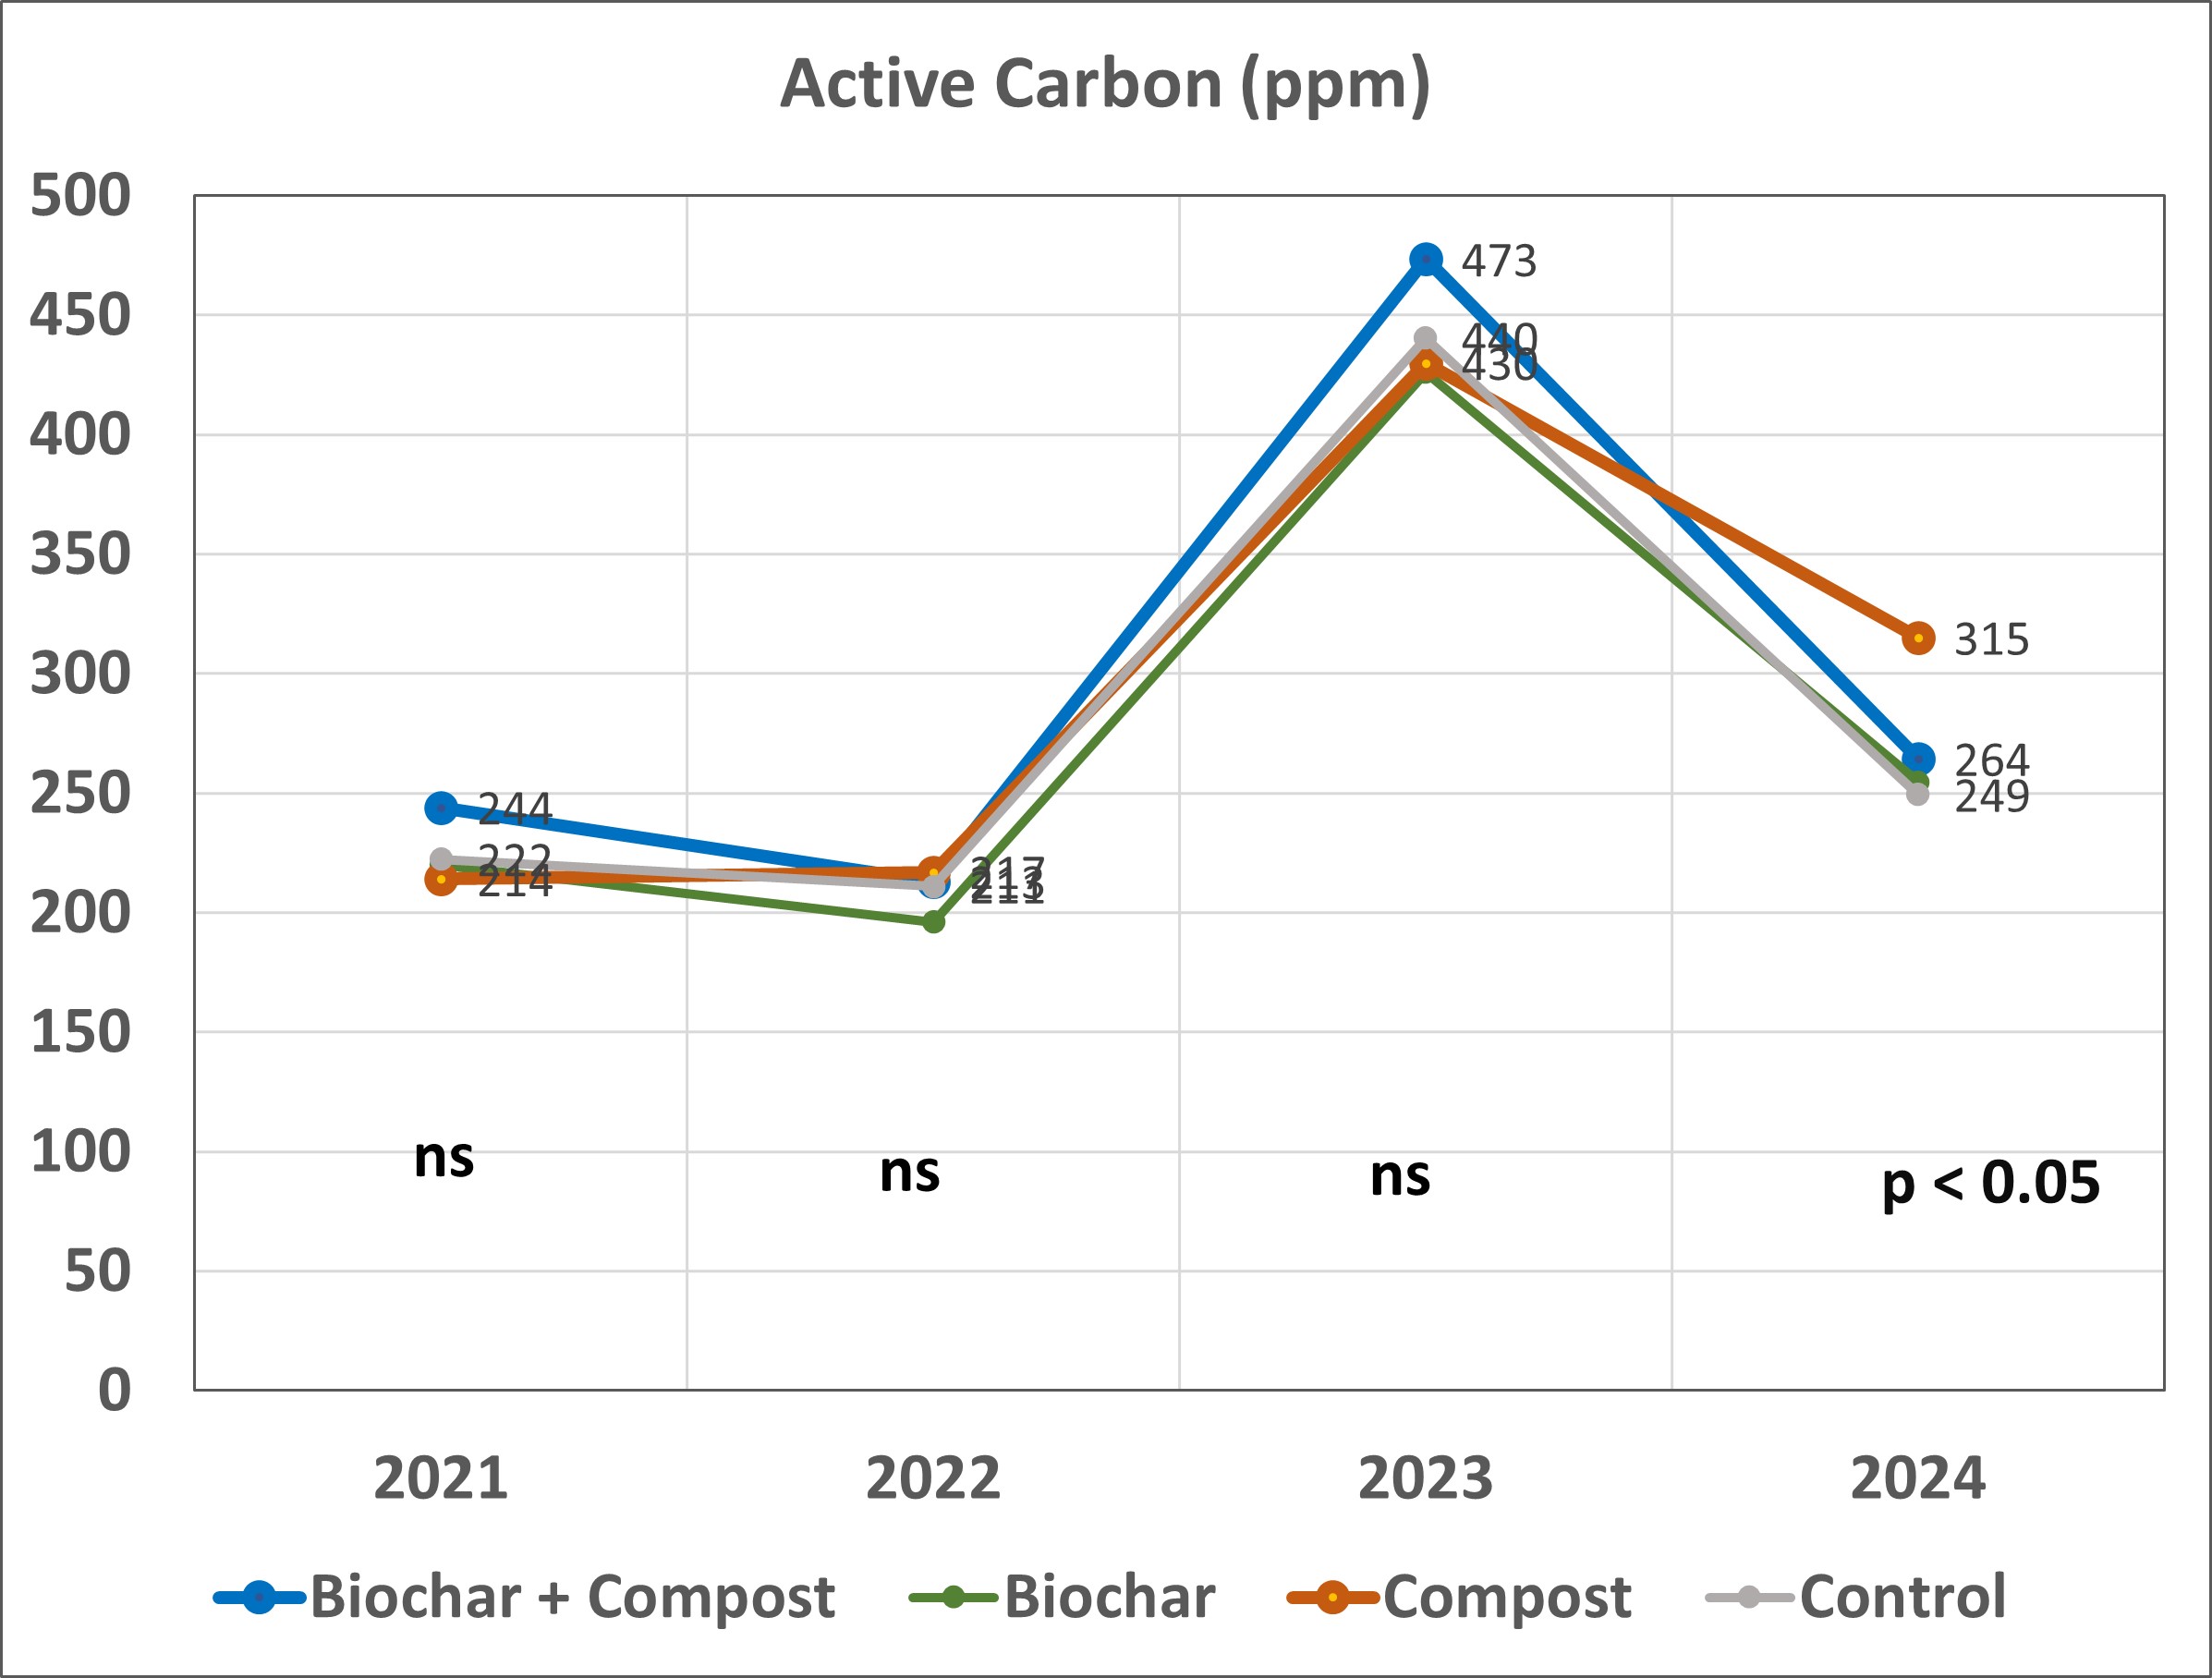
The active carbon, or permanganate oxidizable (POX) carbon levels in the soils did not differ prior to application of compost and biochar (Figure 3). Active carbon levels in vineyards soils have previously been shown to increase with applications of either compost (Wong et al, 2023) or biochar (Garcia-Jaramillo et al, 2021). The active carbon levels in this study did not increase with either application of compost or biochar (Figure 8) until the final year of the study, where active C was significantly higher in compost only plots. This result was unexpected given that total soil C was observed to increase (Figure 6) and previous studies have reported increases due to biochar and compost application.
Total Soil Nitrogen
There was a slight decrease in total soil N for all treatments from 2021 to 2024. In 2023, the soil N content was significantly higher in the biochar and compost treatment plots compared to the Control (Figure 9). Due to the high amount of more than 400 pounds per acre N applied with compost (Table 2), an increase in soil N was expected. The lab results did not show any increase with compost application. A small amount of N (40 pounds per acre) was applied with biochar treatment. Soil N was not measurably increased by biochar application either.
Soil Carbon: Nitrogen Ratio
The ratio of carbon to nitrogen (C:N) in the soils increased over the period of the study in the biochar and compost treatment (Figure 10), while it remained constant in the Control treatment plots. The increase or stability in total soil C along with decrease in total soil N for the biochar and biochar plus compost treatments led to higher C: N ratio in 2023 and 2024.
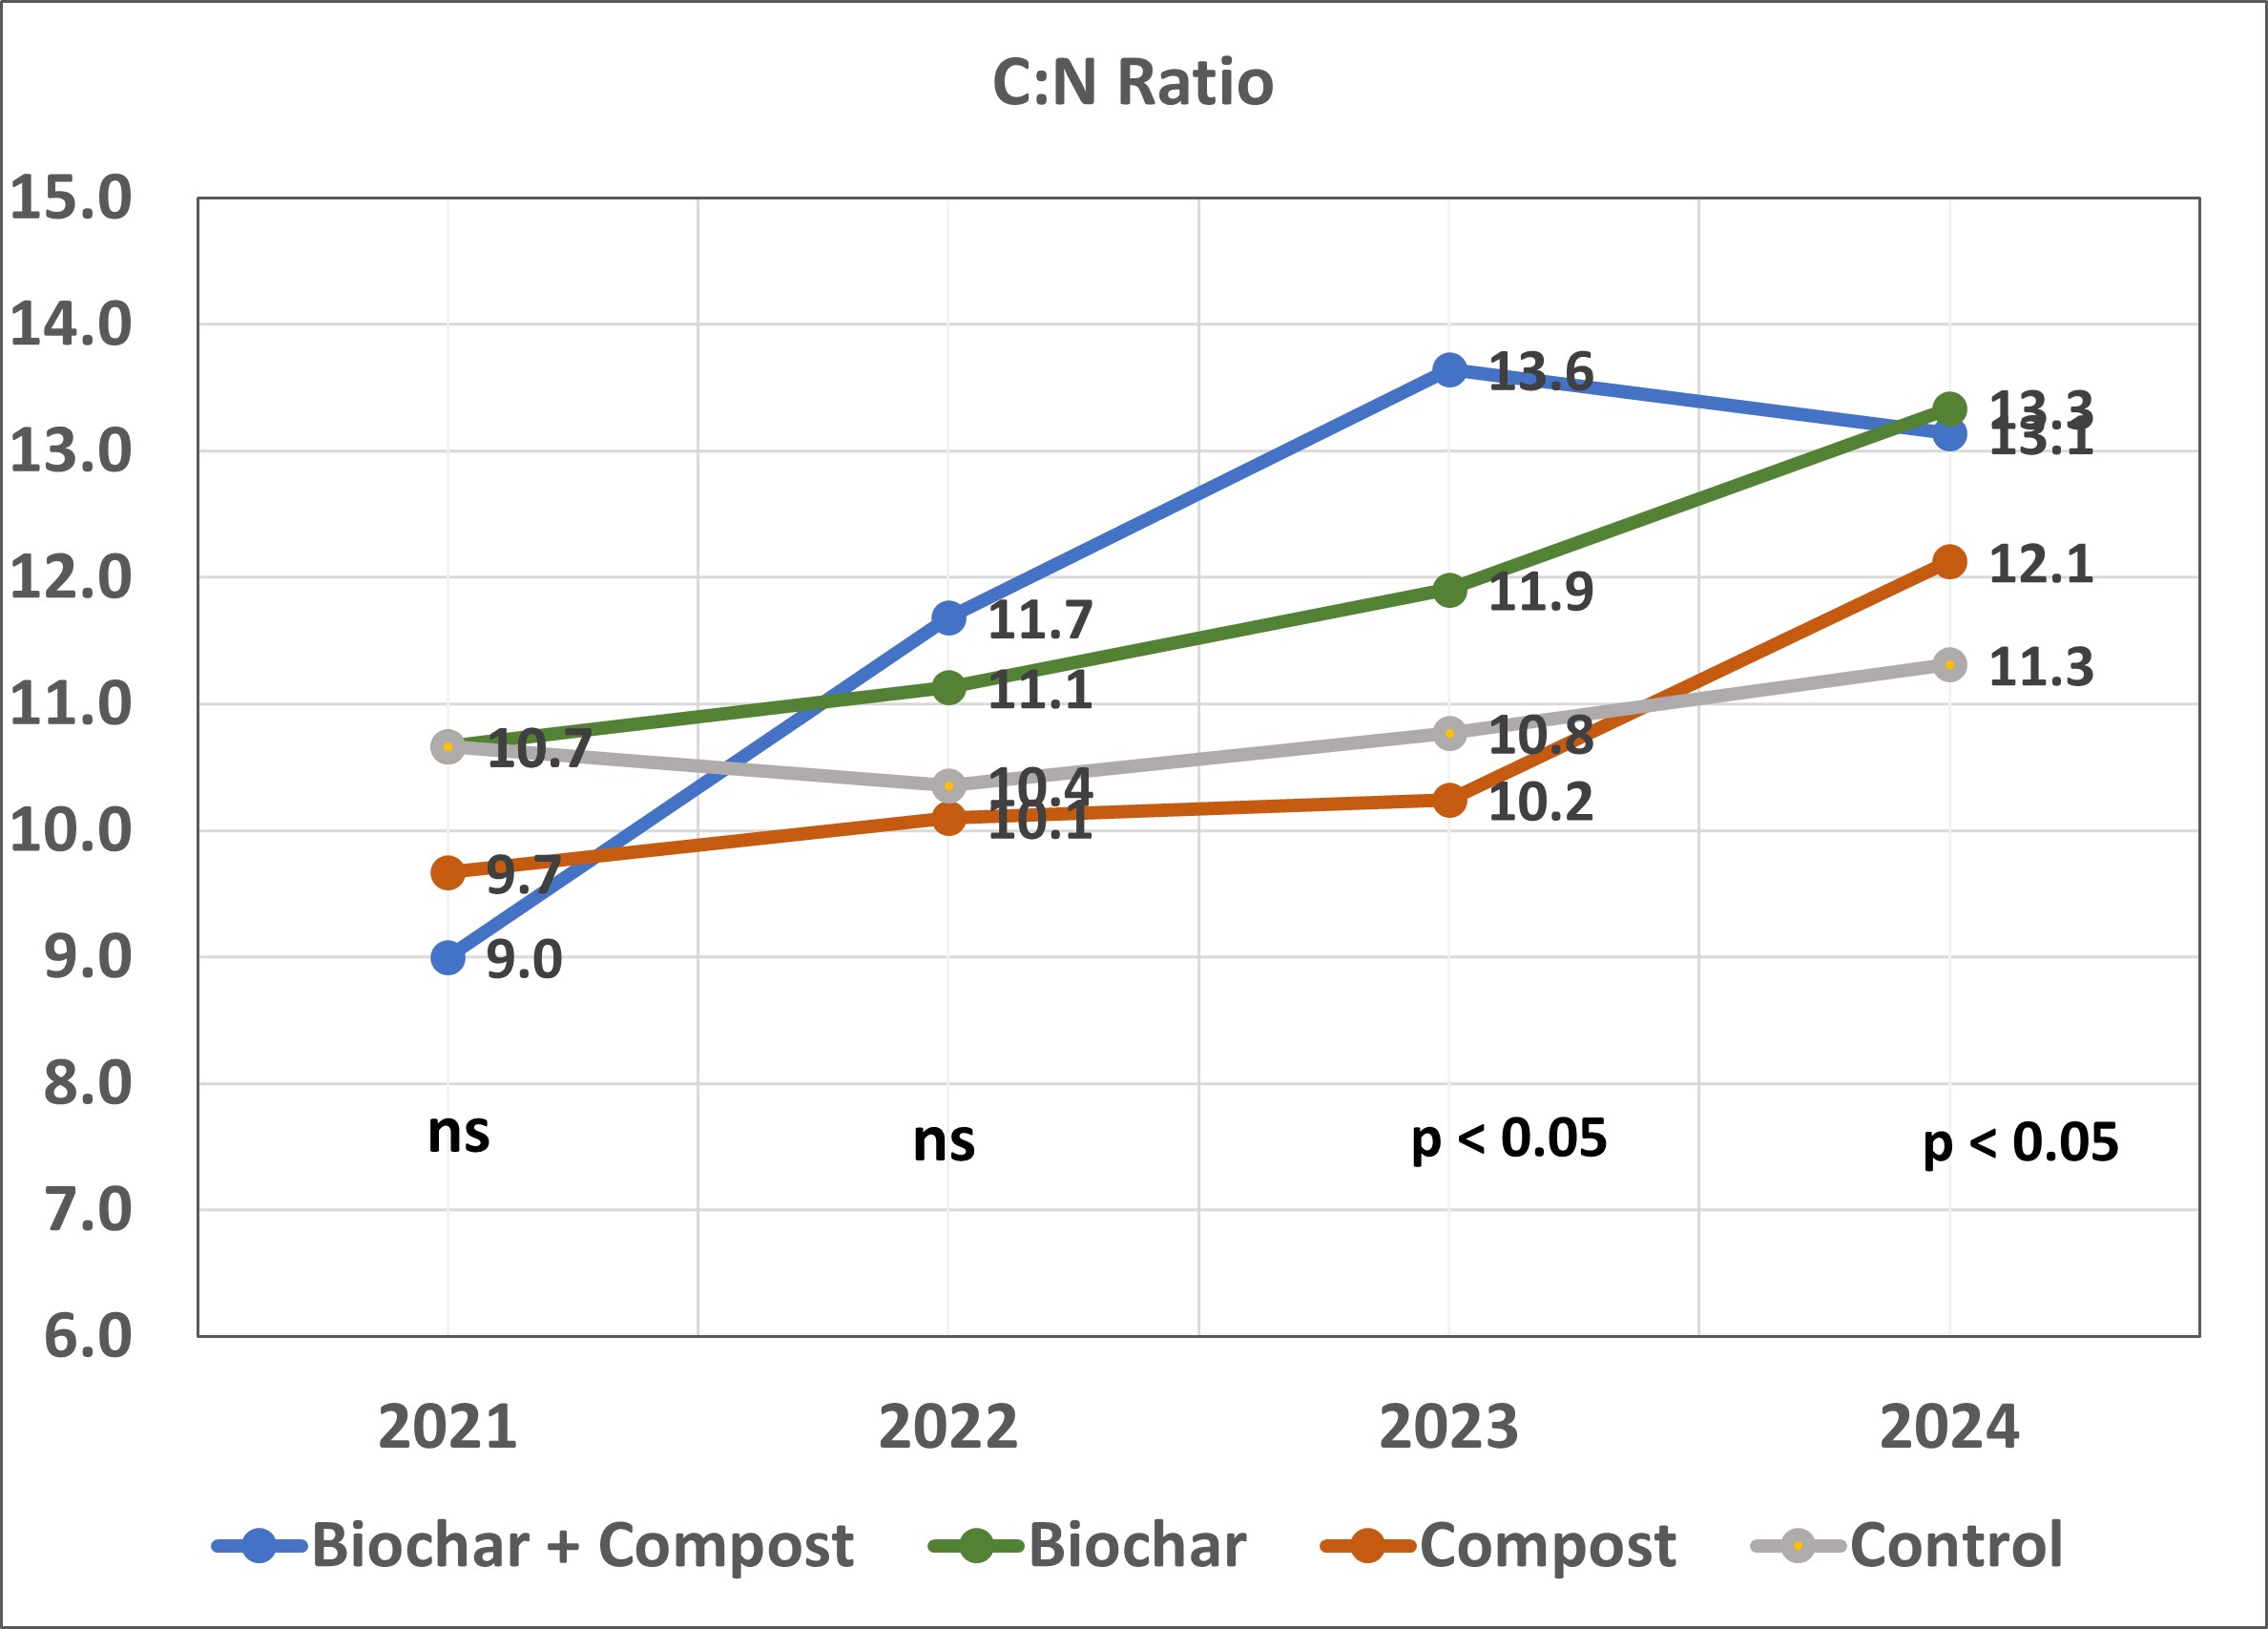
The C:N ratio in soils increased due to biochar (2.6), compost (2.4) and biochar + compost (4.3) treatments to a greater degree than in the Control treatment (0.6) over the course of this study.
Potentially Mineralizable Nitrogen
The potentially mineralizable N content of the soil was increased significantly in 2022 (6 months after application) of compost, but not by biochar (Figure 11). The compost had a ten-fold higher N content than the biochar and this application increased the level of potentially mineralizable N the first year after application. Interestingly, the potentially mineralizable N levels in the soil were not significantly different among treatments 2023. In 2024, the potentially mineralizable N of the biochar and biochar + compost treatments were significantly lower than the Compost treatment and, surprisingly, the Control treatment.
Soil Carbon Dioxide Respiration
The 24-hour soil carbon dioxide respiration rates were not significantly different among treatments at any time during this trial (Figure 7). The soil respiration rate in spring of 2021, before biochar and compost application, were high (>70 mg CO2-C/g dry soil/day) for all treatment plots including Control plots. After application of biochar and compost, the soil respiration rates declined even in Control to between 30 and 50 mg CO2-C/g dry soil/day in 2022 and remained in this range the following two seasons. In 2024, soil respiration was significantly lower in plots that received biochar.
Soil Wet-Aggregate Stability
The soil wet-aggregate stability test is a measurement of erodibility. In this trial the wet aggregate stability between treatments was no different prior to (2021) or immediately after (2022) application of biochar and compost (Figure 8). By the second year after application (2023), the soil wet aggregate stability was significantly higher in soil where biochar was applied. Wet aggregate stability increased greatly between 2023 and 2024 for all treatments as vineyard row middles were transitioned from till to no-till. The results show that no-till practices have potential to increase wet aggregate stability more than biochar or compost applications.
PLANT GROWTH AND NUTRITION
Plant Vegetation Growth prior to Biochar and Compost Applications.
The average NDVI values for treatment plots prior were very similar prior to application of biochar and compost (Table 6A). The results indicate that the grapevine vigor was on average the same for all the plots prior to application of biochar and compost.
|
Table 6A. Average of Normalized Vegetation Index (NDVI) for plots in 2021 prior to application of biochar and compost (August 2021). |
||||
|
Biochar + Compost |
Biochar |
Compost |
Control |
|
|
Average NDVI |
0.516 |
0.528 |
0.539 |
0.529 |
Vine pruning weights.
There were no significant differences in either number of shoots per vine or pruning weights after harvest of 2022 between treatments (Table 6B). These results indicates that the biochar and compost applications did not impact vine growth the first season after application. The average weights of the shoots were not different among treatments either.
|
Table 6B. End of season (2022) pruning weights, shoots per vine, and average shoot weight for biochar and compost treatments of Cabernet Sauvignon in Napa. |
|||
| Treatment | Pruning wt. (kg/vine) | Shoots per vine | Average Shoot Wt (g/shoot) |
| Biochar + Compost | 0.58 | 20.0 | 28.9 |
| Biochar | 0.70 | 20.9 | 33.5 |
| Compost | 0.71 | 21.6 | 32.6 |
| Control | 0.66 | 20.0 | 33.5 |
| Significance | |||
| Biochar | ns | ns | ns |
| Compost | ns | ns | ns |
| Biochar x Compost | ns | ns | ns |
| Rep | ns | ns | ns |
In the second year (2023) after biochar and compost applications, there were again no significant differences in either number of shoots per vine or pruning weights between treatments (Table 6C). The total vine pruning weight and number of shoots per vine increased for all treatments. This vineyard was in process of development from 2002 to 2023. The bilateral cordons were fully extended for the 2023 vintage. The average shoot weights were similar between 2022 to 2023 vintages. The biochar and compost applications did not impact vine growth the first two seasons after application.
| Table 6C. End of season (2023) pruning weights, shoots per vine, and average shoot weight for biochar and compost treatments of Cabernet Sauvignon in Napa. | |||
| Treatment | Pruning wt. (kg/vine) | Shoots per vine | Average shoot weight (g) |
| Biochar + Compost | 1.29 | 34.8 | 37.2 |
| Biochar | 1.25 | 35.6 | 35.1 |
| Compost | 1.12 | 34.2 | 32.7 |
| Control | 1.08 | 35.6 | 30.3 |
| Significance | |||
| Biochar | ns | ns | ns |
| Compost | ns | ns | ns |
| Biochar x Compost | ns | ns | ns |
| Rep | ns | ns | ns |
Plant Nutrient and Water Status Assessments.
Bloom petiole samples were collected by Treasury Wine Estates viticulture team in late May 2021. Approximately 25 petioles were taken from basal leaves opposite the flower clusters per plot. The samples were sent to a commercial lab (A & L Western Laboratories in Modesto, CA) for analysis. The results are provided in table 7A.
|
Table 7A. Grapevine bloom petiole nutrient contents in May 2021 prior to application of biochar and compost. |
||||
|
|
Biochar + Compost |
Biochar |
Compost |
Control |
|
Petiole N (%) |
1.02 |
1.03 |
0.98 |
1.07 |
|
Petiole P (%) |
0.31 |
0.32 |
0.33 |
0.31 |
|
Petiole K (%) |
3.13 |
3.12 |
3.07 |
3.12 |
|
Petiole Mg (%) |
0.79 |
0.79 |
0.69 |
0.74 |
|
Petiole Ca (%) |
2.04 |
2.11 |
2.03 |
2.08 |
|
Petiole B (ppm) |
42 |
43 |
42 |
44 |
|
Petiole Zn (ppm) |
51 |
52 |
49 |
50 |
There were no appreciable differences in plant nutrient status between the plots prior to treatment in any major nutrient (NPK) or micronutrient. Furthermore, the levels of N, P, and K encountered were in the normal to optimal range. The levels of Mg and Ca were slightly elevated, yet they are not a concern. And the bloom petiole content of two critical micronutrients for grapevines (B and Zn) were in the normal to optimal range according to guidelines from local analytical lab. Based upon petiole analysis in 2021 there does not appear to be any nutrient deficiencies at this site that would require nutrient additions.
Samples of basal leaf blades (opposite clusters) were taken in late May of 2022 (6 months after application). There were no significant differences in macronutrient status (NPK) of vines due to treatments (Table 7B). In contrast, we observed significantly lower blade Al, Na, S, and Zn levels at bloom in treatments with biochar. The results suggest that there may be some benefit to applying biochar in low pH soils, where Al toxicity is a concern or on sodic soils where sodium levels are high. The soil pH in this trial, however, was neutral to slightly alkaline and so there was little concern of Al toxicity. The levels of Na in the leaf blades at bloom at this site were not elevated either.
|
Table 7B. Grapevine bloom leaf blade nutrient contents in May 2022 after application of biochar and compost. |
|||||||
|
|
|
|
|
|
Significance |
||
|
|
Biochar + Compost |
Biochar |
Compost |
Control |
Biochar |
Compost |
Bio x Comp |
|
Blade N (%) |
3.62 |
3.68 |
3.62 |
3.67 |
ns |
ns |
ns |
|
Blade P (%) |
0.26 |
0.27 |
0.26 |
0.27 |
ns |
ns |
ns |
|
Blade K (%) |
1.22 |
1.16 |
1.19 |
1.16 |
ns |
ns |
ns |
|
Blade Al (ppm) |
108 |
114 |
131 |
125 |
p<0.05 |
ns |
ns |
|
Blade S (%) |
0.21 |
0.22 |
0.25 |
0.24 |
p<0.05 |
ns |
ns |
|
Blade Na (%) |
0.01 |
0.01 |
0.02 |
0.02 |
p<0.05 |
ns |
ns |
|
Blade B (ppm) |
58 |
57 |
70 |
70 |
ns |
ns |
ns |
|
Blade Zn (ppm) |
90 |
86 |
133 |
128 |
p<0.05 |
ns |
ns |
Samples of basal leaf blades (opposite clusters) were taken again in May 2023 (18 months after application). There were no significant differences in macronutrient status (NPK) of vines due to treatments (Table 7C). In contrast to the observed results in 2022, there was no significantly lower blade Al, Na, S, and Zn levels at bloom in treatments with biochar in 2023. The impact of the biochar application on leaf blade micronutrient status was temporary. The levels of Al and Na in the leaf blades at bloom at this site were not elevated and did not represent any toxicity issues.
|
Table 7C. Grapevine bloom leaf blade nutrient contents in May 2023 after application of biochar and compost. |
|||||||
|
|
|
|
|
|
Significance |
||
|
|
Biochar + Compost |
Biochar |
Compost |
Control |
Biochar |
Compost |
Bio x Comp |
|
Blade N (%) |
3.35 |
3.45 |
3.28 |
3.29 |
ns |
ns |
ns |
|
Blade P (%) |
0.23 |
0.24 |
0.21 |
0.22 |
ns |
ns |
ns |
|
Blade K (%) |
1.04 |
0.96 |
0.92 |
0.95 |
ns |
ns |
ns |
|
Blade Al (ppm) |
168 |
158 |
162 |
143 |
ns |
ns |
ns |
|
Blade S (%) |
0.21 |
0.22 |
0.25 |
0.24 |
ns |
ns |
ns |
|
Blade Na (%) |
0.01 |
0.01 |
0.01 |
0.01 |
ns |
ns |
ns |
|
Blade B (ppm) |
45 |
44 |
43 |
42 |
ns |
ns |
ns |
|
Blade Zn (ppm) |
267 |
261 |
258 |
266 |
ns |
ns |
ns |
Bloom petioles samples were collected in May 2024 (30 months after applications). The bloom petiole N or P levels were not impacted by either biochar or compost application (Table 7D). The bloom petiole levels of N in 2024 was similar to the levels in 2021 (Table 7A), while bloom petiole P in 2024 was lower for all treatments. Bloom petiole K in 2024 was significantly higher in plots where compost was applied; the biochar application did not affect petiole K. Overall bloom petiole K declined between 2021 and 2024 for the Control and Biochar treatments. Bloom petiole Mg and Ca did not differ among treatments in 2o24 and were similar to the 2021 bloom petiole Mg and Ca levels (Table 7A). Bloom petiole B and Zn did not differ in 2024 among treatments as well (Table 7D). The biochar and compost applications in 2021 did not have a lasting impact on vine nutrient status, with possible exception of increase bloom K with compost application.
|
Table 7D. Grapevine bloom petiole nutrient contents in May 2024 three years after application of biochar and compost. |
|||||||
|
|
Biochar + Compost |
Biochar |
Compost |
Control |
Biochar |
Compost |
Bio x Comp |
|
Petiole N (%) |
1.07 |
1.11 |
1.11 |
1.05 |
ns |
ns |
ns |
|
Petiole P (%) |
0.15 |
0.15 |
0.14 |
0.13 |
ns |
ns |
ns |
|
Petiole K (%) |
2.94 |
2.63 |
3.12 |
2.72 |
ns |
p < 0.05 |
ns |
|
Petiole Mg (%) |
0.88 |
0.85 |
0.82 |
0.86 |
ns |
ns |
ns |
|
Petiole Ca (%) |
2.05 |
2.04 |
2.02 |
2.07 |
ns |
ns |
ns |
|
Petiole B (ppm) |
34 |
33 |
32 |
31 |
ns |
ns |
ns |
|
Petiole Zn (ppm) |
31 |
29 |
32 |
31 |
ns |
ns |
ns |
Vine Water Status
Midday leaf water potential data collected prior to veraison on June 30th and during veraison on July 21 (Table 8A). There was no statistically significant effect of either biochar or compost application on vine water status during the summer of 2022. Since the application of biochar may improve soil water holding capacity, there was some anticipation that vine water status may be affected by this treatment. However, there was no indication that it had any impact early in the season. The midday leaf water potential values observed indicated that the grapevines in all treatment were not under any water stress early in the season. The lower Brix observed in Compost and Biochar treatments in 2022 was possibly related to late season differences in vine water status, however there were no leaf water potential measurements taken close to harvest that year.
| Table 8A. Midday leaf water potential (- bars) of grapevines from biochar and compost plots compared to control during 2022 season. |
|||||
Treatment |
Pre-Veraison | Veraison | Post-Veraison | ||
| June 30 | -- | July 21 | -- | -- | |
| Biochar + compost | 9.8 | 9.4 | |||
| Biochar | 11.2 | 9.7 | |||
| Compost | 11.1 | 9.5 | |||
| Control | 10.0 | 9.3 | |||
| Significance | |||||
| Biochar | ns | ns | |||
| Compost | ns | ns | |||
| Biochar x Compost | ns | ns | |||
| Rep | ns | ns | |||
There was no statistically significant effect of either biochar or compost application on vine water status during the 2023 growing season. Midday leaf water potential data collected prior to veraison, during veraison, or after veraison showed no differences among treatments (Table 8B). The midday leaf water potential values observed in the second year indicated that the grapevines in all treatment were subjected to moderate water stress early in the 2023 season (pre-veraison) and high-water stress after veraison in all treatments.
| Table 8B. Midday leaf water potential (-bars) of grapevines from biochar and compost plots compared to control during 2023 season. |
|||||
Treatment |
Pre-Veraison | Veraison | Post-Veraison | ||
| July 20 | Aug 2 | Aug 17 | Aug 31 | Sept 7 | |
| Biochar + compost | 12.4 | 14.0 | 14.3 | 16.0 | 13.5 |
| Biochar | 12.5 | 13.5 | 14.7 | 15.1 | 14.0 |
| Compost | 12.8 | 14.0 | 14.5 | 16.1 | 14.8 |
| Control | 13.0 | 14.0 | 15.3 | 15.6 | 15.1 |
| Significance | |||||
| Biochar | ns | ns | ns | ns | ns |
| Compost | ns | ns | ns | ns | ns |
| Biochar x Compost | ns | ns | ns | ns | ns |
| Rep | ns | ns | ns | ns | ns |
Early season vine water deficits can lead to reduced vine vigor or growth, as these are typically impacted when midday leaf water potentials show moderate stress (-12 bars). Grapevine yield, in particular berry weight or cluster weight, can potentially be reduced by vine water deficits any time during season. The lack of any measured vine water status impacts from biochar or compost application in this trial are supported by the lack of observed vine vigor differences or average shoot weight (Tables 6B and 6C) or impacts of treatments on yield or average cluster weight (Tables 9A and 9B).
GRAPEVINE YIELD AND FRUIT COMPOSITION
Yield Component Analysis
The first year of yield data collection was performed for vintage 2022, which coincided with first year of production in this vineyard blocks as grapevines have become established. Data of the number of clusters per vine, the average cluster weight and yield per vine was collected near harvest. Data for fruit composition (Brix, pH, and titratable acidity) was also be collected in 2022 from cluster samples taken near harvest.
There was no significant impact of biochar or compost application separately or combined on clusters per vine, vine yield or average cluster weight the first harvest after application (Table 9A). Previous studies have reported either a positive yield response (Genesio et al., 2015) or no response (Garicia-Jaramilla et al., 2021) to application of biochar the first season after application. Genesio et. al. (2015) observed positive yield response caused by larger cluster size and not more clusters per vine and the positive yield response was observed for t four years after application of biochar, so there may be a possibility still of a positive yield response in this trial.
|
Table 9A. Effect of biochar and compost application on yield parameters for Cabernet Sauvignon during the first season (2022) after application. |
|||||
| Treatment | Cluster per vine |
Yield (kg per vine) |
Avg. Cluster weight (g) | Shoot number per vine | Clusters per shoot |
| Biochar + Compost | 39.4 | 4.98 | 126 |
19.5 |
2.06 |
| Biochar | 43.8 | 5.44 | 125 | 20.8 | 2.11 |
| Compost | 41.0 | 5.45 | 132 | 20.1 | 1.99 |
| Control | 40.6 | 5.25 | 131 | 21.8 | 2.01 |
| Biochar | ns | ns | ns | ns | ns |
| Compost | ns | ns | ns | ns | ns |
| Biochar x Compost | ns | ns | ns | ns | ns |
| Rep | ns | ns | ns | ns | ns |
The yield, average cluster weight, or clusters per shoot did not differ among biochar and compost treatments again in 2023 (Table 9B). The total number of clusters per vine, vine yield, and shoot number increased for all treatment in 2023 compared to 2022 as these recently planted vines were being fully established, as reflected in the increase in number of shoots per vine. The average cluster weights for all treatments were slightly lower in 2023 as well as the number of clusters per shoot declined in all treatments.
|
Table 9B. Effect of biochar and compost application on yield parameters for Cabernet Sauvignon during the second season (2023) after application. |
|||||
| Treatment | Cluster per vine |
Yield (kg per vine) |
Avg. Cluster weight (g) | Shoot number per vine | Clusters per shoot |
| Biochar + Compost | 62.7 | 7.02 | 112 |
34.1 |
1.67 |
| Biochar | 61.9 | 6.82 | 110 | 34.3 | 1.69 |
| Compost | 66.2 | 7.67 | 114 | 34.7 | 1.73 |
| Control | 68.6 | 7.94 | 116 | 37.4 | 1.70 |
| Biochar | ns | ns | ns | ns | ns |
| Compost | ns | ns | ns | ns | ns |
| Biochar x Compost | ns | ns | ns | ns | ns |
| Rep | ns | ns | ns | ns | ns |
Recent trials of biochar or compost applications in vineyards have either reported a yield response to application of either or both or no yield response whatsoever. For example, Garcia-Jaramillo et al (2021) reported no response in yield to applications of biochar at rates of 7 to 14 tons per acre in two Pinot noir vineyards located in Oregon. Similarly, Schmidt et al (2014) reported limited response of Pinot noir grapevines to applications of biochar or biochar + compost in Switzerland. On the other hand, Genesio et al (2015) reported significant increases of 15 to 60 % in yield in a dry-farmed Merlot vineyard in Italy from the second to the fifth year after application of biochar at rate of 10 or 20 tons per acre. The yield increases were attributed to an increase in average cluster weight and not to increase in number of clusters per vine. In a recent trial conducted in a Monterey County Pinot noir vineyard, where biochar and compost applications were done prior to planting vineyard (Sonoma Ecology Center, 2021), the authors reported yield increases associated with higher number of clusters per vine during the 3rd and 4th year after planting, not higher cluster weights. And, in the 5th year higher yields of Pinot were attributed to both higher cluster number per vine and higher cluster weight. There was no count of shoots per vine in the trial in Monterey, so the greater number of clusters per vine could have been the result of more shoots per vine left at pruning and not a greater number of clusters per shoot, which would indicate that these treatments did not affect shoot fertility (shoot fertility in this trial in Napa did not respond to treatments).
Fruit Composition at Harvest
Fruit ripening and composition was impacted primarily by the application of compost (Table 10A) and, to a lesser extent, by the application of biochar the first harvest after application. The fruit from control treatment had a significantly higher Brix (sugar content), lower pH, and low titratable acidity than the fruit from the plots with both biochar and compost. The high Brix of 26.7 in the control plot is indicative of overripe fruit, while the Brix levels between 24 and 25 are more indicative or ripe fruit, as sugar levels above 25 Brix to be primarily due to dehydration or berries and not sugar loading of berries.
|
Table 10A. Fruit composition of Cabernet Sauvignon at harvest (September 14, 2022) in response to biochar and compost applications. |
|||
| Treatment | Brix | pH | Titratable Acidity (g/L) |
| Biochar + Compost | 24.5 | 3.33 | 5.90 |
| Biochar | 25.6 | 3.36 | 5.90 |
| Compost | 25.2 | 3.38 | 5.93 |
| Control | 26.7 | 3.40 | 5.57 |
| Biochar | ns | ns | ns |
| Compost | p<0.05 | ns | ns |
| Biochar x Compost | ns | ns | ns |
| Rep | ns | ns | ns |
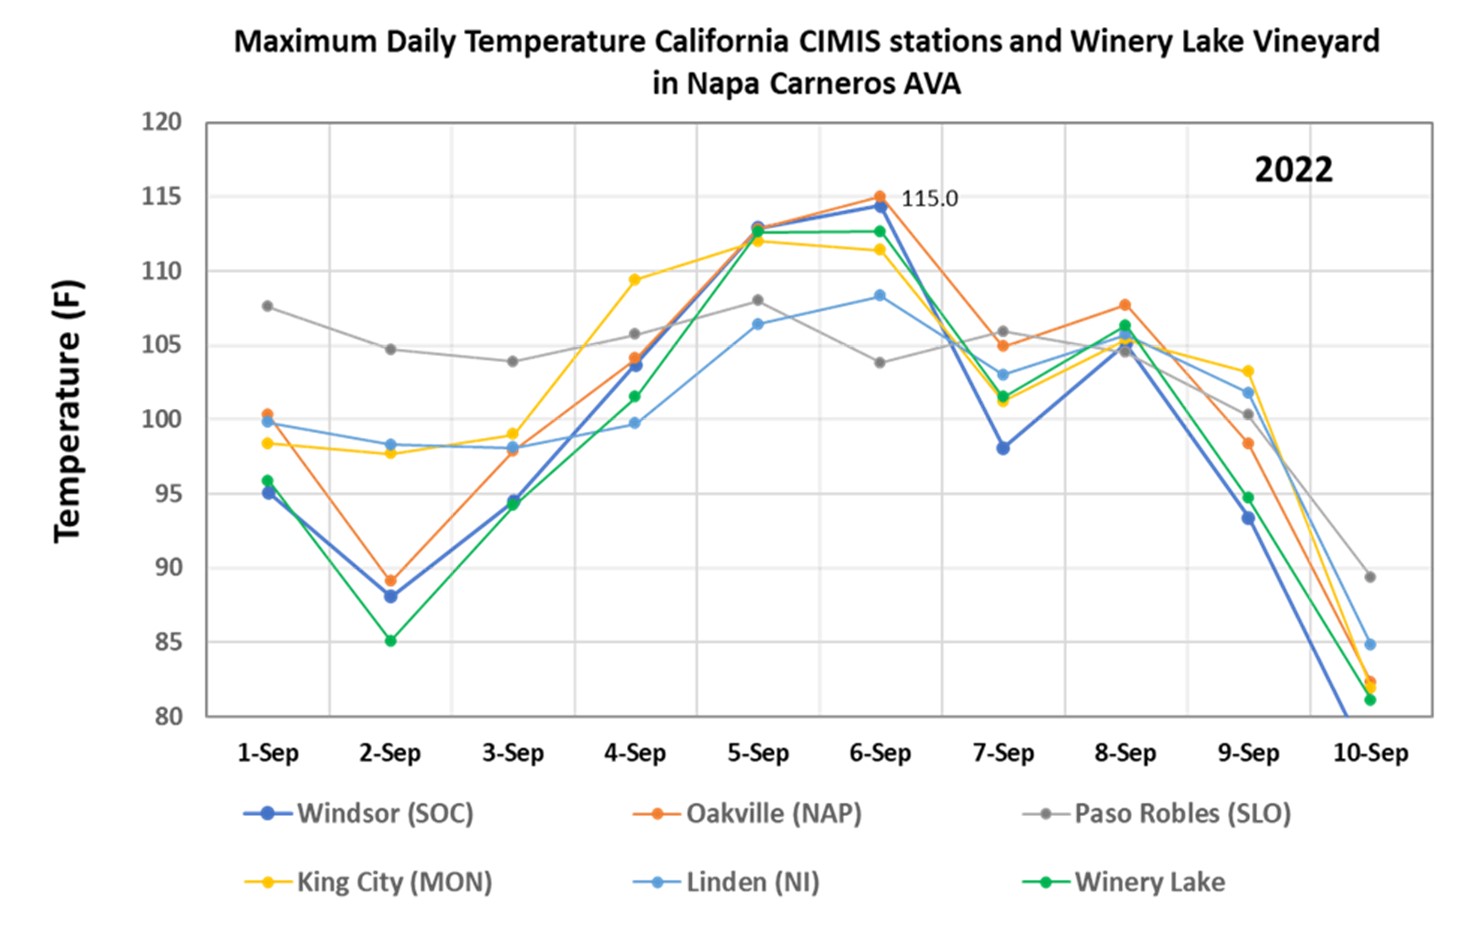
A significant heat wave occurred the week before the fruit maturity samples were collected. This heat wave, with maximum temperatures over 100F lasted 6 days at this site and the highest temperature recorded reached 119F. This heat wave hastened sugar accumulation in many vineyards in Napa and there were obvious signs of berry dehydration and excess sugar levels. The results from this trial indicate that fruit from control was more susceptible to dehydration and that applications of biochar and compost may provide resilience to extreme heat events.
Prior to the heat wave, the average Brix in this vineyard was 22.3 on September 1st. The heatwave had a general desiccating effect on fruit in the region, which concentrated sugar (Brix) levels in many vineyards. This effect was more pronounced in the Control treatment of this trial, while the application of compost and, to some extent, biochar appeared to have less dehydration of fruit and lower Brix. These results would suggest that vines treated with compost or biochar had better vine water status late in the season during this heatwave. Unfortunately, no vine water status measurements were collected at this time to confirm this hypothesis. In addition, even though the average cluster weight of Control treatment was lower than the average cluster weight from the biochar and compost treatments, the differences were not statistically significant. A lower maturity cluster weight would have indicated greater dehydration due to heat wave.
There were no prolonged, intense heatwaves in 2023 and fruit ripened much later in the season than in 2022. The harvest maturity sample was taken on October 20th (Table 10B), which was more than a month later than the sample collected on September 14, 2022. Ripening occurred much later in 2023 due to milder temperatures. There were no significant differences in Brix, juice pH or titratable acidity (TA) between treatments in 2023.
|
Table 10B. Fruit composition of Cabernet Sauvignon at harvest (October 20, 2023) in response to biochar and compost applications. |
|||
| Treatment | Brix | pH | Titratable Acidity (g/L) |
| Biochar + Compost | 24.3 | 3.20 | 5.38 |
| Biochar | 24.2 | 3.18 | 5.60 |
| Compost | 23.9 | 3.20 | 5.59 |
| Control | 24.5 | 3.18 | 5.52 |
| Biochar | ns | ns | ns |
| Compost | ns | ns | ns |
| Biochar x Compost | p<0.05 | ns | ns |
| Rep | ns | ns | ns |
ECONOMIC ANALYSIS OF BIOCHAR AND COMPOST APPLICATIONS
There are some economic obstacles to widespread use of biochar in agriculture (Bach et al. 2016) including the lack of a consistent yield response with the applied biochar, the elevated costs of biochar, and the lack of positive economic returns for many crops even with increases in yield (Filiberto and Gaunt, 2013).
Costs of Biochar and Compost Applications.
The actual cost per ton of the biochar used in this vineyard trial was $325.75 per ton and the total cost (material + labor) to apply the biochar was $3,406.93 per acre (Table 10). Previous economic evaluation of prior research on biochar applications (Filiberto and Gaunt, 2013) has reported that the average cost per ton for biochar to be $250 per ton, which is lower than the cost for this trial. The cost of the compost application at 20 tons per acre was $1,131, 38 per acre. The cost of biochar for this trial was at least 6 time higher than the cost of compost per ton. The total cost of the biochar application was three time the total cost of the compost application, yet the total amount of carbon added to soil was 19% higher with compost application (Table 2). And the total cost of the biochar plus compost application was $4,538.33 per acre (Table 11).
|
Table 11. Cost of Biochar and Compost Applications |
|||
|
|
Biochar |
Compost |
Biochar + Compost |
|
Material Costs ($/acre) |
3,325.92 |
1,025.98 |
4,351.89 |
|
Labor Costs ($/acre) |
81.03 |
105.41 |
186.43 |
|
Total Cost of Application ($/acre) |
3,406.94 |
1,131.38 |
4,538.33 |
|
Average Total Farming Costs Napa ($/acre/year) * |
11,871.00 |
11,871.00 |
11,871.00 |
|
Percent increase in Farming Costs |
29% |
10% |
38% |
|
* Kurtural et al (2020). Cost studies North Coast Vineyards |
|||
The University of California, Davis cooperative extension recently published cost study for farming Cabernet Sauvignon in Napa Valley in 2020 (Kurtural et al, 2020) and reported that the average annual total cash costs per acre is $ 11,871 per acre per year. The application costs of biochar in this trial would, therefore, increase total farming costs by 29% for one year, while the application of compost would increase farming costs by 10%, and the combined biochar + compost application would increase farming costs by 38% (Table 8). The onetime costs for soil amendments for vineyard redevelopment have been reported to be $870 per acre and the normal budgeted annual fertilization costs for North Coast vineyards is only $54 per acre per year (Kurtural et al 2020). The costs, therefore, of the treatments in this trial represent a much larger investment in vineyards than is normal for the region.
Break Even Analysis for Biochar and Compost Application
Even though the cost of biochar is high, especially compared to compost, the economic obstacles to adoption in wine grapes in Napa County should be much lower than the obstacles for other crops. Filiberto and Gaunt (2013) concluded that even with a sustained 10% yield increase of 10 years that the cost of biochar should be closer $70 per ton for an investment in biochar to break even for field crops such as corn, wheat, legumes, and vegetables, where annual gross revenue and net margins are small. Wine grapes are a high value crop compared to field crops and the economic obstacles to adoption are much lower. For example, a recent study with biochar applications in the Central Coast area of California (Sonoma Ecology, 2020) showed a positive return on investment after two years of production with biochar application costs at $2,000 per acre.
The breakeven analysis for this trial (Table 12) indicates that at the district average price of $7375.70 for Cabernet Sauvignon for vintage 2018 to 2020 that a yield increase of 0.46 tons (or 14% of average annual yield for Cabernet Sauvignon) is required in just one year to offset costs for biochar application; a yield increase of 0.15 tons (only 5% increase in average annual yield) for the compost application would be needed; and, a yield increase of 0.62 tons would be needed for the combined biochar and compost application to offset costs. The adoption of biochar use in North Coast vineyards will likely depend upon prices of grape, which is dependent upon county or region and variety. For example, the average price of Cabernet Sauvignon (the major red varietal in Napa County) from 2018 to 2020 was more than twice the average price of Chardonnay i (the major white varietal n Napa County) during the same period (Table 12) and an investment in biochar at 10 tons per acre would, therefore, require a onetime annual yield increase of 30 – 40% or 1.14 to 1.52 tons per acre to justify investment. Likewise, the price of Cabernet Sauvignon varies greatly between regions in the North Coast. In 2020 the weighted average return per ton according to the 2020 grape crop report (CDFA, 2021) was $1,750 per ton in Mendocino County, $1,588 per ton in Lake County, $2,460 per ton in Sonoma County, and $6,261 per ton in Napa County. Due to large differences in grape prices and potential return per acre, adoption of biochar in North Coast vineyard use will not only be in response to potential yield increases, but by local crop prices for each varietal.
|
Table 12. Break Even Analysis for Biochar and Compost Applications to Napa Cabernet Sauvignon and Chardonnay vineyards. |
|||
|
|
Biochar |
Compost |
Biochar + Compost |
|
Cost Amendment ($) |
3,406.94 |
1,131.38 |
4,538.33 |
|
Price Cabernet Sauvignon ($/ton) * |
7,375.70 |
7,375.70 |
7,375.70 |
|
Yield increase (tons) to offset investment |
0.46 |
0.15 |
0.62 |
|
Average 2018 to 2020 Yield Napa Cabernet Sauvignon (tons/acre) * |
3.25 |
3.25 |
3.25 |
|
Yield increase Cabernet Sauvignon (%) to offset investment |
14% |
5% |
19% |
|
Price Napa Chardonnay ($/ton) * |
2,993.70 |
2,993.70 |
2,993.70 |
|
Yield increase (tons) to offset investment |
1.14 |
0.38 |
1.52 |
|
Average 2018 to 2020 Yield Napa Chardonnay (tons/acre) * |
3.81 |
3.81 |
3.81 |
|
Yield increase Chardonnay (%) to offset investment |
30% |
10% |
40% |
|
* District average prices and yields for 2018 to 2020 vintages (Napa Crop Reports) |
|||
Economic return on investments in biochar and compost.
Due to lack a statistically significant impact of either biochar or compost the first harvest after application of these amendments separately or combined on grape yield, there was no return yet observed on initial investment. However, due to the impacts on fruit ripening observed in 2022, there is a possibility that biochar or compost application may have improved the suitability of potential fruit for higher valued wines. Since no wines were made to evaluate the effects on the treatments on wine quality in 2022, it would be impossible to determine if these treatments had an economic benefit related to improved fruit or wine quality.
CONCLUSIONS
The applications of biochar (10 tons per acre), compost (20 tons per acre) and a combined biochar and compost application (10 + 20 tons per acre, respectively had significant, although temporary, impact on several indices of soil health. The total carbon and organic matter of the soils were increased by the second year after applications to levels expected from amount of carbon applied with each treatment. However, the differences in soil C and organic matter observed in year 2 were not statistically different the third year of this study. Total soil N was not measurably increased by any of the amendments, even though 40 pound per acre of N was applied with biochar and more than 400 pounds were applied with compost application. The potentially mineralizable N was increased the year after application of compost, but not with biochar, while it was not different in soils from different treatment plots the last two and three years later. The ratio of carbon to nitrogen (C:N) was increased with the application of biochar, but not from compost. There were no observed differences in active (or permanganate oxidizable) carbon levels in the soil due to biochar or compost the first two years after applications were made, however in the third year the active carbon was significantly lower in biochar treatment plots. Likewise, the CO2-carbon respiration rates over 24-hour period were similar between treatment plots the first two year after biochar and compost application, while it was lower in the third year in plots with biochar applications. These two results indicate that the C in the soil in the biochar plots at the end of the study was less oxidizable or biologically active and therefore more stable. The wet aggregate stability of the soils from biochar treatment was improved during the second and third years of this study, however when the vineyard row management was changed from till to no-till between second and third year after application, the wet aggregate stability increased dramatically for all treatments, including control, and any differences due to biochar application were not erased.
The application of either biochar or compost separately or together did not have any impact on vine macronutrient levels during the trial and only had a temporary impact on foliar Zn levels the year after application. There was no evidence of increased macronutrient nutrient uptake during this trial, even with large amounts of NPK applied with compost treatments. Vine water status measured early in season (before veraison) or later in season (after veraison) did not show any significant response to biochar or compost application. Improvements in nutrient and water retention in the soils with application of biochar were expected (Chan et al, 2007, Lone et al, 2015). The lack of a physiological response in terms of nutrient or vine water status indicates that the biochar and compost applications in this trial did not improve nutrient or water retention appreciably.
Vine vegetative growth (measured by pruning weights) and vine yield were not impacted by either biochar or compost application the first two years after applications. Given the lack of a biochar or compost impact on vine nutrient or water status, the lack of response in terms of vine growth and yield were to be expected. There were no observed increases in cluster weights due to treatments, which has been shown to be primary contributor to increase yields in grapevines with biochar application (Genesio et al, 2012) when they have been observed. There was also no increase in cluster per shoot (fertility) either in this study, which may be altered by nutrient uptake or vine water status differences during prior season during bud development. An increase in grapevine yield attributable to a biochar or compost application would be the result of either a cluster weight increase or improved shoot fertility, or both, which did not occur in this trial.
A yield response in vineyards to biochar or compost applications may be dependent upon initial soil carbon and organic matter levels. Reports of increase yield in vineyards with biochar application (Genesio et al, 2015, Sonoma Ecology Center, 2021) have occurred when the initial soil carbon levels were low, and soil organic matter content are less the 1.0%. Similarly, yield responses of grapevines have been observed to compost application when soil C was less than 1.0% (Wilson et al, 2021). In contrast, no yield response was observed from biochar application in two vineyards in Oregon when soil carbon was greater than 1.0% (estimated soil organic matter was greater than 2.0%). The initial soil C in this trial was higher than 1.0%, much higher than that from previous trials where yield responses were observed and like the soil C levels from trials in Oregon. The soil C level in this vineyard is on the low side for vineyards in this area, where values of 1.5 to 2.0 percent are common. The lack of a yield response in this trial, where soil C was low for the area, would suggest that yield responses to biochar or compost applications are less likely to occur here than in areas, where soil C is very low.
There was no economic benefit demonstrated with an application of biochar or compost in this trial. Due to high cost of biochar, there is a large barrier to use, even when the crop margin for Cabernet Sauvignon vineyards is much higher than for a crop like corn, where low margins have been shown to be a large barrier for adoption of biochar use even with an annual yield increase of 10% (Filiberto and Gaunt, 2013). There may be some benefits to application of compost or biochar in terms of resiliency to heat stress and its effects on fruit composition and quality. There was some indirect evidence that fruit from the compost, and to a lesser extent, biochar application plots were more resilient to heat stress during late season heat spell in 2022. The fruit sugar (Brix) levels were lower in compost and biochar treatments than control and level the sugar level of control indicated a fair amount of desiccation of berries had occurred in that treatment and not the others. The quality of the fruit may have been negatively impacted by the heat, but it was not possible to confirm or quantify any quality impacts of the heat stress.
SARE final report literature review
Research outcomes
Education and Outreach
Participation summary:
The first-year results were presented at the annual meeting of the American Society of Enology and Viticulture held in Napa, California in June, 2023. The event was attended by more than 200 people from wine industry.
ASEV 2023 Poster Biochar - final
Results from the trial were presented at Napa Green Climate Smart Burn and Alternatives Field Demonstration Day on March 19, 2024 at Gloria Ferrer Winery Vineyards. The link below to the event.
Conservation burn – Napa Green
The event was attended by 40 people. This handout was shared with participants.
twe-bv2-biochar-presentation-2023