Final Report for GNC08-092
Project Information
One of the biggest challenges to rangeland monitoring is finding a cost and time effective method to monitor millions of acres. Traditionally, field monitoring methods have taken large amounts of time, skill, and labor. North Dakota State University was approached independently by three grazing associations (Grand River, McKenzie and Medora) that are comprised of members from Montana, North Dakota and South Dakota to conduct unbiased, third party range monitoring on the Dakota Prairie National Grasslands. We worked with the grazing associations and their associated Forest Service ranger districts to provide data collected both on-the-ground and by aerial imagery. This rancher-initiated project seeks to reduce the costs and time associated with range monitoring by using very large scale aerial (VLSA) imagery. This true color, digital photography has a ground sample distance (GSD) of ?1mm (similar to resolution). VLSA imagery will be analyzed for species composition, bare ground, and biomass production and compared to data collected on the ground. R2coefficients were determined to predict the accuracy of VLSA imagery compared to traditional field monitoring methods.
Introduction:
Historically, rangeland monitoring has been accomplished by the use of trained rangeland professionals. Typically, measurements taken would reflect some measure of canopy cover, bare ground, production, and species composition. While the first three tasks can be successfully accomplished with a moderate amount of training, species composition requires an extensive knowledge of plant identification. Quality rangeland monitoring is extremely difficult over large tracts of land (Sanders 1999). The cost of labor has increased dramatically over the years. In a study by Pellent et al. (1999), the authors found that it cost $893 to sample a 0.16 ha (0.4 acre) plot. Current recommendations for monitoring sites on the Northern Great Plains prairie are five plots per half section (320 acres) as recommended by North Dakota State University (Sedivec pers. comm).
For many years, range and other natural resource professionals have tried various means to acquire remotely sensed imagery. One of the more common methods to acquire imagery is by satellite. In recent years, technology has advanced giving the NASA Landsat satellites a resolution of 15 meters. Although 15 meter imagery works well in many systems, particularly at a landscape level, it proves too coarse for rhizomatous grasslands ecosystems (Muldavin et al. 2001). Private companies such as GeoEye’s IKONOS Quickbird, the European SPOT system, and others have capitalized on the fine resolution image market with imagery nearing the 1 meter mark. Other creative works have been experimented using media such as blimps (Murden and Reisenhoover 2000), radio controlled airplanes (Thome and Thome 2000) and kites (Aber et al. 1999). The very large scale aerial (VLSA) imagery technique uses an ultralight-type aircraft to acquire digital photographs. VLSA imagery has been successfully used to monitor areas of interest in the sagebrush steppe (Seefeldt and Booth 2006), western riparian areas (Booth et al. 2006), short grass prairie (Booth and Cox 2006) and invasive species identification (Booth pers. comm.). The aerial photography technique has the potential to reduce costs of monitoring by reducing time spent in the field. VLSA imagery also allows for systematic sampling that better reflects the landscape, and captures all plots at the same phenologic stage.
Short Term: 1) Increase ranchers’ awareness of vegetative communities on their grazing allotments. 2) Decrease perceived tensions between Forest Service and McKenzie, Medora and Grand River Grazing Associations.
Intermediate Term: 1) Change the basis upon which ranchers make management decisions. 2) Influence the ways in which the Forest Service uses vegetative data to develop policies.
Anticipated Long Term: 1) Facilitate improved conditions to grazing pastures leading to healthier ecological communities and more sustainable conditions for ranching families.
Cooperators
Research
Ground: Plots were selected using ArcGIS. Only lands owned by the US Forest Service were considered. Ecological sites for each pasture (the smallest divisible management unit) were determined for each ranger district under consideration. Fences, roads, and trails were given a 50 meter buffer, water sources were given a 200 m buffer, and buffered areas were removed from consideration. The dominant two ecological sites were determined for each pasture. West-east flight lines that were 1 000 meters apart and had photo stations every 500 m were overlaid on the ecological sites and ground plots were randomly selected from photo stations in the two dominant ecological sites. A minimum of three plots per ecological site (six per pasture) were located. Additional plots were located as acreage of pastures increased beyond 260 ha.
Crews navigated to pre-located ground plots using a GPS unit between 01 June and 30 September. 150 x 150 m transects were laid out on the cardinal directions bisecting at 75 m (Figure 1). Plant community composition was measured by percent frequency (collected as binomial data) using a 0.1 m2; quadrat frame for graminoids (grasses and grass-likes; Figure 2) and by density using a 0.25 m2; frame for forbs and shrubs (Figure 3). Composition was measured every 10 m for a total of 30 readings per plot. Basal cover was measured using a point quadrat, sometimes called a 10-pin frame (Figure 4). Basal cover was measured every 5 m for a total of 600 “hits” per plot.
Aerial: True color, digital, very large scale aerial images were collected between 15 July and 01 August. These dates were selected to maximize the likelihood that the cool season graminoids would have inflorescence and the warm season graminoids would have enough growth to be identifiable in the imagery. Images were acquired by a light sport aircraft at approximately 100 m above ground level (AGL) and 23.5 m•s-1 average ground speed (Figure 5). A 16.7–megapixel Canon EOS 1DS Mark II (Canon USA, Lake Success, NY; 4 992 x 3 328 pixels) was configured with an 840-mm focal-length lens that captured images with an average GSD of 0.92 mm and a 12 m² field of view (FOV). Aerial images were approximately matched to macroplot locations (about 10 images per plot), but due to aircraft motion, differences in preplanned photo locations and actual locations may have been as large as 49.01 m (Moffet 2009).
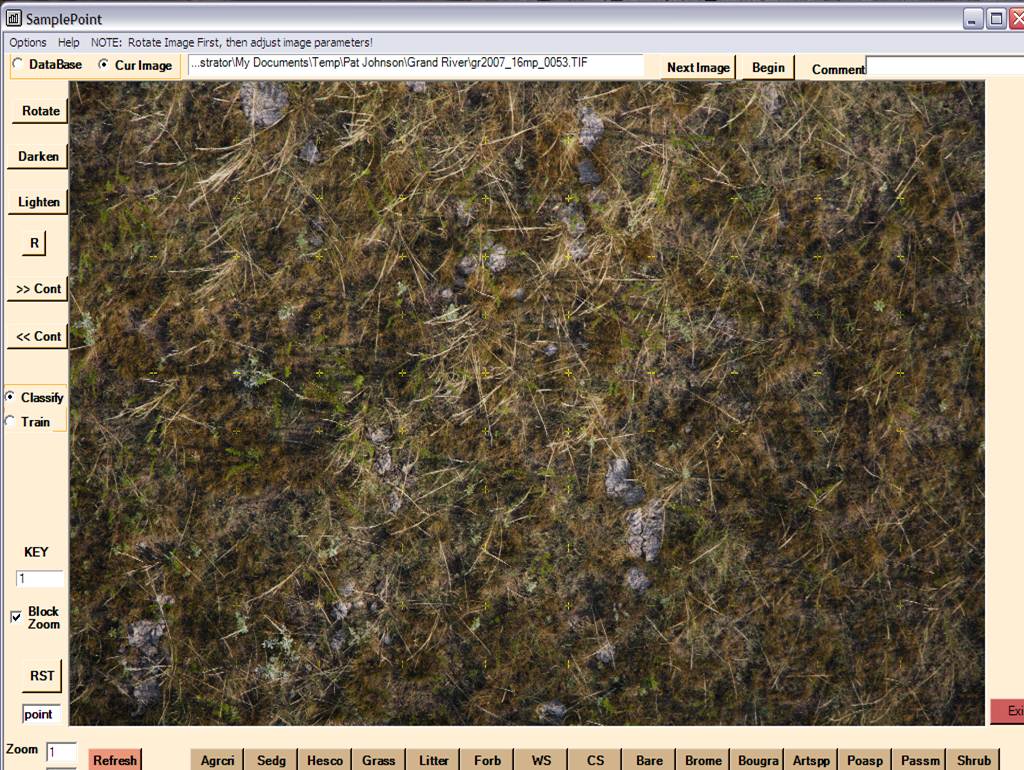
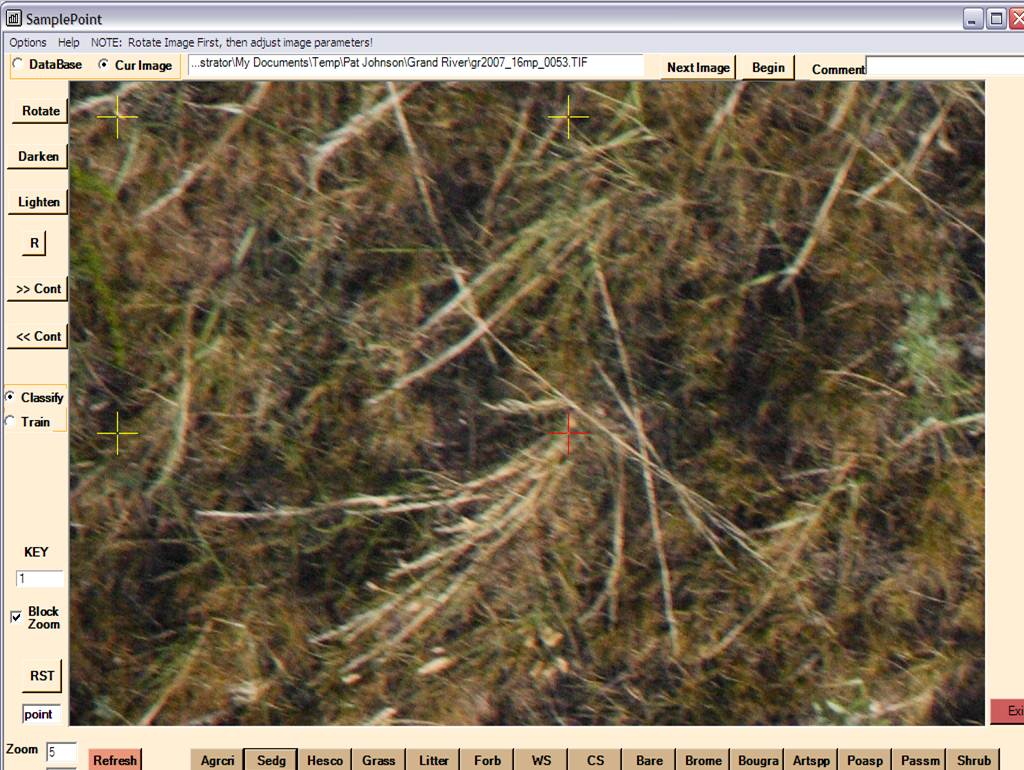
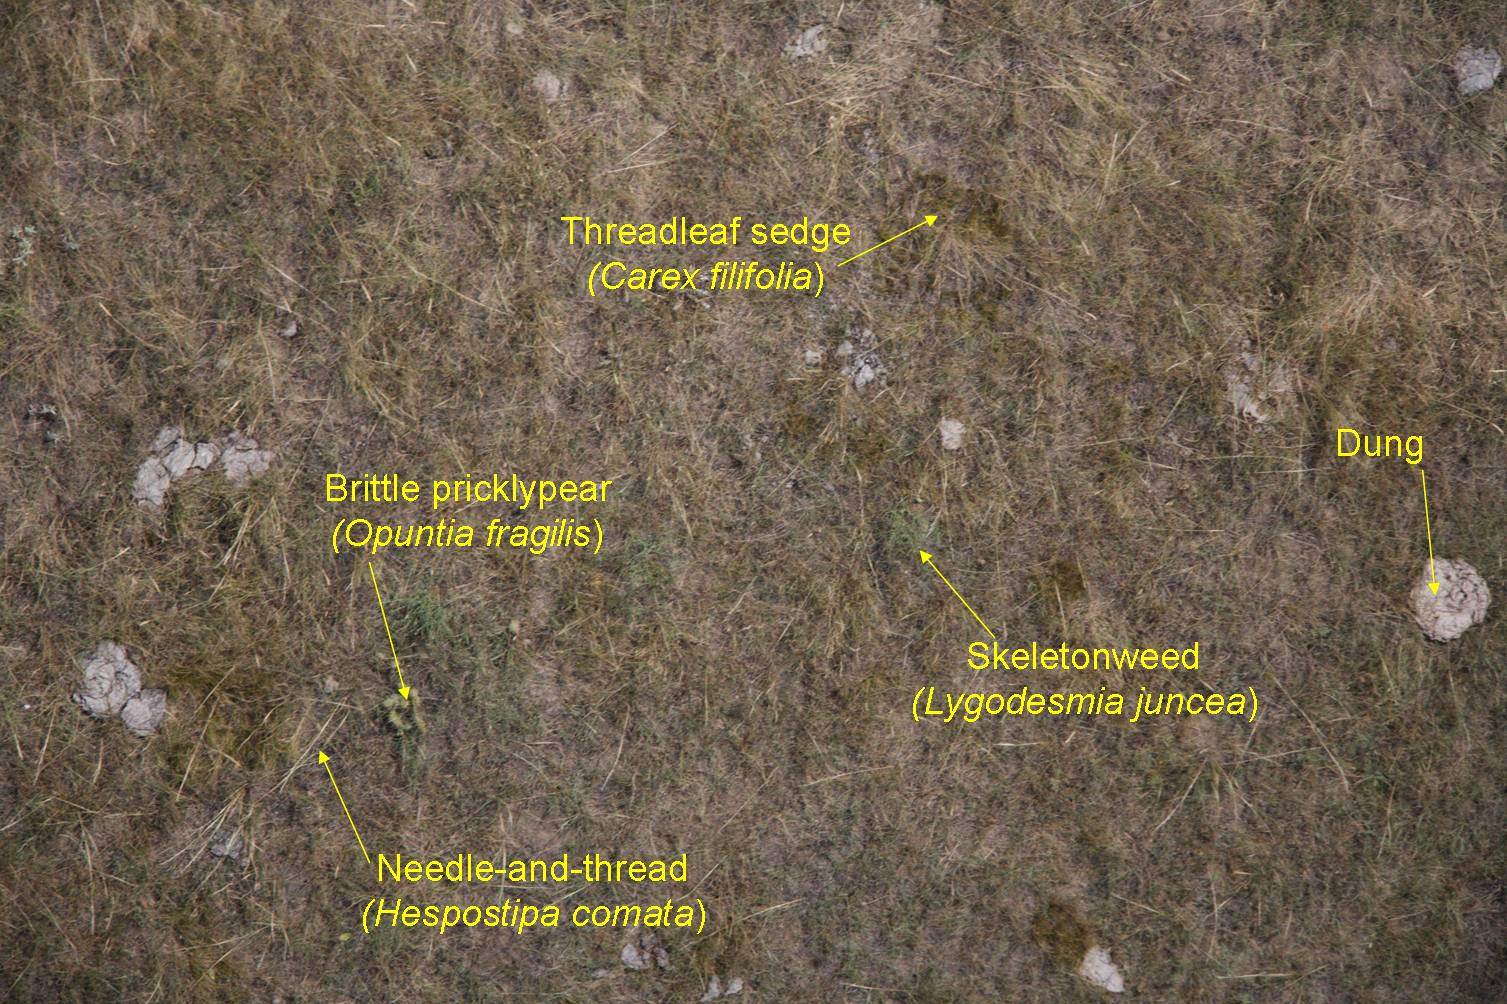
Data Analysis: Aerial imagery was analyzed using the software program “SamplePoint” (Figure 6). Sample point overlays a systematic grid of 100 crosshairs over the image and the user classifies the pixel at the center of the crosshairs into a pre-defined category (Figure 7). Previous research has focused on using “SamplePoint” to determine cover type (e.g., grass, forb, shrub), however, since we were interested in species composition (e.g., western wheatgrass, blue grama), we used species that we felt were abundant and ones that had easily identifiable characteristics.
Ground-based data sets were averaged for each ground cover class for macroplots. Graminoids were reported in percent frequency (average presence/absence per 30 frames in the macroplot), forbs and shrubs reported as density (average density [stems/unit area] per 30 frames in the macroplot) and litter, bare ground, and live plant basal cover reported as relative density (number of “hits” of species A/600 possible hits per macroplot). Results from analysis of aerial imagery were reported as relative density (number of “hits” of species A/[approximately] 1 000 “hits” possible per macroplot; 100 “hits” per image and 10 images per macroplot). Some classes (crested wheatgrass, blue grama, needle and thread, and western wheatgrass) were run comparing both the percent frequency and basal cover to the aerial imagery analysis. These four additions resulted in the total number of ground cover classes being increased to 19 (Table 1). Simple linear regressions and Analysis of Variance (ANOVAs) were applied to each ground cover class using the ground-based method as the dependent variable and the VLSA imagery analysis as the independent variable using SAS 9.1 (SAS Institute, Version 9.1, Cary, NC, USA).
Of the 15 ground cover classes, simple linear regressions were applied to five classes (crested wheatgrass, blue grama, needle and thread, sedge species, and western wheatgrass) for both percent frequency and basal cover against the VLSA imagery analysis. Two transformations, an arc sine and a natural logarithmic, were performed and data were re-analyzed using both transformations independently. Neither transformation improved the R2 values more than the raw data, so all results are based on raw data analysis.
- Figure 3. Amanda Gearhart, Graduate Student, North Dakota State University, uses a 0.25 m2 frame to collect forb and shrub density in Little Missouri National Grasslands.
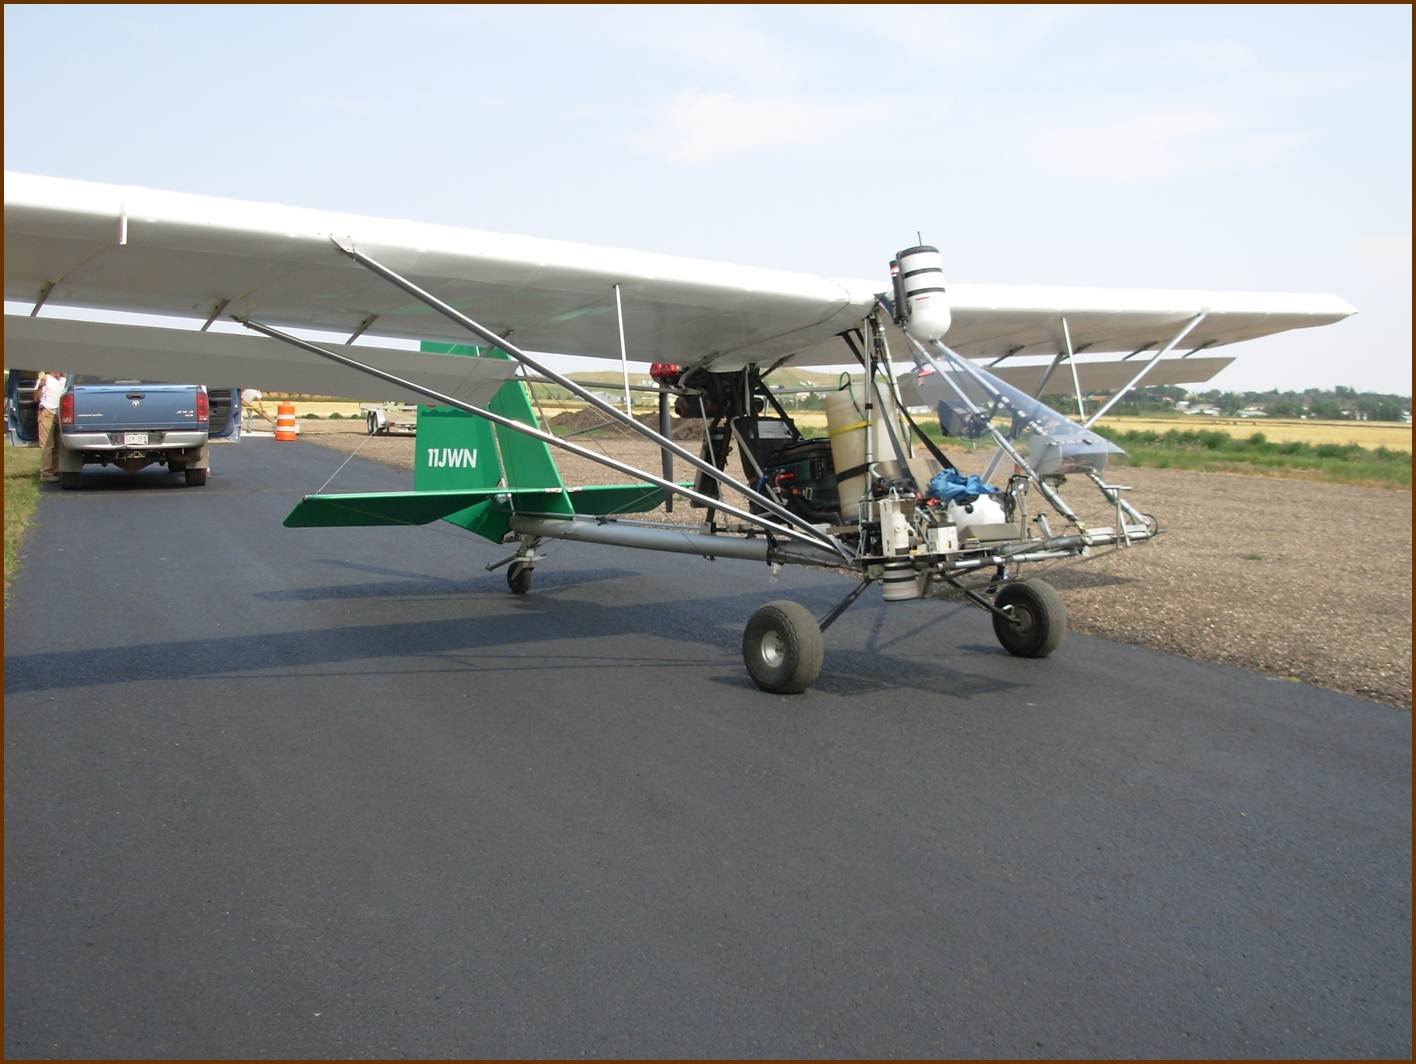
- Figure 5. Moyes-Bailey Dragonfly light sport aircraft which captured 0.92 mm GSD imagery.
- Figure 6. “SamplePoint” software that was used to analyze imagery. “SamplePoint” overlays a systematic grid of 100 cross hairs on the image and the user classifies the center pixel of the crosshair into a defined category (such as western wheatgrass). “SamplePoint” software is available free of charge at: http://www.ars.usda.gov/services/software/download.htm?softwareid=295
- Figure 7. “SamplePoint” allows users to classify images into user-defined categories and automatically writes the user’s selection to an Excel file.
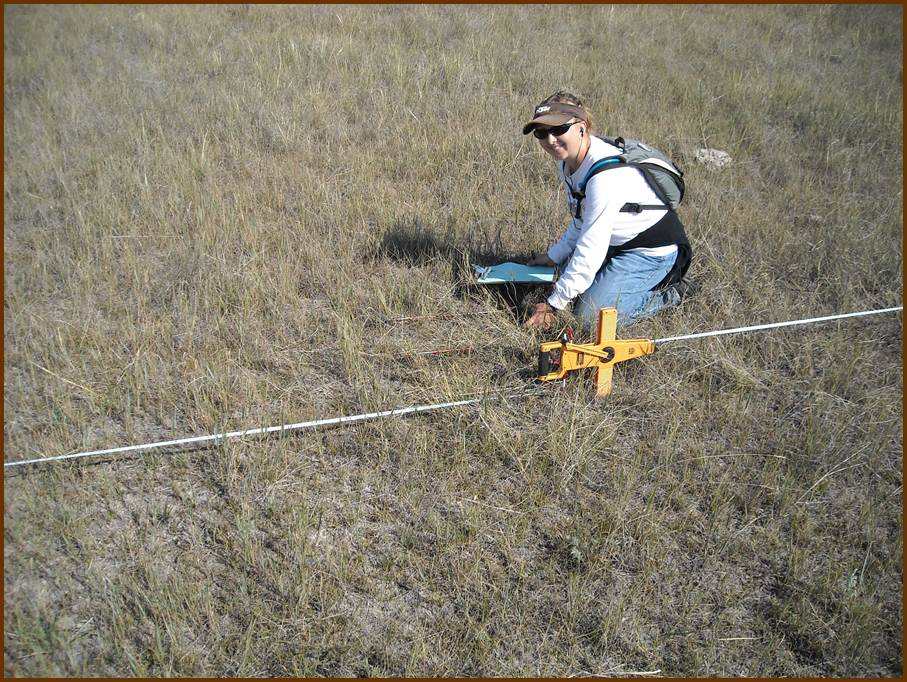
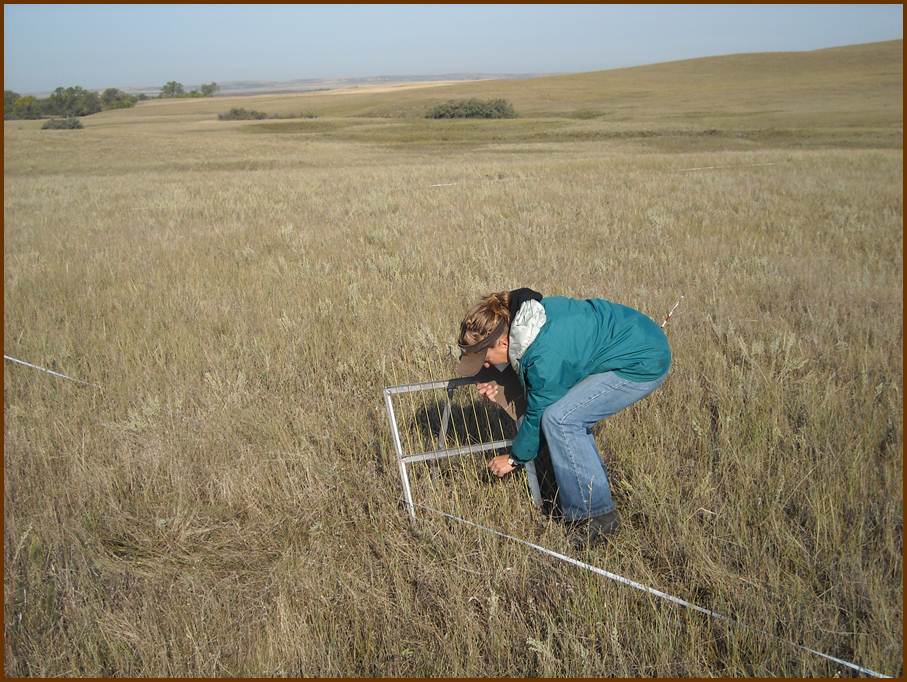
- Figure 2. Dennis Whitted, Research Specialist, North Dakota State University, collects presence/absence (percent frequency, density) measurements using a nested 0.1 m2 quadrat frame in the Little Missouri National Grasslands.
- Table 1. Field data collection methods of ground cover classes. Graminoids were collected as percent frequency (presence/absence) in 30 0.1 m² quadrat frames per macroplot, forbs and shrubs were collected as a density measurement (stems/unit area) in 30 0.25 m² quadrat frames per macroplot, basal cover was collected with a modified point quadrat (10-pin frame) at 60 predetermined points per macroplot. *Denotes a ground cover class measured using the “SamplePoint” software program (using foliar cover).
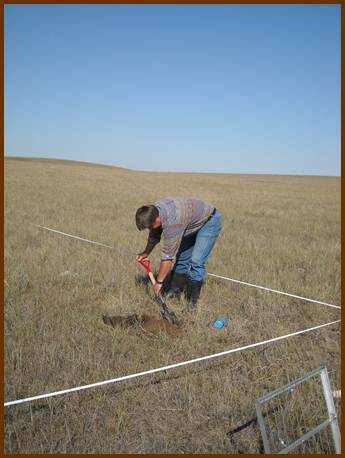
- Figure 4. Amanda Gearhart, graduate student, North Dakota State University, collects basal cover data in the Little Missouri National Grasslands using a point frame.
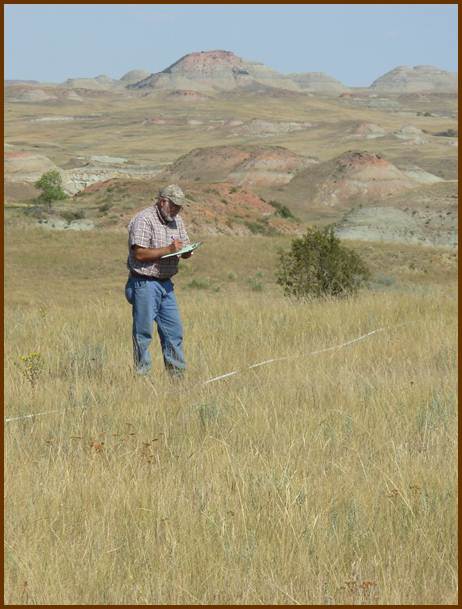
- Figure 1. Dr. Kevin Sedivec, Extension Rangeland Specialist, North Dakota State University digs a soil pit to verify ecological site on the ground plots in Little Missouri National Grasslands.
Results
Percent frequency: Of those ground cover classes analyzed using regression for percent frequency against the VLSA imagery analysis, four (brome species, other native cool season grasses, other native warm season grasses, and bluegrass species) were not significant (P ? 0.05). The other five ground cover classes (crested wheatgrass, blue grama, needle and thread, sedge species, and western wheatgrass) were all significant (P ? 0.05) and had r2 values ranging from 0.17 (western wheatgrass) to 0.84 (crested wheatgrass; Table 2).
Our research suggests that VLSA imagery is not suitable to predict most ground cover classes for percent frequency. Crested wheatgrass had the highest coefficient of determination. There are several reasons for this. First, crested wheatgrass is often found in monoculture plantings dating from the 1930s in the GRNG. There is a high degree of spatial autocorrelation in these plantings. Second, crested wheatgrass has a distinct inflorescence which makes it easily identifiable. Additionally, most plants exhibit a high portion of a plant that produces a reproductive culm making the individual plants readily identifiable.
Discussion
Sedge species had a moderately high value for the coefficient of determination. The most common sedge species in GRNG is threadleaf sedge which has distinct yellow-green colored leaves and elevated rusty red roots. Additionally, threadleaf sedge tends to grow in clumps or tufts. The coloration and growth pattern tend to make sedge species relatively distinct on imagery.
Western wheatgrass, blue grama, and needle and thread all have very similar coefficient of determination values. Non-significant ground cover variables include brome species, bluegrass species, other native cool season grasses, and other native warm season grasses. Brome species and bluegrass species both include at least one major invasive species that threatens the integrity of ecosystems. Smooth brome (Bromus inermis Leyss B.) and Kentucky bluegrass (Poa pratensis L.) will readily invade healthy rangeland communities making them a threat to these communities. Additionally, they are major drivers in the state and transition models of the northern mixed prairie.
Density: Four ground cover classes (annual forbs, perennial forbs, sage forbs and half-shrubs, and shrubs) were analyzed using regression for density against the VLSA imagery analysis. Only the sage forbs and half-shrubs class were significant (P ? 0.05) and had an r2 value of 0.09.
Of the four density measurements (annual forbs, perennial forbs, sage forbs and half-shrubs, and shrubs), only sage forbs and half-shrubs were significant. The lack of significance for the other three classes is likely due to the multilayer canopy obscuring the smaller forbs that occur in abundance close to the ground (Hanson 1934). There are few shrubs that occur with any abundance in GRNG (Hansen 2008) and when they do occur, it is usually in highly interspersed, small clumps (western snowberry) or individual stems (prairie rose and silver sagebrush). These growth patterns make them very difficult to detect using a crosshair pixel-based grid such as the one used by SamplePoint.
The sage forbs and half-shrubs tend to occur with a little more abundance and are more spatially autocorrelated. Additionally, this ground cover class plays an important role as drivers between phases in some state-and-transition models. Although they were detected on the aerial images, there is a high degree of variability of the images being used to predict their density on the ground.
Basal cover: All seven ground cover classes (bare ground, litter, crested wheatgrass, blue grama, needle and thread, sedge species, and western wheatgrass) analyzed using regression for basal cover against VLSA imagery analysis were significant (P ? 0.05) and had r2 values ranging from 0.1 (litter, bare ground, western wheatgrass) to 0.57 (crested wheatgrass).
All seven of the ground cover classes tested for regressing basal cover against aerial imagery analysis were significant. Although Hanson (1934) and Whitman and Siggeirsson (1954) argued that basal cover does not predict canopy cover, it would appear that canopy cover of certain species (crested wheatgrass, blue grama, needle and thread, sedge species, and western wheatgrass) can be used to make approximate estimates of basal cover. Whitman and Siggeirsson (1954) found that basal cover does not accurately measure single stemmed plants, such as western wheatgrass, and that other methods would need to be used in tandem with the point quadrat to obtain an accurate measure. The species tested in this analysis are by no means comprehensive, but rather indicators of community composition and ecological health. There is a high amount of variation in the coefficients of determination. The variability makes it difficult to recommend using VLSA imagery in place of ground-based monitoring methods.
Educational & Outreach Activities
Participation summary:
The results of the research have been presented in numerous outlets, designed to reach a wide variety of audiences. The research was presented as a PowerPoint presentation at the 2009 Hettinger Research Extension Center Beef Day which had an attendance of approximately 50 people (about half were ranchers), at each of the Grazing Associations annual meetings (approximately 200 ranchers total), as a range seminar at North Dakota State University (attended by about 40 people, and recorded for display on the web), at the 2009 Society for Range Management Annual Meeting (seminar attended by about 75 people). A video is currently being made and will be available in February 2012 on the Hettinger Research Extension Center website: http://www.ag.ndsu.edu/HettingerREC/. This research has been published in Amanda Gearhart’s doctoral dissertation, and the manuscript will soon be submitted to the journal Rangeland Ecology and Management.
Project Outcomes
VLSA imagery has been used successfully in other ecosystems to identify general plant growth forms (Booth and Cox 2006; Seefeldt and Booth 2006; Booth and Cox 2008; Sankey et al. 2008). However, in the northern mixed prairie, VLSA may be of limited use. VLSA worked reasonably well to identify crested wheatgrass, which is a major management concern in the GRNG. The major focus of many monitoring projects in this area is determining the state and phase that a particular area or vegetative community is in. Without being able to accurately and reliably distinguish the dominant graminoids in a community that define the states and phases within the model, this monitoring method would have limited use (Figure 8).
VLSA imagery analyzed using SamplePoint has been very useful in other ecosystems (Booth and Cox 2008). However, the authors in that study were comparing the analysis from SamplePoint to line point intercept data obtained on the ground. We acknowledge that results may have been different if we had compared VLSA imagery to canopy line point intercept values. However, in the northern mixed prairie, use of any type of canopy measurement for long-term monitoring studies is not recommended due to the high natural variation between years (Sarvis 1920; Hanson 1934). If the imagery in this study were analyzed using a different method, one that was more similar to the ground-based methods used in the northern mixed-grass prairie, better predictions may be possible. Ultimately, it is up to managers to decide if that much variability is acceptable.
**NOTE: As of 2011, a subset of the imagery is being re-analyzed for limited variables (graminoids only) using a beta version of a new imagery analysis program designed to more closely approximate the percent frequency method used in the field.
Short term outcomes: Additionally, each grazing association received a summarized report of the ground monitoring that took place in their ranger district. When the reports were presented at the annual meetings, the state range extension specialist was available to explain the format of the results and provide interpretation. Rancher feedback indicated that having the state range extension specialist available to answer questions was crucial for maintaining rancher buy-in. As a direct result of the ground monitoring portion of this study, most ranchers agreed that the reports greatly increased their knowledge of the specific vegetative communities on the allotments. Ranchers also requested that a field demonstration be held, and although not directly supported by this grant, a field demonstration was held the next field season. In addition, all ranchers were encouraged to join field crews when they had time (and a few did). Many ranchers also agreed the ground monitoring reports helped to decrease some of the tension between the Forest Service and Grazing Associations.
Intermediate outcomes: The ground data collected were also presented to the Forest Service in the same summarized report that the ranchers received. Already they are using the information in the report to make more informed decisions about land management. The information from the reports is being incorporated into the new allotment management plans.
Long term outcomes: It is too soon to know if we have positively influenced the health of the land, but based on the increased awareness of ranchers, it would appear that there is strong likelihood of moving in the direction of better health of the land.
Economic Analysis
VLSA imagery has the potential to dramatically reduce the need for ground monitoring, although not replace it completely. Each image cost approximately $9 to collect for a total of $90 (10 images) per plot. Pellent et al. (1999) estimated the cost per plot at $893 and that crews could complete two plots per day. If one assumes a field season commences 1 June and ends 31 August with crews working five days a week, a single crew could presumably collect data for 130 plots for a total cost of ($893/plot x 130 plots) $116,090. For that same 130 plots, plus additional systematic sampling, VLSA imagery would incur a total cost of ($90 x 130) $11,700. The cost savings of using VLSA imagery would be $104 390. An additional advantage of VLSA imagery is the permanent record of the plots recorded in the imagery. If the cost savings were repeated for each of the three ranger districts in the study area, the total saved using VLSA imagery is well over $300,000.
Farmer Adoption
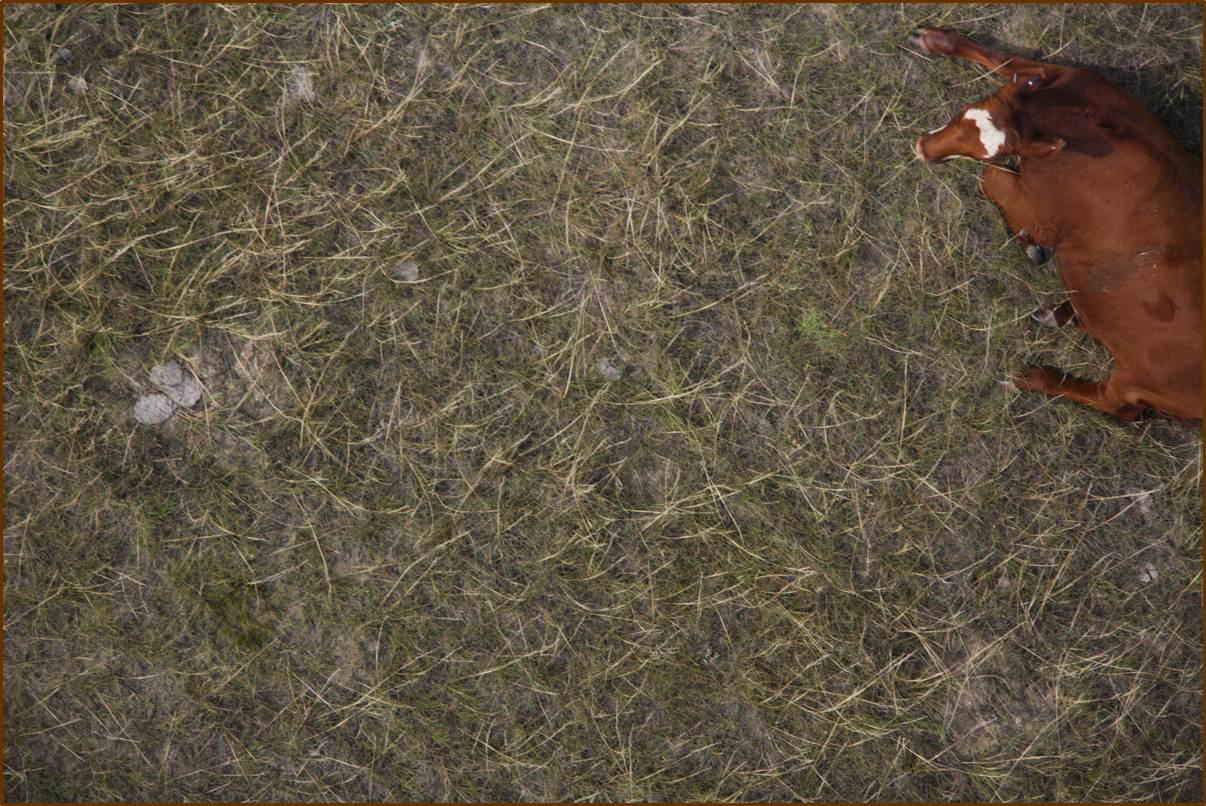
One of the advantages of using VLSA imagery is the simplicity of the method, however, it is not likely that many ranchers will rush out to adopt this technology right away. Most ranchers will use the ground based monitoring data immediately. One range consultant/ rancher has been using VLSA imagery for monitoring ranches, and he is very successful, however, he is the only one we are aware of. As the analysis process is researched and becomes more polished, it is feasible that imagery can complement the expensive ground-based monitoring. All ranchers who have viewed the imagery have been amazed at the clarity and the resolution. One rancher even recognized his cow in an image because the image was so clear (Figure 9)! As the old adage goes, “a picture is worth a thousand words.”
Areas needing additional study
Although the results of this study were not particularly encouraging, it is important to keep in mind that this technology is new and evolving. One of the advantages of the technology is that there is now a permanent record captured in the form of the digital images. As new analysis methods are developed, it will be very simple to re-analyze the imagery. Only the results of the imagery analysis using “SamplePoint” are presented here, however, it is feasible that a different way of analyzing the imagery would improve the results. Additionally, as technology improves, it may be possible to add an infrared band to the spectral mix. This band may allow researchers to pick out color nuances that are difficult to see with the naked eye.
As stated earlier, a subset of the imagery was re-analyzed using a method comparable to the percent frequency used on the ground for just graminoid (grasses and grass-likes) species and statistics are currently being run.